1 MARLAP SCIENCE ADVISORY BOARD CHAPTERS 6 & 7 Stan Morton DOE-RESL April 2002

Welcome message from author
This document is posted to help you gain knowledge. Please leave a comment to let me know what you think about it! Share it to your friends and learn new things together.
Transcript

1
MARLAPSCIENCE ADVISORY BOARD
CHAPTERS 6 & 7
Stan Morton
DOE-RESL
April 2002

2
Multi-Agency Radiation Laboratory Protocols Manual
Purpose:Provide guidance and a framework for project planners, managers, and laboratory personnel to ensure that radioanalytical laboratory data will meet a project’s or program’s data requirements and needs.
3
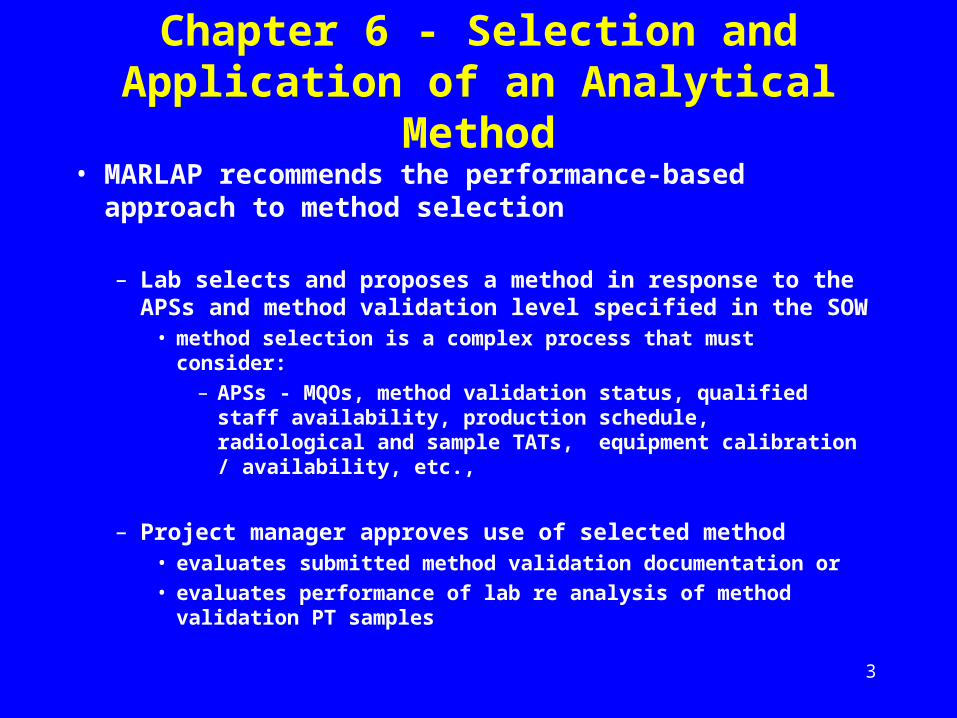
Chapter 6 - Selection and Application of an Analytical Method
• MARLAP recommends the performance-based approach to method selection
– Lab selects and proposes a method in response to the APSs and method validation level specified in the SOW
• method selection is a complex process that must consider:
– APSs - MQOs, method validation status, qualified staff availability, production schedule, radiological and sample TATs, equipment calibration / availability, etc.,
– Project manager approves use of selected method• evaluates submitted method validation documentation or
• evaluates performance of lab re analysis of method validation PT samples
4
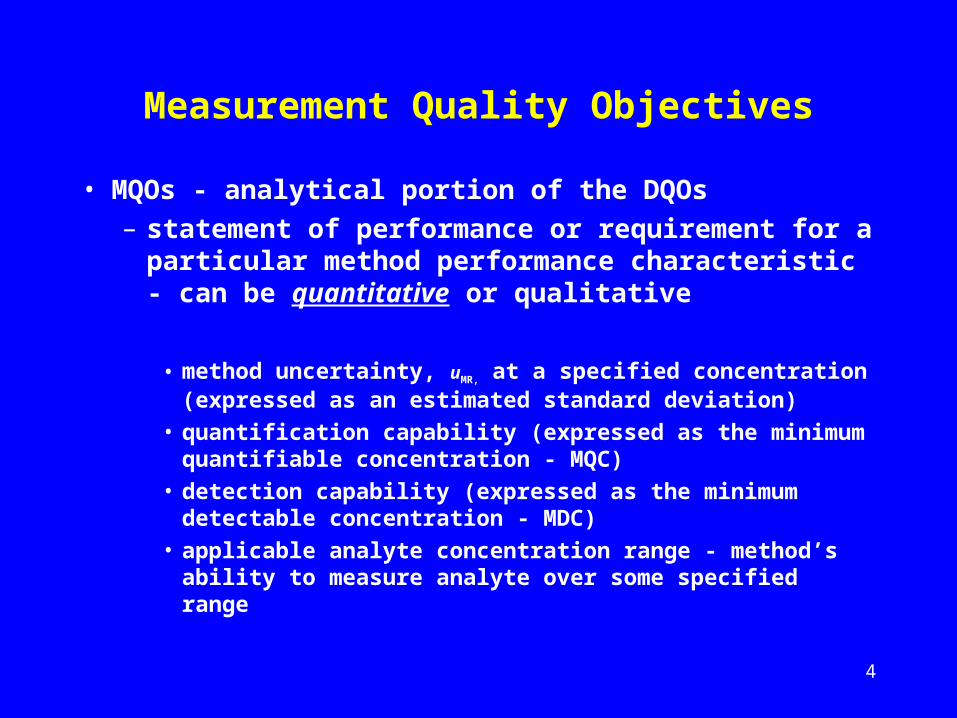
Measurement Quality Objectives
• MQOs - analytical portion of the DQOs
– statement of performance or requirement for a particular method performance characteristic - can be quantitative or qualitative
• method uncertainty, uMR, at a specified concentration (expressed as an estimated standard deviation)
• quantification capability (expressed as the minimum quantifiable concentration - MQC)
• detection capability (expressed as the minimum detectable concentration - MDC)
• applicable analyte concentration range - method’s ability to measure analyte over some specified range
5
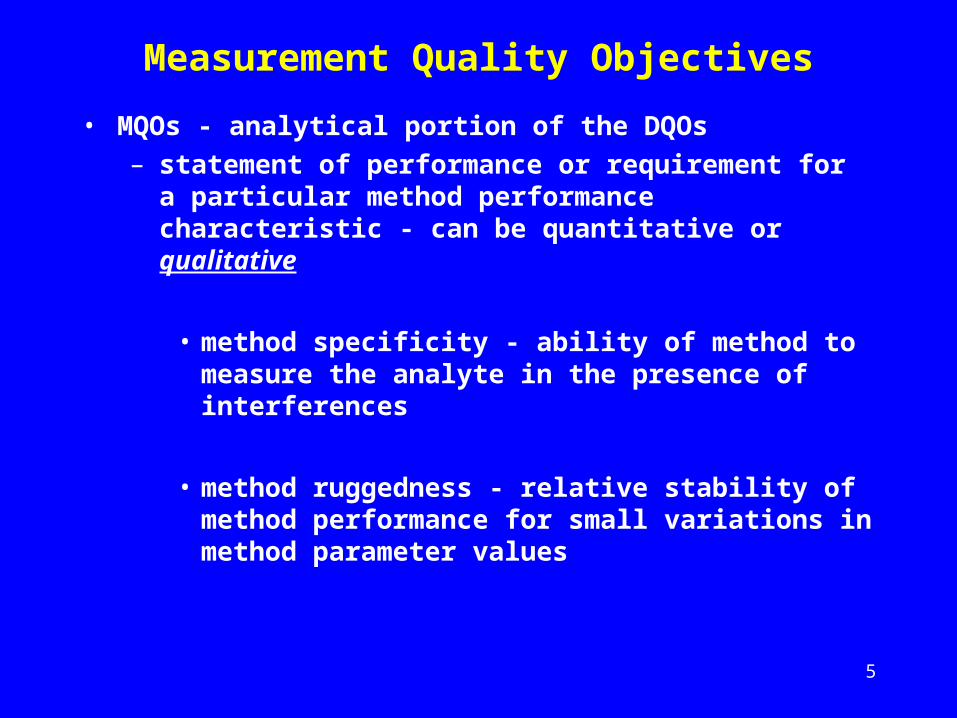
Measurement Quality Objectives
• MQOs - analytical portion of the DQOs
– statement of performance or requirement for a particular method performance characteristic - can be quantitative or qualitative
• method specificity - ability of method to measure the analyte in the presence of interferences
• method ruggedness - relative stability of method performance for small variations in method parameter values
6
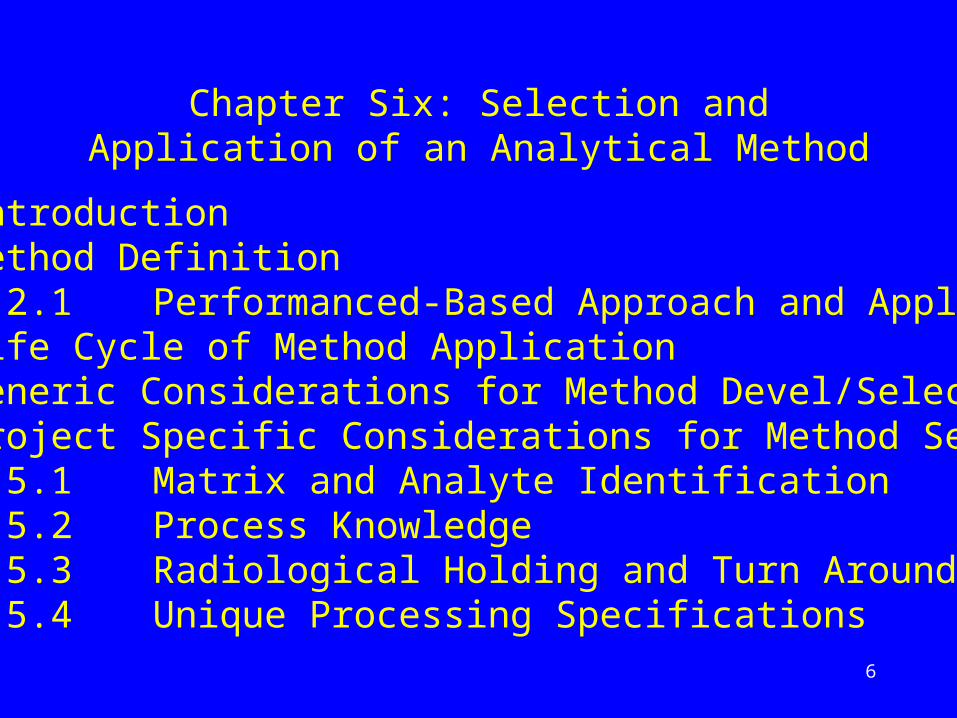
Chapter Six: Selection and Application of an Analytical Method
6.1 Introduction6.2 Method Definition
6.2.1 Performanced-Based Approach and Application6.3 Life Cycle of Method Application6.4 Generic Considerations for Method Devel/Selection6.5 Project Specific Considerations for Method Selection
6.5.1 Matrix and Analyte Identification6.5.2 Process Knowledge6.5.3 Radiological Holding and Turn Around Times6.5.4 Unique Processing Specifications
7
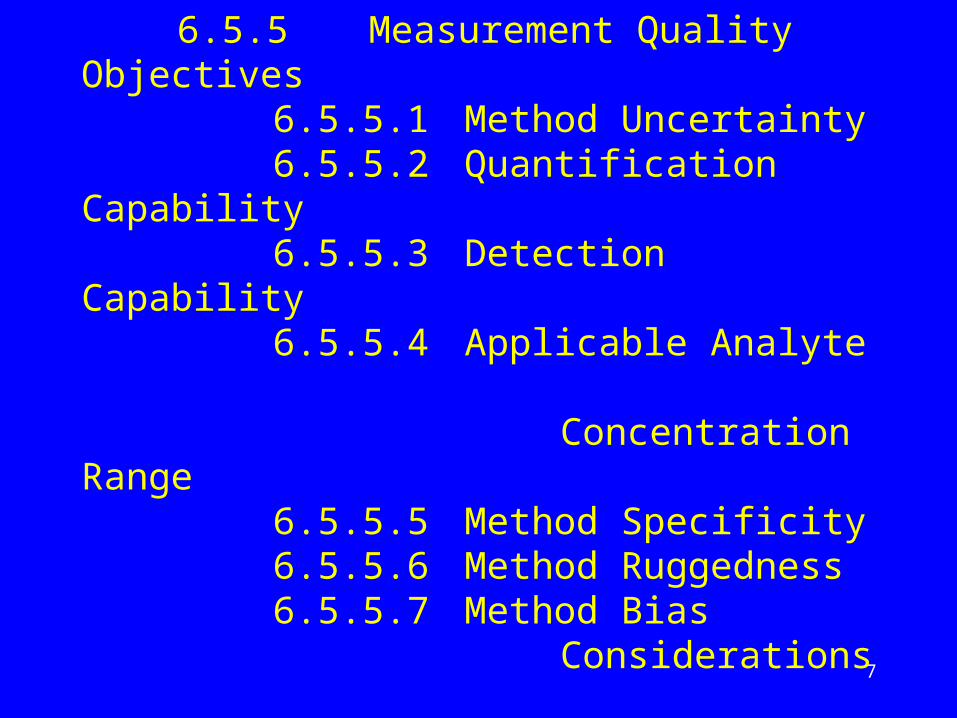
6.5.5 Measurement Quality Objectives6.5.5.1 Method Uncertainty6.5.5.2 Quantification Capability6.5.5.3 Detection Capability6.5.5.4 Applicable Analyte
Concentration Range6.5.5.5 Method Specificity6.5.5.6 Method Ruggedness6.5.5.7 Method Bias
Considerations
8
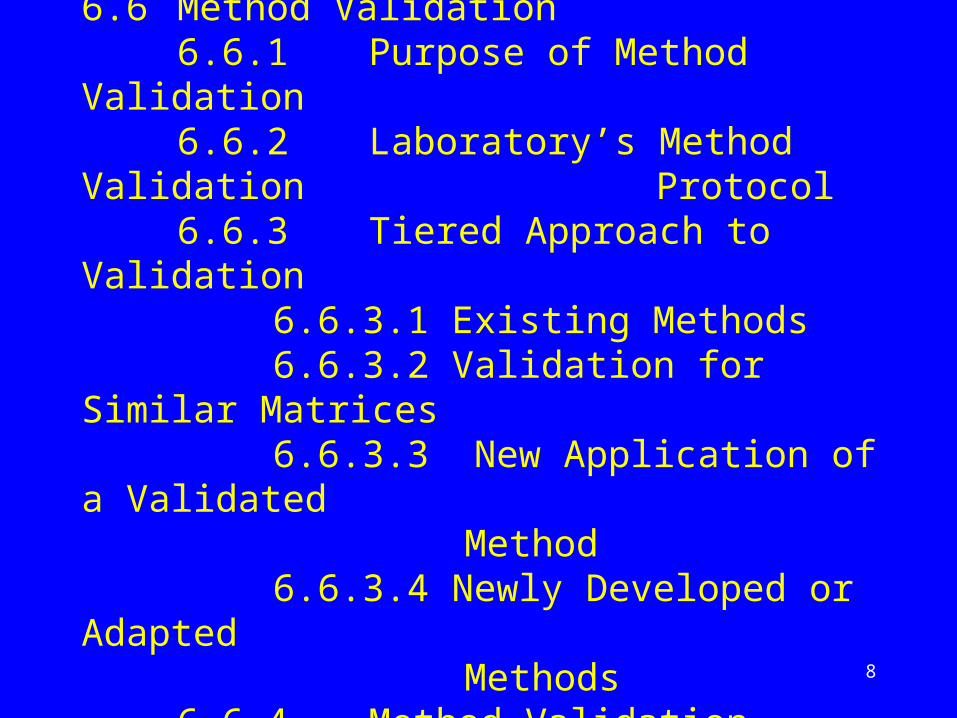
6.6 Method Validation6.6.1 Purpose of Method Validation6.6.2 Laboratory’s Method Validation
Protocol6.6.3 Tiered Approach to Validation
6.6.3.1 Existing Methods6.6.3.2 Validation for Similar Matrices6.6.3.3 New Application of a Validated
Method6.6.3.4 Newly Developed or Adapted
Methods6.6.4 Method Validation Documentation
9
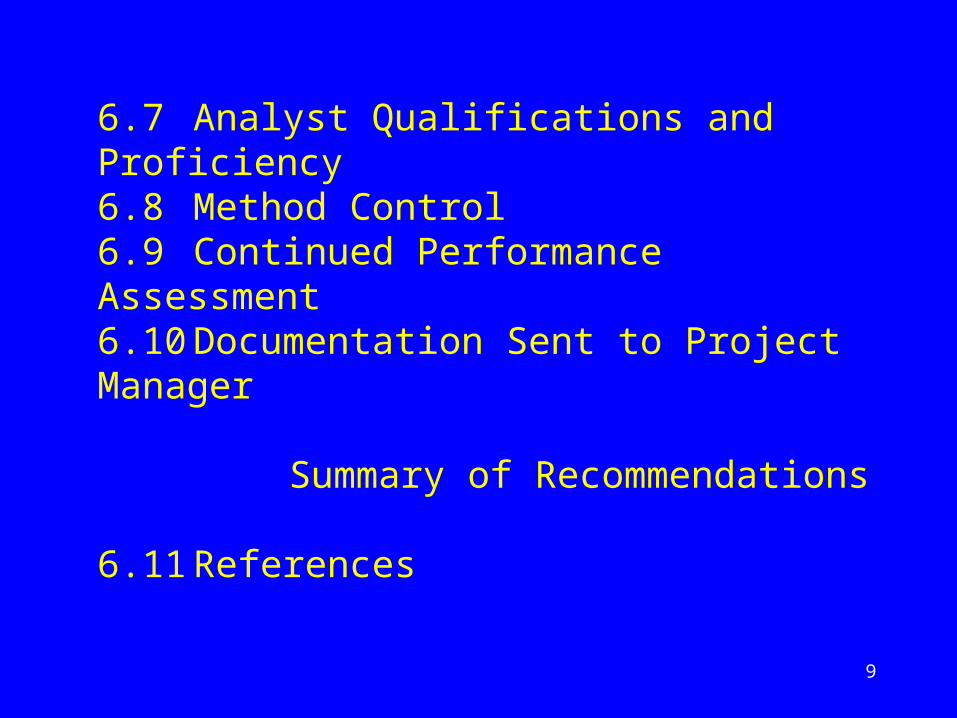
6.7 Analyst Qualifications and Proficiency6.8 Method Control6.9 Continued Performance Assessment6.10 Documentation Sent to Project Manager
Summary of Recommendations
6.11 References
10
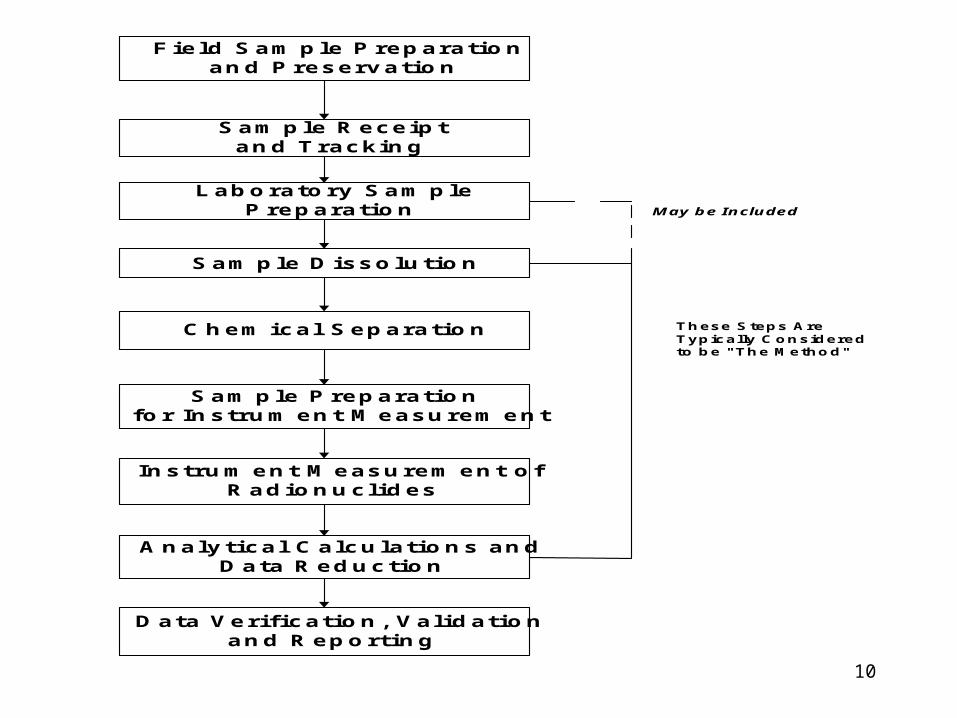
F ie ld S am p le P rep aratio nan d P reserv atio n
S am p le D isso lu tio n
C h em ical S ep aratio n
S am p le P rep aratio nfo r In stru m en t M easu rem en t
In stru m en t M easu rem en t o fR ad io n u cl id es
A n aly t ica l C alcu latio n s an dD ata R ed u ctio n
S am p le R eceip tan d T rackin g
L ab o rato ry S am p leP rep aratio n
D ata V eri f icatio n , V al id atio nan d R ep o rtin g
These Steps AreTypically C onsideredto be "The Method"
M ay be Included
11

12
MQO - Method Uncertainty Requirement, uMR
• The recommended value of uMR is based on the assumption that any known bias in the measurement process has been corrected and any remaining bias is much smaller than the shift, , when a concentration near the gray region is measured.
– MAPEP & QAP PE programs should measure laboratory bias as a testing parameter - bias is determined through multiple analyses, not a single measurement
• If decisions are to be made about the mean of a sampled population, estimate the uMR of the analytical method at the UBGR (action level) and require that the uMR be the width of the gray region divided by 10.
• If this requirement can not be met, then require at least that the uMR be the width of the gray region divided by 3.

13

14
ExampleThe project planners have identified that the action level for the analyte is 0.10 Bq/g and the lower boundary of the gray region is 0.02 Bq/g. If decisions are to be made about the contaminated areas based on samples, then the uMR at 0.10 Bq/g would be:
uMR = / 10 = (0.10 - 0.02) / 10 = 0.008 Bq/g (8%)
If this uMR cannot be achieved, then a method uncertainty as large as
/ 3 = 0.027 Bq/g (27%) may be allowed if more samples are taken per contaminated survey area.
In terms of method selection, this MQO calls for a method that can ordinarily produce measured results with an expected combined standard uncertainty of 8% at the action level
15
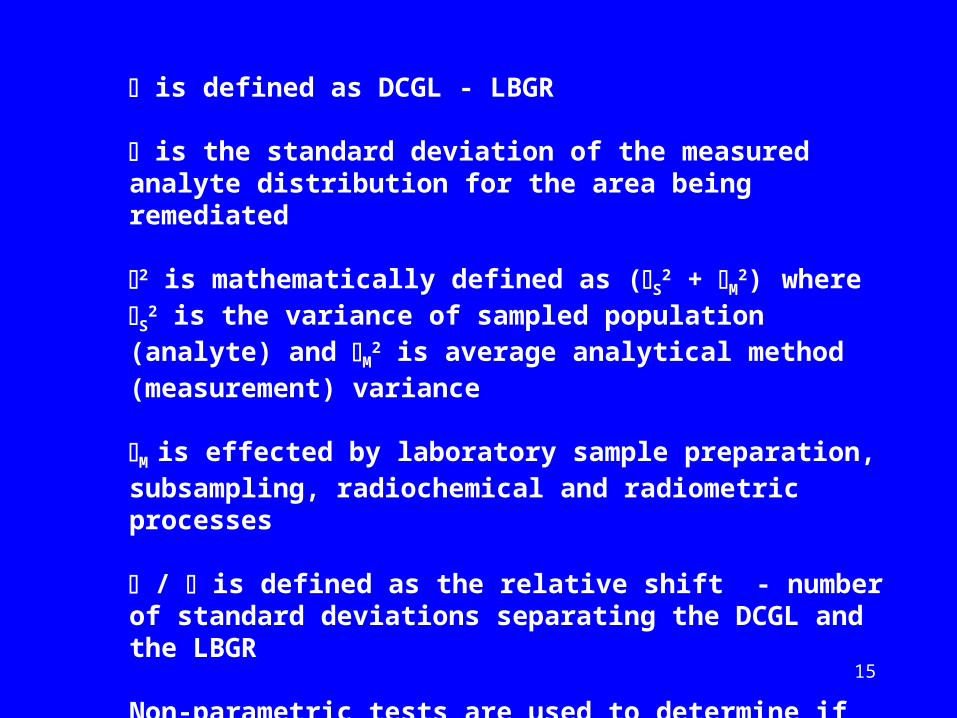
is defined as DCGL - LBGR
is the standard deviation of the measured analyte distribution for the area being remediated
2 is mathematically defined as (S2 + M
2) where S2 is the variance
of sampled population (analyte) and M2 is average analytical
method (measurement) variance
M is effected by laboratory sample preparation, subsampling, radiochemical and radiometric processes
/ is defined as the relative shift - number of standard deviations separating the DCGL and the LBGR
Non-parametric tests are used to determine if the null hypothesis (survey unit does not meet the release criterion) can be rejected; Sign and Wilcoxon Rank Sum Tests.
16

17
MQO - Method Uncertainty Requirement
If decisions are to be made about individual samples in a survey, MARLAP recommends the use of:
uMR = / ( z1- + z1- )
Example: UBGR = 1 Bq/L; LBGR = 0.5 Bq/L; = 0.05; = 0.10
uMR = 1.0 - 0.5 / ( 1.645 + 1.282 ) = 0.17 Bq/L
or 17% at the action level.
If = 0.05; = 0.05, then the following simplification can be used
uMR = 0.3
18
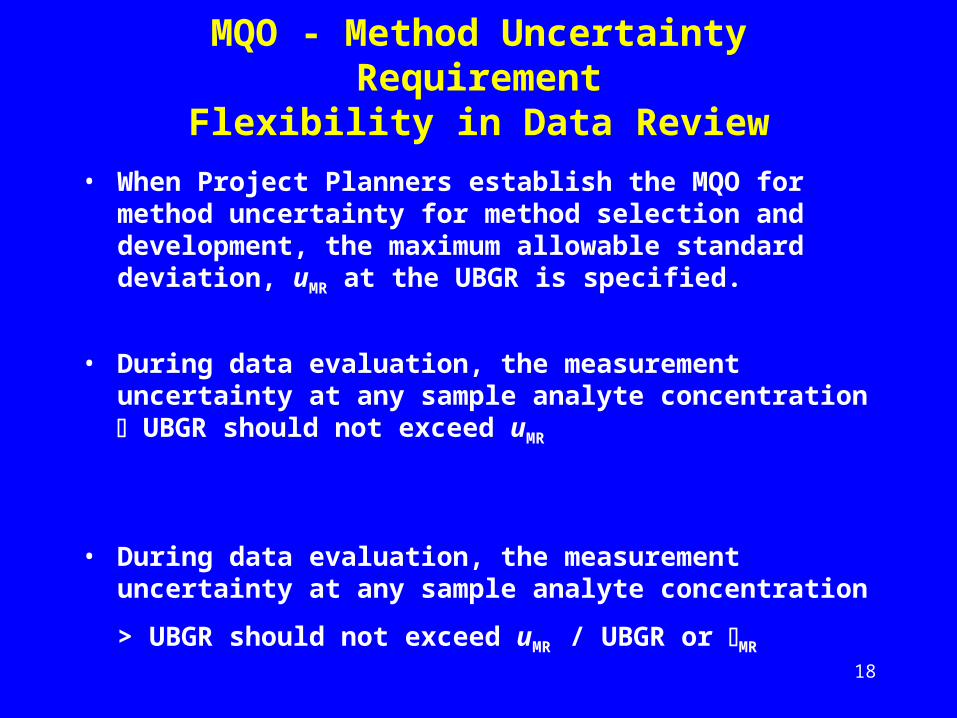
MQO - Method Uncertainty RequirementFlexibility in Data Review
• When Project Planners establish the MQO for method uncertainty for method selection and development, the maximum allowable standard deviation, uMR at the UBGR is specified.
• During data evaluation, the measurement uncertainty at any sample analyte concentration UBGR should not exceed uMR
• During data evaluation, the measurement uncertainty at any sample analyte concentration > UBGR should not exceed uMR /
UBGR or MR
19
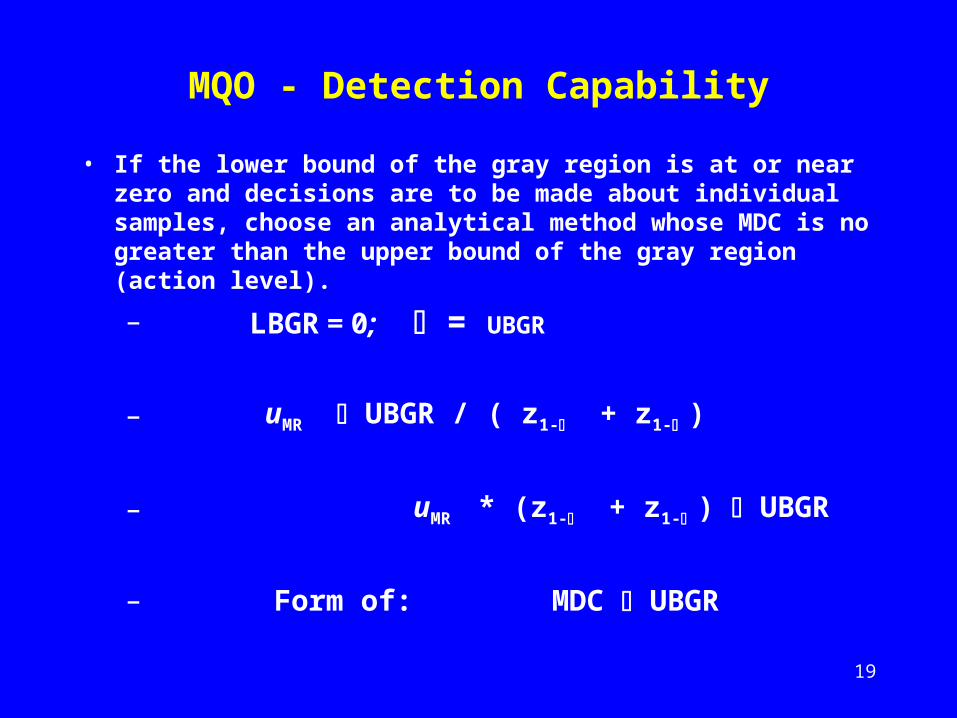
MQO - Detection Capability
• If the lower bound of the gray region is at or near zero and decisions are to be made about individual samples, choose an analytical method whose MDC is no greater than the upper bound of the gray region (action level).
– LBGR = 0; = UBGR
– uMR UBGR / ( z1- + z1- )
– uMR * (z1- + z1- ) UBGR
– Form of: MDC UBGR
20
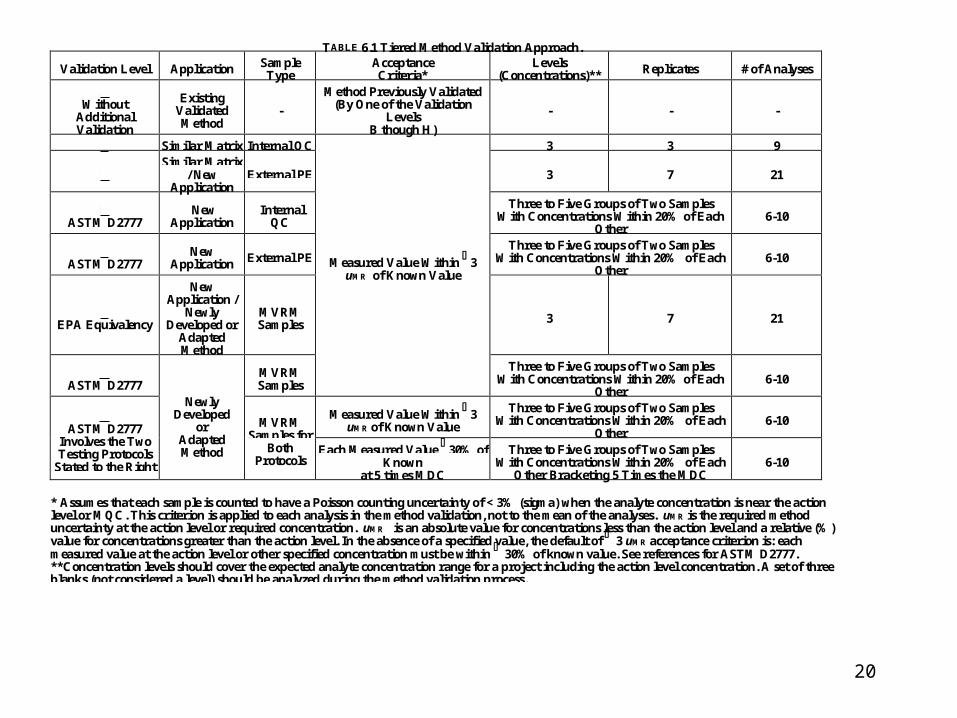
TABLE 6.1 Tiered Method Validation Approach.
Validation Level Application SampleType
AcceptanceCriteria*
Levels(Concentrations)** Replicates # of Analyses
A Without
AdditionalValidation
ExistingValidatedMethod
-
Method Previously Validated(By One of the Validation
LevelsB though H)
- - -
B Similar Matrix Internal QC 3 3 9
C Similar Matrix
/ NewApplication
External PE 3 7 21
D ASTM D2777
NewApplication
InternalQC
Three to Five Groups of Two SamplesWith Concentrations Within 20% of Each
Other6-10
E ASTM D2777
NewApplication External PE
Three to Five Groups of Two SamplesWith Concentrations Within 20% of Each
Other6-10
F EPA Equivalency
NewApplication /
NewlyDeveloped or
AdaptedMethod
MVRMSamples 3 7 21
G ASTM D2777
MVRMSamples
Measured Value Within 3uMR of Known Value
Three to Five Groups of Two SamplesWith Concentrations Within 20% of Each
Other6-10
Measured Value Within 3uMR of Known Value
Three to Five Groups of Two SamplesWith Concentrations Within 20% of Each
Other6-10H
ASTM D2777Involves the TwoTesting Protocols
Stated to the Right
NewlyDeveloped
orAdaptedMethod
MVRMSamples for
BothProtocols
Each Measured Value 30% ofKnown
at 5 times MDC
Three to Five Groups of Two SamplesWith Concentrations Within 20% of Each
Other Bracketing 5 Times the MDC6-10
* Assumes that each sample is counted to have a Poisson counting uncertainty of < 3% (sigma) when the analyte concentration is near the actionlevel or MQC. This criterion is applied to each analysis in the method validation, not to the mean of the analyses. uMR is the required methoduncertainty at the action level or required concentration. uMR is an absolute value for concentrations less than the action level and a relative (%)value for concentrations greater than the action level. In the absence of a specified value, the default of 3 uMR acceptance criterion is: eachmeasured value at the action level or other specified concentration must be within 30% of known value. See references for ASTM D2777.**Concentration levels should cover the expected analyte concentration range for a project including the action level concentration. A set of threeblanks (not considered a level) should be analyzed during the method validation process.

21
Method Validation Process
• Parameters specified or ascertained from the analytical results generated
– Defined Method Validation Level (Table 6.1)
– Analytes
– Defined matrix for testing, including chemical and physical characteristics that approximate project samples or
– Selected project specific or appropriate alternative matrix PT samples, including known chemical or radionuclide interferences at appropriate levels
– Defined sample preservation
– Stated additional data testing criteria
– Establish acceptable chemical / radiotracer yield values
22
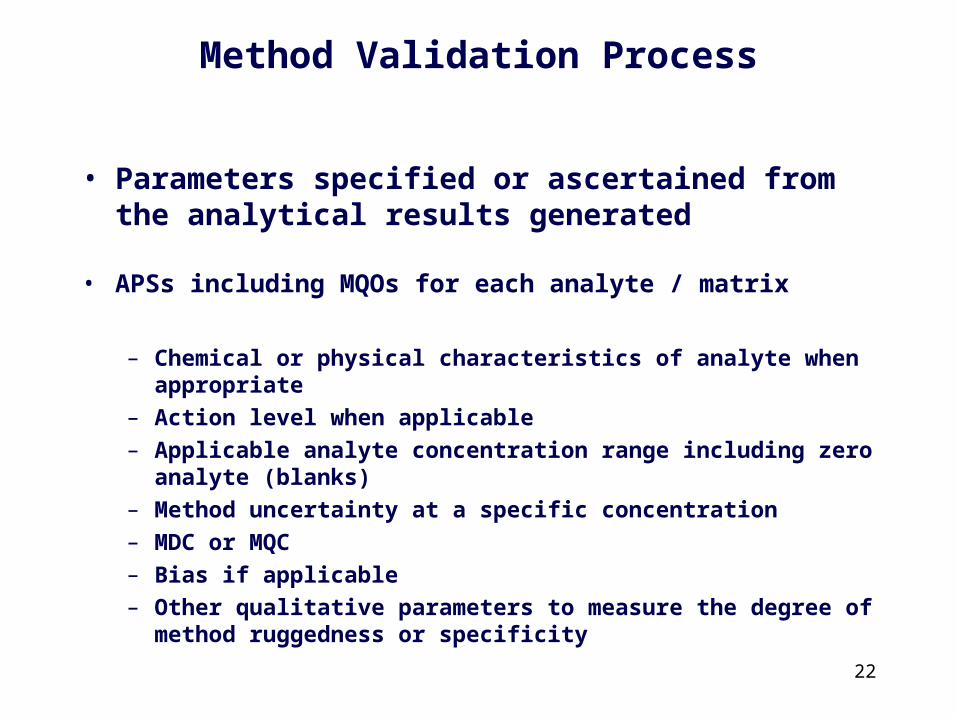
Method Validation Process
• Parameters specified or ascertained from the analytical results generated
• APSs including MQOs for each analyte / matrix
– Chemical or physical characteristics of analyte when appropriate
– Action level when applicable
– Applicable analyte concentration range including zero analyte (blanks)
– Method uncertainty at a specific concentration
– MDC or MQC
– Bias if applicable
– Other qualitative parameters to measure the degree of method ruggedness or specificity
23
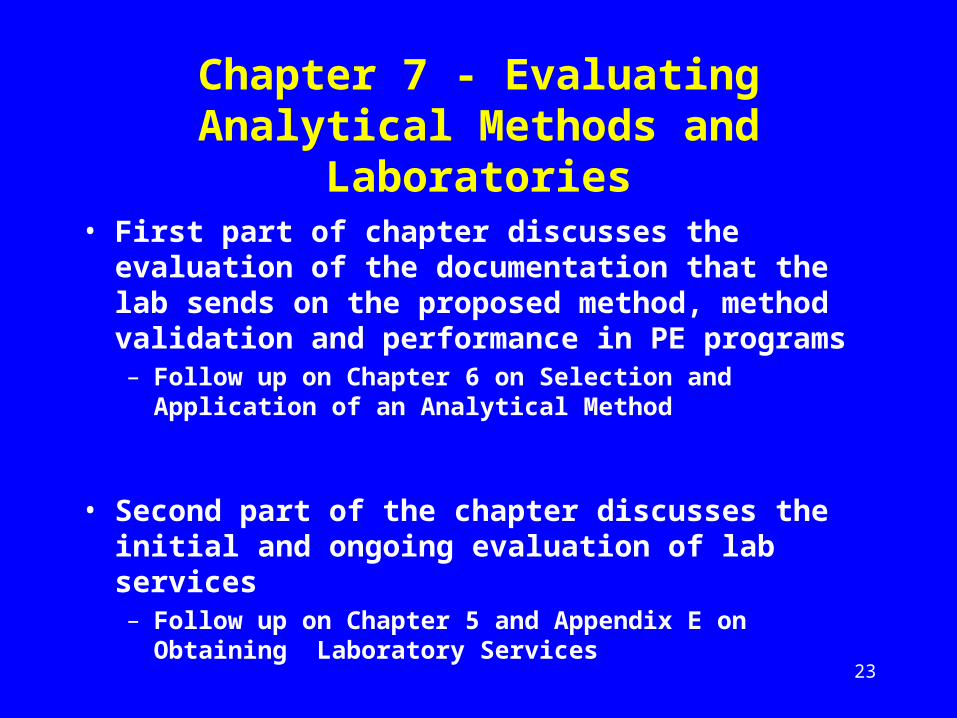
Chapter 7 - Evaluating Analytical Methods and Laboratories
• First part of chapter discusses the evaluation of the documentation that the lab sends on the proposed method, method validation and performance in PE programs– Follow up on Chapter 6 on Selection and Application of an
Analytical Method
• Second part of the chapter discusses the initial and ongoing evaluation of lab services– Follow up on Chapter 5 and Appendix E on Obtaining
Laboratory Services

24
CHAPTER 7EVALUATING ANALYTICAL METHODS AND
LABORATORIES
• 7.1 Introduction
• 7.2 Evaluation of Proposed Analytical Methods– 7.2.1 Documentation of Required Method Performance
• 7.2.1.1 Method Validation Documentation
• 7.2.1.2 Method Experience, Previous Projects, and Clients
• 7.2.1.3 Internal and External Quality Assurance Assessments
– 7.2.2 Performance Requirements of the Sow – Analytical Protocol
• 7.2.2.1 Matrix and Analyte Identification

25
CHAPTER 7 CONTINUEDEVALUATING ANALYTICAL METHODS AND
LABORATORIES
• 7.2.2.2 Process Knowledge
• 7.2.2.3 Radiological Holding and Turnaround Times
• 7.2.2.4 Unique Processing Specifications
• 7.2.2.5 Measurement Quality Objectives
• 7.2.2.6 Bias Considerations
• 7.3 Initial Evaluation of the Laboratory– …
– 7.3.4 Review of Performance Indicators• 7.3.4.1 Review of Internal QC Results
• 7.3.4.2 External PE Program Results

26
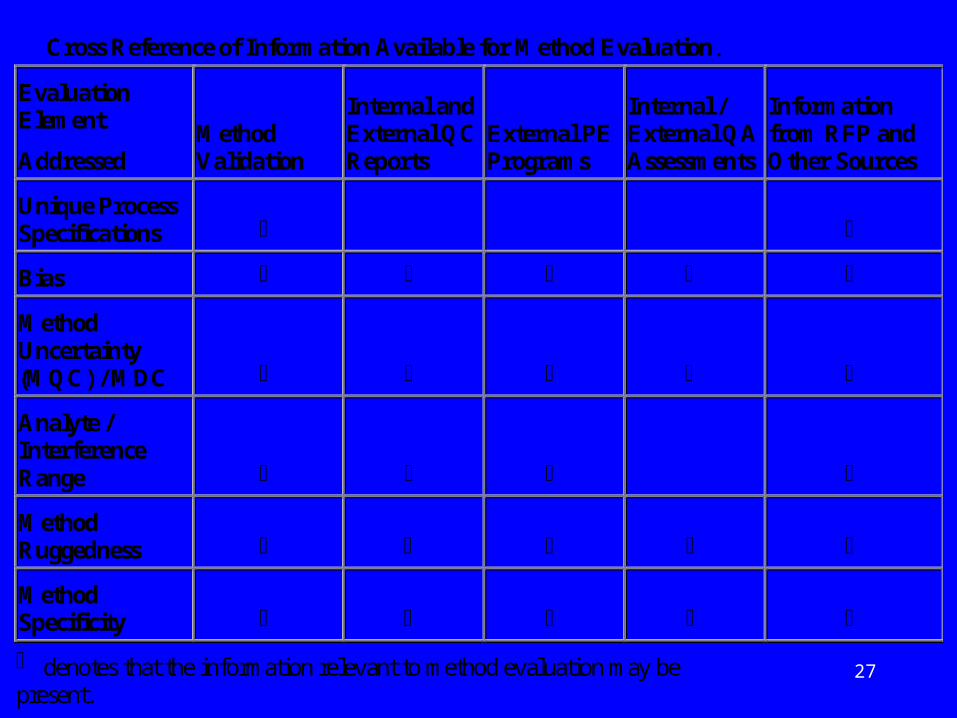
Cross Reference of Information Available for Method Evaluation.
EvaluationElement
AddressedMethodValidation
Internal andExternal QCReports
External PEPrograms
Internal /External QAAssessments
Informationfrom RFP andOther Sources
Analyte / Matrix
ProcessKnowledge
PreviousExperience
Rad. HoldingTime
TurnaroundTime
denotes that the information relevant to method evaluation may be
27
Cross Reference of Information Available for Method Evaluation.
EvaluationElement
AddressedMethodValidation
Internal andExternal QCReports
External PEPrograms
Internal /External QAAssessments
Informationfrom RFP andOther Sources
Unique ProcessSpecifications
Bias
MethodUncertainty(MQC) / MDC
Analyte /InterferenceRange
MethodRuggedness
MethodSpecificity
denotes that the information relevant to method evaluation may bepresent.

28
GENERIC SPECIFICATIONSFOR LABORATORY
OPERATIONS
EXPERIENCE BASE FOR SOWANALYTICAL REQUIREMENTS
RADIOANALYTICAL METHODS APPLICABILITY / QUALITY
INITIAL EVALUATION OF LABORATORY
CAPABILITY TO MEET SAMPLEPROCESSING AND REPORTING
REQUIREMENTS
CAPABILITY TO MEET SOWSPECIFICATIONS
EXISTING PERFORMANCEINDICATOR REVIEW
ADEQUACY OF FACILITIES,INSTRUMENTATION AND STAFF
LEVELS
QUALITY SYSTEMDOCUMENTATION
QUALITY MANUAL
Organization and ManagementQuality Sytem - Establishment, Audits,
Essential Quality Controls andEvaluations, and Data Verification
PersonnelPhysical Facilities - Accomodations and
EnvironmentEquipment and Reference Materials
Measurement Traceability and CalibrationsMethod and Standard Operating
ProceduresSample Handling, Sample Acceptance
Policy and Sample ReceiptRecords
Subcontracting Analytical SamplesOutside Support Services and Supplies
Complaints
PROFICIENCY TESTINGSAMPLES
METHODVALIDATION
DOCUMENTATION
DEMONSTRATEDQUALITY ON
SIMILAR PROJECTS
METHOD REVIEW& COMPARABILITY
EXTERNAL PE PROGRAMRESULTS
ONSITEAUDIT
DESK AUDIT
ADMINISTRATIVE / PROJECTMANAGEMENT

29
MQO - Method Uncertainty RequirementFlexibility in Data Review
• When Project Planners establish the MQO for method uncertainty for method selection and development, the maximum allowable standard deviation, uMR at the UBGR is specified.
• During data evaluation, the measurement uncertainty at any sample analyte concentration UBGR should not exceed uMR
• During data evaluation, the measurement uncertainty at any sample analyte concentration > UBGR should not exceed uMR /
UBGR or MR

30
Monitoring A Lab’s Quantitative Performance
• Premise
– Ensuring the Lab meets the method uncertainty requirement
• uMR = / 10
MR = uMR / UBGR
• No method bias is assumed
31
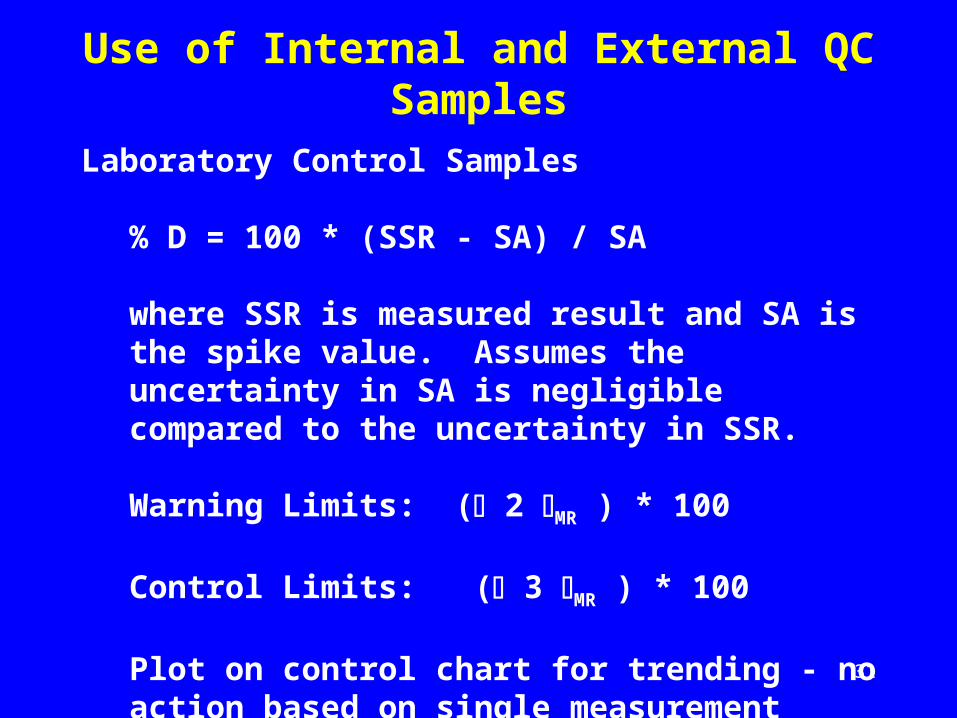
Use of Internal and External QC Samples
Laboratory Control Samples
% D = 100 * (SSR - SA) / SA
where SSR is measured result and SA is the spike value. Assumes the uncertainty in SA is negligible compared to the uncertainty in SSR.
Warning Limits: ( 2 MR ) * 100
Control Limits: ( 3 MR ) * 100
Plot on control chart for trending - no action based on single measurement

32
Laboratory Control Samples - Example
UBGR= 5 Bq/kg, uMR = 0.35 Bq/kg, MR = 0.07
LCS is prepared with SA = 10.0 Bq/kg and analytical result of SSR = 11.61 0.75 Bq/kg. % D = 100 * (SSR - SA) / SA = 100 * (11.61 - 10.0) / 10 = 16.1
Warning Limits: ( 2 MR ) * 100 or 14 %Control Limits: ( 3 MR ) * 100 or 21 %
% D is above the warning limit but below the control limit
33
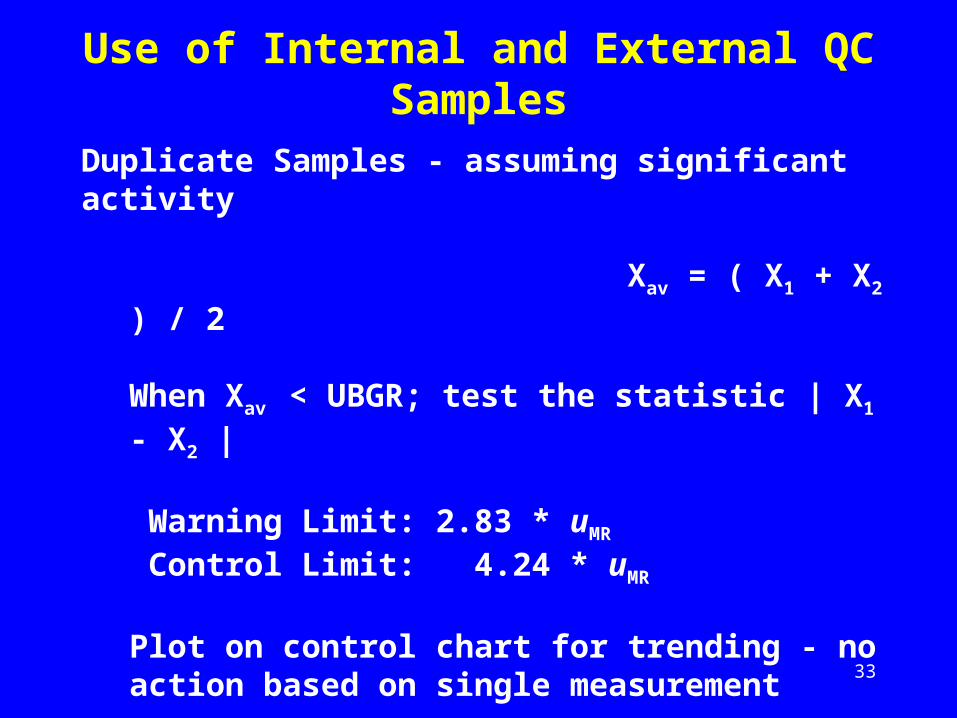
Use of Internal and External QC Samples
Duplicate Samples - assuming significant activity
Xav = ( X1 + X2 ) / 2
When Xav < UBGR; test the statistic | X1 - X2 |
Warning Limit: 2.83 * uMR
Control Limit: 4.24 * uMR
Plot on control chart for trending - no action based on single measurement
34
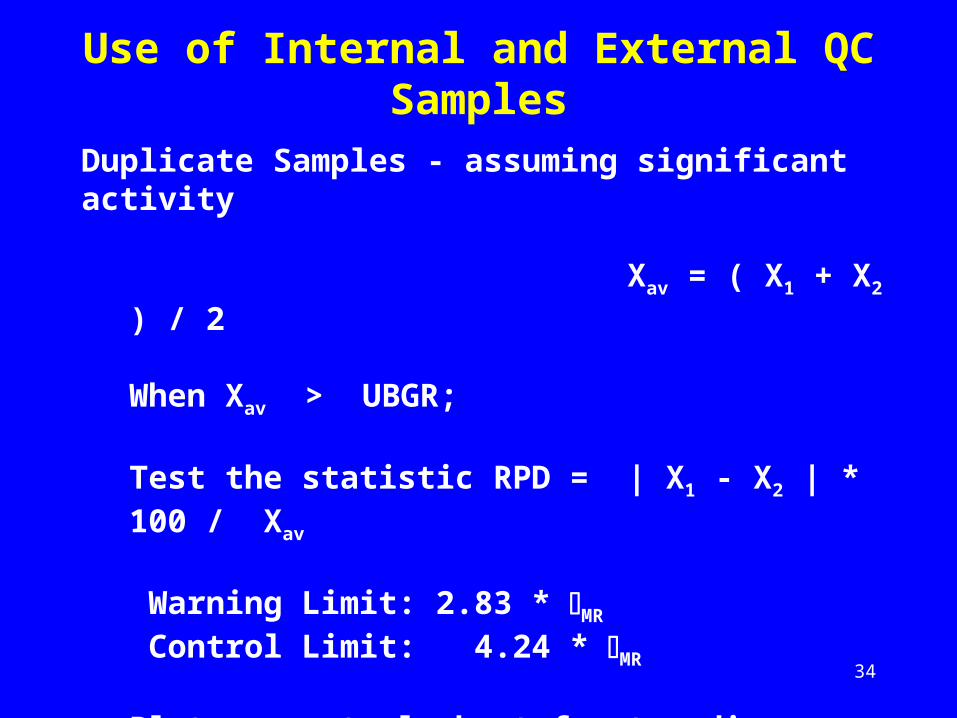
Use of Internal and External QC Samples
Duplicate Samples - assuming significant activity
Xav = ( X1 + X2 ) / 2
When Xav > UBGR;
Test the statistic RPD = | X1 - X2 | * 100 / Xav
Warning Limit: 2.83 * MR Control Limit: 4.24 * MR
Plot on control chart for trending - no action based on single measurement

35
Use of Internal and External QC Samples
Method Blanks - testing criteria are provided.
However, the target value for an analytical blank is zero. For the sample specific MDC, the critical level should be used to determine if a blank is statistically positive.
Testing Criteria Related to the uMR:
Test the statistic: Measured Concentration ValueWarning Limits: 2 uMR
Control Limits: 3 uMR
Plot on control chart for trending - no action based on single measurement

36
Method Blanks - Example
UBGR= 5 Bq/kg, uMR = 0.35 Bq/kg, MR = 0.07
Analytical Result: X = 0.20 0.10 Bq/kg
Testing Criteria Related to the uMR:
Warning Limits: 2 uMR or 0.70 Bq/kgControl Limits: 3 uMR or 1.05 Bq/kg
Analytical result is below the warning limit. Although the test allows for a certain degree of contamination in comparison to the action level, the target value is zero and any blank value > the critical vale would be considered to be positive

37
Use of Internal and External QC Samples
Matrix Spikes - testing criteria are provided.
Test the statistic: Z
Z = ( SSR - SR - SA ) / {MR ( SSR2 + max(SR, UBGR)2)1/2}
where SSR sample result, SA is the spike value, SR is the unspiked value. (Assumes the uncertainty of the spike value is insignificant compared to the uncertainty of the measurements)
Warning Limits: 2 Control Limits: 3
Plot on control chart for trending - no action based on single measurement
38
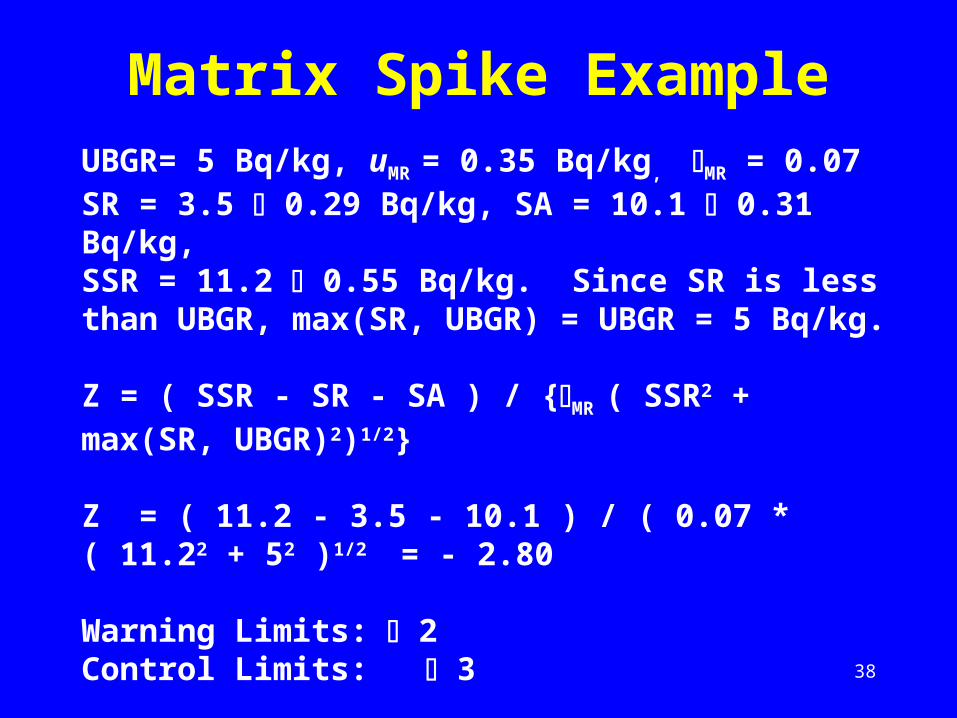
Matrix Spike ExampleUBGR= 5 Bq/kg, uMR = 0.35 Bq/kg, MR = 0.07SR = 3.5 0.29 Bq/kg, SA = 10.1 0.31 Bq/kg, SSR = 11.2 0.55 Bq/kg. Since SR is less than UBGR, max(SR, UBGR) = UBGR = 5 Bq/kg.
Z = ( SSR - SR - SA ) / {MR ( SSR2 + max(SR, UBGR)2)1/2}
Z = ( 11.2 - 3.5 - 10.1 ) / ( 0.07 * ( 11.22 + 52 )1/2 = - 2.80
Warning Limits: 2 Control Limits: 3
Z is less than the lower warning limit (-2) but slightly greater than the lower control limit (-3)

39
MQO - Method Uncertainty RequirementFlexibility in Data Review
• When Project Planners establish the MQO for method uncertainty for method selection and development, the maximum allowable standard deviation, uMR at the UBGR is specified.
• During data evaluation, the measurement uncertainty at any sample analyte concentration UBGR should not exceed uMR
• During data evaluation, the measurement uncertainty at any sample analyte concentration > UBGR should not exceed uMR /
UBGR or MR
40
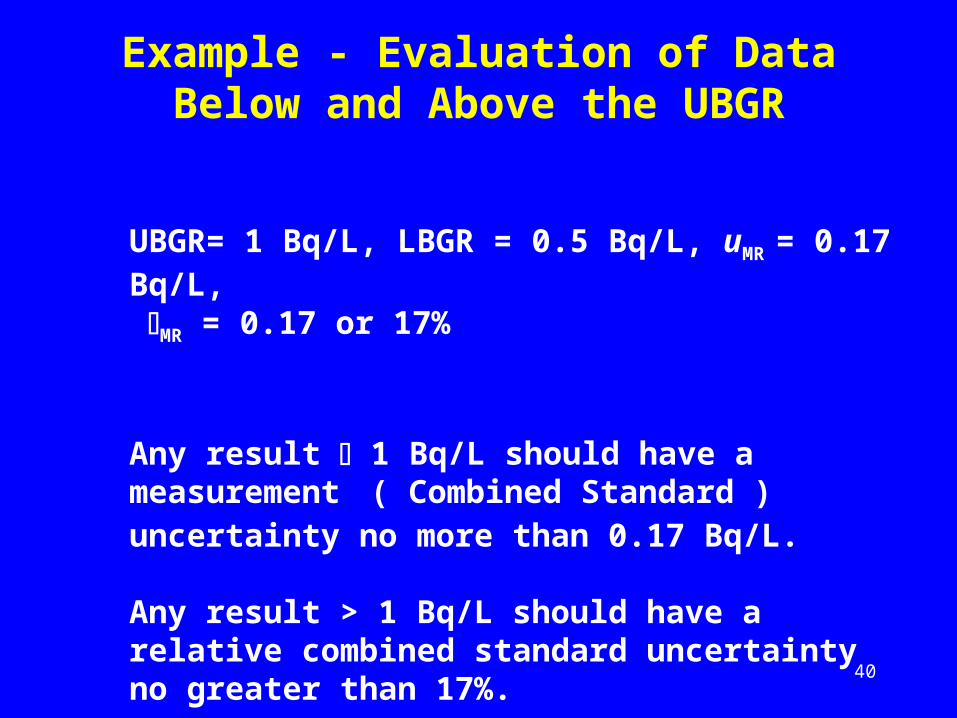
Example - Evaluation of Data Below and Above the UBGR
UBGR= 1 Bq/L, LBGR = 0.5 Bq/L, uMR = 0.17 Bq/L, MR = 0.17 or 17%
Any result 1 Bq/L should have a measurement ( Combined Standard ) uncertainty no more than 0.17 Bq/L.
Any result > 1 Bq/L should have a relative combined standard uncertainty no greater than 17%.
Related Documents