1 Management of Ideas Barbara Schütz Arbeitsmarktservice Österreich Organisational development and staff training

1 Management of Ideas Barbara Schütz Arbeitsmarktservice Österreich Organisational development and staff training.
Dec 18, 2015
Welcome message from author
This document is posted to help you gain knowledge. Please leave a comment to let me know what you think about it! Share it to your friends and learn new things together.
Transcript
1
Management of Ideas
Barbara SchützArbeitsmarktservice Österreich
Organisational development and staff training
2
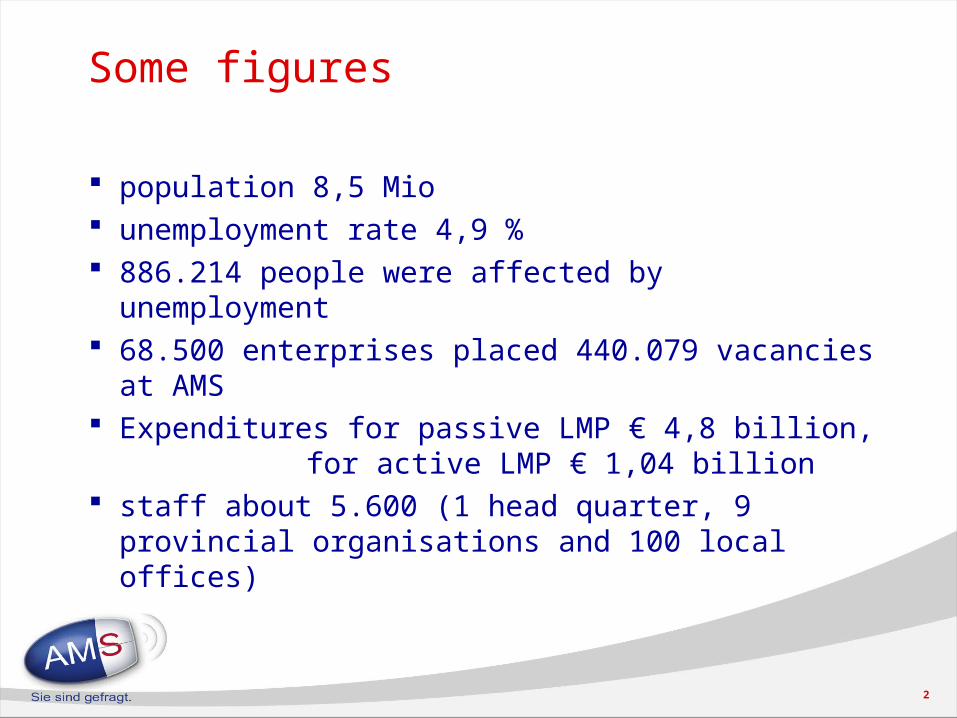
Some figures
population 8,5 Mio unemployment rate 4,9 % 886.214 people were affected by unemployment 68.500 enterprises placed 440.079 vacancies at
AMS Expenditures for passive LMP € 4,8 billion,
for active LMP € 1,04 billion staff about 5.600 (1 head quarter, 9 provincial
organisations and 100 local offices)
3
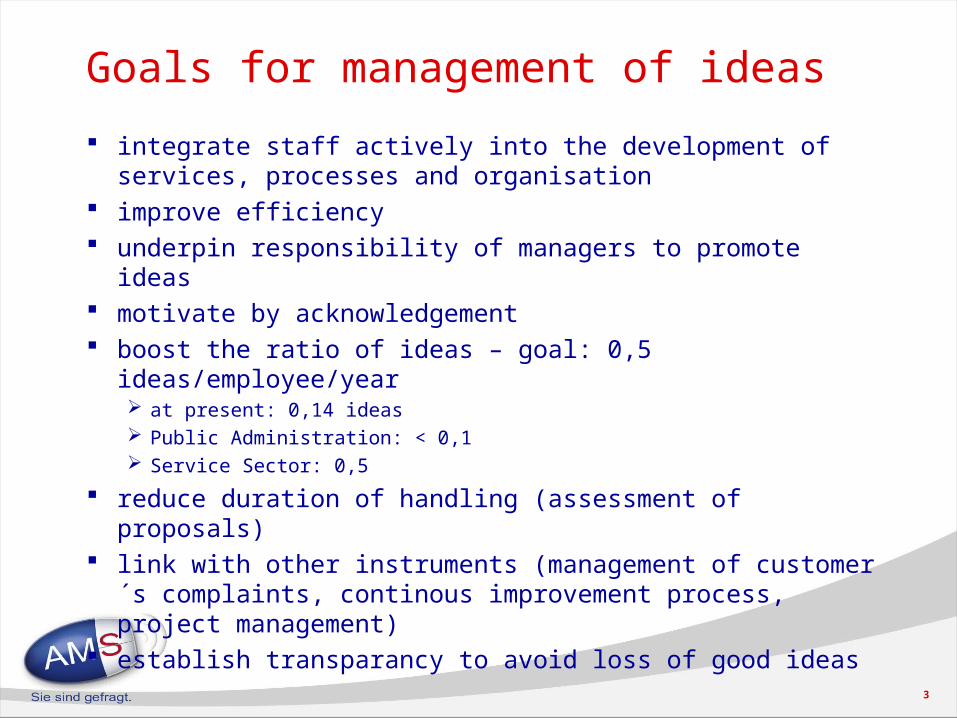
Goals for management of ideas
integrate staff actively into the development of services, processes and organisation
improve efficiency underpin responsibility of managers to promote ideas motivate by acknowledgement boost the ratio of ideas – goal: 0,5 ideas/employee/year
at present: 0,14 ideas Public Administration: < 0,1 Service Sector: 0,5
reduce duration of handling (assessment of proposals) link with other instruments (management of customer´s
complaints, continous improvement process, project management)
establish transparancy to avoid loss of good ideas
4
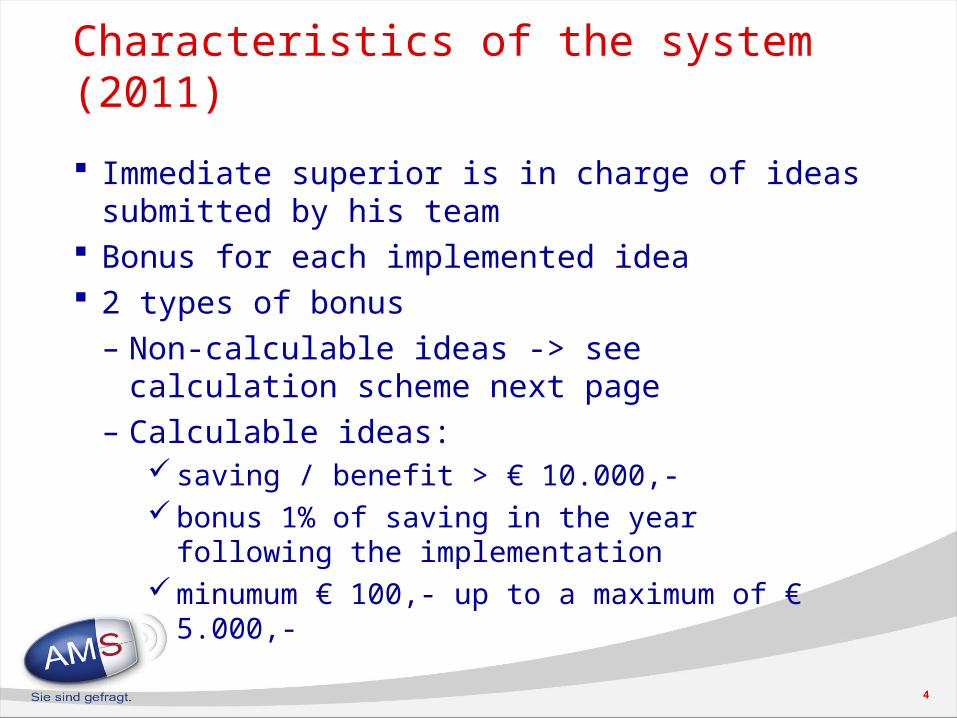
Characteristics of the system (2011)
Immediate superior is in charge of ideas submitted by his team
Bonus for each implemented idea 2 types of bonus
– Non-calculable ideas -> see calculation scheme next page
– Calculable ideas: saving / benefit > € 10.000,- bonus 1% of saving in the year following the
implementation minumum € 100,- up to a maximum of € 5.000,-
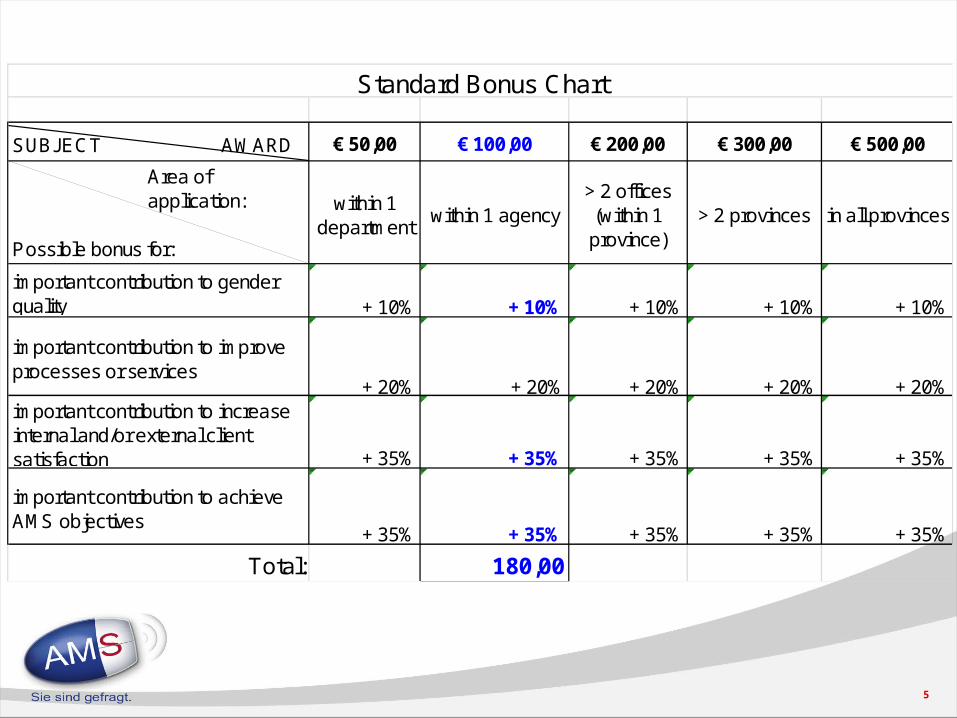
5
SUBJECT AWARD € 50,00 € 100,00 € 200,00 € 300,00 € 500,00
Area of application:
Possible bonus for:
within 1 department
within 1 agency> 2 offices (within 1 province)
> 2 provinces in all provinces
important contribution to gender quality + 10% + 10% + 10% + 10% + 10%
important contribution to improve processes or services
+ 20% + 20% + 20% + 20% + 20%important contribution to increase internal and/or external client satisfaction + 35% + 35% + 35% + 35% + 35%
important contribution to achieve AMS objectives
+ 35% + 35% + 35% + 35% + 35%
Total: 180,00
Standard Bonus Chart
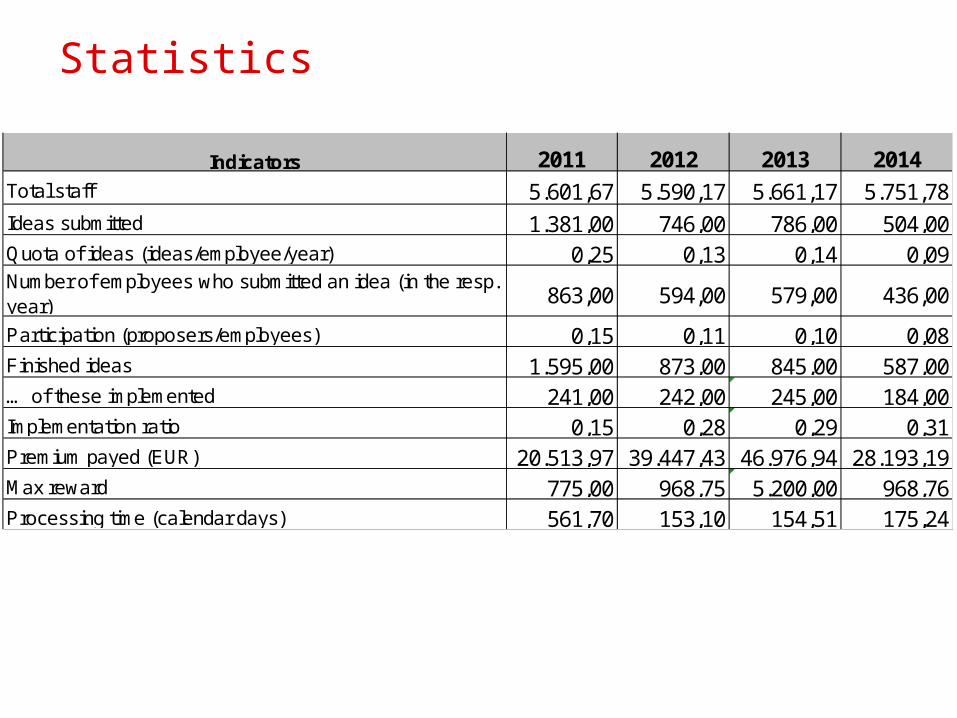
Statistics
Indicators
Total staff 5.601,67 5.590,17 5.661,17 5.751,78Ideas submitted 1.381,00 746,00 786,00 504,00Quota of ideas (ideas/employee/year) 0,25 0,13 0,14 0,09Number of employees who submitted an idea (in the resp. year) 863,00 594,00 579,00 436,00
Participation (proposers/employees) 0,15 0,11 0,10 0,08Finished ideas 1.595,00 873,00 845,00 587,00… of these implemented 241,00 242,00 245,00 184,00Implementation ratio 0,15 0,28 0,29 0,31Premium payed (EUR) 20.513,97 39.447,43 46.976,94 28.193,19Max reward 775,00 968,75 5.200,00 968,76Processing time (calendar days) 561,70 153,10 154,51 175,24
201320122011 2014
7
Internal Marketing
Special intranet pages Newsletter (2x/year) Post-it for all employees Ongoing contest to find a name for the new tool within the tool- to get to know the tool in a playful way- employees should name the tool themselves
In the frame of the annual award event (= Best of AMS): one category for the 3 best ideas
8
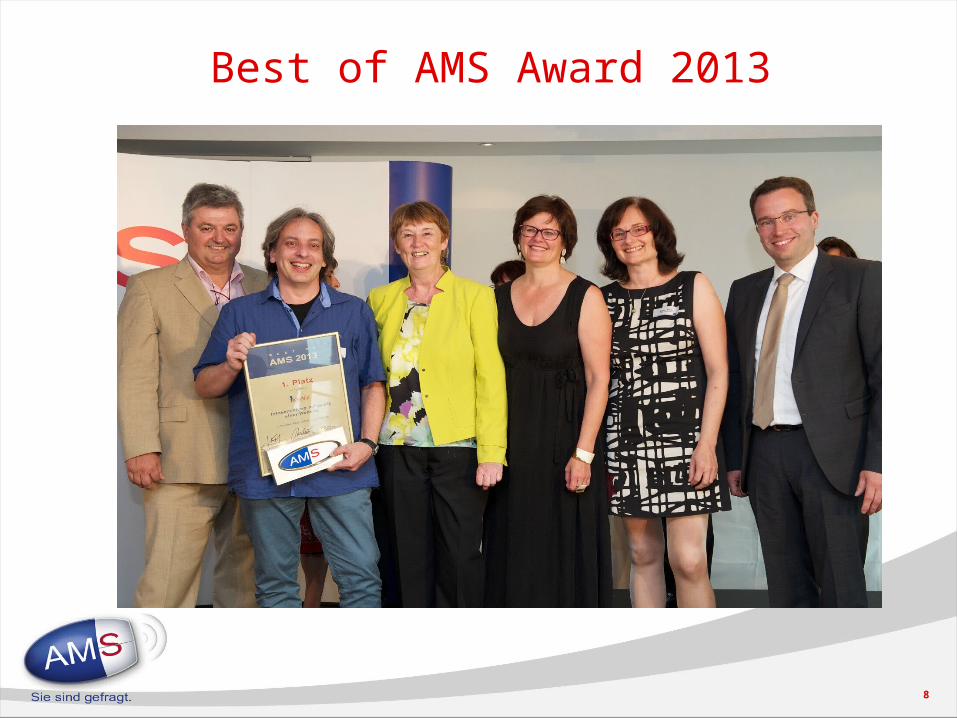
Best of AMS Award 2013
9
“If at first, the idea is not absurd,
then there is no hope for it.”Albert Einstein
Related Documents


