1 Limiting the Impact of Failures on Network Performance Joint work with Supratik Bhattacharyya, and Christophe Diot High Performance Networking Group, 25 Feb. 2004 Yashar Ganjali Computer Systems Lab. Stanford University [email protected] http://www.stanford.edu/~yganjali

1 Limiting the Impact of Failures on Network Performance Joint work with Supratik Bhattacharyya, and Christophe Diot High Performance Networking Group,
Dec 22, 2015
Welcome message from author
This document is posted to help you gain knowledge. Please leave a comment to let me know what you think about it! Share it to your friends and learn new things together.
Transcript

1
High PerformanceSwitching and RoutingTelecom Center Workshop: Sept 4, 1997.
Limiting the Impact of Failures on
Network Performance
Joint work withSupratik Bhattacharyya, and Christophe Diot
High Performance Networking Group, 25 Feb. 2004
Yashar GanjaliComputer Systems Lab.Stanford University
http://www.stanford.edu/~yganjali

2
Motivation
The core of the Internet consists of several large networks (IP backbones).
IP backbones are carefully provisioned to guarantee low latency and jitter for packet delivery.
Failures occur on a daily basis as a result of Physical layer malfunction, Router hardware/software failures, Maintenance, Human errors, …
Failures affect the quality of service delivered to backbone customers.
3
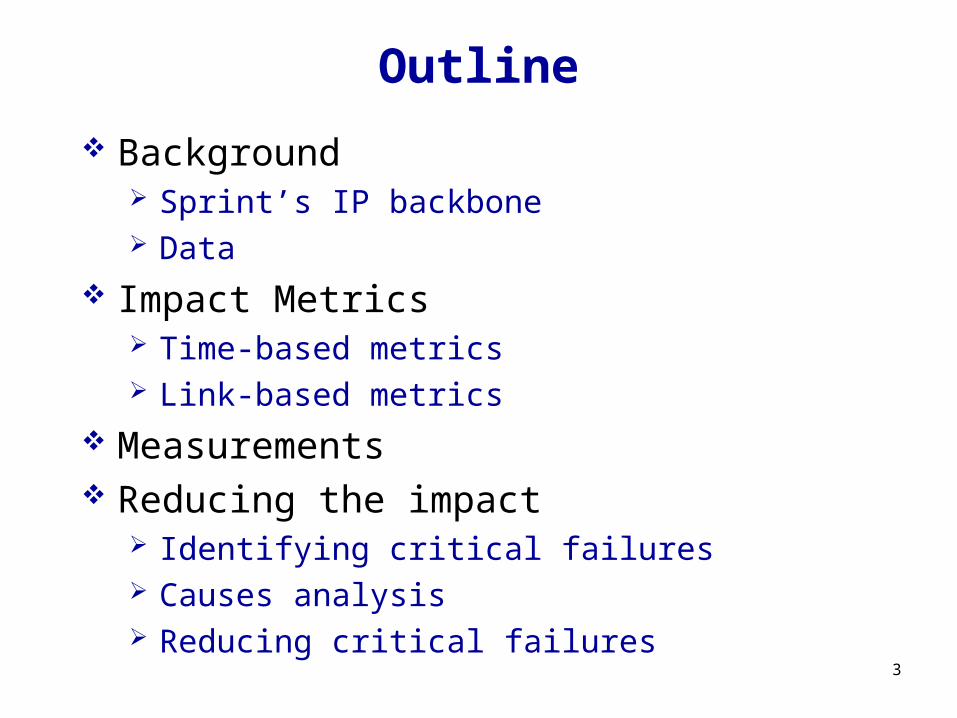
Outline
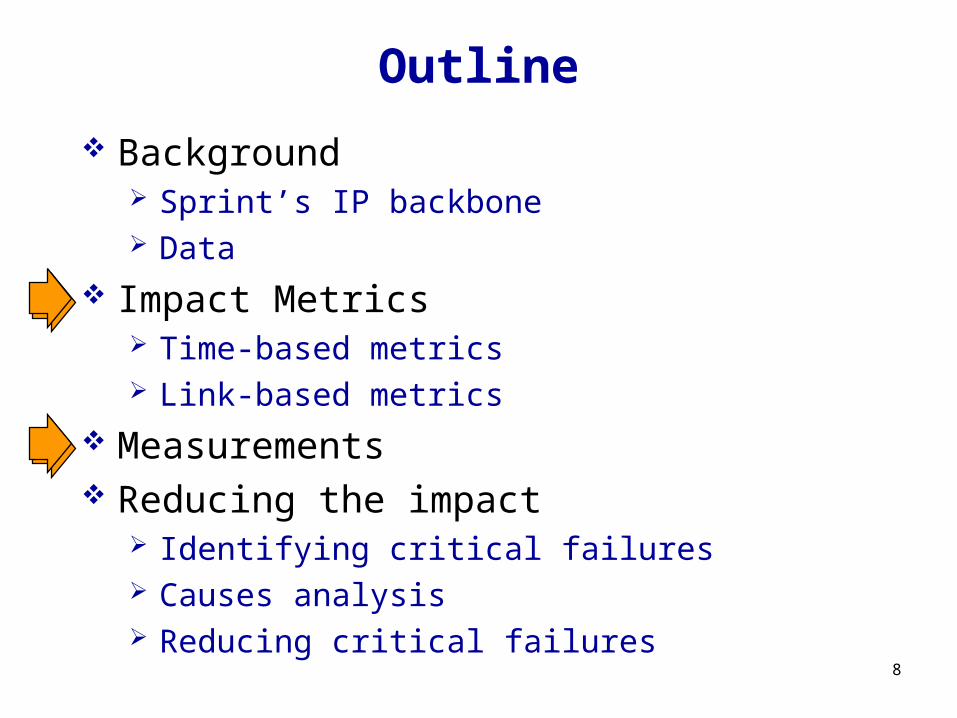
Background Sprint’s IP backbone Data
Impact Metrics Time-based metrics Link-based metrics
Measurements Reducing the impact
Identifying critical failures Causes analysis Reducing critical failures

4
Background – Sprint’s IP backbone
IP layer operates above DWDM with SONET framing. IS-IS protocol used to route traffic
inside the network. IP-level restoration
When an IP link fails, all routers in the network independently compute a new path around the failure
No protection in the underlying optical infrastructure.
5
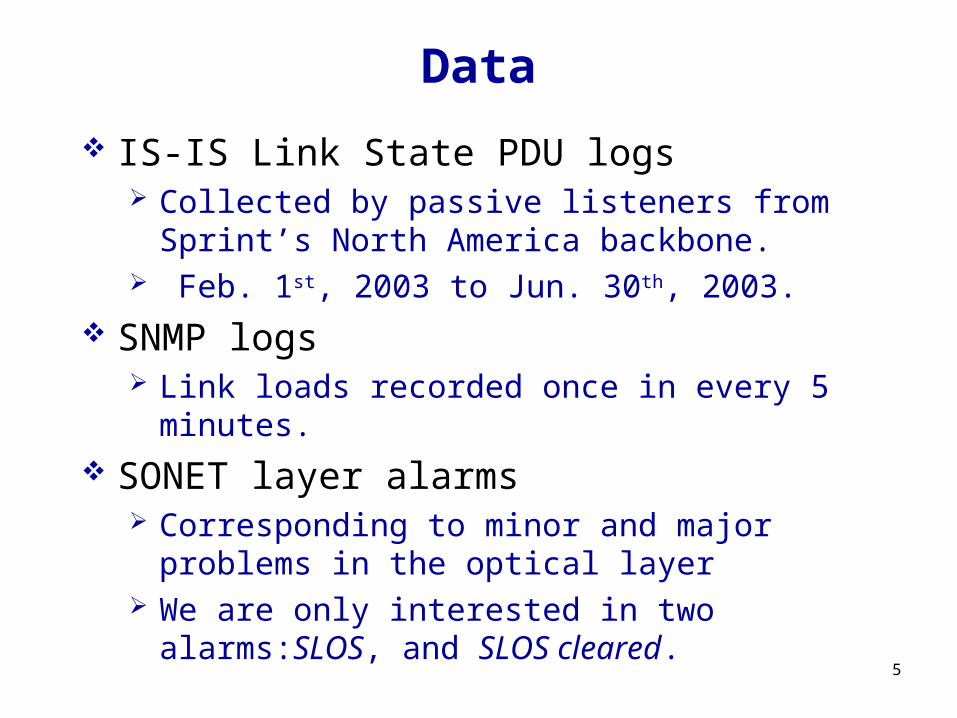
Data
IS-IS Link State PDU logs Collected by passive listeners from Sprint’s
North America backbone. Feb. 1st, 2003 to Jun. 30th, 2003.
SNMP logs Link loads recorded once in every 5
minutes. SONET layer alarms
Corresponding to minor and major problems in the optical layer
We are only interested in two alarms:SLOS, and SLOS cleared.
6
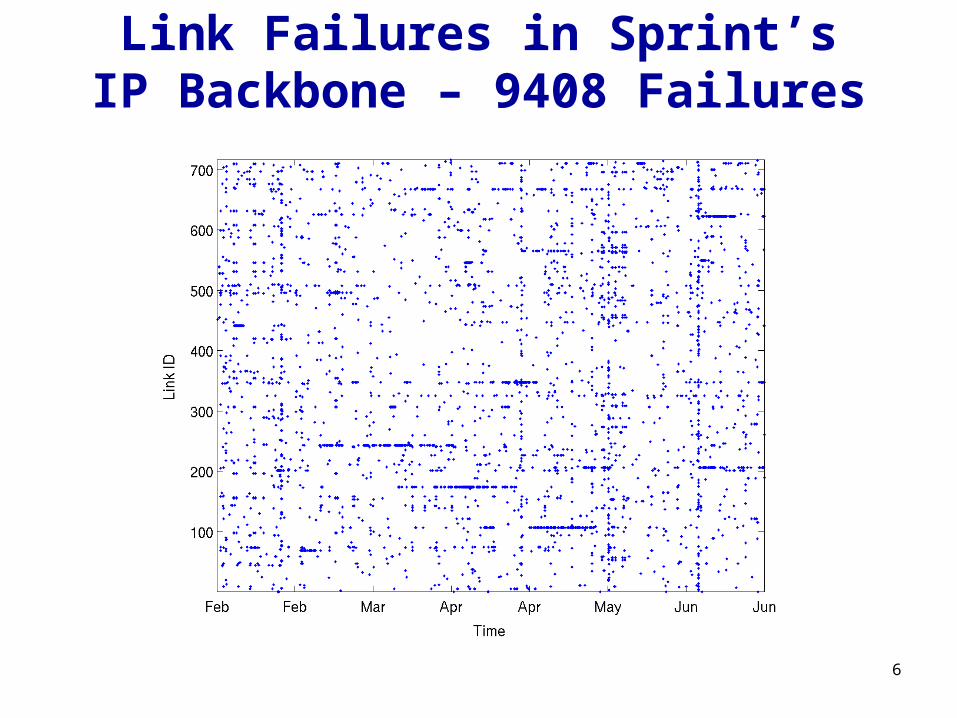
Link Failures in Sprint’s IP Backbone – 9408 Failures

7
Inter-POP vs. Intra-POP
ANA-2
ANA-3
ANA-1
ANA-4
8
Outline
Background Sprint’s IP backbone Data
Impact Metrics Time-based metrics Link-based metrics
Measurements Reducing the impact
Identifying critical failures Causes analysis Reducing critical failures
9
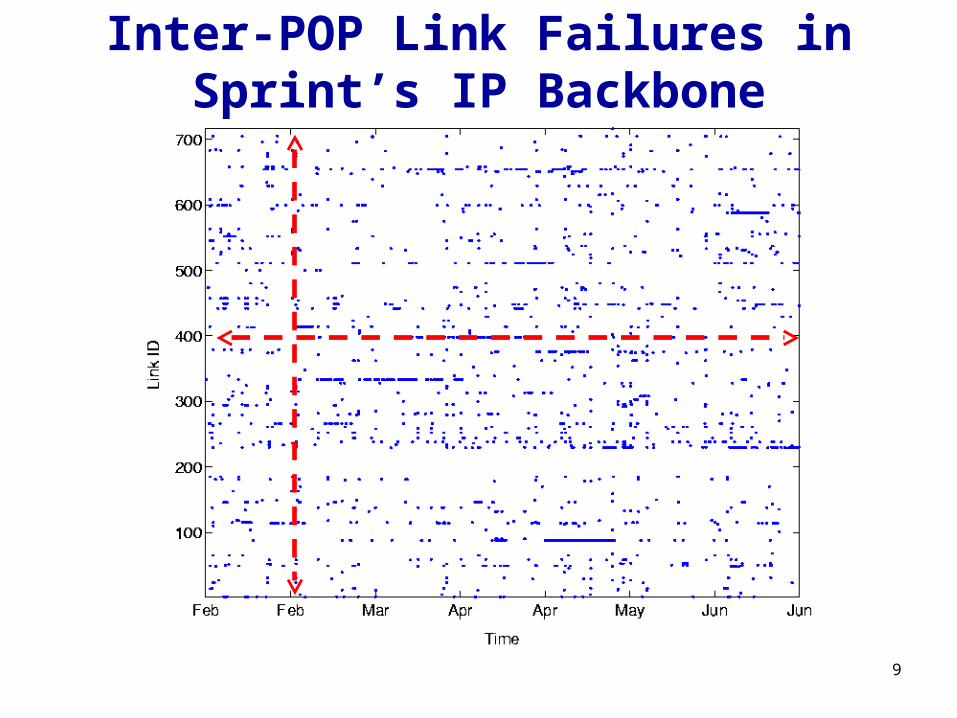
Inter-POP Link Failures in Sprint’s IP Backbone

10
Two Perspectives
For a given impact metric Time-based analysis: Measure the
impact of failures on the given metric as a function of time.
Link-based analysis: Measure the impact of failures on the given metric as a function of failing links.

11
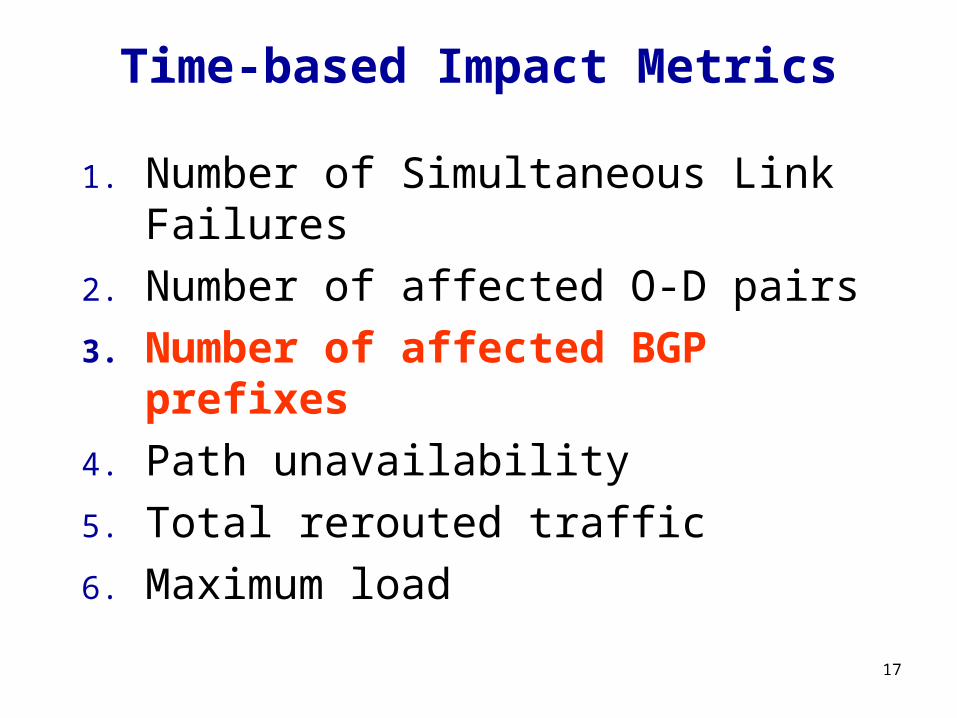
Time-based Impact Metrics
1. Number of Simultaneous Link Failures
2. Number of affected O-D pairs3. Number of affected BGP prefixes4. Path unavailability5. Total rerouted traffic6. Maximum load

12
Number of Simultaneous Failures

13
Number of Simultaneous Failures

14
1. Number of Simultaneous Link Failures
2. Number of affected O-D pairs3. Number of affected BGP prefixes4. Path unavailability5. Total rerouted traffic6. Maximum load
Time-based Impact Metrics
15
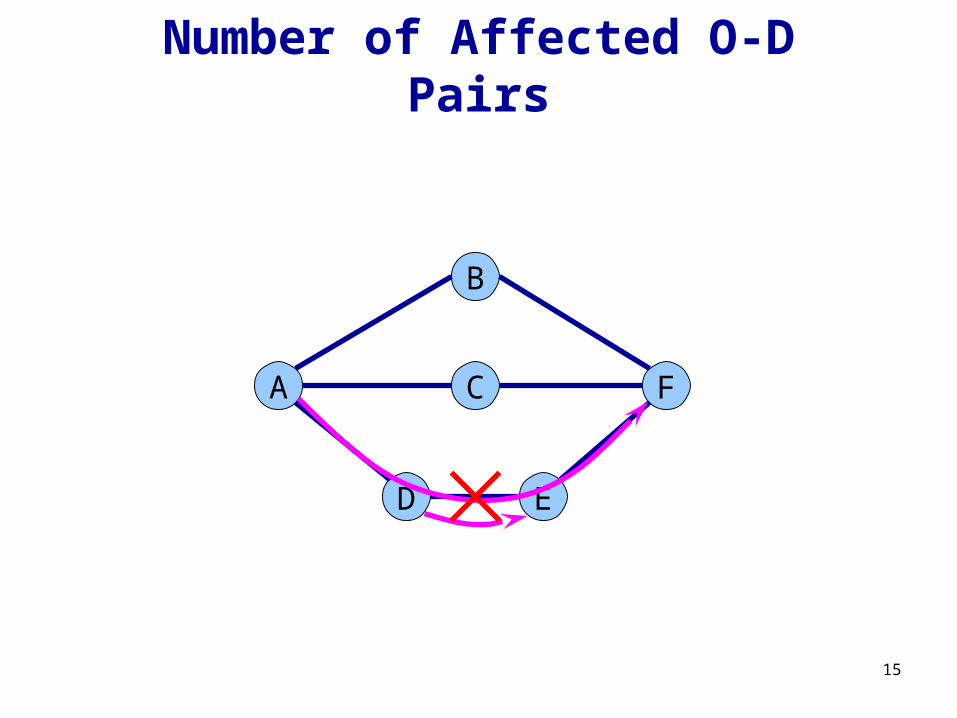
Number of Affected O-D Pairs
A C F
B
D E

16
Number of Affected O-D Pairs
17
1. Number of Simultaneous Link Failures
2. Number of affected O-D pairs3. Number of affected BGP
prefixes4. Path unavailability5. Total rerouted traffic6. Maximum load
Time-based Impact Metrics
18
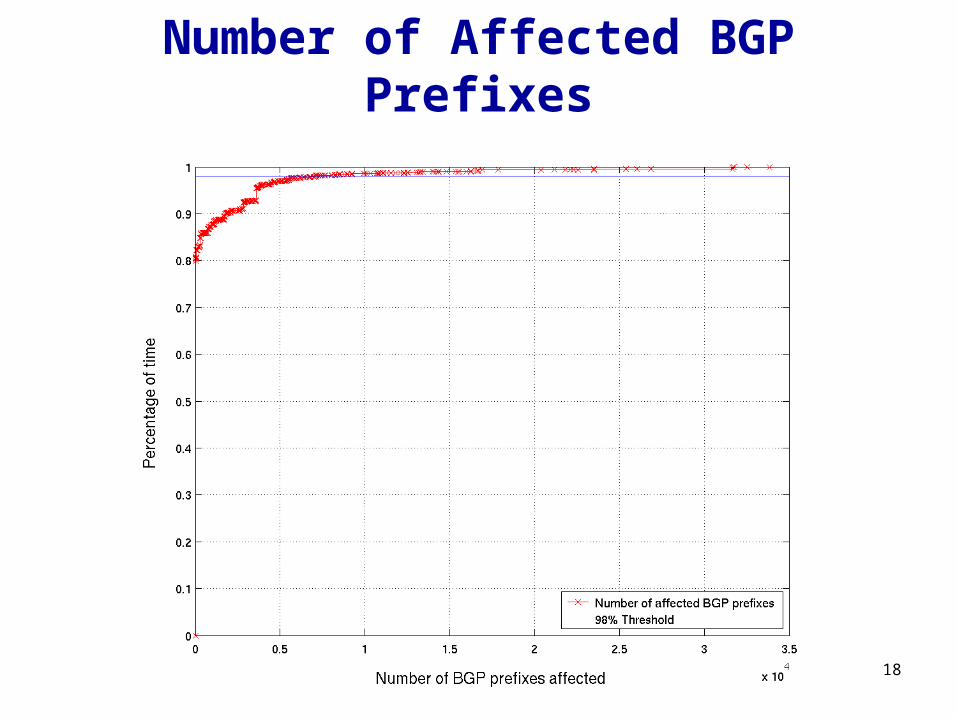
Number of Affected BGP Prefixes

19
Time-based Impact Metrics
1. Number of Simultaneous Link Failures
2. Number of affected O-D pairs3. Number of affected BGP prefixes4. Path unavailability5. Total rerouted traffic6. Maximum load
20
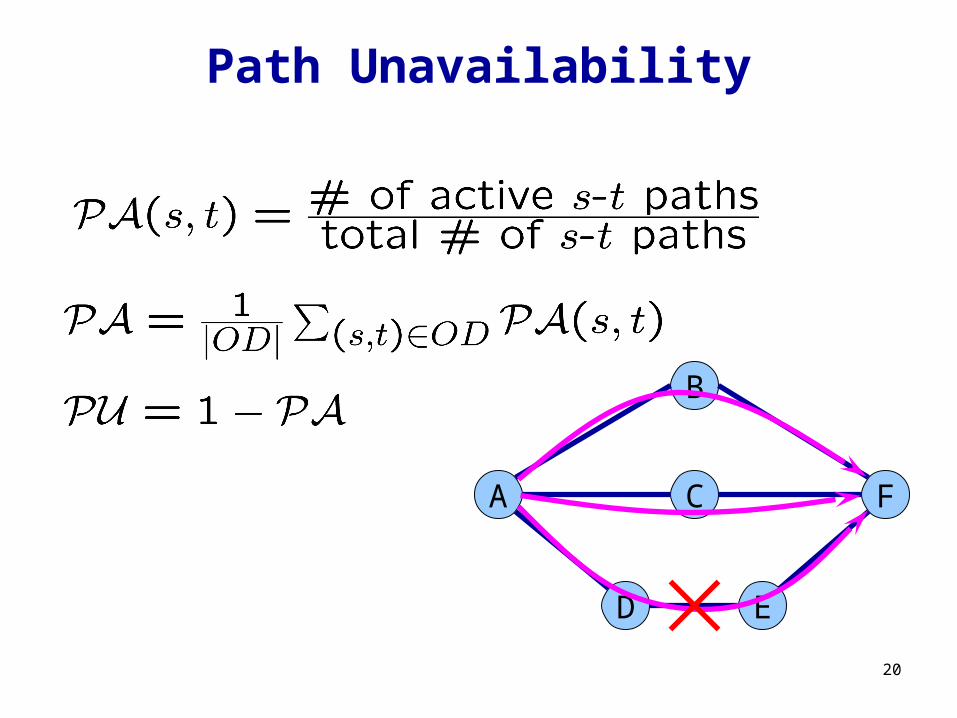
Path Unavailability
A C F
B
D E

21
Path Unavailability

22
Time-based Impact Metrics
1. Number of Simultaneous Link Failures
2. Number of affected O-D pairs3. Number of affected BGP prefixes4. Path unavailability5. Total rerouted traffic6. Maximum load
23
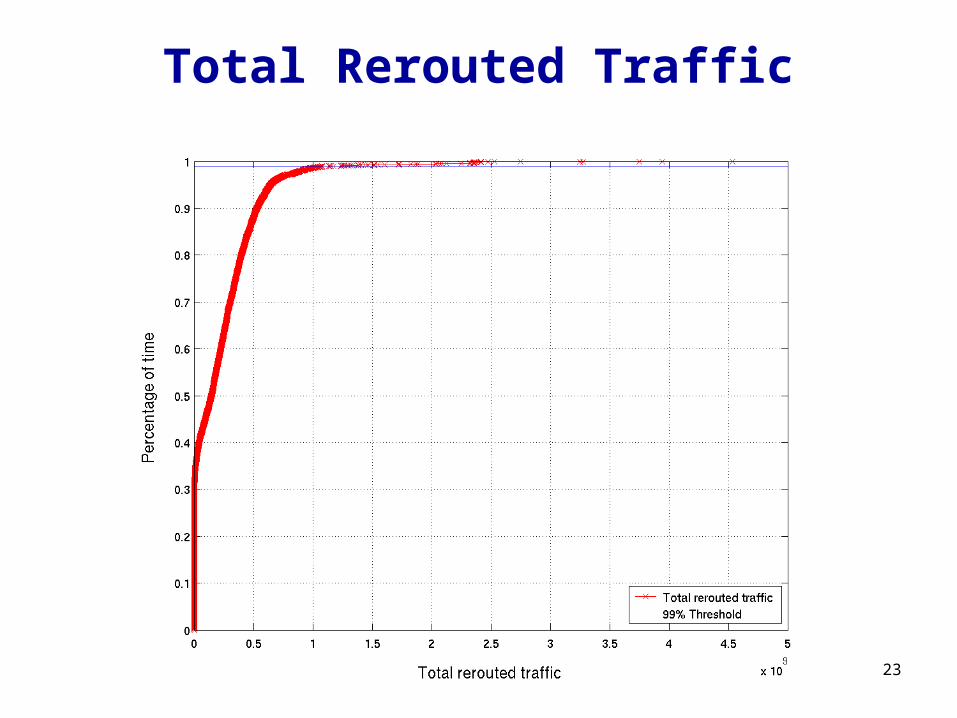
Total Rerouted Traffic

24
Time-based Impact Metrics
1. Number of Simultaneous Link Failures
2. Number of affected O-D pairs3. Number of affected BGP prefixes4. Path unavailability5. Total rerouted traffic6. Maximum load

25
Maximum Load Throughout the Network

26
Maximum Load Throughout the Network
96% of link failures were
not followed by an immediate
change in maximum load.
27
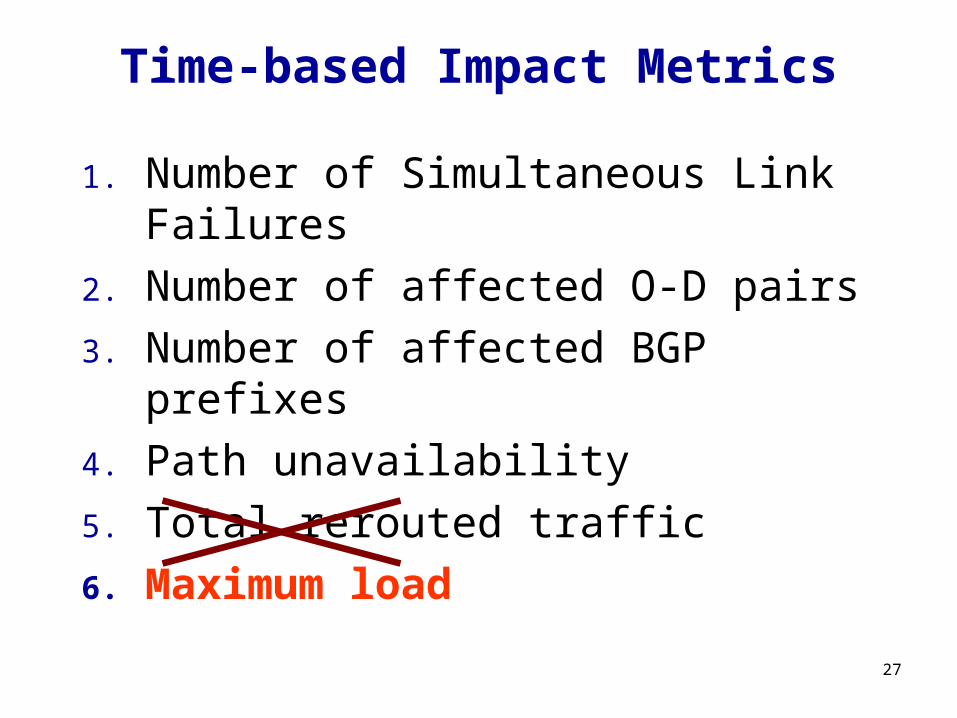
Time-based Impact Metrics
1. Number of Simultaneous Link Failures
2. Number of affected O-D pairs3. Number of affected BGP prefixes4. Path unavailability5. Total rerouted traffic6. Maximum load

28
Number of Failures per Link
29
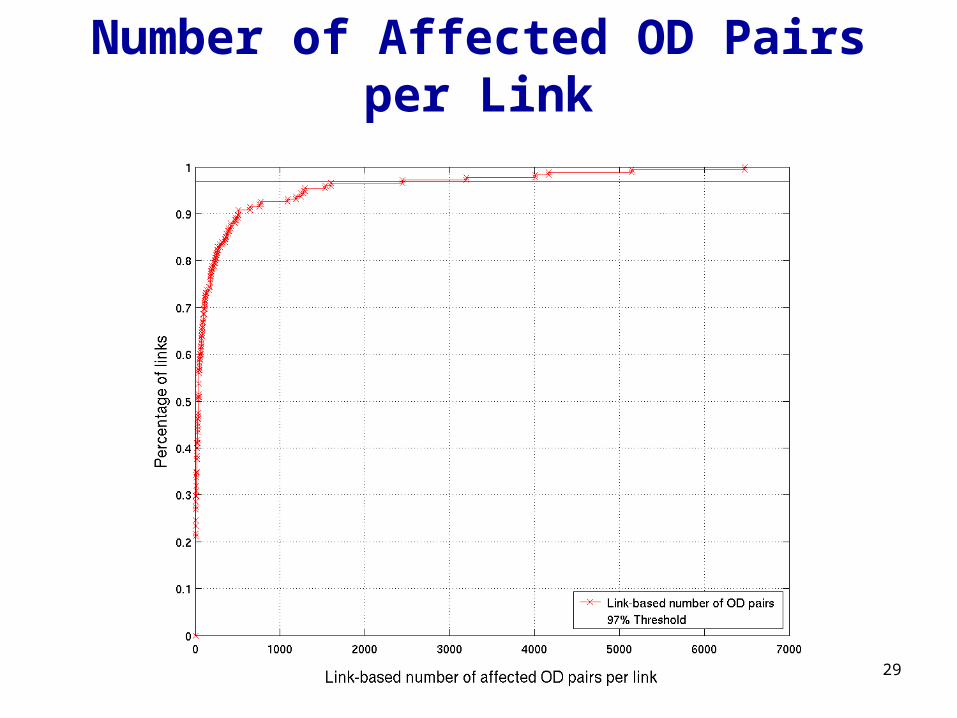
Number of Affected OD Pairs per Link

30
Number of Affected BGP Prefixes per Link
31
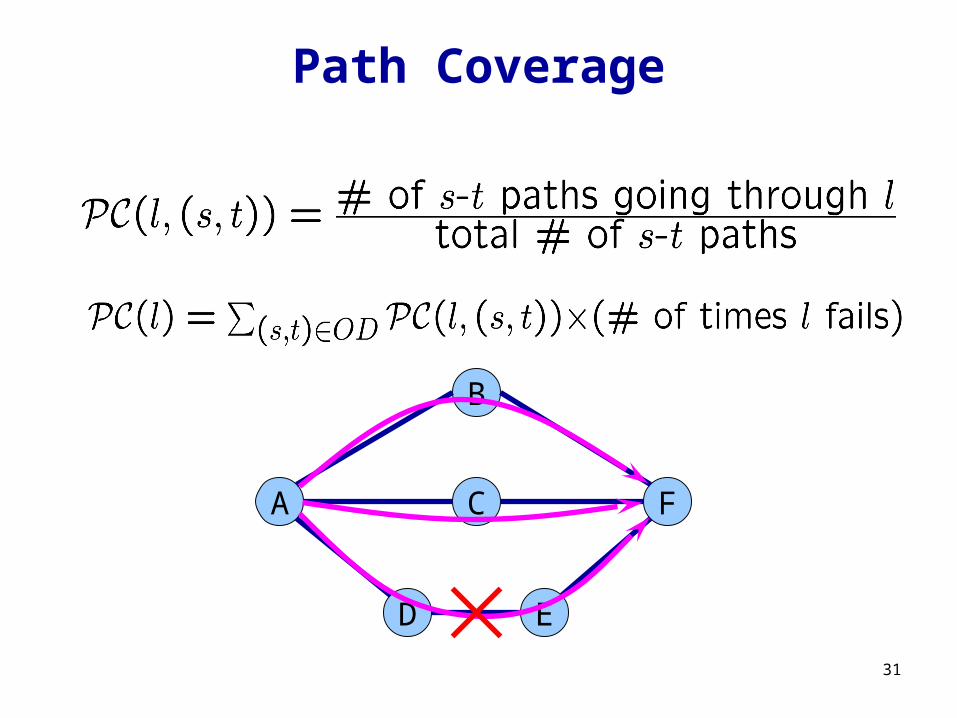
Path Coverage
A C F
B
D E

32
Path Coverage of Links
33
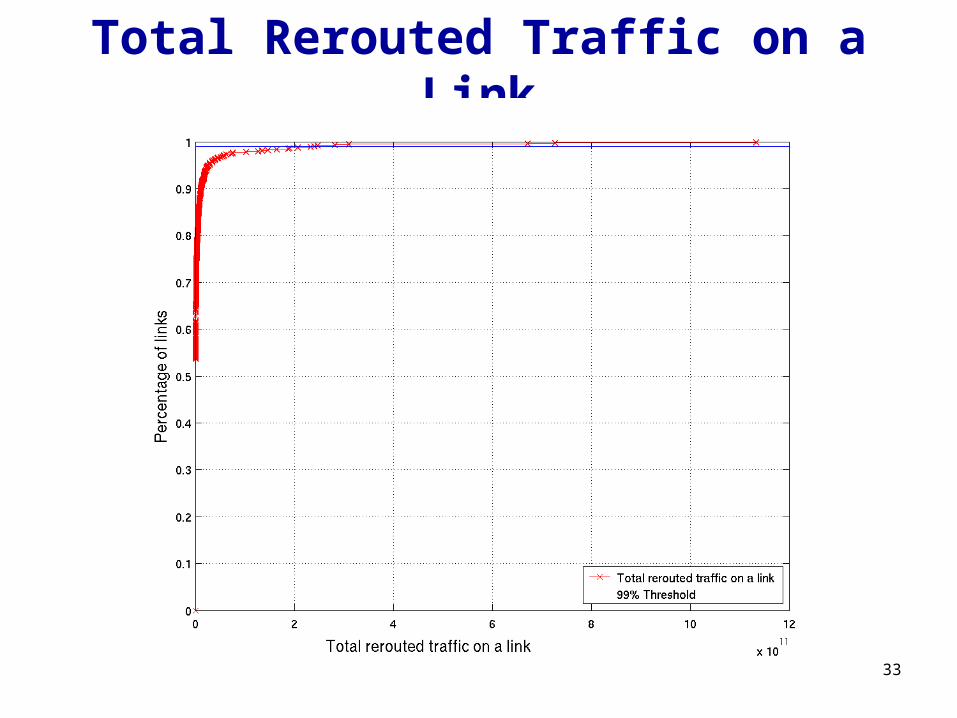
Total Rerouted Traffic on a Link

34
Peak Factor of a Link
35
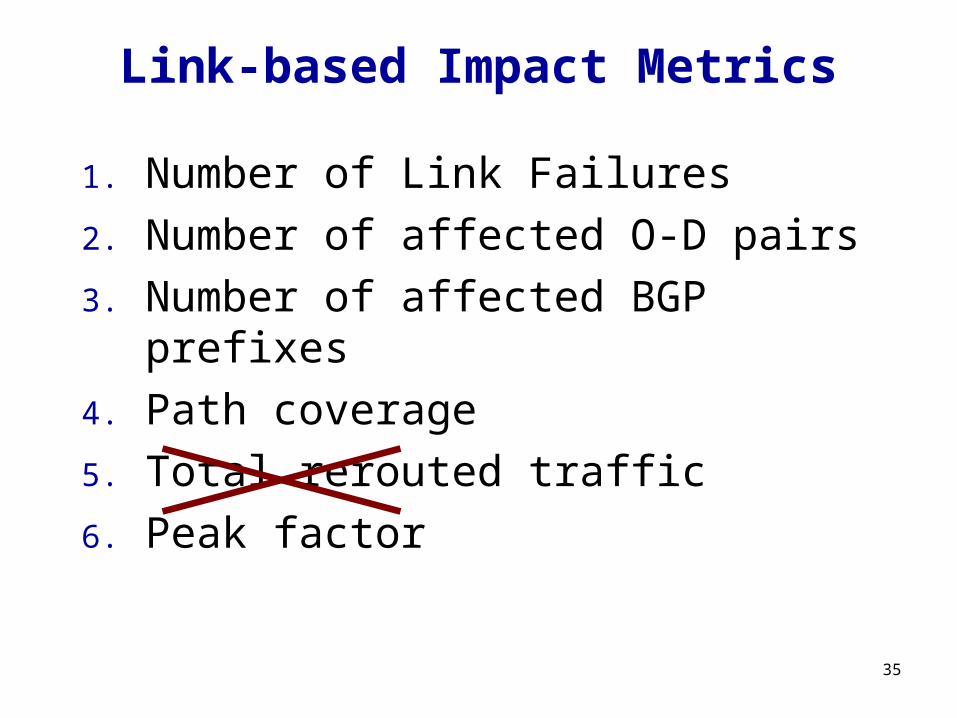
Link-based Impact Metrics
1. Number of Link Failures2. Number of affected O-D pairs3. Number of affected BGP prefixes4. Path coverage5. Total rerouted traffic6. Peak factor

36
Outline
Background Sprint’s IP backbone Data
Impact Metrics Time-based metrics Link-based metrics
Measurements Reducing the impact
Identifying critical failures Causes analysis Reducing critical failures
37
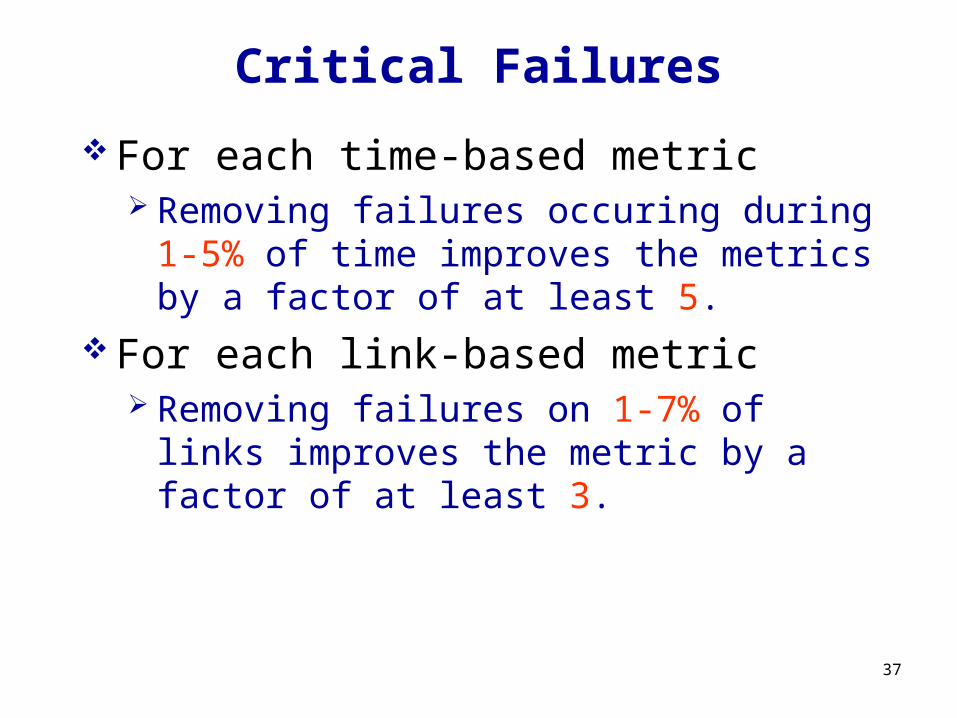
Critical Failures
For each time-based metric Removing failures occuring during 1-
5% of time improves the metrics by a factor of at least 5.
For each link-based metric Removing failures on 1-7% of links
improves the metric by a factor of at least 3.
38
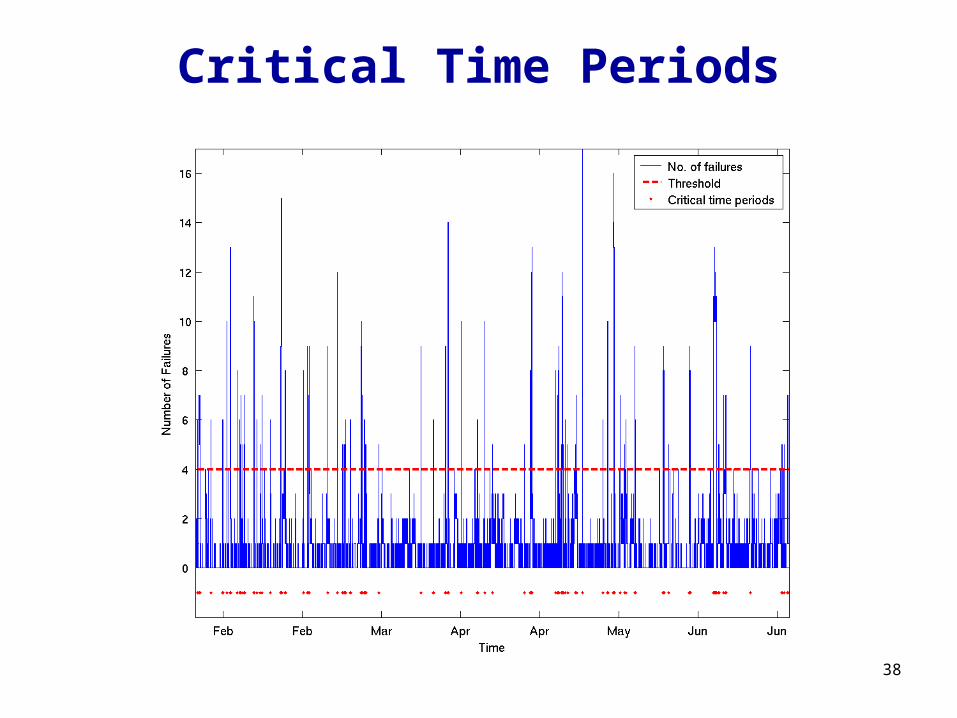
Critical Time Periods

39
Critical Links
Any link which has a critical failures, is called a Critical Link.
We are interested in fixing such links.

40
Correlation of Critical Sets
41
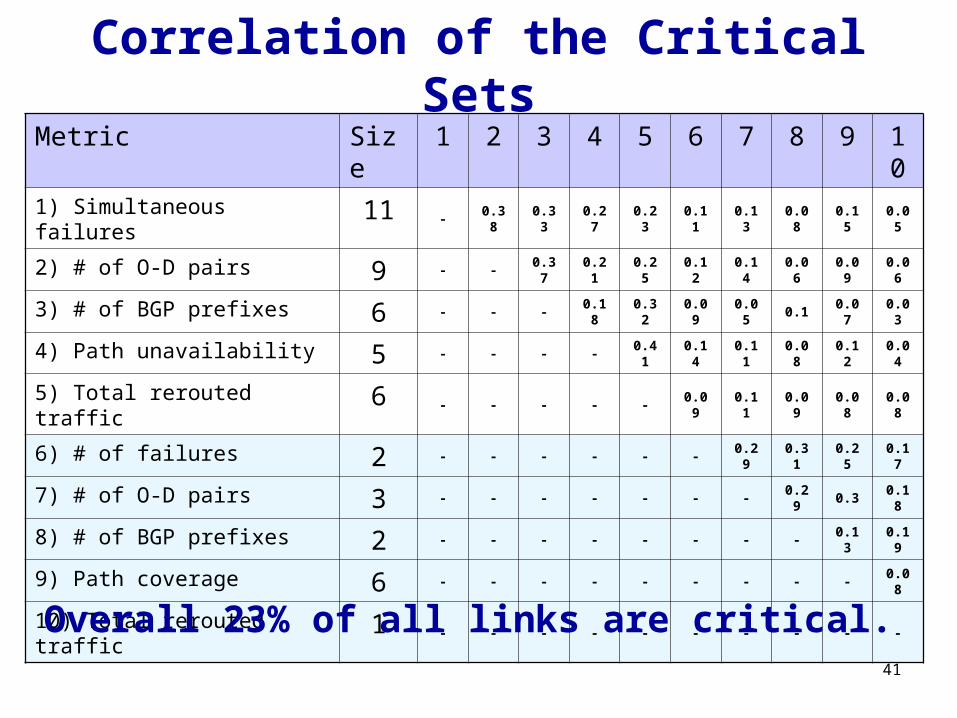
Correlation of the Critical Sets
Metric Size 1 2 3 4 5 6 7 8 9 10
1) Simultaneous failures 11 -0.38
0.33
0.27
0.23
0.11
0.13
0.08
0.15
0.05
2) # of O-D pairs 9 - -0.37
0.21
0.25
0.12
0.14
0.06
0.09
0.06
3) # of BGP prefixes 6 - - -0.18
0.32
0.09
0.05
0.10.07
0.03
4) Path unavailability 5 - - - -0.41
0.14
0.11
0.08
0.12
0.04
5) Total rerouted traffic 6 - - - - -0.09
0.11
0.09
0.08
0.08
6) # of failures 2 - - - - - -0.29
0.31
0.25
0.17
7) # of O-D pairs 3 - - - - - - -0.29
0.30.18
8) # of BGP prefixes 2 - - - - - - - -0.13
0.19
9) Path coverage 6 - - - - - - - - -0.08
10) Total rerouted traffic 1 - - - - - - - - - -
Overall 23% of all links are critical.

42
Cause Analysis
Markopoulou et al. have used IS-IS update messages for characterizing link failures into the following categories [MIB+04]. Maintenance Unplanned
• Shared failures– Router-related– Optical-related– Unspecified
• Individual failures
About 70% of all unplanned
failures
43
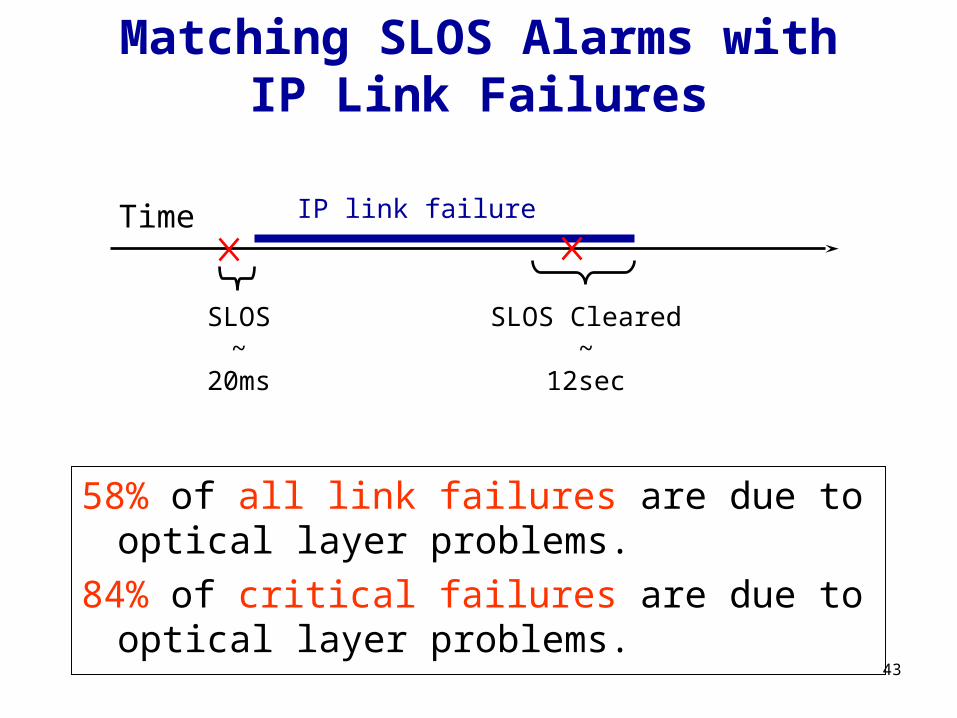
Matching SLOS Alarms with IP Link Failures
Time IP link failure
SLOS~
20ms
SLOS Cleared~
12sec
58% of all link failures are due to optical layer problems.
84% of critical failures are due to optical layer problems.
44
Reducing Critical Failures
Replace old optical fibers/parts.
Optical Protection.
Push the traffic away. Also works for maximum load and
peak factor.

45
Performance Improvement
Time-based metrics Link-based MetricsMetric
% improvement
Metric%
improvement
# of failures# of affected O-D pairs
# of BGP prefixesPath unavailability
Total rerouted traffic
4136323929
# of failures# of affected O-D pairs
# of BGP prefixesPath coverage
Total rerouted traffic
4537294238
46
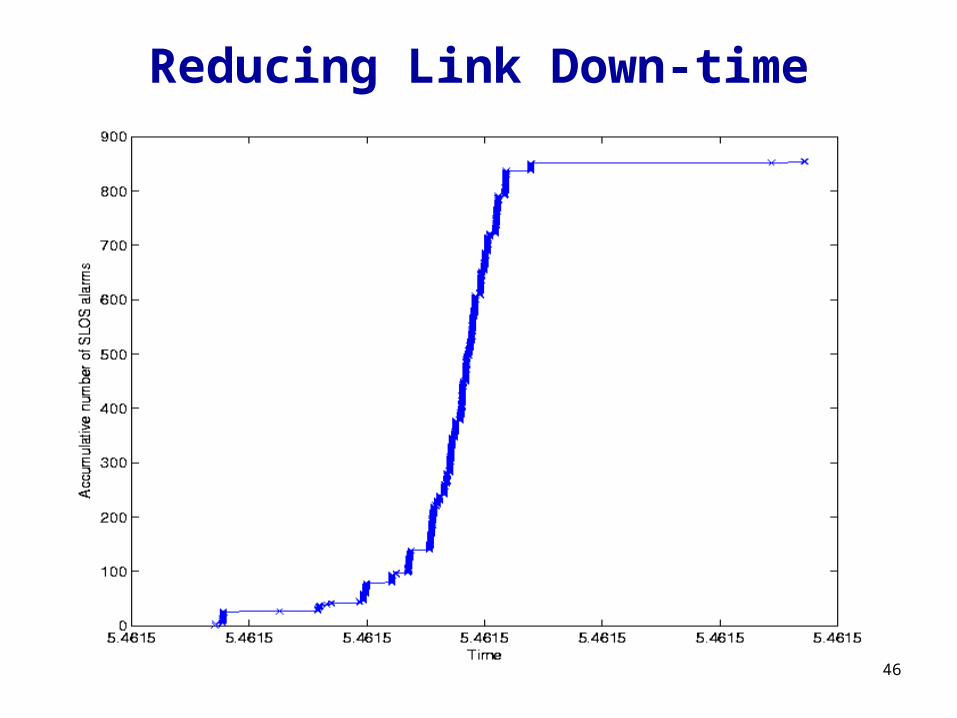
Reducing Link Down-time
Low-failure links: Failure are very rare. Damping doesn’t help.
High-failure links: Failure rate changes very slowly. Fixed damping is wasteful.

47
Adaptive Damping
Input: : time difference between the last two failures: threshold: constant
function Adaptive_Dampingbegin
if ( < )ADT := x ;
elseADT := 0;
end;
Output:ADT: Adaptive damping timer

48
Number – Duration Pareto Curve

49
Thank you!
Related Documents