1 Laboratory of Analytical Chemistry, Department of Chemistry University of Athens, Panepistimioupolis Zografou, Athens, Greece. 2 Wadsworth Center, New York State, Department of Health, and Department of Environmental Health Sciences, School of Public Health, State University of New York at Albany, Albany, NY, USA. Alexandros G. Asimakopoulos Alexandros G. Asimakopoulos 1 1 ,2 ,2 , , Kurunthachalam Kannan Kurunthachalam Kannan 2 , , Nikolaos S. Nikolaos S. Thomaidis Thomaidis 1

Welcome message from author
This document is posted to help you gain knowledge. Please leave a comment to let me know what you think about it! Share it to your friends and learn new things together.
Transcript

1Laboratory of Analytical Chemistry, Department of Chemistry, University of Athens, Panepistimioupolis Zografou, Athens, Greece.2Wadsworth Center, New York State, Department of Health, and Department of Environmental Health Sciences, School of Public Health, State University of New York at Albany, Albany, NY, USA.
Alexandros G. AsimakopoulosAlexandros G. Asimakopoulos11,2,2,,
Kurunthachalam KannanKurunthachalam Kannan22, , Nikolaos S. ThomaidisNikolaos S. Thomaidis11

Benzotriazoles (BTRs) – Benzothiazoles (BTHs): Benzotriazoles (BTRs) – Benzothiazoles (BTHs): Uses & ApplicationsUses & Applications
N
N
N
R
R
R
RR
:
BTHs contain the 1,3-benzothiazole skeleton in their structure.
R: chemical group or atom
R: chemical group or atom
BTRs contain the 1,2,3-benzotriazole skeleton in their structure.

Target chemicals assessed in the WWTPTarget chemicals assessed in the WWTP
BTRs :
1. 1H-benzotriazole
(1H-BTR)
2. 1-hydroxy-benzotriazole
(1-OH-BTR)
3. Tolyltriazole
(TTR, a mixture of isomers of
4-methyl-1H-benzotriazole [4-Me-1H-BTR]
and 5-methyl-1H-benzotriazole [5-Me-1H-BTR])
4. Xylyltriazole
(XTR, or 5,6-dimethyl-1H-benzotriazole
[5,6-diMe-1H-BTR])
BTHs:
1. benzothiazole
(BTH)
2. 2-hydroxy-benzothiazole
(2-OH-BTH)
3. 2-methylthio-benzothiazole
(2-Me-S-BTH)
4. 2-amino-benzothiazole
(2-amino-BTH)
Polar compounds. BTRs are weak bases.
BTHs present both acidic and basic properties.

Schematic diagram of Treatment ProcessSchematic diagram of Treatment Process

Sample collectionSample collection
Wastewater and sludge samples were collected from a WWTP that serves a population of 3.700.000, in Athens.
Samples were collected in April 2012; the average flow rate of sewage was approx. 743.000 m3/day, and the average production of dewatered sludge was approx. 112.000 kg/day.
Influent and effluent samples (50 mL), primary sludge (5 mL), secondary sludge (20 mL), and mixed liquor samples from the bioreactors (20 mL) were immediately filtered after collection.
All solid samples were stored at −20 °C until analysis.
The filtered wastewater samples were acidified to pH 2.50±0.10, and stored in the dark at 4 °C until analysis.

Schematic diagram of the analytical method Schematic diagram of the analytical method
Filtrate
Filter
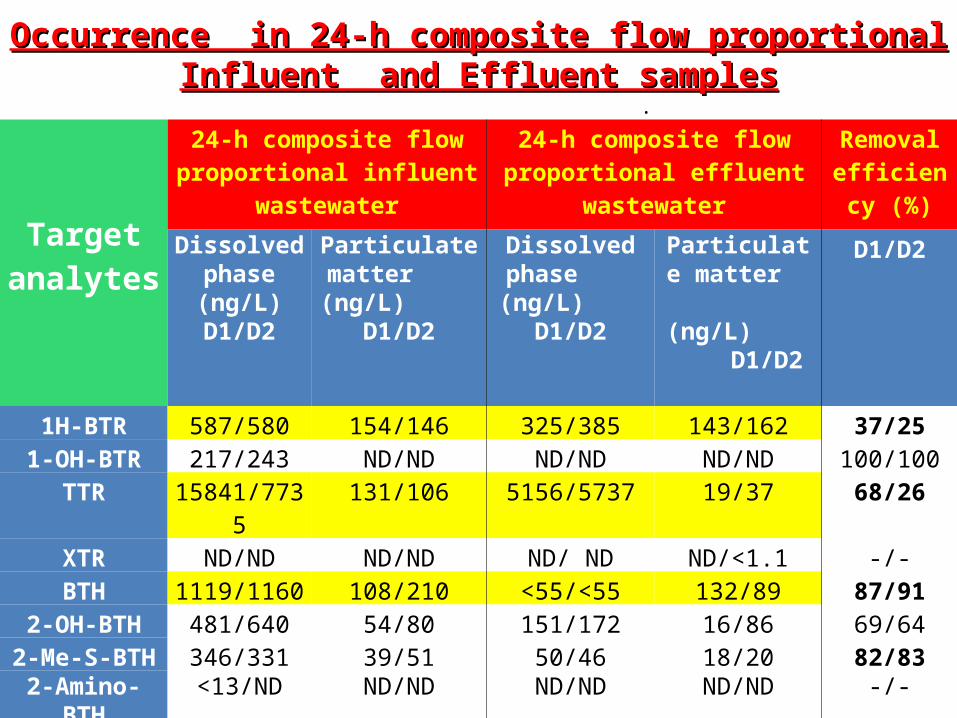
Occurrence in 24-h composite flow proportional Influent Occurrence in 24-h composite flow proportional Influent and Effluent samplesand Effluent samples
.
Target analytes
24-h composite flow proportional influent
wastewater
24-h composite flow proportional effluent
wastewater
Removal efficiency
(%)Dissolved
phase (ng/L) D1/D2
Particulate matter (ng/L)
D1/D2
Dissolved phase (ng/L) D1/D2
Particulate matter (ng/L)
D1/D2
D1/D2
1H-BTR 587/580 154/146 325/385 143/162 37/251-OH-BTR 217/243 ND/ND ND/ND ND/ND 100/100
TTR 15841/7735 131/106 5156/5737 19/37 68/26XTR ND/ND ND/ND ND/ ND ND/<1.1 -/-BTH 1119/1160 108/210 <55/<55 132/89 87/91
2-OH-BTH 481/640 54/80 151/172 16/86 69/642-Me-S-BTH 346/331 39/51 50/46 18/20 82/83
2-Amino-BTH <13/ND ND/ND ND/ND ND/ND -/-

Occurrence in primary and secondary sludge & influent Occurrence in primary and secondary sludge & influent bioreactor samples bioreactor samples
.
Target analytes
Primary sludge (grab samples)
Influent bioreactor (grab samples)
Secondary sludge (grab samples)
Dissolved phase (ng/L)D1/ D2
Particulate matter (ng/g)D1/ D2
Dissolved phase (ng/L)D1/ D2
Particulate matter (ng/g)D1/ D2
Dissolved phase (ng/L)D1/ D2
Particulate matter (ng/g)D1/ D2
1H-BTR 2621/4514 17/10 141/125 38/39 531/665 27/26
1-OH-BTR 173/ND ND/ND ND/ND ND/ND ND/ND 31/35
TTR 27109/210883 16/71 6123/4639 22/71 4964/6383 23/32
XTR ND/ND 1/ND ND/ND 1/1 ND/ND ND/ND
BTH 10543/14010 <41/<41 ND/172 ND/<41 288/ND <41.3/ND
2-OH-BTH 11545/30224 102/93 207/102 35/44 175/216 21/29
2-Me-S-BTH 1250/1887 26/33 ND/ND 29/21 ND/ND 25/28
2-Amino-BTH 108/248 ND/ND <34/<34 ND/ND <34/ND ND/ND• A major portion is biotransformed during the activated sludge treatment process.

Occurrence in Sewage sludgeOccurrence in Sewage sludge
.Target
analytes
Sewage Sludge (ng/g)D1/D2
1H-BTR 81/841-OH-BTR ND/ND
TTR 116/107XTR ND/NDBTH 174/88
2-OH-BTH 74/332-Me-S-BTH 61/61
2-Amino-BTH ND/ND Removal by y sorption onto
sludge seems insignificant.

Distribution of BTRDistribution of BTRss and BTHs between aqueous and BTHs between aqueous phase and suspended solids in influent phase and suspended solids in influent
and effluent wastewaterand effluent wastewater
The presence of exocellular biopolymers on the surfaces of biosolids following secondary treatment creates favorable conditions for higher sorption onto particulates present in bioreactors and secondary sludge.

Solid-Liquid Distribution Coefficients, Solid-Liquid Distribution Coefficients, Log Kd of BTRs & BTHsLog Kd of BTRs & BTHs
Target Analytes
Primarysludge
Influent bioreactor
Secondary sludge
1H-BTR 0.58 1.65 2.46
TTR 0.35 0.68 0.86
BTH 0.32 1.99 2.17
2-OH-BTH 0.72 2.11 2.43
2-Me-S-BTH 1.28 -* -*
2-Amino-BTH 0.41 -* -**Concentrations were not detectable
Both BTRs & BTHs have low affinity for primary sludge and this changed gradually in biosolids from the bioreactor and the secondary sludge. However, log Kd values were lower than 2.5.

Average Daily Loadings & DischargesAverage Daily Loadings & Discharges

Summary (1/2)Summary (1/2)
Biotransformation of some BTHs had been reported, and this contributes significantly to their removal during wastewater treatment. A similar mechanism is expected for BTRs.
The removal efficiencies for BTHs calculated agree with the results from previous studies.
The concentrations of 1H-BTR and TTR in sludge from Athens were similar to those reported previously. Only one study had reported BTH concentrations in sludge, where BTH, 2-Me-S-BTH and 2-OH-BTH were found approximately three times higher than the values reported here.

Summary (2/2)Summary (2/2)
Based on the results of the influent and effluent wastewater samples, most of the target analytes were determined in all samples at concentrations similar to or lower than those reported for other WWTP samples.
This is the first environmental study that analyzed the particulate matter of wastewater for these compounds.
Distribution between aqueous phase and suspended solids in influent and effluent wastewater, and calculation of solid-liquid distribution coefficients were reported for the first time for these compounds.

This project was implemented under the Operational Program “Education and Lifelong Learning” and funded by the
European Union (European Social Fund) and National Resources — THALIS.
AcknowledgementsAcknowledgements

ReferenceReference
Related Documents