1 Kent S. Sorenson, Jr. Ryan A. Wymore Enhanced Bioremediation for Treatment of Chlorinated Solvent Residual Source Areas – Case Study and Implications

1 Kent S. Sorenson, Jr. Ryan A. Wymore Enhanced Bioremediation for Treatment of Chlorinated Solvent Residual Source Areas – Case Study and Implications.
Dec 18, 2015
Welcome message from author
This document is posted to help you gain knowledge. Please leave a comment to let me know what you think about it! Share it to your friends and learn new things together.
Transcript

1
Kent S. Sorenson, Jr.
Ryan A. Wymore
Enhanced Bioremediation for Treatment of Chlorinated Solvent
Residual Source Areas –Case Study and Implications

2
Bioremediation Background
• In Situ Bioremediation of chlorinated solvents:– Solvents utilized as electron acceptors by
indigenous microorganisms– Chlorine atoms sequentially replaced with
hydrogen through “reductive dechlorination”

3
Microbial Metabolism
Food
E lectron D onorE lectron A cceptor
O 2
E lectronD onor
R esp ira tionP roducts
E lectronA cceptor
+ + E nergy
4
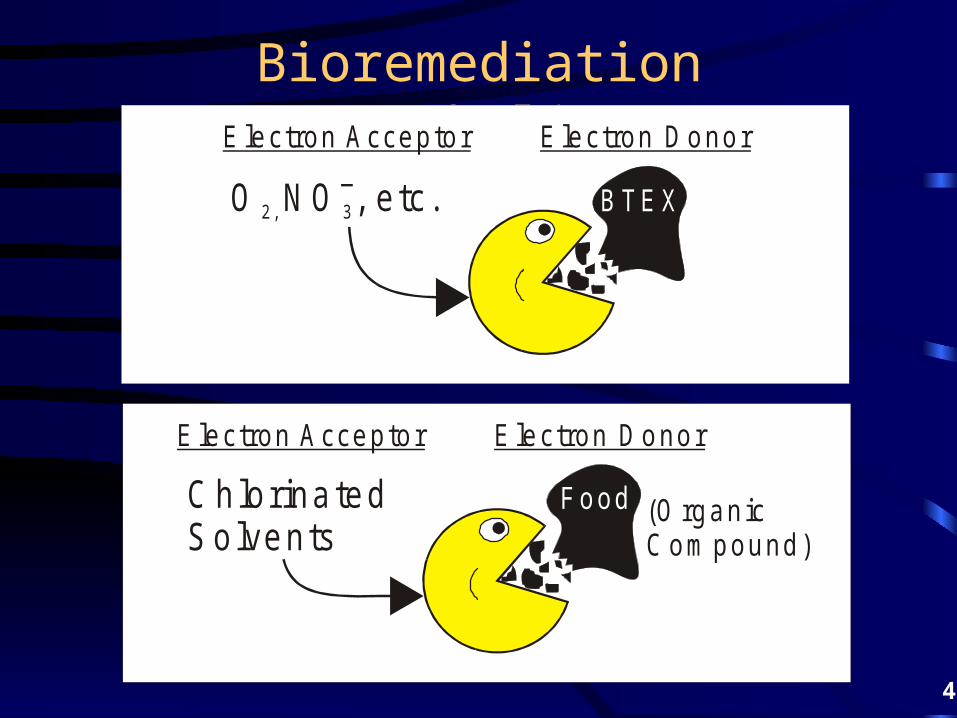
Bioremediation Metabolism
B TEX
Food (O rganicC om pound)
E lectron D onor
E lectron D onor
E lectron A cceptor
E lectron A cceptor
C hlorina tedSolvents
O , etc.2, 3N O

5
Reductive Dechlorination
Pathway
C I
PCE
C
C
C
C
H
TCE
CC
H H
cis - 1,2 - DCE
H
CC
H H
Vinyl Chloride
H H
CC
H H
Ethene
H H
CC
H H
Ethane
HH
H
CC
H
1,1 - DCEH
CC
H
trans - 1,2 - DCE
O O
C
Com plete M ineralizationO
HH
C I
C
H
C hlorine A tom
C arbon Atom
H ydrogen A tom
S ingle Chem icalB ond
D ouble Chem ical B ond
Cl C l
C l
C l
C l
C l C l
C l
C l
C l
C l
C lC l
C lC l
M odified from W iedem eier et al., 1996
5

6
A Paradigm Shift?
• Conventional applications for in situ bioremediation limited to dissolved phase for two primary reasons:– Concerns about toxicity
– Impact on nonaqueous sources thought to be no better than pump and treat
• New research reveals that in situ bioremediation may be extremely effective for chlorinated solvent source areas

7
Enhanced Mass Transfer
• In situ bioremediation can enhance mass transfer, addressing the concerns previously thought to limit bioremediation applications:– Many investigators have shown that
dechlorinating bacteria actually have an ecological niche in high concentration areas
– Several studies have shown that in situ bioremediation enhances mass transfer of contaminants through at least three mechanisms

8
Mechanisms of Enhanced Mass Transfer
• Mechanisms for enhanced mass transfer– Bioremediation removes contaminants from the
aqueous phase, thereby increasing the driving force for mass transfer = k(Cs-C)
– Increasing solubility of reductive dechlorination degradation products greatly increases the maximum aqueous contaminant loading
– The electron donor solution can be used to decrease interfacial tension, thereby increasing the effective solubility

9
Enhanced Mass Transfer: Mechanisms 1 and 2
• Enhanced mass transfer of chlorinated solvent NAPLs due to reductive dechlorination has been demonstrated in at least two laboratory batch studies:– Yang and McCarty (2000) showed enhanced PCE
dissolution up to a factor of 5 higher than without reductive dechlorination
– Carr et al. (2000) showed reductions in NAPL longevity of 83% due to reductive dechlorination in continuously stirred tank reactors

10
Enhanced Mass Transfer: Mechanisms 1 and 2
• Enhanced mass transfer of chlorinated solvent NAPLs due to reductive dechlorination has been demonstrated in at least one laboratory column study:– Cope and Hughes (2001) demonstrated total
chlorinated ethene removal was 5 to 6 times higher with reductive dechlorination as compared to abiotic washout

11
Enhanced Mass Transfer: Mechanisms 1 and 2
• Enhanced chlorinated ethene removal due to reductive dechlorination in columns with PCE DNAPL (Courtesy of Joe Hughes)
0
0.2
0.4
0.6
0.8
1
1.2
1.4
1.6
0 6 12 18 24 30 36 42 48 54 60 66 72
Time, days
Cum
ulat
ive
Chl
orin
ated
Eth
enes
Rem
oved
(m
mol
)
LDC
IDC
HDC
'abiotic'

12
Enhanced Mass Transfer: Mechanism 3
• The impact of sodium lactate and other electron donor solutions on water-TCE interfacial tension was investigated in unpublished laboratory studies
• The results supported a pending patent for the Idaho National Engineering and Environmental Laboratory
• The process is referred to as Bioavailability Enhancement TechnologyTM (B.E.T.TM)

13
Impact of Electron Donor Solutions on Interfacial Tension
0
10
20
30
40
50
60
0.1 1 10 100
Lactate Concentration (%)
Inte
rfa
cia
l Te
ns
ion
(d
yn
e/c
m)
0% Solution B 0.1% Solution B 1% Solution B 10% Solution B
14
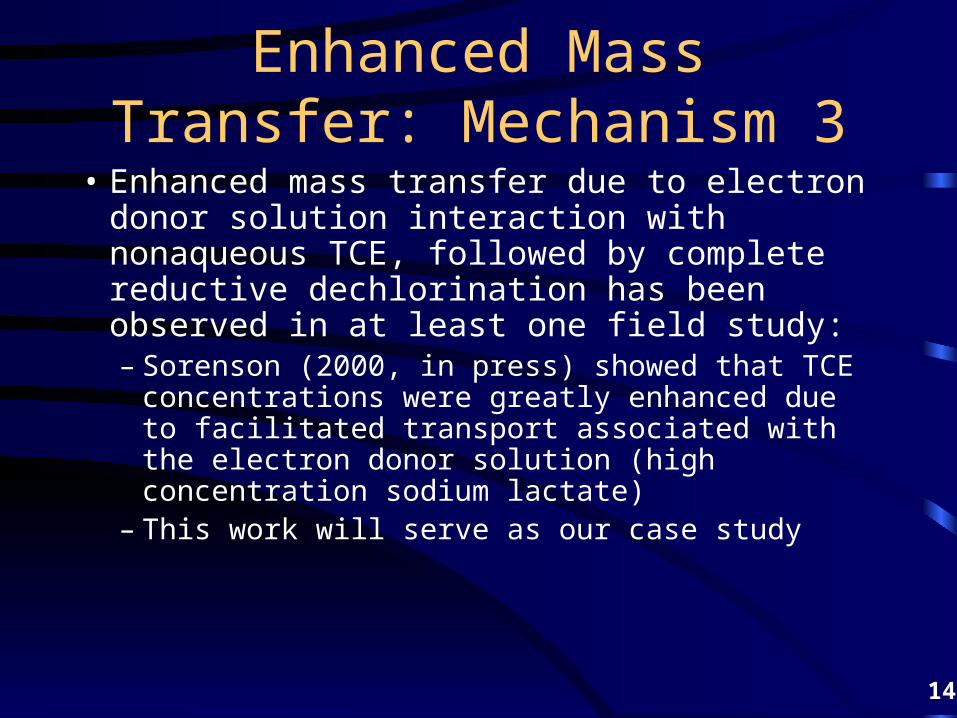
Enhanced Mass Transfer: Mechanism 3
• Enhanced mass transfer due to electron donor solution interaction with nonaqueous TCE, followed by complete reductive dechlorination has been observed in at least one field study:– Sorenson (2000, in press) showed that TCE
concentrations were greatly enhanced due to facilitated transport associated with the electron donor solution (high concentration sodium lactate)
– This work will serve as our case study

2 15

16
Test Area North (TAN) Background
• Industrial wastewater (including solvents), low-level radioactive wastes, and sanitary sewage were injected directly to the Snake River Plain Aquifer from the late 1950s to 1972
• TCE plume is nearly 2 miles long• Residual source area is about 100 ft in diameter• Contaminated aquifer is about 200-400 ft deep• Aquifer is comprised of fractured basalt

Groundwater Flow Direction
Groundwater Flow Direction
Approximate Plume Boundary
17

18
Record of Decision (1995)• Pump and treat selected as default remedy• Treatability studies established for alternative
technologies:– zero-valent iron– monolithic confinement– in situ chemical oxidation– in situ bioremediation– natural attenuation
• 100-year remedial time frame

19
Objectives for the 1-year In Situ Bioremediation Field Evaluation
• Primary Objective: Demonstrate that biodegradation of TCE can be significantly enhanced through electron donor addition
• Create hydraulic “treatment cell” to maintain hydraulic containment of the source area and control residence time
• Determine controls on process efficiency through extensive monitoring

2020

21

22
Electron Donor DistributionElectron Donor in TAN-37A
0
100
200
300
400
500
21-Dec-98 9-Feb-99 31-Mar-99 20-May-99
9-Jul-99 28-Aug-99
17-Oct-99
Date
Co
nce
ntr
atio
n-p
pm
Sum e Donor
COD
Electron Donor in TAN-37B (275') and C (379')
0
500
1000
1500
2000
2500
21-Dec-98
9-Feb-99 31-Mar-99
20-May-99
9-Jul-99 28-Aug-99
17-Oct-99
Date
Co
nce
ntr
atio
n-p
pm
COD
Sum e Donor
Electron Donor In TAN-25
0
1000
2000
3000
4000
5000
21-Dec-98
9-Feb-99 31-Mar-99
20-May-99
9-Jul-99 28-Aug-99
17-Oct-99
Date
Co
nce
ntr
atio
n-p
pm
Sum e- Donor
COD
Electron Donor in TAN-26
0
1000
2000
3000
4000
5000
6000
7000
8000
21-Dec-98
9-Feb-99 31-Mar-99
20-May-99
9-Jul-99 28-Aug-99
17-Oct-99
Date
Co
nce
ntr
atio
n-p
pm
COD
Sum e donor
22

Chemical Oxygen Demand Sept. 13, 1999
Feet
100 200 300
Im perm eable In terbed
TSF-05 37 28 29
200-ft F ractured BasaltAquifer
0
???
210-ft F ractured Basalt Unsaturated Zone(Not to Scale)
23
24
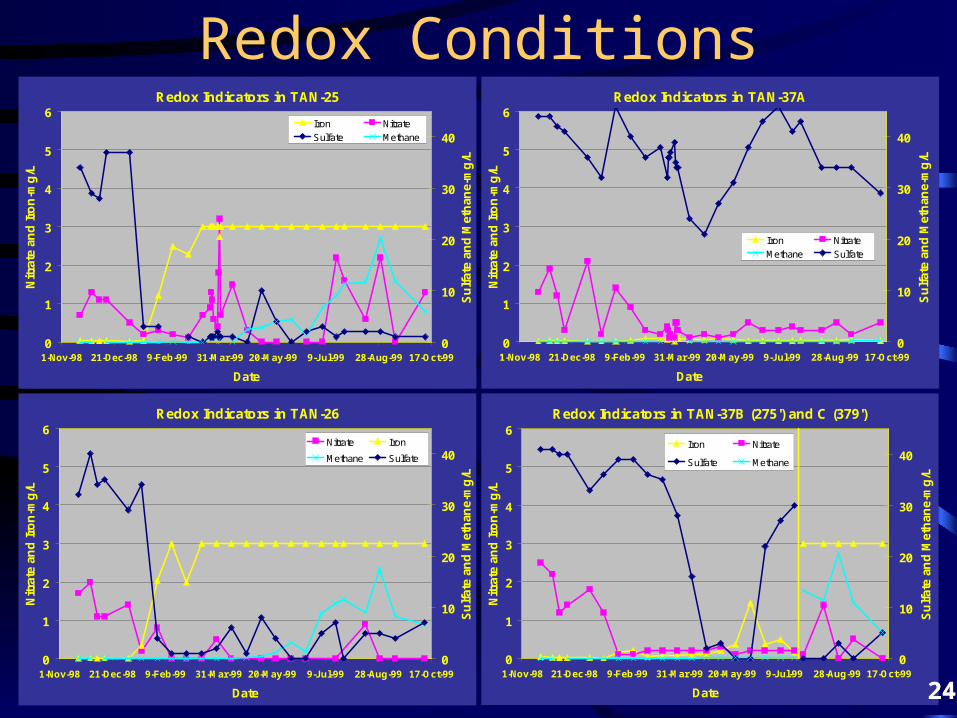
Redox Conditions
Redox Indicators in TAN-37B (275') and C (379')
0
1
2
3
4
5
6
1-Nov-98 21-Dec-98 9-Feb-99 31-Mar-99 20-May-99 9-Jul-99 28-Aug-99 17-Oct-99
Date
Nit
rate
an
d I
ron
-mg
/L
0
10
20
30
40
Su
lfat
e an
d M
eth
ane-
mg
/L
Iron Nitrate
Sulfate Methane
Redox Indicators in TAN-25
0
1
2
3
4
5
6
1-Nov-98 21-Dec-98 9-Feb-99 31-Mar-99 20-May-99 9-Jul-99 28-Aug-99 17-Oct-99
Date
Nit
rate
an
d I
ron
-mg
/L
0
10
20
30
40
Su
lfat
e an
d M
eth
ane-
mg
/L
Iron Nitrate
Sulfate Methane
Redox Indicators in TAN-26
0
1
2
3
4
5
6
1-Nov-98 21-Dec-98 9-Feb-99 31-Mar-99 20-May-99 9-Jul-99 28-Aug-99 17-Oct-99
Date
Nit
rate
an
d I
ron
-mg
/L
0
10
20
30
40S
ulf
ate
and
Met
han
e-m
g/L
Nitrate Iron
Methane Sulfate
Redox Indicators in TAN-37A
0
1
2
3
4
5
6
1-Nov-98 21-Dec-98 9-Feb-99 31-Mar-99 20-May-99 9-Jul-99 28-Aug-99 17-Oct-99
Date
Nit
rate
an
d I
ron
-mg
/L
0
10
20
30
40
Su
lfat
e an
d M
eth
ane-
mg
/L
Iron Nitrate
Methane Sulfate
24

TCEIsoplethsTAN-D2
TAN-9
TAN-31
TSF-05
TAN-25TAN-26 TAN-37
TAN-28
TAN-30A
TAN-10A
TAN-29
TAN-49
TAN-27
Pre-Lactate
25

March 29, 1999
TAN-D2TAN-9
TAN-31
TSF-05
TAN-25TAN-26
TAN-37TAN-28
TAN-30A
TAN-10A
TAN-29
TAN-49
TAN-27
26

July 20, 1999
TAN-D2TAN-9
TAN-31
TSF-05
TAN-25TAN-26
TAN-37TAN-28
TAN-30A
TAN-10A
TAN-29
TAN-49
TAN-27
27

October 11, 1999
TAN-D2TAN-9
TAN-31
TSF-05
TAN-25TAN-26
TAN-37TAN-28
TAN-30A
TAN-10A
TAN-29
TAN-49
TAN-27
28

January 10, 2000
TAN-D2TAN-9
TAN-31
TSF-05
TAN-25TAN-26
TAN-37TAN-28
TAN-30A
TAN-10A
TAN-29
TAN-49
TAN-27
29

April 10, 2000
TAN-D2TAN-9
TAN-31
TSF-05
TAN-25TAN-26
TAN-37TAN-28
TAN-30A
TAN-10A
TAN-29
TAN-49
TAN-27
30

July 5, 2000
TAN-D2TAN-9
TAN-31
TSF-05
TAN-25TAN-26
TAN-37TAN-28
TAN-30A
TAN-10A
TAN-29
TAN-49
TAN-27
31

October 23, 2000
TAN-D2TAN-9
TAN-31
TSF-05
TAN-25TAN-26
TAN-37TAN-28
TAN-30A
TAN-10A
TAN-29
TAN-49
TAN-27
32
33
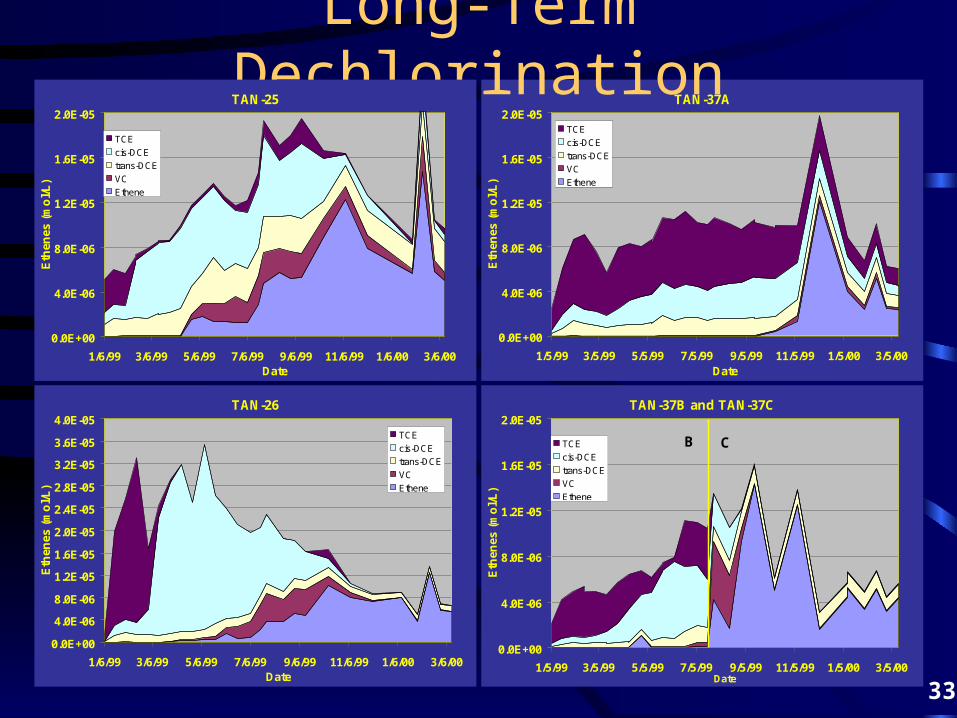
TAN-37B and TAN-37C
0.0E+00
4.0E-06
8.0E-06
1.2E-05
1.6E-05
2.0E-05
1/5/99 3/5/99 5/5/99 7/5/99 9/5/99 11/5/99 1/5/00 3/5/00Date
Eth
enes
(m
ol/
L)
TCE
cis-DCE
trans-DCE
VC
Ethene
B C
TAN-37A
0.0E+00
4.0E-06
8.0E-06
1.2E-05
1.6E-05
2.0E-05
1/5/99 3/5/99 5/5/99 7/5/99 9/5/99 11/5/99 1/5/00 3/5/00Date
Eth
enes
(m
ol/
L)
TCE
cis-DCE
trans-DCE
VC
Ethene
Long-Term Dechlorination
TAN-26
0.0E+00
4.0E-06
8.0E-06
1.2E-05
1.6E-05
2.0E-05
2.4E-05
2.8E-05
3.2E-05
3.6E-05
4.0E-05
1/6/99 3/6/99 5/6/99 7/6/99 9/6/99 11/6/99 1/6/00 3/6/00Date
Eth
enes
(m
ol/
L)
TCE
cis-DCE
trans-DCE
VC
Ethene
TAN-25
0.0E+00
4.0E-06
8.0E-06
1.2E-05
1.6E-05
2.0E-05
1/6/99 3/6/99 5/6/99 7/6/99 9/6/99 11/6/99 1/6/00 3/6/00Date
Eth
enes
(m
ol/
L)
TCE
cis-DCE
trans-DCE
VC
Ethene

34
Enhanced Mass Transfer from DNAPL Source Area
TAN-26
0.0E+00
4.0E-06
8.0E-06
1.2E-05
1.6E-05
2.0E-05
2.4E-05
2.8E-05
3.2E-05
3.6E-05
4.0E-05
1/6/99 3/6/99 5/6/99 7/6/99 9/6/99 11/6/99 1/6/00 3/6/00Date
Eth
enes
(m
ol/
L)
TCE
cis-DCE
trans-DCE
VC
Ethene

35
36
0
200
400
600
800
Days
TAN 25d
-50
-40
-30
-20
-10
Days of injection
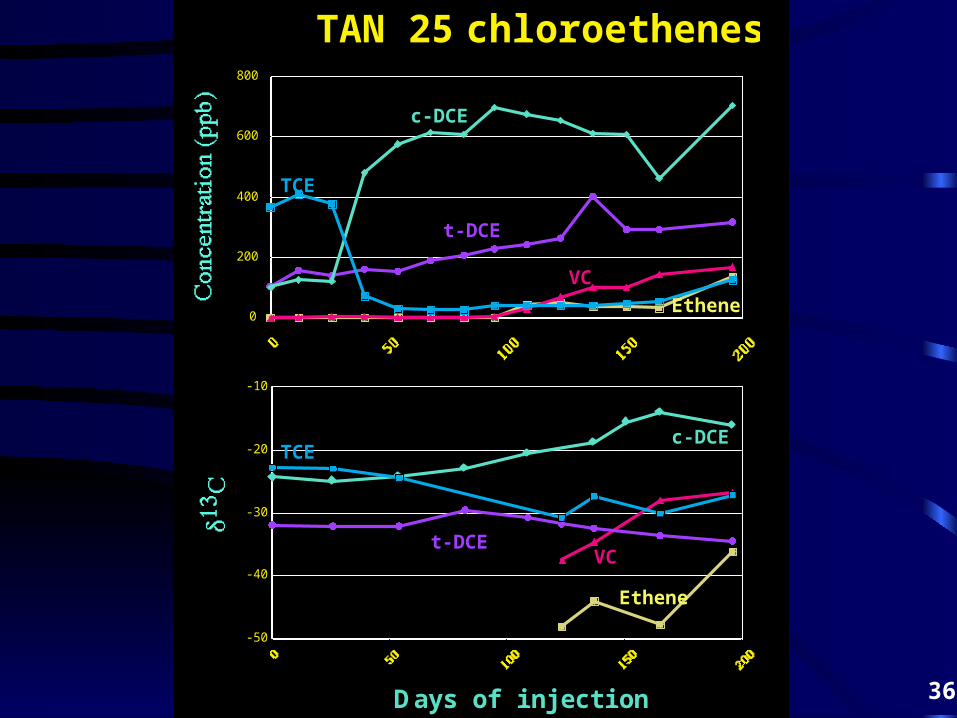
TAN 25 chloroethenes
c-DCE
VC
Ethene
t-DCE
t-DCE
c-DCE
TCE
TCE
VC
Ethene

37
Status of Enhanced In Situ Bioremediation at TAN
• Formal regulatory approval to implement bioremediation at the TAN DNAPL source area as a replacement for the default remedy has been granted. A ROD amendment was signed in 2001.

38
Ft. Lewis ESTCP Demonstration• The project will use two in situ treatment cells
to quantitatively demonstrate the enhanced mass transfer and degradation that occurs due to in situ bioremediation in a chlorinated solvent source area
• One cell will be operated to test the first two mass transfer mechanisms, while the other will add the third mechanism
• Project planning is underway; field work is scheduled to begin in January 2003
Related Documents