Investigating the water movements around a shallow shipwreck in Big Tub Harbour of 1 Lake Huron: implications for managing underwater shipwrecks. 2 3 Lakshika Girihagama a* , Mathew G. Wells a , Bryan Flood a , Reza Valipour b , Patricia Semcesen a , 4 and Scott Parker c . 5 6 a University of Toronto Scarborough, 1265 Military Trail, Toronto, ON, M1C1A4, Canada. 7 b Environment and Climate Change Canada, 867 Lakeshore Road, Burlington, ON, L7R 4A6, 8 Canada. 9 c Parks Canada, 248 Big Tub Road, Tobermory, ON, N0H 2R0, Canada. 10 11 *[email protected] 12 13

Welcome message from author
This document is posted to help you gain knowledge. Please leave a comment to let me know what you think about it! Share it to your friends and learn new things together.
Transcript

Investigating the water movements around a shallow shipwreck in Big Tub Harbour of 1 Lake Huron: implications for managing underwater shipwrecks. 2 3 Lakshika Girihagamaa*, Mathew G. Wellsa, Bryan Flooda, Reza Valipourb, Patricia Semcesena, 4 and Scott Parkerc. 5 6 a University of Toronto Scarborough, 1265 Military Trail, Toronto, ON, M1C1A4, Canada. 7 b Environment and Climate Change Canada, 867 Lakeshore Road, Burlington, ON, L7R 4A6, 8 Canada. 9 c Parks Canada, 248 Big Tub Road, Tobermory, ON, N0H 2R0, Canada. 10 11 *[email protected] 12 13

Abstract 14 15 The Sweepstakes in Fathom Five National Marine Park, is one of Ontario’s more iconic 16 shipwrecks. Continued exposure to water currents has directly and indirectly affected the integrity 17 of the wreck and resulted in management interventions including efforts to stabilize the wreck and 18 control vessel activity. An extensive series of field measurements were made during the peak 19 tourist season in the summer of 2015 with the aim of differentiating between natural hydrological 20 processes present at this site versus human-derived water movements. There is a high-degree of 21 natural current variability from processes as diverse as wind-induced surface gravity waves, 22 internal gravity waves, and diurnal flows due to differential heating. Our results show that 23 circulation driven by internal gravity waves derived from upwelling is insignificant. While vessel 24 induced currents were detectable at the shipwreck, they were no larger than the normal summer 25 variability. There is evidence of scour around the shipwreck which likely comes from large wave 26 events from winter storms. Monthly climatological significant wave heights for Lake Huron 27 suggest that typical winter storms contain far higher wave heights than anything observed in 28 summer 2015 and could be responsible for the sediment scouring around the shipwreck. 29 30 KEYWORDS: shallow shipwrecks, scouring, water movements, marine archeology, management 31 32 33

Introduction 34 35
Ships have long plied and risked the world’s waters, with over 3 million voyages ending 36 in wreck (UNESCO, 2013). Although lost from service, many shipwrecks continue to be 37 recognized and valued for their cultural and historical significance, providing a tangible connection 38 to the marine heritage of an area. In the Laurentian Great Lakes there are over 6,000 shipwrecks 39 (Great Lakes Shipwreck Museum, 2019), with about a 1,000 within ready access of divers and 40 boaters (e.g., Kohl, 2008) and several 100 conserved and presented within protected areas (e.g., 41 NOAA and State of Michigan, 2009; Parker et al., 2017). While conserving a shipwreck in-situ is 42 the preferred management approach (Maarleveld et al., 2013), such a context continues to expose 43 the resource to environmental factors that can contribute to its deterioration (Bethencourt et al., 44 2018; Gregory et al., 2012; MacLeod and Binnie, 2011). Preservation and maintenance of the 45 structural integrity of submerged cultural resources is affected by a variety of hydro- physical, 46 chemical, and biological factors. Physical factors include waves, currents, temperature, depth as 47 well as human impacts (Wheeler, 2002). Chemical factors include salinity, pH, and dissolved 48 oxygen levels (Wheeler, 2002). Biological factors include bacteria, fungi and various other 49 organisms including Dreissenid mussels (Watzin et al., 2001; Wheeler, 2002). All these factors 50 interact in complex and non-linear ways, and can challenge the effectiveness of conservation 51 efforts, which can be particularly concerning within those areas established and managed to protect 52 such submerged cultural resources. 53
Fathom Five National Marine Park (FFNMP), Lake Huron, Canada is one such protected 54 area facing this challenge (Fig. 1a). Fathom Five Provincial Park was established in 1971 and 55 slowly transformed the small community of Tobermory (Fig. 1b) from a fishing village into one 56 of Canada’s premier recreational diving destinations, as well as tourist destination due to glass 57 bottom tour boats (McClellan, 2001). The park was later transferred along with the local islands 58 of Georgian Bay Islands National Park, and in 1988 FFNMP was formed and Parks Canada became 59 the steward of its first site to be managed under the National Marine Conservation Area program 60 (Canada, 2002; Wilkes, 2001). From the earliest days through today, a long-standing cultural 61 resource management priority for Fathom Five has been the conservation and presentation of the 62 Sweepstakes (Fig.1c-f). The hull of the wooden sailing vessel has rested upright and nearly intact 63 within a few meters of the water surface since 1885 and is perhaps Ontario’s most photographed 64 and popular shipwreck, with over 100,000 tour boat visitors and divers/year. With the passage of 65 time, this iconic shipwreck has required various management interventions, including physical 66 stabilization, monitoring and restrictions on vessel activity, in order to maintain it in a safe and 67 desirable state (e.g., Parks Canada, 1991; Parks Canada, 1992). 68
One notable observation around the Sweepstakes was lakebed scouring, particularly on the 69 portside (see the faint ring, Fig. 1c) and associated concerns for vessel stability. To this end, an 70 investigation by Boyce (1996) was undertaken in 1993-1994 to quantify water and sediment 71 movements in the area. Boyce (1996) suggested four major sources of energy for the Sweepstakes 72 that could be responsible for the scouring: wind-driven currents, gravity flows due to upwelling 73 events, surface wave orbital velocities, and flows induced by the wakes of tour boats or divers. 74 Based on the currents and temperature measurements, he concluded that bottom currents induced 75 by wind driven circulation and differential heating was insignificant to account for erosion at the 76 shipwreck. However, if the tour boats were operated aggressively using full power bursts and 77 thrust, it could produce transient currents capable of eroding bottom sediments around the 78 shipwreck. Further, he concluded that there is a possibility that surf-beats (Wunk, 1949) can 79
produce oscillating current which may be capable of eroding bottom sediments. However, these 80 surf-beats stirred up sediments in small patches rather widespread bottom scouring. This study 81 proved to be exceptionally useful and directly supported Parks Canada’s management policies at 82 the time. 83
Several decades later the context has changed, in particular there has been a notable 84 increase in vessel size (~40% larger) and frequency of use. Although the wreck will eventually 85 collapse (Parks Canada, 1992), the need to differentiate natural versus human derived water 86 movements will influence what options are considered to best conserve and manage the site today. 87 Natural water movements around the Sweepstakes in Big Tub Harbour can be attributed to wind 88 induced surface gravity waves, internal gravity waves, and gravity flows generated by differential 89 heating. Previous studies of the thermal variability in FFNMP have shown that large-scale internal 90 waves on the summer thermocline are ubiquitous and can have greatest temperature variability at 91 depths of 10- 20 m with periods of oscillation between 12 to 24 h (Wells and Parker, 2010). 92 Differential heating in an aquatic system with a sloping bottom can also create temperature (i.e. 93 density) gradients that drive dense gravity currents flowing downslope (Wells and Sherman, 2001). 94 Amplification of surf-beats has also been previously observed in certain embayments of FFNMP 95 (Hlevca, Wells and Parker, 2015) which can lead to currents strong enough to erode sediment and 96 change water quality. The major source of human derived water movements is thought to be the 97 propeller wash from boats that could lead to turbulence and pressure perturbations in the water 98 column. If the wash is strong enough, the water currents could potentially disturb the sediment 99 resulting in re-suspension. Likewise, if the boats produce significant pressure perturbations in the 100 water column, the structure of the shipwrecks could be moved. Additionally, recreational divers 101 swimming near the underwater shipwreck are a possible source of human derived water 102 movements. 103
In this manuscript, we aim to determine the relative magnitudes of natural and human 104 derived water movements that could influence the structural integrity of the Sweepstakes 105 shipwreck. We will use detailed field measurements acquired in the summer of 2015 the Big Tub 106 Harbour. Specifically, we quantify and differentiate natural versus human derived water 107 movements during the peak summer tourist season at the Sweepstakes and determine if there is 108 any measurable increase in peak water currents. The field observations include water currents, 109 pressure, and temperatures in the vicinity of the Sweepstakes, and video observations for biological 110 activities and tour boat activities. Further we will use winds and wave heights from regional 111 meteorological stations to estimate the wave heights during fall and winter storms, that could 112 generate potentially higher erosion than anything that occurs during summer periods. 113 114

115 Fig. 1. The geographical location and the views of the Sweepstakes in the Big Tub Harbour of 116 Fathom Five National Marine Park near Tobermory. (a) A map of Lake Huron and Georgian Bay. 117 (b) Location of Big Tub Harbour and Tobermory. (c) Close up of western end of Big Tub Harbour, 118 showing the two shipwrecks, namely, the Sweepstakes (1867-1885) and located to the south, the 119 City of Grand Rapids (1879-1907). A ring of erosion is visible around the Sweepstake where no 120 weed (Chara sp.) is growing and sand is exposed. While the Sweepstakes is a fully intact 121 underwater shipwreck, the City of Grand Rapids has only the timbers from the bottom hull. (d) A 122 sketch of the Sweepstakes. The prow faces south while the portside faces east towards Lake Huron. 123 (e) An underwater photograph of portside of the Sweepstakes, with the tripod is visible behind 124 diver. (f) An underwater photograph of the prow of the Sweepstakes, the yellow ADP is visible in 125 background on the bed. Photograph credits: Parks Canada. 126 127 Materials and Methods 128 129 Study site 130
131 Big Tub Harbour (81°40'38.67"W, 45°15'22.21"N) is located within the Fathom National 132
Marine Park on Georgian Bay (area of 15,000 km2), Lake Huron (area of 44,000 km2) (Bennett, 133 1988). It is a sheltered harbour with a rectangular shape, approximately 700 m long and 100 m 134 wide with a mean depth of 12 m (Fig. 2 and 3). Slightly to the east is the small town of Tobermory, 135 located around the commercial port of Little Tub Harbour. The bed of Big Tub Harbour is 136 composed of spatially discrete patches of silt, silty-sand, and sand and the harbour walls are 137 dolomite bedrock. At the head of Big Tub Harbour rest two shipwrecks, The Sweepstakes and the 138 City of Grand Rapids. The Sweepstakes (1867-1885) was a 36 m long two-masted wooden 139 schooner and on the evening of 23 August 1885, she struck a rock off Cove Island (located 3 km 140 to the north) and sank stern first in shallow water. Weeks later she was salvaged and towed to Big 141

Tub Harbour and eventually laid up and abandoned in approximately 7 m of water where her nearly 142 intact hull remains today (Ringer and Folkes, 1991). Also lying in the sand at the head of the 143 harbour just south of the Sweepstakes is the broken, fire–gutted remains of the Steamer City of 144 Grand Rapids (1879-1907). She caught fire while docked in Little Tub and was towed towards the 145 open lake. Once cut loose she slowly drifted in Big Tub Harbour where she remains (Ringer and 146 Folkes, 1991). 147
148 Big Tub Harbour bed sediment and vegetation structure 149 150
The lakebed composition was mapped by classifying data from a 2007 multi-beam 151 backscatter survey of the harbour (Fig. 2). The analysis was trained using Ponar grab and video 152 samples of the harbour bed. The classification provides a coarse sediment structure and general 153 distribution of submerged aquatic vegetation. Silty sand dominates near the shipwreck site, which 154 (Boyce, 1996) found to be in the range of 125-200 microns. The major forms of benthic vegetation 155 are Chara sp. and Macrophytes (e.g. Myriophyllum, Potamogeton sp.). Chara sp. is visible in the 156 background of photographs in Figs. 1e and f. 157
158 Fig. 2. Composition of bottom (a) sediments (b) aquatic vegetation in Big Tub Harbour. The 159 presence of nearby houses and roads are drawn, along with the two shipwrecks. The classification 160 provides a coarse sediment structure on the harbour bed and general distribution of submerged 161 aquatic vegetation. Around the two shipwrecks at the head of Big Tub Harbour, the bed is 162 dominated by silty sand and Chara sp. vegetation. Figures credit: Parks Canada. 163 164 Field measurements 165
166 The field data collection campaign at the Big Tub Harbour ran from 05 May 2015– 13 167
October 2015, and was jointly undertaken by Parks Canada, Environment Canada and the 168 University of Toronto. The purpose of the monitoring was to study summer water movements and 169 differentiate natural movements (e.g., gravity currents, waves, and seiches) from the motions 170 forced by the vessels around the Sweepstakes. The locations of the instruments relative to the 171 Sweepstakes wreck are given in Fig. 3 and a summary of instruments used are presented in Table 172 1. 173
174 175 176 177

Table 1: Summery of instruments deployed in Big Tub Harbour. 178 179 Position on Map
Instrument Name
Measured property
Sampling interval /Frequency
Depth and other information
1 Float 1 Temperature 5 mins One logger at 0.5 m above the harbour bed.
2 Float 3 Temperature 5 mins Two loggers at 0.5, 1 m above the harbour bed.
3 Float 4 Temperature 5 mins Two loggers at 0.5, 1 m above the harbour bed.
4 Float 5 Temperature 5 mins Two loggers at 0.5, 1 m above the harbour bed.
5 MOB chain Temperature 5 mins 13 loggers at 0.5, 1, 2, 3, 4, 5, 6, 7, 8, 9, 10, 11, 12 m above the harbour bed.
6 HR-ADCP Currents, pressure 1024 sample per 5 min burst interval
Down looking and 1.5 m above the harbour bed.
7 AWAC Currents 1024 samples per 20 min burst interval
Upward looking and 6.5 m of from the surface water.
8 ADP Currents, camera for biological activities
One sample per 2 min burst interval
ADP is Upward looking and 5.5 m of from the surface. The camera is downwards angle away from the wreck and installed 6.5 m of from the surface.
9 Surface Camera
Tour boat visitation times
continuous On shore
180 To measure the water column temperature, we used HOBO Tidbit v2, UTBI-001 181
thermistors. Three arrays (floats 1, 3, and 4) were deployed around the Sweepstakes (locations 182 given as 1, 2 and 3 in Fig. 3) and one array (float 5) was deployed a few meters east from the 183 Sweepstakes (location 4 in Fig. 3). Three arrays (floats 3, 4, and 5) contained two thermistors 184 where one was installed at 0.5 m above the water bed while the other was at 1.0 m above the 185 harbour bed. The remaining array (float 1) only contained a single thermistor such that it is 186 installed 0.5 m above the harbour bed. The loggers were deployed at approximately 08:00 EST, 187 June 12, 2015 and retrieved at approximately 12:00 EST August 26, 2015. Another large array 188 (Marine Operations Base-MOB chain) of thirteen HOBO Tidbit v2, UTBI-001 thermistors was 189 placed near the mouth of the harbour (given as locations 5 in Fig. 3) to record the temporal 190 fluctuations of the harbour’s water column temperature. The array was deployed from May 05, 191 2015 – May 22, 2015. The data record started again, at approximately 12:00 EST, May 23, 2015 192 and retrieved at approximately 10:30 EST September 17, 2015. The thermistors recorded the water 193 temperature every 5 minutes with a resolution of 0.02 0C and an accuracy of ± 0.21 0C. 194
One acoustic Doppler profiler (SonTek ADP, S/N M945) was installed in 5.5 m water 195 depth approximately 5 m off the prow of the Sweepstakes, pointing upwards (location 8 in Fig. 3, 196

also visible in Figure 1f). The ADP, with 1500 kHz frequency, was programmed to ping as rapidly 197 as possible and record the 30-seconds average current velocity in all three directions in every 2- 198 minutes. This allows the ADP to gain 30-seconds of measuring followed by 90-seconds of 199 inactivity in each 120-seconds. The ADP had a blanking distance of 0.4 m. The ADP recorded the 200 readings for seven 0.5 m bins where it recorded the average currents over half metre intervals from 201 0.8 m to 4.3 m above harbour bed. The ADP was deployed on June 24, 2015 at around 10:30 EST 202 and retrieved on August 21, 2015 at approximately 16:30 EST. Another acoustic wave and current 203 profiler (Nortek AWAC, 600 kHz) with acoustic surface tracking (AST) was installed 204 approximately 5 m off the starboard side (east) of Sweepstakes (location 7 in Fig. 3). It was placed 205 in an upward facing configuration in approximately 6.5 m of water. In 20-minute intervals, it 206 sampled at 1 Hz for 17.06-minutes (i.e. 1024 samples per burst). The AWAC started recording on 207 June 23, 2015 at 16:00 EST and ran until July 08, 2015 at 23:00 EST. Current velocities were 208 measured in 0.5 m bins. The AWAC has a blanking distance of 0.5 m. The AWAC has an accuracy 209 of 1% of the measured value ± 0.5 cm/s. The AST feature allows for accurate measurements, 0.1% 210 of full scale, of the water surface elevation in order to measure surface waves or wakes. The third 211 high resolution ADCP (Nortek Aquadopp HR) is closely located (location 6 in Fig. 3) on the 212 starboard side of the shipwreck. This is a downward looking ADCP that was mounted on a tripod, 213 which is visible in Figure 1e. The tripod is mounted 1.5 m above the harbour bed and has a blanking 214 distance of 0.10 m. The burst interval is 300-seconds such that instrument samples 1024 per burst. 215 The cell size was 0.03 m and contains 48 cells. The velocity range is 0.19 m/s in the horizontal 216 and 0.08 m/s in the vertical. The instrument was deployed on June 23, 2015 at 12:00 EST and the 217 last measurement was recorded on October 13, 2015 at 11:03 EST. 218
An underwater camera was installed on the same tripod as the ADP, on the port side (east) 219 of the Sweepstakes in 6.5 m of water (location 8 in Fig. 3). The camera was oriented to look at a 220 downwards angle away from the wreck. Video footage was recorded, with a few gaps, on June 29, 221 2015 and then fairly continuously from July 3, 2015 until July 14, 2015. Due to poor visibility at 222 night, it was only possible to analyze video taken during the day resulting in a total of about 100 223 usable hours of underwater footage. A second camera (Plotwatcher Pro, Model TLC-200-C) was 224 placed on shore from June 25, 2015 – July 03, 2015 looking over the Sweepstakes wreck site, in 225 order to make a record of exactly when tour and other boats were present above the shipwrecks 226 (location 9 in Fig. 3). The underwater video camera footage allowed us to capture any sediment 227 re-suspension events and corresponding possible causes happened in the water column. For 228 instance, we captured biological activities such as round gobies (Neogobius melanostomus) 229 digging in the sediments causing localized re-suspension that would not be observable in the water 230 temperature and current records. 231
A pressure logger was mounted on HR-ADCP frame (at 7.0 m from the surface, 232 45o15.316’N 081o 40.849’W, mounted 0.75 m above the bottom, location 6 in Fig. 3). It 233 continuously sampled at 2 Hz from June 23rd, 2015 at 16:00 EST and ran until September 12, 2015 234 at 02:50 EST. Hourly mean wind speeds and direction were obtained from Environment Canada’s 235 Tobermory Airport Weather Station (Tobermory RCS, WMO ID 71767). The station is located at 236 45°14'00.000" N and 81°38'00.000" W. The monthly climatological significant wave heights and 237 winds were extracted from the meteorological buoy located in the southern Georgian Bay (44.945 238 N, 80.627 W, and Buoy ID C45143). The data runs from May 2007 through November 2017. 239 240

241 242
Fig. 3. Bathymetry of Big Tub Harbour and geographical locations of the field instruments relative 243 to the Sweepstakes. The Sweepstakes wreck is visible in (b) with the prow pointing to the south. 244 The numbers correspond to individual instruments as follows: 1: Float 1 (one thermistor), 2: Float 245 3 (two thermistor loggers), 3: Float 4 (two thermistor loggers), 4: Float 5 (two thermistor loggers), 246 5: Marine Operations Base (MOB) chain (13 thermistor loggers), 6: HR-ADCP 7: AWAC (also a 247 pressure sensor) 8: ADP and downward looking camera), 9: On shore surface camera. 248 249 Data processing 250 251
To evaluate the major sources of energy – natural or human derived water movements – 252 that could be responsible for scouring around the Sweepstakes, we use time series plots of 253 temperature and bottom currents. We estimate how much current variability is due to natural 254 physical processes such as wind-induced surface gravity waves, internal gravity waves, and diurnal 255 flows due to differential heating. We extract water currents driven by human interaction as a 256 function of prop-wash induced currents. Then we compare the bottom currents with respect to 257
natural variability and human interactions to identify the major sources of energy responsible for 258 scouring. 259
We examine the current measurements acquired at the prow and the starboard side of the 260 Sweepstakes to quantify the magnitude of the near-bed currents that could potentially result in 261 scour and erosion. We divide our velocity data processing into few steps. First, we plot the time 262 series of the east-west and north-south velocities of acquired at all acoustic current meters located 263 in the vicinity of the shipwreck to visually identify the bottom currents. The HR-ADCP records 264 data up to 1.5 m from the harbour bed. Hence, for comparison purposes we only consider the 265 currents variability in the depths up to 1.5 m from the harbour bed. If the bottom currents show a 266 barotropic variability such that no vertical velocity gradient, we can average the velocity bins up 267 to 1.5 m from the harbour bed. Then, we use Fast Fourier Transform (FFT) analysis to identify the 268 dominant periods of the bottom currents in the vicinity of the shipwreck. The dominant periods 269 reveal relevant peaks of natural forces. In this analysis, we de-trend the speed data and then, use 270 Welch (1967) algorithm where the power spectrum is estimated by dividing stationary data into 271 segments. The number of segments depend on the length of the time series. Thus, we find the 272 modified periodigram for each segment that expresses the uncorrelated estimates of the spectra. 273 To obtain the average of the modified periodograms, the segments are multiplied by a window 274 function, Hanning window, with a 50% overlapping technique to reduce the variance of the 275 periodogram. To evaluate the currents induced by the propeller wash from the tour boats, we divide 276 data in to two windows; times that the boats were present and the times when the tour boats were 277 absent. Then we plot the histogram of the current speeds with respect to the time windows selected. 278 In order to compare the results, we use probability of speed occurrences which varies between 0 279 and 1. We hypothesize that if the bottom currents show an increased variability during the boats 280 were present, then the propeller wash induced currents contribute to scouring in the sediment and 281 thus, might compromise the structural integrity of the Sweepstakes. 282
We compare the temperature time series acquired in the direct vicinity of the Sweepstakes 283 and at the mouth of the harbour to see that there are any intrusive cold gravity flows in the Big 284 Tub Harbour induced by the upwelling of cold waters in Lake Huron. The upwelling events are 285 identified as a drop-in water temperature by 5-8 0C in the space of few hours. Often, these cold-286 water upwelling events are driven by strong local winds or by internal gravity waves induced by 287 distant wind events (Wells and Parker, 2010). Thus, we first plot the time series of the temperature 288 measurements acquired by the temperature loggers located in the vicinity of the shipwreck and 289 located near the mouth of the Big Tub Harbour to visualize the spatial and temporal variability of 290 the temperatures at different depths. Then we adapt Continuous Wavelet Transform (CWT) 291 method (Grinsted et al., 2004) to determine the times that upwelling is significant. CWT expands 292 the time series in to time-frequency domain. Next, we use the same spectral analysis described 293 above to understand the dominant periods related to temperature variability. To evaluate the 294 importance of episodic upwelling events on bottom currents driven by internal gravity waves that 295 can scour the bottom sediments around the shipwreck, the time window is split in to the times that 296 upwelling occurs and it was not. Then we compare the histogram of horizontal bottom currents at 297 the times corresponds to upwelling. For the comparison purpose, the frequency in the histogram 298 was normalized. If the bottom currents show a significant increase in variability during the 299 identified upwelling events, one could assume that the circulation is driven by the gravity flows 300 induced by upwelling. In addition, there could be standing surface waves, or seiches in the harbour, 301 similar to those seen at nearby sites in FFNMP that were visually observed to lead to significant 302 water currents (Hlevca, Wells and Parker, 2015). 303
To account for the discussion of propeller–wash induced forcing, we apply the spectral 304 analysis obtained from the FFT - described above - on the pressure measurements acquired from 305 sensor that was attached to the HR-ADCP. The FFT results will be used to examine the dominant 306 frequency of any seiche induced oscillations. 307 308 Estimation of seiche periods in harbour 309 310
Big Tub Harbour is a shallow, open-mouth, long, and narrow basin with a rectangular shape 311 and potentially could support standing wave oscillations. The frequency of these waves can be 312 made by assuming the depth of the harbour is approximately a constant and there are vertical walls 313 on the side. Thus, periods of the eigen (natural) modes of the standing oscillations in such an open 314 basin can be described using the classic Merian formula (Rabinovich, 2010). 315
316 𝑇" =
$%('"())+,-
(1) 317
318 where, 𝑇 is the period, 𝑛 is the modes of the oscillations, 𝑔 is the gravitational acceleration 319
(~ 9.8 m/s2), and 𝐻 is the water depth. The first mode (𝑛 = 0) is known as the Helmholtz resonance 320 mode such that, Eq. (1) becomes 321
322 𝑇2 =
$%+,-
(2) 323
324 For instance, in the Big Tub Harbour, the length (𝐿) is ~ 690 m and 𝐻 is 12 m. Thus, the 325
Helmholtz resonance period (𝑇2) is computed as 4.2-minutes (Eq. 2). 326 327
Calculating high frequency pressure perturbations 328 329 In order to determine the pressure perturbations generated by the high frequency waves 330
near the Sweepstakes, the measurements have a high pass filter applied at 4-minutes. The high 331 pass filter at 4-minutes removes any variability caused by natural modes of oscillations in the 332 harbour and retain only high frequency events. The high pass filtered amplitude of the pressure 333 perturbation variability caused by the water level fluctuations (such as from high frequency waves) 334 will then be compared with the times that the boats were present and absent. The pressure 335 perturbation is defined as 336
337 𝑃5 = 𝑃67689 − 𝑃;<=>7?686@A , (3) 338 339
where, 𝑃5 is the pressure perturbation, 𝑃67689 is the high pass filtered total pressure 340 measured by the pressure sensor attached to the HR-ADCP located at the starboard side of the 341 Sweepstakes, 𝑃;<=>7?686@A is the hydrostatic pressure (= 𝜌𝑔𝐻), 𝜌 is the water density (~1000 342 kg/m3), 𝑔is the gravity (~ 9.8 m/s2), and 𝐻 is the total water column depth. As 𝜌 and g are constant 343 over short periods, the pressure perturbation 𝑃5 is usually reported as an equivalent depth of water 344 in metres. The time-series of high pass filtered amplitude of the pressure perturbation is then 345 compared with the time-series of wind speeds with direction as a proxy for when surface waves 346 would likely have been large. 347
348

Data and Results 349 350
Our goal of the field campaign was to differentiate between the natural hydrological 351 processes versus human-made water movements present at the vicinity of the Sweepstakes 352 shipwreck site. The analysis identifies natural currents variability from processes such as wind-353 induced surface gravity waves, internal gravity waves, and diurnal flows due to differential 354 heating. However, there is a detectable variability caused by tour boats. Thus, we will further 355 compare the effect of propeller-wash induced bottom currents with respect to that caused by natural 356 variability. 357 358 Thermal structure 359 360
Water temperature time series extracted at Floats 1, 3, 4, 5 located near the Sweepstakes 361 and MOB chains located off of the Parks Canada dock (toward the mouth of the harbour) shows 362 the spatial and temporal evolution of the thermal structure in the Big Tub Harbour (Fig. 4). During 363 the deployment period the surface waters in Big Tub Harbour (Fig. 4a) gradually warm from 10 364 0C and reaches to a maximum temperature of 20 0C by the August (~ DOY 213-230). A similar 365 warming was observed in the bottom temperatures in the direct vicinity of the Sweepstakes (Figs 366 4b-e). For instance, on a sample day- DOY 176 (June 25, 2015), the temperature loggers at 1 m 367 from the harbour bed in the direct vicinity of the Sweepstakes (Floats 1, 3, and 4) show an average 368 temperature of 9.3 °C and rose to 20.7 °C by DOY 233 (August 21, 2015). This corresponds to an 369 average warming trend of ~0.2 °C per day (Figs 4c, d, and e). The mean depth of the summer 370 mixed layer is approximately 8 m. Big Tub Harbour (with a mean depth of 12 m) is shallower than 371 the depths where temperature variability is greatest in the FFNMP i.e. the depth at which the 372 summer thermocline lies. In FFNMP, the maximum temperature variability was observed at 20 m 373 depth (Wells and Parker, 2010). 374
375

Fig. 4. Water temperature and wind stress time series. (a) Contour plot of water temperature 376 variations with height above the harbour bed and time. Note that the strong upwelling signals in 377 the deeper water, the strong daily warming signal near the surface, and the general warming trend 378 as time progresses. (b) Temperature measurements at Float 3 (closest chain at the east of 379 Sweepstakes). (c) Temperature measurements at Float 4. (d) Temperature measurements at Float 380 5 (e) Temperature measurements at Float 1. Note that the larger fluctuations in temperature at the 381 lower thermistor (at 0.5 m from the harbour bed) are observed in all floats due to cold water 382 upwelling. 383 384
The power spectrum of the temperature measurements at the 0.5 m from the harbour bed 385 acquired at temperature loggers in the vicinity of the shipwreck shows a strong semi-diurnal signal 386 (Fig. 5) which could be a result from gravity flows induced by differential heating. Another distinct 387 mode was identified at 6.15 h and this may be related to the cold-water intrusions at the bottom 388 (upwelling). Further, the above calculated period of 6.15 h is close to the H1 seiche mode (Lake 389 Huron mode 1) documented in Schwab et al. (1977) which is about 6.6 h. Thus, upwelling events 390 in the temperature records may be driven by the free modes of oscillations attributed to Lake Huron 391 seiches. 392
393 Fig. 5. A sample power spectrum for the de-trended bottom temperature (0.5 m from the harbour 394 bed) acquired at the float 3. The record shows significant periods at 12.41 h (semidiurnal) and at 395 6.15 h. A similar behaviour is seen in all floats in the vicinity of the Sweepstakes shipwreck. 396 397
Based on the Continuous Wavelet Transform (CWT) of the bottom (0.5 m above the 398 harbour bed) temperature records show four distinct upwelling events given on DOYs 226, 215, 399 205, and 198 (Fig. 6). During these cold - water intrusion events at the bottom, the water 400 temperature quickly drops and rises again by 5-8 0C over few hours (Fig. 4a). Similarly, the 401 comparison of the temperatures at 0.5 m from the bottom, located near the Sweepstakes, show a 402 strong variability compared to those observed at 1 m depth from the harbour bed (Figs 4b–e) 403

suggesting a frequent upwelling events near the Sweepstakes. These episodic upwelling events, 404 which extend all the way to the end of the harbour, suggest that the waters of Big Tub Harbour are 405 frequently exchanged with waters from Lake Huron (Fig. 4a). 406
407 Fig. 6. Continuous Wavelet Transform (CWT) of the temperatures obtained at the bottom 408 thermistor (0.5 m above the harbour bed) from (a) float 1, (b) float 3, (c) float 4, and (d) float 5. 409 CWT expands the time series in to time-frequency space. The record shows four distinct upwelling 410 events on DOYs 226, 215, 205, and 198 on all temperature records. 411
412 Effect of upwelling on water circulation 413 414
The variability of bottom currents during four distinct upwelling events that was identified 415 in the temperature time series (Fig. 6) are compared with the variability during at times where 416 there is no visible upwelling (Fig. 7). Times except upwelling days are noted as non-upwelling 417 events. The comparison will quantify the strength of the flows driven by the internal gravity waves 418 in the Big Tub Harbour. If the bottom currents show increased variability during upwelling events 419 this could suggests that gravity currents driven by combination of differential heating and internal-420 seiches in the Lake Huron might contribute to scouring around the shipwreck. However, if the 421 variability or maximum velocities do not change, then the effect of internal gravity waves on the 422 flows is minimal. For the comparison purpose, the distribution is normalized (Fig. 7) to give the 423 probability of speed occurrences. As in Figure 7, the probability distribution suggest that the 424 bottom currents do not show an increased variability during upwelling events to account for the 425 circulation driven by internal gravity waves. Hence, the frequent upwelling events do not 426 contribute to strong currents in the direct vicinity of the shipwreck that could stir the bottom 427 sediments and scouring. 428

429 Fig. 7. Histogram analysis of bottom currents with the presence and absence of upwelling events. 430 The y-axis value is the probability of the speed occurrences. The histogram of currents speeds at 431 (a) ADP located at the prow (b) AWAC located at the portside of the shipwreck, and (c) HR-ADCP 432 located at the portside of the shipwreck. While blue color denotes the bottom speeds during 433 upwelling events the green color represents the speeds of the bottom water currents during non-434 upwelling times. The upwelling events are observed in DOYs 226, 215, 205, and 197 (See Figs. 4 435 and 6 for visualization of upwelling events). 436 437 Bottom currents in the vicinity of the shipwreck 438 439
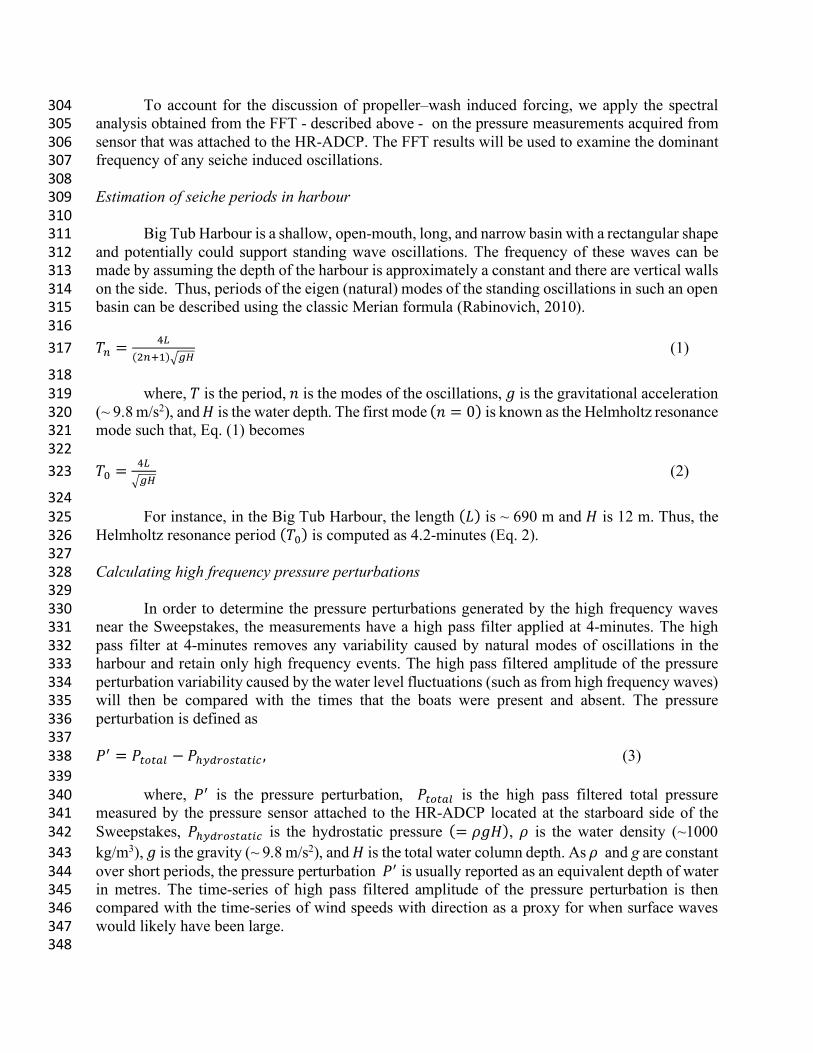
In order to understand the variability in water movements, we have compare the current 440 speed data at the prow measured by the ADP (location 8 in Fig. 3), and on the starboard side of 441 the shipwreck measured by two different ADCPs, namely, AWAC (location 7 in Fig. 3) and HR-442 ADCP (location 6 in Fig. 3). The HR-ADCP is the closest to the starboard side of the shipwreck 443 while AWAC is few meters away (towards the Open Harbour) from HR-ADCP (Fig. 3). The 444 velocity time series shows an oscillatory motion at 1.5 m from the harbour bed (Fig. 8). The 445 oscillatory motion can be defined as a barotropic flow such that there is no vertical velocity 446 gradient in the water column. The FFT analysis shows significant peaks at 23.75 h (~diurnal), and 447 at 12.0 h (~semi-diurnal) for the mean bottom current speeds (i.e. 1.5 m from the harbour bed). 448 Because of the barotropic motion, we averaged the bins within 1.5 m from the bottom of harbor 449 (Fig. 9). The currents at 1.5 m from the harbour bottom but at the prow of the shipwreck extracted 450 from ADP show a mean speed of ~7.5 cm/s, minimum of ~0.2 cm/s, a maximum of ~33 cm/s, and 451 a range of ~33 cm/s (Fig. 9b). The speed calculated from velocity measurements acquired from 452 AWAC shows a mean speed of ~9 cm/s (Fig. 9c). The minimum, maximum, and the range are 453 ~0.1 cm/s, ~31 cm/s, and ~31 cm/s, respectively. The currents measured by HR ADCP show a 454 mean speed of less than 1 cm/s but show some very brief periods (10 s) of high speeds (Fig. 9d). 455

The maximum and the minimum speeds recorded during the observation period are ~0.2 cm/s and 456 ~5 cm/s, respectively. The observed speed range measured by the HR-ADCP is ~4.5 cm/s. It is 457 clear that the flow speed is order of magnitude larger at the prow (Fig. 9b) compared to the 458 starboard side of the shipwreck (Fig. 9c). 459 460
461 Fig. 8. The east-west and north-south velocities up to 1.5m from the bottom (harbour bed). (a) The 462 east-west velocities extracted by ADP which is located at the prow, (b) The north-south velocities 463 extracted by ADP (c) The east-west velocities extracted by AWAC on the side, and (d) The north-464 south velocities extracted by AWAC (e) The east-west velocities extracted by HR – ADCP located 465 closest to the side of the shipwreck. (f) The north-south velocities extracted by HR – ADCP. The 466 oscillatory motion in velocity distribution shows a barotropic flow (almost no vertical velocity 467 gradients) in the bottom water column. 468 469
470 471 Fig. 9. The depth averaged velocities up to 1.5m from the bottom. The currents are measured by 472 (a) ADP which is located at the prow, (b) AWAC on the side, and (c) HR – ADCP located closest 473 to the side of the shipwreck (note the different scale on y-axis). The mean speed nearest to the 474 shipwreck but located on the side ~1 cm/s while, at the prow is ~8 cm/s. However, the measured 475 mean speed at AWAC location is ~10 cm/s. 476 477 Effect of tour boat propeller wash on water currents 478 479
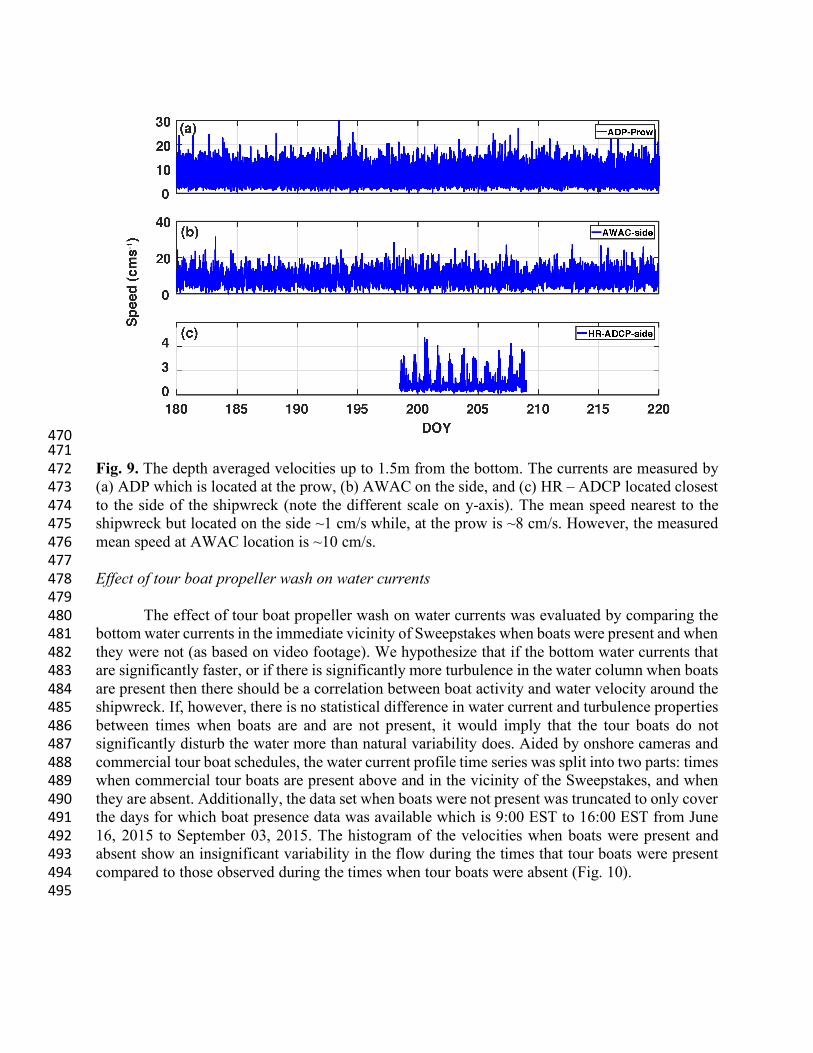
The effect of tour boat propeller wash on water currents was evaluated by comparing the 480 bottom water currents in the immediate vicinity of Sweepstakes when boats were present and when 481 they were not (as based on video footage). We hypothesize that if the bottom water currents that 482 are significantly faster, or if there is significantly more turbulence in the water column when boats 483 are present then there should be a correlation between boat activity and water velocity around the 484 shipwreck. If, however, there is no statistical difference in water current and turbulence properties 485 between times when boats are and are not present, it would imply that the tour boats do not 486 significantly disturb the water more than natural variability does. Aided by onshore cameras and 487 commercial tour boat schedules, the water current profile time series was split into two parts: times 488 when commercial tour boats are present above and in the vicinity of the Sweepstakes, and when 489 they are absent. Additionally, the data set when boats were not present was truncated to only cover 490 the days for which boat presence data was available which is 9:00 EST to 16:00 EST from June 491 16, 2015 to September 03, 2015. The histogram of the velocities when boats were present and 492 absent show an insignificant variability in the flow during the times that tour boats were present 493 compared to those observed during the times when tour boats were absent (Fig. 10). 494 495
496 Fig. 10. Histogram analysis of currents with the presence and absence of boats. Normalized 497 frequency on the y-axis is the probability of occurrences which varies between 0-1. (a) The 498 locations of the current measurements. The histogram of currents speeds at (b) ADP located at the 499 prow (c) AWAC located at the side of the shipwreck, and (d) HR-ADCP located at the side of the 500 shipwreck. The blue color denotes the velocities at the times that the tour boats were not present 501 while red color represents the water currents at the times that the boats were present. The tour boats 502 were allowed from 9:00 EST to 16:00 EST from 16th of June 2015 to 03rd of September 2015. 503 504 Effect of tour boats on water pressure 505 506
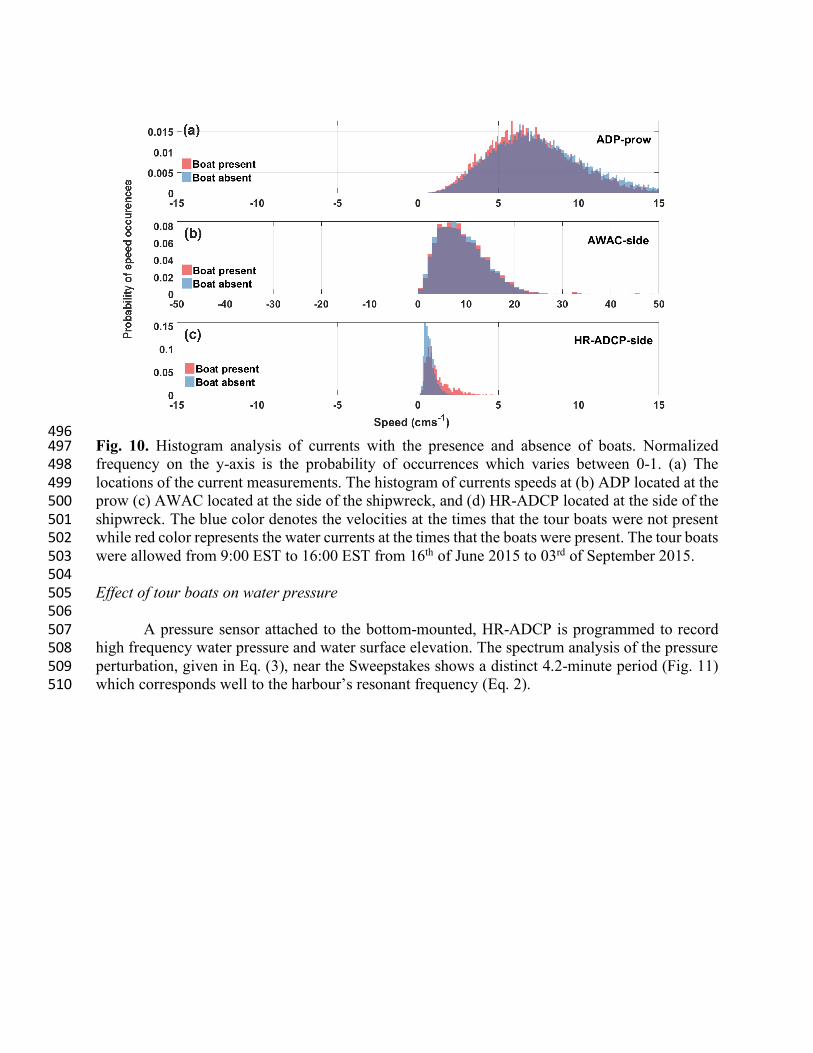
A pressure sensor attached to the bottom-mounted, HR-ADCP is programmed to record 507 high frequency water pressure and water surface elevation. The spectrum analysis of the pressure 508 perturbation, given in Eq. (3), near the Sweepstakes shows a distinct 4.2-minute period (Fig. 11) 509 which corresponds well to the harbour’s resonant frequency (Eq. 2). 510
511 Fig. 11. Spectral density diagram for water pressure perturbations. Note that the 4.2-minute period 512 corresponds to the resonant frequency of the harbour. 513 514
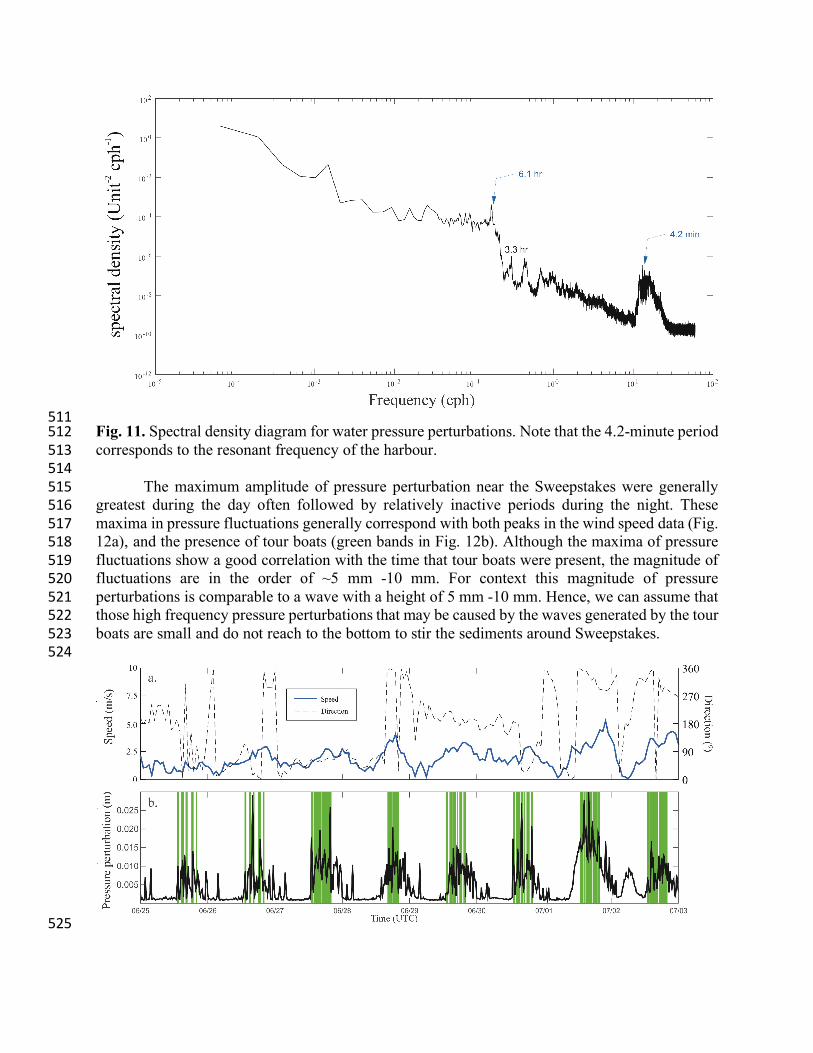
The maximum amplitude of pressure perturbation near the Sweepstakes were generally 515 greatest during the day often followed by relatively inactive periods during the night. These 516 maxima in pressure fluctuations generally correspond with both peaks in the wind speed data (Fig. 517 12a), and the presence of tour boats (green bands in Fig. 12b). Although the maxima of pressure 518 fluctuations show a good correlation with the time that tour boats were present, the magnitude of 519 fluctuations are in the order of ~5 mm -10 mm. For context this magnitude of pressure 520 perturbations is comparable to a wave with a height of 5 mm -10 mm. Hence, we can assume that 521 those high frequency pressure perturbations that may be caused by the waves generated by the tour 522 boats are small and do not reach to the bottom to stir the sediments around Sweepstakes. 523 524
525

Fig. 12. Comparison of the amplitude of pressure perturbations with wind. Of 2015 (June 25 to 526 July 03) time series of (a) wind velocity and direction (in azimuthal direction, 0 is north) at 527 Tobermory Airport Weather Station Hourly Data. (b) Maximum of observed pressure 528 perturbations (obtained using high pass filtered at 4 minutes). In panel (b), the green background 529 areas indicate the presence of boats (based on the camera recorded data). 530 531 Video observations of Biological activities around the shipwreck 532
533 A careful analysis of the 100+ hours underwater video camera footage revealed that there 534
were no significant sediment resuspension events during the field experiment (See highlights at 535 https://youtu.be/3i0ORJ_EUS4). A byproduct of watching the video was that the fish activity was 536 typically seen to greatest in the evening hours (after approximately 17:00 EST) and was fairly 537 consistently less in the morning and afternoon hours. Further, round gobies were by far the most 538 numerous fish species present, being almost ubiquitous. Round gobies are known to eat native 539 benthic fishes such as sculpins and darters (Parks Canada, 2010) such that they can cause some 540 bioturbation and sediment resuspension. An average of 10.1 and 14.5 goby fish were observed (in 541 the camera window) per second when tour boats are permitted and not permitted, respectively. 542 One possible explanation for this could be that fish activity naturally increases in the evenings, 543 which coincides with times when boats are not present. Other species were also seen, to a lesser 544 degree, including lake and rainbow trout, freshwater drum, common carp, shiner, brook 545 stickleback and a couple of cormorants (birds). 546
547 Discussion 548 549
For over 130 years the hull of the Sweepstakes has rested upright, nearly intact at the head 550 of Big Tub Harbour. As the wood decomposes and metal corrodes, the vulnerability of the wreck 551 to collapse and further deterioration only increases with time. Understanding the nature and source 552 of the forces that could potentially impact the integrity of the site helps to inform and guide 553 possible management actions. Hence, we studied to differentiate the summer and fall water 554 movements around the Sweepstakes to quantify the effect of natural and human derived water 555 movements using spatial and temporal observations of temperatures and currents. The underwater 556 shipwrecks increase flow velocity and the turbulent intensity such that, resulting scouring can 557 ultimately lead to failure and collapse of the structure (Quinn, 2006). Boyce (1996) proposed that 558 the scouring around the Sweepstakes can be attributed to one or combination of wind-driven 559 currents, gravity flows due to upwelling events, surface wave orbital velocities, and flows induced 560 by the wakes of tour boats or skin divers. Hence, to rule out the possible forcing that may cause 561 scouring in Sweepstakes, we studied the individual forcing using high frequency temperature and 562 currents observed at the immediate vicinity of the shipwreck and at the mouth of the Big Tub 563 Harbour. 564
Our field temperature observations show that gradual warming in the water column 565 reaching to maximum of 20 0C in the water column. This is persistent throughout the water column 566 and found everywhere in the Big Tub Harbour. Due to wind setup in Lake Huron and Georgian 567 Bay, internal waves can form at the thermocline and propagate through the lake. When the 568 amplitude of these internal waves is large enough, they can propagate into Big Tub Harbour. The 569 resulting internal waves are identified as episodic upwelling events in the temperature records (Fig. 570 4). As the internal wave runs up the harbour bed shoaling and wave breaking could occur, 571
imparting energy and turbulence into the system which could assist in re-suspension of bottom 572 sediment (Cossu and Wells, 2013; Chowdhury, Wells and Howell, 2016). These upwelling events 573 can clearly be seen in the temperature data sets for all the thermistors located in Big Tub Harbour 574 (Figs 4 and 6). However, the comparison of bottom currents during episodic upwelling events (Fig. 575 7) and when it was not showed a similar variability suggesting insignificant internal gravity flows 576 induced by the cold-water intrusions. 577
Field observations of currents show a barotropic motion at the bottom (1.5 m from the 578 harbor bed) with the significant peaks at diurnal and semidiurnal periods. Thus, to study the 579 currents variability at the bottom near Sweepstakes, we use depth averaged speeds. The analysis 580 of depth averaged bottom currents shows that the mean speeds of 10 cm/s at the prow of the 581 shipwreck while less than 1 cm/s speeds at the starboard side of the shipwreck (Fig. 9). The 582 increase in flow velocity at the prow is due to the conservation of mass as flow of water goes in 583 and out of the harbour (Quinn, 2006). Similarly, the much lower velocities at the side of the boat 584 could represent a stagnation point of water trying to go around the boat. Analysis of bottom 585 currents that might be potentially induced by propeller wash (Fig. 10) showed there was similar 586 variability for when boats were present to when they were absent. This suggests that the propeller 587 wash induced currents do not lead account for the increased intensity of turbulence and scouring 588 around the shipwreck. However, Boyce (1996) suggested that if the boats used full power bursts 589 and thrust, they can produce transient currents where, it will induce turbulence in the water column. 590 Hence, the turbulence caused by transient currents increases the possibility of erosion in the bottom 591 sediments around the shipwreck. Scouring associated with these transient currents (usually 592 generate within few seconds) are localized and cannot contribute to widespread scouring observed 593 in the vicinity of the Sweepstakes (Boyce, 1996). Based on our real-time observations, none of the 594 boats were operated at such a maximum thrust. In order to account for the high frequency 595 oscillations caused by the tour boasts, the natural modes of oscillations were removed from the 596 pressure perturbations (reader may refer to the Fig. 8). The power spectrum showed that the 597 resonant frequency (Helmholtz frequency) of the Big Tub Harbour is 4.2-minutes. Thus, we 598 applied a high pass filter at 4-minutes only to account for the short-term fluctuations caused by the 599 tour boats. The presence of boats and the wind showed a good correlation with the variability in 600 the amplitudes of the high-pass filtered pressure perturbations (reader may refer to the Fig. 10). 601 However, mean amplitude is in the order of 5 mm such that the transient currents are small to 602 account for the erosion of bottom sediments. 603
As water flows over the bottom, it exerts a stress on the bottom sediments. This 604 phenomenon results in transport of material as suspended load modes or as bedload transport 605 (Signell and Butman, 1991). However, suspended transport caused by fine sediment particles is 606 much faster and farther compared to bedload transport by the coarse sediment materials. The shear 607 stress (𝜏) can be calculated as 𝜏 = 𝜌F𝑐;𝑢', where, 𝜌F is the density of water,𝑐; is the drag 608 coefficient, 𝑢 is the measured bottom currents. The fined grain silty sand in the vicinity of the 609 Sweepstakes (See Fig. 2) is in the range of 125-200 micron (0.12 - 0.2 mm) (Boyce, 1996). Butman 610 (1987) suggests that for resuspension of find sand (~0.125 mm) needs a near bed bottom current 611 (𝑢) is ~80 cm/s. For medium sand (~0.25 mm), the near bed bottom current (𝑢) is ~200 cm/s. 612 With respect to our observations, we see that the maximum currents occur at 30 cm/s, while 613 maintaining the mean currents at 10 cm/s. Therefore, sediment resuspension due to bottom currents 614 observed during deployment is insignificant, as observed in the underwater video record. Although 615 there were essentially no waves during our deployment in the Big Tub Harbour, it is well known 616 that there are significant waves due to winter storms in Lake Huron (Scott Parker, personal 617
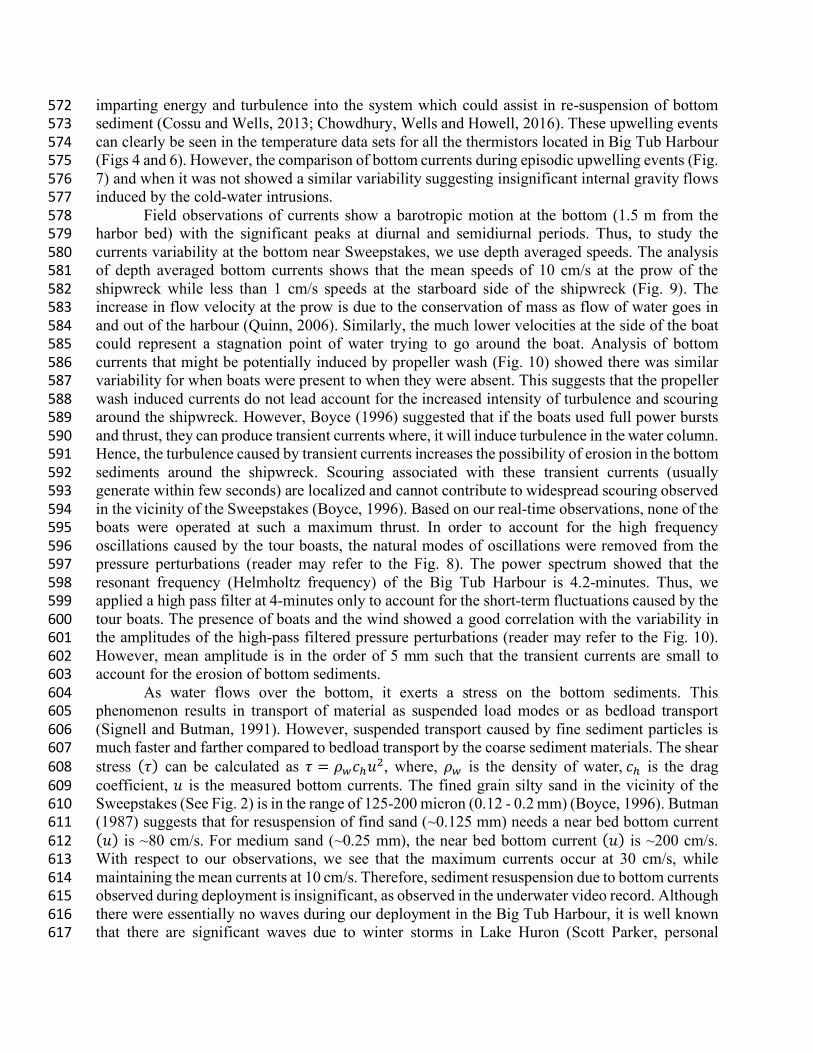
communication). These increased wave heights in fall and winter are seen in the monthly wave 618 climatology extracted from hourly characteristic significant wave heights observed at the buoy 619 located in the southern Georgian Bay (44.945 N, 80.627 W, Buoy ID: C45143). This data shows 620 an increase in significant wave heights with respect to the climatological winds (Fig. 13). Signell 621 and Butman (1991) suggested that if there are significant waves due to storm events, the stress at 622 the bottom is increased by the unsteady wave currents. Therefore, fall and winter storms are likely 623 the main cause for scouring observed near the Sweepstakes. 624 625
626 Fig. 13. Monthly climatological (a) characteristics significant wave heights and (b) winds. The 627 data was observed at the meteorological buoy located in the southern Georgian Bay (44.945 N, 628 80.627 W, and Buoy ID: C45143). The data runs from 2007 May through 2017 November. 629 630 Conclusion 631 632
Quantifying and differentiating natural and human derived water movements around the 633 wreck of the Sweepstakes is important for informing and guiding management actions. Naturally 634 there would be some different options for managing human derived forces such as tour boat 635 activity at the site. However, as observed, there does not appear to be a difference in water currents 636 between when tour boats are present or absent. New and high frequency observations used in this 637 study greatly supports the conclusions made in the previous study by Boyce (1996). Field 638 observations suggest that the circulation induced by internal gravity waves derived from upwelling 639 is insignificant. The analysis of normalized frequency histogram on bottom current variability 640 during presence of tour boats and when it was not show insignificant effect of propeller wash 641

induced bottom current to cause scouring in the vicinity of the Sweepstakes. Although there is a 642 significant pressure perturbation generated by the tour boats, we see that insignificant current near 643 the harbour bed. On the other hand, observed monthly climatological winds and significant wave 644 heights in the Georgian Bay suggest that increased winter storm activities. The resulting significant 645 wave heights are few orders of magnitude larger than the wave amplitudes derived from high 646 frequency oscillations. These large winter storms can produce energy from order of magnitude 647 large amplitude waves such that scouring is possible. While a study such as this, provides an 648 opportunity to understand some of the forces at play, it is also helps to inform future management 649 discussions and actions. What actions are tenable, possible and desirable in the long-term has yet 650 to be confirmed for this valued submerged cultural resource. 651 652 Acknowledgement 653 654 We thank Environment and Climate Change Canada and the captains and crews of the Sauger and 655 the Stickleback for logistical support with the field measurements. Scott thanks Bruce Gray, Dive 656 Operations Officer for ECCC (Environment and Climate Change Canada) and his team, and 657 Katrina Keeshig, Parks Canada. 658
References 659 660 Bennett, E.B., 1988. On the physical limnology of Georgian Bay. Hydrobiologia 163, 21-34. 661 Bethencourt, M., Fernandez-Montblanc, T., Izquierdo, A., Gonzalez-Duarte, M.M., Munoz-Mas, 662
C., 2018. Study of the influence of physical, chemical and biological conditions that 663 influence the deterioration and protection of Underwater Cultural Heritage. Science of the 664 Total Environment 613, 98-114. 665
Boyce, F.M., 1996. Water Movements at the West End of Big Tub Harbour, Ontario: What is 666 Causing the Scouring of Sediments in the Vicinity of the Wreck of the Sweepstakes? 667 National Water Research Institute, Burlington, Ontario. 668
Canada, 2002. Canada National Marine Conservation Areas Act, c. 18, Canada Gazette. 669 Chowdhury, M.R., Wells, M.G. and Howell, T., 2016. Movements of the thermocline lead to high 670
variability in benthic mixing in the nearshore of a large lake. Water Resources 671 Research, 52(4), pp.3019-3039. 672
Cossu, R., Wells, M.G., 2013. The Interaction of Large Amplitude Internal Seiches with a Shallow 673 Sloping Lakebed: Observations of Benthic Turbulence in Lake Simcoe, Ontario, Canada. 674 PLoS ONE 8, e57444. doi:10.1371/journal.pone.0057444 675
Great Lakes Shipwreck Museum, 2019. Shipwrecks. 676 Gregory, D., Jensen, P., Straetkvern, K., 2012. Conservation and in situ preservation of wooden 677
shipwrecks from marine environments. J. Cult. Herit. 13, S139-S148. 678 Grinsted, A., Moore, J. C., Jevrejeva, S., 2004. Application of the cross wavelet transform and 679
wavelet coherence to geophysical time series, Nonlin. Process. Geophys., 11, 561-566. 680 Hlevca, B., Wells, M. G., & Parker, S., 2015. Amplification of long-period waves in shallow 681
coastal embayments of the Great Lakes. Environmental Fluid Mechanics, 15(6), 1181-682 1213. 683
Kohl, C., 2008. The Great Lakes Diving Guide, 2nd edition Seawolf Communications, Inc. 684 Linares, Á., Wu, C.H., Anderson, E.J., Chu, P.Y., 2018. Role of meteorologically induced water 685
level oscillations on bottom shear stress in freshwater estuaries in the Great Lakes. Journal 686 of Geophysical Research: Oceans, 123(7), pp.4970-4987. 687
Maarleveld, T.J., Guérin, U., Egger, B., 2013. Manual for Activities directed at Underwater 688 Cultural Heritage. Guidelines to the Annex of the UNESCO 2001 Convention. United 689 Nations Educational, Scientific and Cultural Organization (UNESCO), Paris, France. 690
MacLeod, I.D., Binnie, N.E., 2011. A long-term study of conservation management and corrosion 691 of shipwrecks in the Fathom Five underwater National Park, Lake Huron, Canada, 692 International Council of Museums - ICOM, Lisbon. 693
McClellan, S., 2001. The diving experience, in: Parker, S., Munawar, M. (Eds.), Ecology, Culture 694 and Conservation of a Protected Area: Fathom Five National Marine Park, Canada. 695 Backhuys Publishers, Leiden, The Netherlands, pp. 293-306. 696
NOAA, State of Michigan, 2009. Thunder Bay National Marine Sanctuary Final Management 697 Plan. National Oceanic and Atmospheric Administration (NOAA) and State of Michigan. 698
Parker, S.R., Mandrak, N.E., Truscott, J.D., Lawrence, P.L., Kraus, D., Bryan, G., Molnar, M., 699 2017. Status and extent of aquatic protected areas in the Great Lakes. The George Wright 700 Forum 34(3). 701
Parks Canada, 1991. Operational Policies Big Tub Harbour Wrecks. Parks' Response to Public 702 Comments. Fathom Five National Marine Park, Tobermory, Ontario. 703

Parks Canada, 1992. Canadian Parks Service Issue Analysis, Management Operational 704 Alternatives for the Wreck of the Schooner Sweepstakes - Big Tub Harbour, Fathom Five 705 National Marine Park. Canadian Parks Service, Tobermory, Ontario. 706
Quinn, R., 2006. The role of scour in shipwreck site formation processes and the preservation of 707 wreck-associated scour signatures in the sedimentary record–evidence from seabed and 708 sub-surface data. Journal of Archaeological Science. 33(10):1419-32. 709
Ringer, R.J., Folkes, P., 1991. A Marine Archaeological Survey of Fathom Five National Marine 710 Park. Parks Canada, Tobermory, Ontario, p. 406. 711
Rabinovich, A.B., 2010 Seiches and harbour oscillations. InHandbook of coastal and ocean 712 engineering. pp. 193-236. 713
Schwab, D. J., Rao, D. B., 1977. Gravitational oscillations of Lake Huron, Saginaw Bay, Georgian 714 Bay, and the North Channel. Journal of Geophysical Research, 82(15), 2105-2116. 715
Signell, R.P., Butman, B., 1991 Estimates of Sediment Movement and Resuspension in the New 716 York Bight: Implications for Dredged Material Disposal. US Geological Survey. 717
Soulsby, R., 1997 Dynamics of marine sands: a manual for practical applications. Thomas Telford. 718 UNESCO, 2013. The Benefit of the Protection of Underwater Cultural Heritage for Sustainable 719
Growth, Tourism and Urban Development. United Nations Educational, Scientific and 720 Cultural Organization. 721
Watzin, M.C., Cohn, A.B., Emerson, B.P., 2001. Zebra mussels, shipwrecks, and the environment. 722 Final Report, 2001. University of Vermont and Lake Champlain Maritime Museum, 723 Vergennes, VT. 724
Welch, P., 1967. The use of fast Fourier transform for the estimation of power spectra: a method 725 based on time averaging over short, modified periodograms. IEEE Transactions on audio 726 and electroacoustics, 15(2), 70-73. 727
Wells, M., Parker, S., 2010. The thermal variability of the waters of Fathom Five National Marine 728 Park, Lake Huron. Journal of Great Lakes Research. 36(3):570-6. 729
Wheeler, A.J., 2002. Environmental controls on shipwreck preservation: The Irish context. J. 730 Archaeol. Sci. 29, 1149-1159. 731
Wilkes, D., 2001. An overview of Canada's first national marine park, in: Parker, S., Munawar, M. 732 (Eds.), Ecology, Culture and Conservation of a Protected Area: Fathom Five National 733 Marine Park, Canada. Backhuys Publishers, Leiden, The Netherlands, pp. 13-24. 734
Wunk, W.H., 1949. Surf beats. EOS, Transactions American Geophysical Union. 30(6):849-54. 735
Related Documents