1 1. Introduction 1.1 Prostate gland In humans, prostate development occurs during the second and third trimester and is complete at the time of birth (Lowsley, 1912). The prostate sits under the bladder and is located at the base of the penis and in front of the anus. The structure of the prostate is that it has a narrow hole through the middle. It is fashioned this way as the urethra, the tube which empties urine from the bladder passes through this hole on its way to the end of the penis (The Cancer Council Victoria, 2007). The gland enlarges continuously in size to reach the adult weight of approximately 20 g by 25–30 years of age (Figure 1.1). Figure 1.1: Normal prostate anatomy (Robert et al., 2000)

Welcome message from author
This document is posted to help you gain knowledge. Please leave a comment to let me know what you think about it! Share it to your friends and learn new things together.
Transcript

1
1. Introduction
1.1 Prostate gland
In humans, prostate development occurs during the second and third trimester and is
complete at the time of birth (Lowsley, 1912). The prostate sits under the bladder and is
located at the base of the penis and in front of the anus. The structure of the prostate is
that it has a narrow hole through the middle. It is fashioned this way as the urethra, the
tube which empties urine from the bladder passes through this hole on its way to the end
of the penis (The Cancer Council Victoria, 2007). The gland enlarges continuously in
size to reach the adult weight of approximately 20 g by 25–30 years of age (Figure 1.1).
Figure 1.1: Normal prostate anatomy (Robert et al., 2000)

2
Similarly to the breast, the prostate is a gland which produces and secretes
fluids. The prostate also controls the flow of these fluids. Semen which was ejaculated
from the penis during sexual climax (orgasm) was produced by the cells which line the
prostate gland. The prostate also produces some of the fluid in the semen. The prostate
also helps separate the urine from the semen. The way the semen is found to be in the
liquid form was because of the prostate specific antigen (PSA). PSA is an enzyme,
which is produced primarily by cells lining the ducts and the acini of the prostate gland.
The PSA is found in the form of a glycoprotein (Strax, 2008).
The prostate overall structure however is the greatest setback. The wrap around
structure around the urethra becomes problematic if the prostate swells or enlarges.
Enlargement of the prostate could occur in man of all ages and could be cause by
prostate infection, commonly known as prostatitis. It could also be caused by benign
growth. In both cases, it will cause pain, discomfort and problems in urination (Strax,
2008).
1.2 Prostate Diseases
Generally the occurrence of prostate associated problems increase with ages.
Symptoms or problems of the following are relatively common.
Difficulty in getting the urinary flow started, especially when a person is in a
hurry
Difficulty stopping the urine flow
Requires longer time, due to the urine stream is weak, or it stops and starts
Dribbling of urine after a person have finished
Frequency of going to the toilet throughout the day, even though there is not
much urine to pass

3
Getting up at night to go to the toilet, a person used to sleep through.
Needing to go urgently at all times
An unfinished feeling or that there is need to go again repeatedly, although
nothing is produced
Pain or a burning sensation when urinating
Blood in the urine (The Cancer Council Victoria, 2007)
Due to the structure of the prostate (Strax, 2008) the prostate will be a source of
three of the major health problems which affects men. The following are the major
prostate disease:
Benign prostatic hyperplasia (BPH); commonly known as the prostate
enlargement. It is one of the most common benign tumors in men
Prostatitis; the prostate inflammation and the most common cause of urinary
tract infections in men. This is a highly painful condition
Prostate cancer, the most common cancer in men (Walsh and Worthington,
2002).
BPH is commonly found in most men at the age of sixty or older. BPH is a non-
malignant enlargement of the prostate effecting about 50% of men of that particular age
category. This enlargement however is normal, and is caused by aging and is rarely life
threatening but may produce up-setting symptoms (Rubenstein and McVary, 2008).
BPH is not prostate cancer, as BPH and prostate cancer are two separate diseases which
are formed in different parts of the prostate. Having developed BPH does not indicate
that a man is more or less likely to acquire prostate cancer. The difference in prostate
cancer and BPH is that prostate cancer initiates at the outer, marginal zone of the
prostate and is growing outward and invades tissues surrounding it and that is primarily
4
the reason that it seldom produces symptoms until it is far advanced. Meanwhile BPH
on the other hand begins in a small area of the inner prostate known as transition zone
which is a ring of tissues that make a natural circle surrounding the urethra. While
prostate cancer grows outwards, BPH grow inwards toward the prostate’s core and
constantly tightening around the urethra and interfering with urination, which provides
many symptoms. BPH is a very common condition and it is not cancerous, but it can
mimic cancer (Walsh and Worthington, 2002). BPH can be treated with medications or
surgery. The medications will be able to alter hormone levels, or can relax or reduce the
size of the prostate, hence reducing the pressure on the urethra. Medication may take
time like months before the condition improves. Surgery procedures to remove part of
the prostate could be taken to stop the squeezing of the urethra. Laser and microwave
treatments could also be applied. (The Cancer Council Victoria, 2007).
Prostatitis in men is the most prevalent cause of urinary tract infection. It is
anticipated that a quarter of all men who visits a doctor for urological problems have tell
tale signs of prostatitis. In general, there are four conditions, which are categorized as
“prostatitis”. The first, two acute and chronic bacterial prostatitis, as the name suggest,
are caused by bacteria and are not common but easily treated. These two prostatitis are
accompanied by symptoms such as fever, chills, severe burning on urination, increased
frequency of urination, and, in certain cases, a life-threatening infection in the
bloodstream.
The third form of prostatitis is called chronic prostatitis or chronic pelvic pain
syndrome. The actual causes these forms of prostatitis are not known and medications
like antibiotics do not help at all. Medications are mainly targeted at relieving
symptoms, with muscle relaxants such as alpha-blockers and other drugs, which ease
muscle tension in the prostate and make urination easier. The other form of prostatitis is
called the asymptomatic inflammatory prostatitis, which produces no symptoms and is

5
usually found by chance, when inflammatory cells are found in the prostatic fluid or
inflammation is detected on a prostate biopsy. Again, in the case of prostatitis, it is not a
cancer (Walsh and Worthington, 2002), treatment is with the help of antibiotics and
consumption of medication may need to persist for several months. Some men may also
need surgery to stop the swollen prostate from pressing on the urethra (The Cancer
Council Victoria, 2007).
For the detection of those prostate diseases, the doctor normally collect a patient’s
urine and thoroughly exam his prostate gland. To check the prostate gland, the doctor
undergoes digital rectal examination, which involves inserting a well-lubricated gloved
finger into the rectum to check for any abnormalities of the gland. Meanwhile prostate
specific membrane antigen (PSMA) test could also be carried out where a blood tests to
look for this glycoprotein compound in the blood, which is produced by the prostate.
Once there is a high level of detection it could be probable be prostate cancer but the
doctor needs to carry out more tests to be certain. A biopsy could be carried out once
PSMA test or digital rectal examination is abnormal. This involves an ultrasound probe
being placed in the rectum to find areas of the prostate which are abnormal. Samples
(usually six or more) of the prostate are subsequently taken and sent to be observed
under the microscope. This procedure can be certain to diagnose if one has prostate
cancer. The biopsy will also provide insights of how fast the cancer may develop and
how much of a threat it may be (The Cancer Council Victoria, 2007).
6
1.3 Prostate Cancer
1.3.1 History of Prostate Cancer
The history of prostate cancer spans for about 200 years from the recognition of
the disease to the development of the three primary types of treatment which are
surgery, radiation and hormonal manipulation. Random cases of prostate cancer were
noted by physician as way back as 1817. In the early days, histological examination was
not yet in clinical use and hence, diagnoses were made at autopsies. Later on in 1853,
the first case of prostate cancer established by histological examination was reported by
Adams, a surgeon at The London Hospital, where a 59 year old man with a scirrhous
(hard and firm) tumor at the prostate gland. The prostate cancer largely unrecognized
until the turn of the last century, when prostatic adenectomy for urinary obstruction
became widely performed resulting in more specimen available for histological
examination.
In the year 1898, Fuller performed complete prostate removal together with a
bladder neck resection and then patient bladder function recovered. After the discovery
of X-ray and its applications, in 1909 Minet from Paris placed a radium tube in a
catheter to irradiate prostate cancer and subsequently in 1913 Pasteau and Degrais
reported a 3 year cure using this method. In the early 1900s experiments in animals
established the relationship of the pituitary and testis as well as their effects on the
prostate and this sparked the beginning of the research on the treatment through
hormonal manipulation. All these studies subsequently lead to the major discovery of
the dramatic effects of castration and estrogen administration on prostate cancer cells in
1941 by Huggins at the University of Chicago. During the period of 50 years, Huggins
reported more than 230 scientific articles, mostly on the effects of hormones on cancer,
with emphasis on the prostate and breast.
7
In 1966 he shared the Nobel Prize in physiology and medicine with Rous, who
developed the first virally induced solid tumor in animals, called the Rous-chicken
sarcoma (Lytton, 2001).
1.3.2 Definition of Prostate Cancer
Prostate cancer is a form of cancer that develops in the prostate. The cells are
known to mutate and there is uncontrollable growth. Prostate cancer is the primary
cause of cancer death and is the most common major cancer in men. A common fact is
noted that when prostate cancer is small and curable, it is often also silent where it
produces no tell tale signs. Hence, routine testing is very important where the cancer is
detected as early as possible and once if it is detected too late, the prostate cancer can be
often lethal and the symptoms are often painful if the disease is allowed to run its
course. However if it is detected early prior to the cancer cells spreading beyond the
wall of the prostate, prostate cancer can be cured with surgery or radiation (Walsh and
Worthington, 2002).
In some cases, some men with small and slow-growing tumors, a process called
expectant management which means following the disease closely may be a safer
option. With the advances of technologies, treatment and successful rate of curing
prostate cancer is better and with fewer side effects. However, although in some cases
the cancers are incurable, the metastasis of the cancer cells can be contained with the
advancement in the medical technology.
8
In prostate cancer the key to a better chance of recovery is as follows:
• Prevention—to ward off prostate cancer entirely, or at least delay its onset for
decades.
• Earlier diagnosis—with the help of highly sensitive tests and sophisticated
models for analyzing the results, detecting prostate cancer at the earliest and
most curable stages yet.
• Better treatment for localized disease—expanding and refining effective
treatments, and working to minimize side effects even further.
• Better control of advanced disease. (Walsh and Worthington, 2002).
1.3.3 Genetics of cancer
Similar to other cancers, prostate cancer also develops due to the consequences
of genetic changes. There are quite a number of putative genes that have been isolated
for the development of breast, ovarian (BRCA1, BRCA2) and colon cancer (hMLH1,
hMSH2) but however, the etiology and pathogenesis of prostate cancer continues to be
largely unknown. This is also due to the fact that prostate cancer is such a
heterogeneous disease. The diversity of prostate cancer with the stepwise transition
from benign cells through prostatic intraepithelial neoplasia (PIN), invasive carcinoma,
the development of metastases to hormone refractory disease make this an interesting
disease to study but also a difficult disease to cure. Many works have been published on
clinical prognostic factors but with advanced development in molecular genetics, the
genetic code analysis that will in the future give both prognostic information and targets
for therapeutic intervention.
9
At present, the available prognostic factors have recently been ranked by a
multidisciplinary group of clinicians, pathologists and statisticians and they are divided
in three categories as follows:
Category I: Factors of prognostic importance and are used frequently on a daily
basis in patient management. These are inclusive of the preoperative prostate
specific antigen (PSA), TNM stage, Gleason grade and surgical margin status.
Category II: Factors that have been comprehensively studied but the importance
remains to be validated statistically, e.g. tumor volume, histological type and
DNA ploidy.
Category III: All factors insufficiently studied to demonstrate their prognostic
value: examples would be oncogenes, tumor suppressor genes and apoptosis
genes, as well as perineural invasion, neuroendocrine differentiation microvessel
density, nuclear roundness and chromatin texture (Bott et al., 2003).
1.3.4 Signs and symptoms
Prostate cancer could be identified with three different stages namely the early-
stage disease, locally advanced disease and advanced disease. In the early-stage disease,
patient with organ-confined prostate cancer most commonly without symptoms while
patient with a large component of benign prostatic hyperplasia could be identified with
bladder outlet obstruction unrelated to prostate cancer. In the case of locally advanced
disease, bladder outlet obstruction is mainly the sign of locally advanced prostate cancer
however there are few cases with locally advanced disease present with hematuria,
urinary tract infections, and irritative voiding symptoms secondary to bladder outlet
obstruction. Lastly, in the case of advanced disease there are rare instances where

10
patient with bulky lymph node metastasis may present with bilateral lower-extremity
edema (Moul et al., 2008).
1.3.5 Screening and diagnosis
Prostate cancer could be screened using prostate specific membrane antigen
(PSMA) and digital rectal examination (DRE). With such screening, this has increases
the prostate cancer detection. With this, prostate cancer is detected at earlier stages,
when they are potentially curable. Most prostate cancers were undetected until it
produces local symptoms or distant metastases. The discovery at this stage is often too
late and incurable.
The digital rectal examination could possible detect nodularity or induration, and
this is followed by a biopsy. Even with the detection of such irregularities using DRE,
from the subsequent biopsy procedure, it only leads to a diagnosis of prostate cancer in
only 15% to 25% of cases. Although such DRE detection is neither accurate nor
sensitive for prostate cancer detection, it is however that abnormal DRE is associated
with a fivefold increased risk of cancer present at the time of screening. PSA is a serine
protease produced by the prostatic epithelium and secreted in large quantities through
the seminal fluid. PSA level in the serum could be increased through inflammation of
the prostate, urinary retention, prostatic infection, benign prostatic hyperplasia, prostate
cancer, and prostatic manipulation. The overall sensitivity for PSA levels ranges from
50% to 70% but this depends on the threshold used, and it is not as specific, and in
addition, it does not allow for differentiation between indolent and aggressive disease.
A more worthwhile approach for PSA screening may be to use the rate of rise in PSA
(PSA velocity) in combination with the absolute PSA value. This approach has been
11
shown to be useful recently in the form of age-adjusted PSA velocity, but accepted
guidelines are still controversial (Moul et al., 2008).
1.3.6 Prognosis
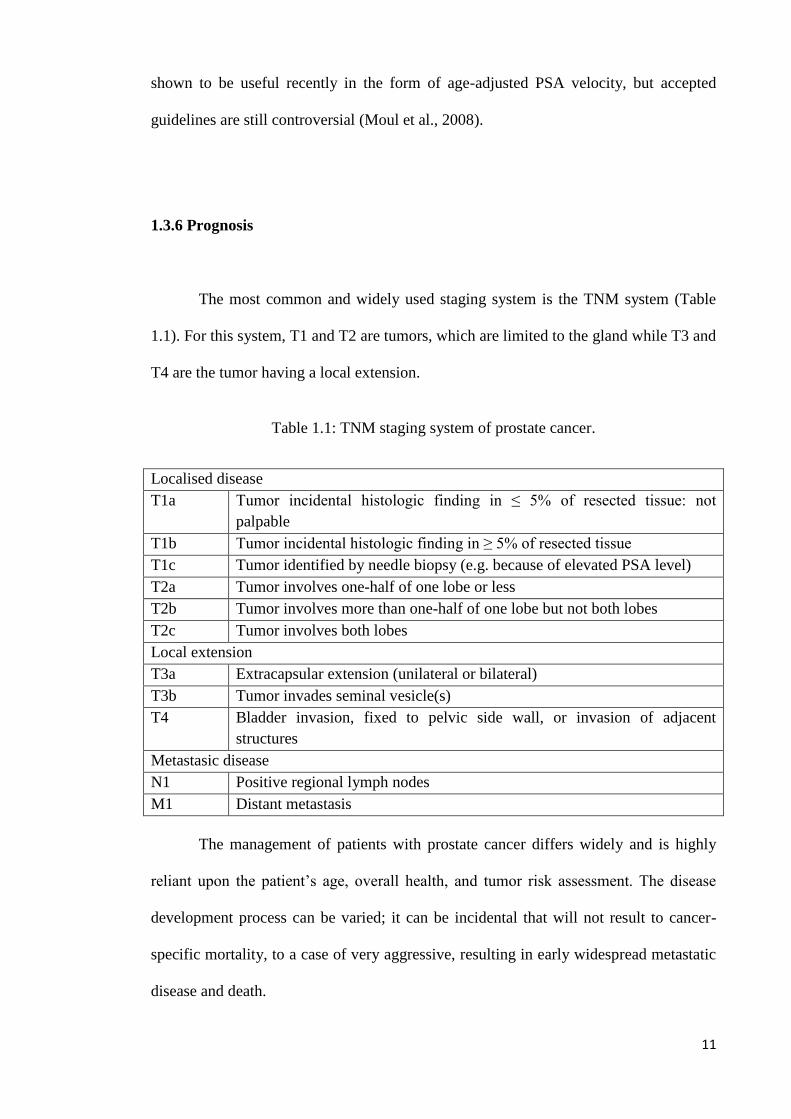
The most common and widely used staging system is the TNM system (Table
1.1). For this system, T1 and T2 are tumors, which are limited to the gland while T3 and
T4 are the tumor having a local extension.
Table 1.1: TNM staging system of prostate cancer.
Localised disease
T1a Tumor incidental histologic finding in ≤ 5% of resected tissue: not
palpable
T1b Tumor incidental histologic finding in ≥ 5% of resected tissue
T1c Tumor identified by needle biopsy (e.g. because of elevated PSA level)
T2a Tumor involves one-half of one lobe or less
T2b Tumor involves more than one-half of one lobe but not both lobes
T2c Tumor involves both lobes
Local extension
T3a Extracapsular extension (unilateral or bilateral)
T3b Tumor invades seminal vesicle(s)
T4 Bladder invasion, fixed to pelvic side wall, or invasion of adjacent
structures
Metastasic disease
N1 Positive regional lymph nodes
M1 Distant metastasis
The management of patients with prostate cancer differs widely and is highly
reliant upon the patient’s age, overall health, and tumor risk assessment. The disease
development process can be varied; it can be incidental that will not result to cancer-
specific mortality, to a case of very aggressive, resulting in early widespread metastatic
disease and death.
12
Patients with a low Gleason score (2– 4) that has clinically localized prostate
cancer treated conservatively (observation or hormonal therapy alone), have a small risk
of death from their cancer within 15 years (4%–7%). Meanwhile, those with poorly
differentiated tumors (Gleason score 8–10), have a higher risk of death cause by
prostate cancer than of any other causes, even when the cancer is diagnosed in the
eighth decade of life. Besides that, if a man prior to sixty years old diagnosed with a
clinically localized prostate cancer with a Gleason score of 8 to 10 and is left untreated,
that patient has an 87% risk of dying of the disease within 15 years (Moul et al., 2008).
1.4 Prostate specific membrane antigen (PSMA)
1.4.1 Structure of PSMA
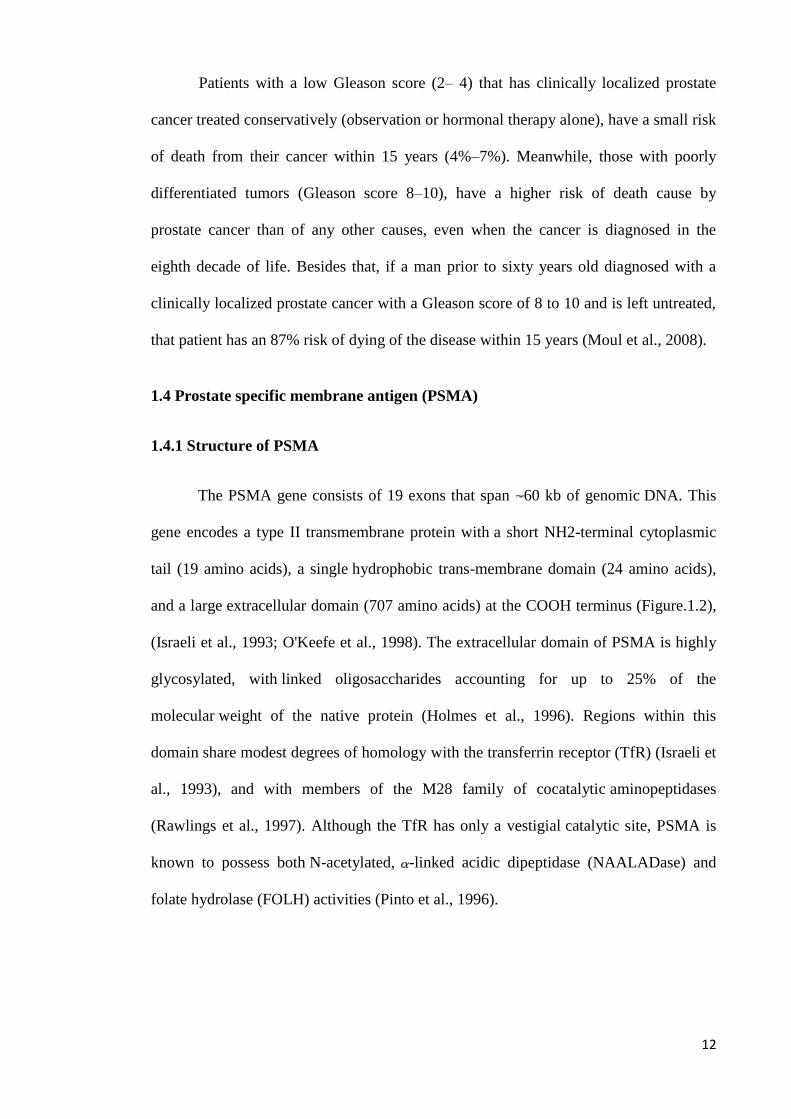
The PSMA gene consists of 19 exons that span 60 kb of genomic DNA. This
gene encodes a type II transmembrane protein with a short NH2-terminal cytoplasmic
tail (19 amino acids), a single hydrophobic trans-membrane domain (24 amino acids),
and a large extracellular domain (707 amino acids) at the COOH terminus (Figure.1.2),
(Israeli et al., 1993; O'Keefe et al., 1998). The extracellular domain of PSMA is highly
glycosylated, with linked oligosaccharides accounting for up to 25% of the
molecular weight of the native protein (Holmes et al., 1996). Regions within this
domain share modest degrees of homology with the transferrin receptor (TfR) (Israeli et
al., 1993), and with members of the M28 family of cocatalytic aminopeptidases
(Rawlings et al., 1997). Although the TfR has only a vestigial catalytic site, PSMA is
known to possess both N-acetylated, -linked acidic dipeptidase (NAALADase) and
folate hydrolase (FOLH) activities (Pinto et al., 1996).
13
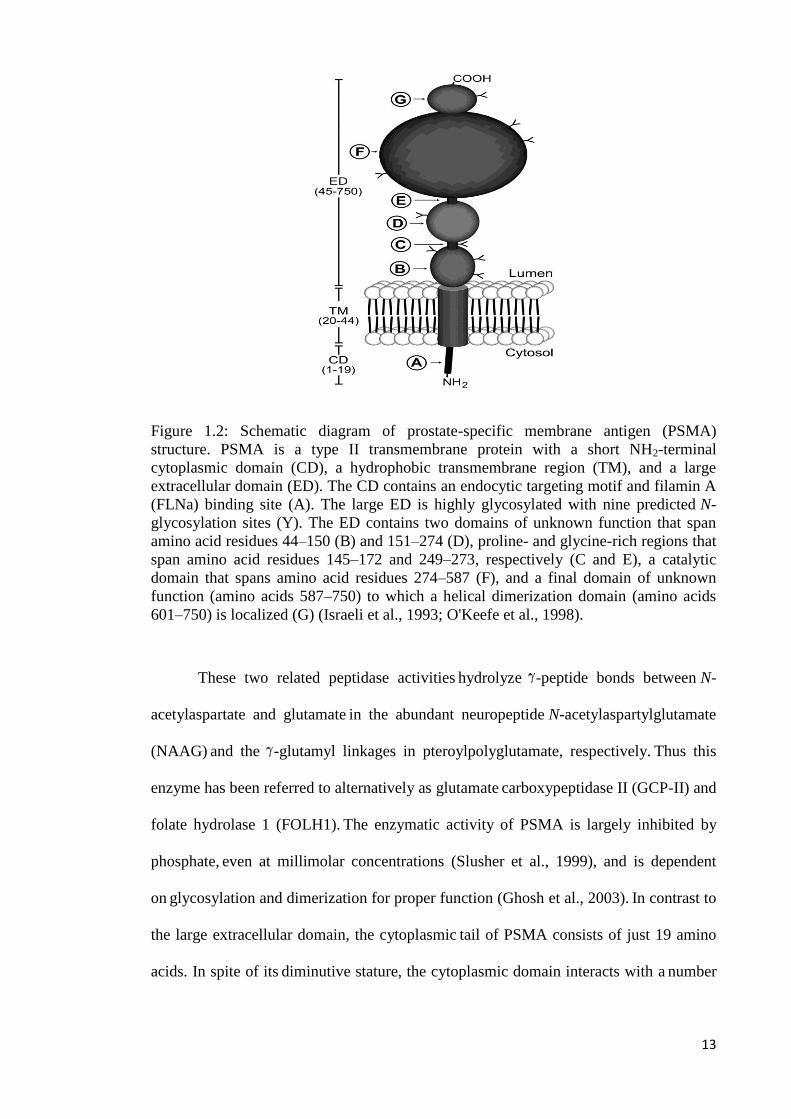
Figure 1.2: Schematic diagram of prostate-specific membrane antigen (PSMA)
structure. PSMA is a type II transmembrane protein with a short NH2-terminal
cytoplasmic domain (CD), a hydrophobic transmembrane region (TM), and a large
extracellular domain (ED). The CD contains an endocytic targeting motif and filamin A
(FLNa) binding site (A). The large ED is highly glycosylated with nine predicted N-
glycosylation sites (Y). The ED contains two domains of unknown function that span
amino acid residues 44–150 (B) and 151–274 (D), proline- and glycine-rich regions that
span amino acid residues 145–172 and 249–273, respectively (C and E), a catalytic
domain that spans amino acid residues 274–587 (F), and a final domain of unknown
function (amino acids 587–750) to which a helical dimerization domain (amino acids
601–750) is localized (G) (Israeli et al., 1993; O'Keefe et al., 1998).
These two related peptidase activities hydrolyze -peptide bonds between N-
acetylaspartate and glutamate in the abundant neuropeptide N-acetylaspartylglutamate
(NAAG) and the -glutamyl linkages in pteroylpolyglutamate, respectively.
Thus this
enzyme has been referred to alternatively as glutamate carboxypeptidase II (GCP-II) and
folate hydrolase 1 (FOLH1). The enzymatic activity of PSMA is largely inhibited by
phosphate, even at millimolar concentrations (Slusher et al., 1999), and is dependent
on glycosylation and dimerization for proper function (Ghosh et al., 2003).
In contrast to
the large extracellular domain, the cytoplasmic tail of PSMA consists of just 19 amino
acids. In spite of its diminutive stature, the cytoplasmic domain interacts with a
number
14
of proteins and has a major impact on the localization and molecular properties of
PSMA (Anilkumar et al., 2003).
1.4.2 Dimerization of PSMA
Homodimerization is a fundamental feature of many transmembrane receptors.
Induction of homodimer formation is often induced by ligand binding, which is in turn
necessary for mediating the cellular response of the receptor (Schlessinger et al., 2002).
The TfR is an archetypal example of one such receptor. This type II transmembrane
protein is involved in regulating cellular iron homeostasis through
binding and
internalization of iron-laden transferrin (Aisen et al., 2004). PSMA shares homology
with the TfR at the levels of both amino acid identity and domain organization
(Mahadevan et al., 1999).
Like the TfR, PSMA is expressed as a noncovalently linked homodimer on the
cell surface (Lawrence et al., 1999; Schülke et al., 2003). This dimerization is
apparently mediated by epitopes within the large extracellular domain, because
truncated versions of PSMA lacking the cytoplasmic and transmembrane domains are
still capable of interacting. PSMA dimerization is critical to maintaining the
conformation and enzymatic activity of PSMA (Schülke et al., 2003). Although the
possibility has yet to be addressed fully, the similarity between PSMA and TfR at the
amino acid and structural levels, combined with the common dimerization requirement,
may suggest that these proteins share similar receptor and ligand
transport functions.
15
1.4.3 Potential role of PSMA enzyme activity
The prostate gland is composed mainly of stromal, epithelial, and
neuroendocrine cells. The dynamic balance of cell proliferation, differentiation, and
apoptosis in general maintains the cellular and tissue homeostasis. This balance is
generated by the continuous cross talk among these cell populations (Sung et al., 2002).
For this purpose, epithelial and stromal cells secrete various types of growth factors,
chemokines, and neuropeptides (Wong & Wang, 2000). Deregulation in this paracrine
communication can result in derangement of the prostate gland, such as benign prostate
hyperplasia and prostate carcinoma (Dawson et al., 2004). For example, the peptidase
NEP normally acts to inhibit the migratory properties of prostate epithelial cells.
NEP
achieves the inhibition of prostatic epithelial cell migration by cleaving critical
neuropeptides such as bombesin and endothelin and thereby prevents the relay of signal
transduction mediated by G protein-coupled receptors (Sumitomo et al., 2000). Like
NEP, PSMA is also a type II transmembrane glycoprotein with cocatalytic
metallopeptidase activity. The increased expression of PSMA in prostatic
adenocarcinoma may indicate a role in the cleavage of signaling molecules involved in
maintaining prostate gland architecture and function. The overexpression of PSMA
could potentially disturb the growth balance of the prostate gland.
1.4.4 Genomic properties
PSMA expression in prostate cancer is significantly higher than in benign
prostate hyperplasia or the normal prostate and is greater in prostate cancer with a
higher Gleason score (Marchal and Ghosh et al., 2004), suggesting that the regulatory
elements controlling PSMA expression become more active as prostate cancer
progresses.

16
There are at least three PSMA variants produced by alternative splicing: PSM',
PSM-C, and PSM-D. Interestingly, the ratio of full-length PSMA to variant PSM',
which lacks nucleotides 114 to 380 of the PSMA cDNA and, as a result, is located in
cytoplasm, increases as normal prostate progresses to the tumor (Su et al., 1995).
To date, two transcription regulatory elements have been characterized: the 1.2-
kb promoter upstream of the PSMA-encoding gene (FOLH1) and the PSMA enhancer
core (PSME) in the third intron of FOLH1. PSME exhibits high activity only in PSMA-
positive LNCaP and C4-2 cells; very low activity in PC-3 cells; and no activity in other
PSMA-negative cells tested (Watt et al., 2001, Lee et al., 2002). Consistent with PSMA
expression, PSME is also negatively regulated by androgens, so it exhibits a much
higher activity at low levels or in the absence of androgens (Wright et al., 1996, Watt et
al., 2001), making PSME a strong candidate for mediating virus replication or
expressing exogenous cytotoxic genes in hormone-refractory prostate cancer.
1.5 Polymerase Chain Reaction (PCR)
The polymerase chain reaction is a selective amplification of a particular region
or fragment of a DNA molecule. In order for a PCR to be carried out the border
sequence of the region must be known. This is because of two short oligonucleotide
flanking the fragment of interest is need for the amplification and this short
oligonucleotide is known as primers. The primers delimit the region that would be
amplified. Amplification is normally being conducted using DNA I polymerase enzyme
from Thermus aquaticus. Taq polymerase the enzyme from Thermus aquaticus is
resistant to heat denaturation.
17
The overall procedure begins with the addition of enzyme to the primed DNA
template and incubated to produce new complementary strands. This is the heated to
94 °C so the newly synthesize strand will separate and this is subsequently cooled to let
more primers to hybridize the respective position. This process of denaturation,
hybridization and synthesis is repeated 25 to 30 times resulting hundreds of millions of
copies amplified (Brown, 2002)
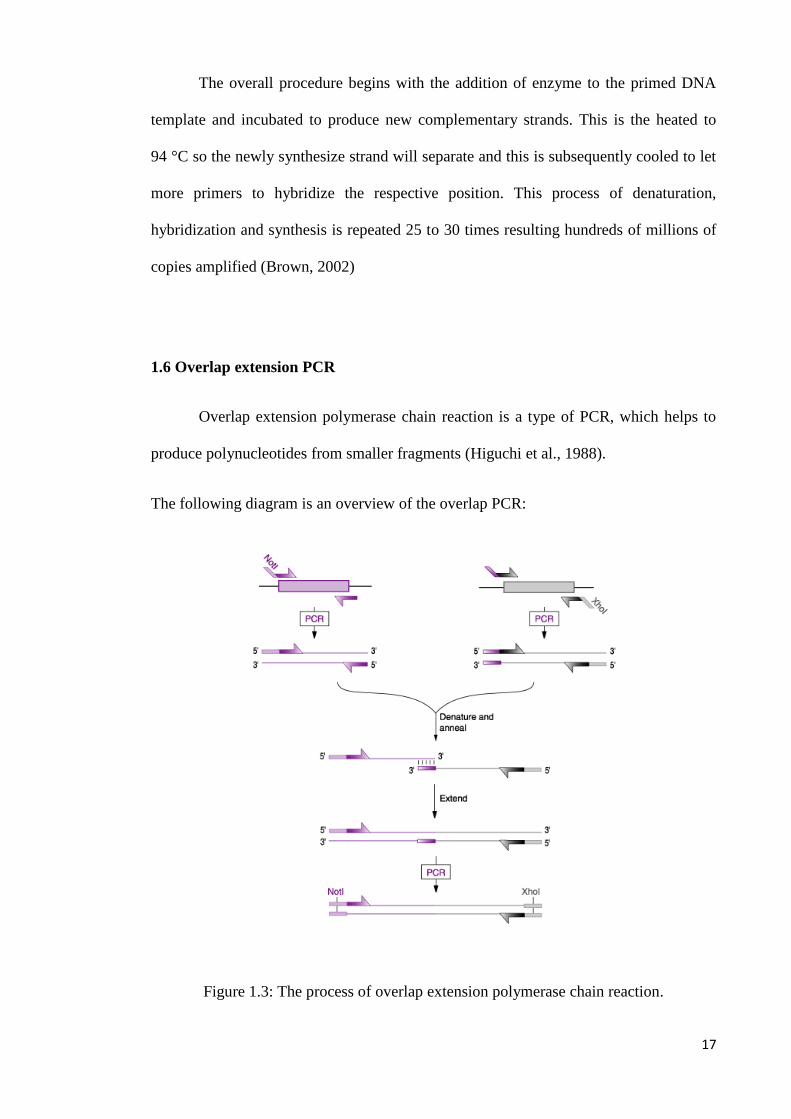
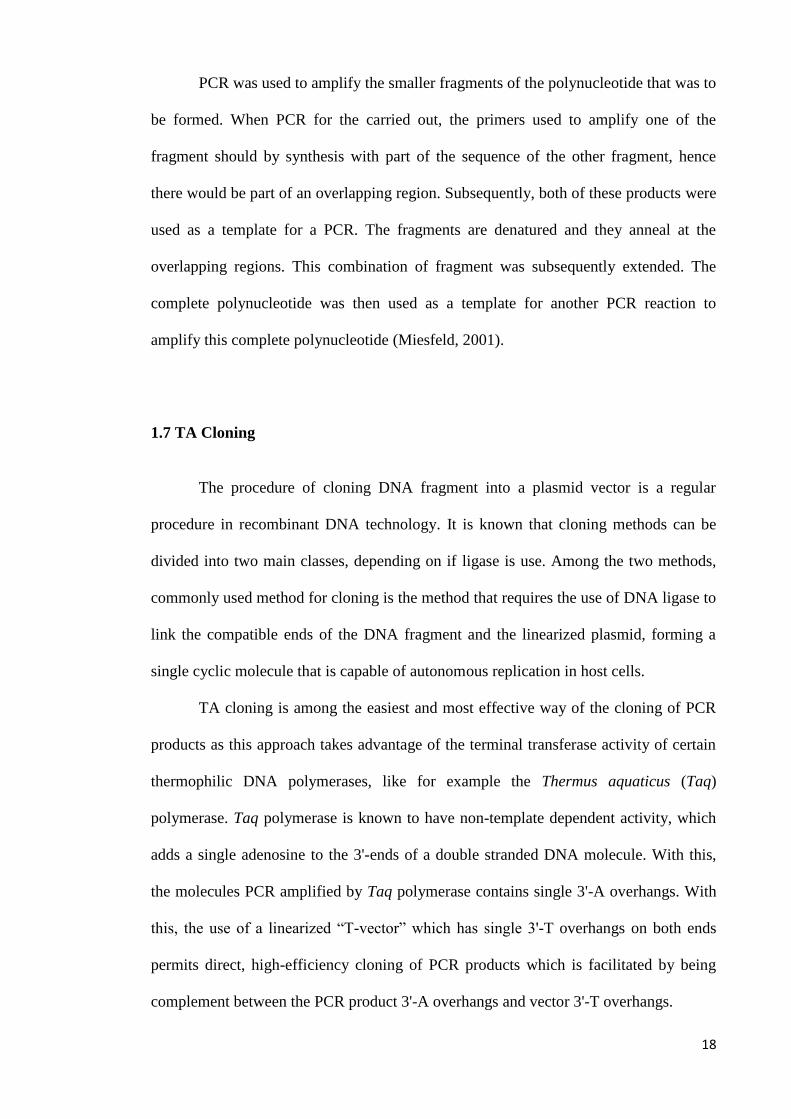
1.6 Overlap extension PCR
Overlap extension polymerase chain reaction is a type of PCR, which helps to
produce polynucleotides from smaller fragments (Higuchi et al., 1988).
The following diagram is an overview of the overlap PCR:
Figure 1.3: The process of overlap extension polymerase chain reaction.
18
PCR was used to amplify the smaller fragments of the polynucleotide that was to
be formed. When PCR for the carried out, the primers used to amplify one of the
fragment should by synthesis with part of the sequence of the other fragment, hence
there would be part of an overlapping region. Subsequently, both of these products were
used as a template for a PCR. The fragments are denatured and they anneal at the
overlapping regions. This combination of fragment was subsequently extended. The
complete polynucleotide was then used as a template for another PCR reaction to
amplify this complete polynucleotide (Miesfeld, 2001).
1.7 TA Cloning
The procedure of cloning DNA fragment into a plasmid vector is a regular
procedure in recombinant DNA technology. It is known that cloning methods can be
divided into two main classes, depending on if ligase is use. Among the two methods,
commonly used method for cloning is the method that requires the use of DNA ligase to
link the compatible ends of the DNA fragment and the linearized plasmid, forming a
single cyclic molecule that is capable of autonomous replication in host cells.
TA cloning is among the easiest and most effective way of the cloning of PCR
products as this approach takes advantage of the terminal transferase activity of certain
thermophilic DNA polymerases, like for example the Thermus aquaticus (Taq)
polymerase. Taq polymerase is known to have non-template dependent activity, which
adds a single adenosine to the 3'-ends of a double stranded DNA molecule. With this,
the molecules PCR amplified by Taq polymerase contains single 3'-A overhangs. With
this, the use of a linearized “T-vector” which has single 3'-T overhangs on both ends
permits direct, high-efficiency cloning of PCR products which is facilitated by being
complement between the PCR product 3'-A overhangs and vector 3'-T overhangs.

19
This strategy is commonly referred to as “TA cloning.” This strategy is rather
simple and much efficient than blunt-ended ligation for the cloning of PCR products
(Zhou and Sanchez, 2000).
1.8 Expression system
The need to have functional studies like protein-protein interaction experiments,
enzyme kinetics studies, functional studies of the protein, structural studies like protein
crystallization and protein structure study and as well as production of antibodies for
further experiments has lead to the expression recombinant protein. There are two main
systems for the expression of recombinant protein. The two systems are the prokaryotic
(bacterial) or eukaryotic (usually yeast or mammalian cell) system.
1.8.1. Bacterial expression system
The bacterial expression system is the use of prokaryotic cells as an expression
system. Escherichia coli, a prokaryotic cell is among the most popular hosts in the
production of recombinant proteins. The E. coli is in favour because of its simplicity,
safety, and known genetic properties, which is a major asset. The capability of
transformation of E. coli with foreign DNA is an easy with well-established genetic
manipulation method. With the advantage of fast propagation, generations of stable cell
lines are a quick process. The most important advantage of E. coli, however, is its
capability to produce proteins in large amount and to grow very quickly in comparison
to other cell lines like mammalian cells.
20
However, the application of E. coli for production of complex molecules like
heterodimers, molecules containing complex disulfide bonds, or glycosylated proteins is
still a problem. Besides that, over expression of recombinant genes often results in
formation of inactive protein aggregates (inclusion bodies) from which biologically
active proteins can only be obtained through complicated and costly denaturation–
refolding processes. The other major setback of the usage of E. coli as an expression
system is difficulty in recovering substantial yields of correctly folded proteins
(Leonhartsberger, 2006).
1. 8.2 Pichia Pastoris expression system
The expression systems foreign gene by yeasts is known to be efficient and
economical and becomes a source of a different of higher eukaryotic proteins which are
important academically and commercially. Yeasts has both the microbial growth and
genetic manipulation advantages of E. coli and an eukaryotic environment which allows
many eukaryote-specific posttranslational protein modifications such as proteolytic
processing, folding, disulfide bridge formation, and glycosylation. E. coli has the ability
to produce eukaryotic foreign proteins at high levels; however with the absence of these
eukaryotic post transcriptional modifications, this causes the proteins to be insoluble
and inactive. This is why, for eukaryotic proteins that are needed in a biologically active
and/or native form, in vitro refolding procedures have proven to be inefficient, hence a
eukaryotic expression system is much desirable.
The Pichia pastoris which is methylotrophic yeast has two key advantages as a
host for the production of foreign proteins. The first is the promoter used to transcribe
foreign genes that is derived from the methanol-regulated P. pastoris alcohol oxidase I
gene (AOX 1). This is where cells that are exposed to methanol as the sole carbon

21
source, transcription initiation at the AOX 1 promoter (AOX l p) is highly efficient and
comparable to that of promoters derived from highly expressed glycolytic pathway
genes. The second key advantage of P. pastoris is that it is not a strong fermenter,
which is beneficial as yeast fermentation, generates ethanol, where in high-density
cultures; it can rapidly build to toxic levels. Besides that, in the case of secreted
proteins, the concentration of a foreign protein in the medium is roughly proportional to
the concentration of cells, hence a high-cell density fermenter culture is need and
P. pastoris expression strains are relatively easy to culture at cell densities of -100
g/liter, dry cell weight, or more. (Cregg, 1999).

22
1.9 Objectives
This project is a continuation as a part of research project started by previous
student. Due to the large size of this particular PSMA gene, it was divided into three
fragments namely G1, G2 and G3. In the previous work, G2 and G3 have been
constructed. The G1 fragment of PSMA gene failed to be joined, hence six sub-
fragments namely fragment a, b, c, d, e, and f need to be overlapped in order to obtain
G1 fragment. So in order to obtain the full length of this gene, these fragments need to
be overlapped.
The project primarily aims would be:
1. Construction of the G1 fragment of the PSMA gene.
2. Amplification and overlapping of G1, G2 and G3 fragments of PSMA gene.
3. Construction the full length of PSMA gene and amplification.
4. Cloning of the PSMA gene in the E. coli.
5. Expression of PSMA gene in the Pichia Pastoris recombinant expression
system.

23
2. Materials & Methods:
2.1 Overlapping PCR
For overlapping PCR, a master mix containing its reagent was carried out in a
1.5 ml microcentrifuge. Overlapping PCR was carried out in a 25 μl reaction containing
1× MgSO4 free Pfu buffer (Fermentas, Canada), 1.5 mM MgSO4, 200 μM per each
dNTP (Fermentas, Lithuaya) (dATP, dTTP, dCTP, and dGTP), 1.0 to1.5 unit of Pfu
polymerase (Fermentas, Canada), autoclaved distilled water, and ~100 ng of template
DNA.
2.1.1 Optimization of overlapping PCR
The quantity of the Pfu polymerase enzyme used ranged from 1 unit to 1.5 units
for one reaction. There were two PCR programs used in this project, each program was
used based on the fragment size.
2.1.1.1 Fragment less than 1500bp
Fragment under the size of 1500bp was overlapped under the following
conditions using the PCR machine (Peltier Thermal Cycler MJ Research): samples were
subjected to 16 cycles of denaturation at 95ºC for 3 min, annealing at 60ºC for 1 minute,
extension at 72ºC for 1 minute, and a final cycle of elongation for 5 minute at 72ºC.
24
2.1.1.2 Fragment more than 1500bp
Fragment over the size of 1500bp was overlapped under the following
conditions using the PCR machine (Peltier Thermal Cycler MJ Research and PCR
system 2400): samples were subjected to 16 cycles of denaturation at 95ºC for 3 minute,
annealing at 60ºC for 1 minute, extension at 72ºC for 10 minute, and a final cycle of
elongation for 10 minute at 72 ºC.
2.1.2 PCR amplification
For PCR amplification, a master mix containing its reagent was carried out in a
1.5 ml microcentrifuge. PCR amplification was carried out in a 25 μl reaction
containing 1× MgCl free Taq buffer (EURx , Poland), 1.5 mM MgCl2, 200 μM per each
dNTP (Fermentas, Lithuaya) (dATP, dTTP, dCTP, and dGTP), 0.4 μM for each primer,
1-2 unit of Taq polymerase (EURx , Poland), autoclaved distilled water, and 2 μl of
overlapping PCR product.

25
2.1.2.1 Optimization of PCR
The quantity of the Taq polymerase enzyme used ranged from 1 unit to 2 units
for one reaction. The following are the primers combination and the fragments
amplified.
Fragment Primers Primers Sequence
G1 SfiPSMA-F
PSMA-961R
5'-cttcgggcccagccggccgatgtgcaatctccttcacgaaac-3'
5'-gaagattccaaccatctggataggacttcac-3'
G2 PSMA-961F
PSMA-1741R
5'-tccagatggttggaatcttcctggaggtggt-3'
5'-gccactgaactctggggaaggacttttttta-3'
G3 PSMA-800F
PSMAfacXa-
Not1R
5'-cttccccagagttcagtggcatgcccaggat-3'
5'-agctggcggccgcgcggccttcaatggctacttcactcaaa-3'
G1-G2 SfiPSMA-F
PSMA-1741R
5'-cttcgggcccagccggccgatgtgcaatctccttcacgaaac-3'
5'-gccactgaactctggggaaggacttttttta-3'
G2-G3 PSMA-961F
PSMAfacXa-
Not1R
5'-tccagatggttggaatcttcctggaggtggt-3'
5'-agctggcggccgcgcggccttcaatggctacttcactcaaa-3'
G1-G2-
G3
SfiPSMA-F
PSMAfacXa-
Not1R
5'-cttcgggcccagccggccgatgtgcaatctccttcacgaaac-3'
5'-agctggcggccgcgcggccttcaatggctacttcactcaaa-3'
Table 2.1: Primer combination and the amplified products
There were two PCR programs used in this project, each program was used was based
on the fragment size.

26
2.1.2.1.1 Fragments more than 1500bp
Fragments more than 1500bp was amplified using the following conditions in
the PCR machine (PCR system 2400): the samples were subjected to 35 cycles of
denaturation at 95 ºC for 3 minutes, annealing at 50 ºC for 1 minutes, extension at
72 ºC for 2 minutes 30 seconds, and a final cycle of elongation for 5 minutes at 72 ºC.
Or amplification was performed under the following conditions in the PCR
machine (PCR system 2400): the samples were subjected to 35 cycles of denaturation at
95 ºC for 3 minutes, annealing at 55 ºC for 1 minutes, extension at 72 ºC for 2 minutes
30seconds , and a final cycle of elongation for 5 minutes at 72 ºC.
2.1.2.1.2 Fragment less than 1500bp
Fragments less than 1500bp was amplified using the following conditions in the
PCR machine (Peltier Thermal Cycler MJ Research): the samples were subjected to 32
cycles of denaturation at 95 ºC for 3 minutes, annealing at 55 ºC for 45 seconds,
extension at 72 ºC for 1 minutes, and a final cycle of elongation for 5 minutes at 72 ºC.
Or amplification was performed under the following conditions in the PCR
machine (Peltier Thermal Cycler MJ Research): the samples were subjected to 35 cycles
of denaturation at 95 ºC for 3 minutes, annealing at 60 ºC for 45 seconds, extension at
72 ºC for 1 minutes and 30 seconds, and a final cycle of elongation for 5 minutes at 72
ºC.
27
2.2 Gel electrophoresis
A 1% agarose gel was prepared mixing agarose powder (Vivantis, USA) and
TBE Buffer (89 mM tris base, 89 mM boric acid, 2 mM EDTA) and was subsequently
boiled using the microwave until all agarose powder was fully dissolved. The molten
agarose was cooled down until it is only warm to touch and then Ethidium bromide was
added in and mixed with the solution. The molten agarose was then poured into the
mould and caster to be further cooled down and to let it solidify. Once solidify, the gel
was immersed in TBE buffer in the gel electrophoresis tank. PCR sample was then
mixed with 6× loading dye at the ratio of 5 units of samples to 1 unit of dye. Each
sample was loaded in the wells separately. A DNA marker 100bp (seegene, Korea), 1kb
(Promega, USA), was also loaded in the well. The gel was then electrophoresis at 120
volts for 20 minutes. The gel was then removed and visualised under ultraviolet light.
2.3 Gel Extraction
Gel extraction was carried out in this research to excise expected band of the
PCR samples. All gel extractions that were carried out in this research were done using
QIAquick Gel Extraction Kit from USA according to manufacturer's protocol.
2.4 Cloning
2.4.1 Competent Cell Preparation
2 μl of JM109 High Efficiency Competent Cells was added to 10 ml of sterile
LB broth (Pronadisa, Spain) in a universal bottle under sterile condition using aseptic
28
techniques. The universal bottle was then capped loosely and was secured onto a 37 °C
shaking bath at 220 rpm to be incubated overnight (16 hours). Then 1 ml of the
overnight culture was added to 10 ml of sterile autoclaved LB in a universal bottle.
The universal bottle was then capped loosely and was secured onto a 37 °C
shaking bath at 220 rpm to incubate. The density of the competent cells was monitored.
This was done by randomly taking out 3 cultures and the cultures were diluted 100× by
adding 495 μl of LB broth and 5 μl of culture and mixing them by pipetting in a
disposable cuvette.
The culture was returned immediately to continue incubating. The
spectrophotometer was set at a wavelength of 600 nm in ultraviolet spectrum. Before
the sample was loaded, the spectrophotometer was “blanked” by dispensing clean and
uncultured LB broth into the disposable cuvette. The cell density was determined by
measuring the OD600. This step was repeated at a 15 minute interval and more
frequently (5 minutes) as the OD600 reading approaches close to 0.5. The incubation was
stopped when the OD600 measures as 0.5. This was because, the cell culture at this stage
was in the log phase and the cell at this phase was most optimal for competent cell
preparation. The competent cell culture was then transferred into sterile 15 ml falcon
tubes using aseptic technique. The tubes containing the cells were then left on ice for 15
to 30 minutes. The tubes of cells were then centrifuge at 3000 rpm at 4 °C for
5 minutes. The supernatant was discarded and 5000 μl of RF1 (every 100 ml contains
1.20 g RbCl2, 0.99 g MnCl2.4H2O, 0.30 g KoAC, 0.15 g CaCl2.4H2O, 15 ml glycerol
(AnalaR, England), sterile distilled water added and had the pH adjusted to 5.8, and the
solution was filter sterilised) was added to the pellet and was resuspended (on ice).
The tubes were then left on ice for 20 minutes. The tubes were once again
centrifuged at 3000 rpm at 4 °C for 15 minutes. The supernatant was discarded and was
resuspended in RF2 (every 100 ml contains 0.21 g MOPS, 0.12 g RbCl2, 1.10 g

29
CaCl2.4H2O, 15.0 ml glycerol and sterile distilled water and had the pH adjusted to 6.8,
and the solution filter sterilised). The amount of RF2 added varies from 100 μl to 400 μl
depending on the pellet size. The prepared competent cell was then aliquot into sterile
1.5 ml microcentrifuge. The microcentrifuge was then dipped into liquid nitrogen and
then stored at -80°C.
2.4.2 LB plates with ampicillin / IPTG / X-Gal
LB agar (Pronadisa , Madrid-Spain ) plates with (100 μg/ml) ampicillin (Sigma,
USA), 0.5 mM IPTG, and 80 μg/ml X- gal were prepared prior to the transformation
day as it requires time for autoclaving and for the agar to set. Prior to transformation
conducted the LB plates were dried in 37ºC incubator. This was to ease the plating of
the transformed cells and to avoid contamination.
2.4.3 LB Broth Preparation (Pronadisa, Madrid-Spain)
20 g of the dehydrated medium was dissolved in 900 ml of distilled water and
then it was dissolved with frequent agitation until completely dissolved. Final volume
was adjusted to 1000 ml. It was then sterilized at 121°C for 15 minutes.
2.4.4 Ligation reaction with pGEM®-T vectors
a pGEM ®-T vector (Promega, USA) was used in cloning. The pGEM ®-T
vector DNA tube was briefly centrifuged to collect the contents in the bottom of the
tube. The ligation reaction was set up in 0.5 ml microcentrifuge tubes as it is known to
have low DNA binding capacity. The 2× rapid ligation buffer was thawed on ice and
vortexed prior to each use. The 10 μl ligation reaction was set up containing 5.0 µl 2×
Rapid ligation Buffer, 1.0 µl pGEM®-T vectors (50 ng), 3 µl purified PCR product and

30
1.0 µl T4 DNA Ligase (3 Weiss unit/ µl). The reactions were mixed by pipetting and
incubated at 4ºC overnight for the maximum number of transformants.
2.4.5 Transformation into JM109 competent cells
The tubes containing ligation product were centrifuged to collect the content at
the bottom of the tube. 2 µl of each ligation reaction was added to a sterile 1.5 ml
microcentrifuge on ice. Tubes of frozen JM109 competent cells were removed from -
80ºC storage and were placed on an ice bath until just thawed. The cells were mixed by
flicking the tube gently. A 100 µl of cells were carefully transferred into each of the
1.5 ml microcentrifuge tubes containing the ligation product. The tubes were flicked
gently to mix the cells and the ligation product.
The tubes were then place on an ice bath for 20 minutes. The cells were then
heat-shocked for 45 seconds in a water bath at exactly 42ºC without shaking. The tubes
were immediately returned to ice for 2 minutes. 900 µl room temperature LB broth was
added to the tubes containing cells transformed with ligation reaction. It was then
incubated for one and a half hour at 37ºC in rotating hybridization oven. The tubes were
then centrifuged at 1000 × g for 10 minutes to pellet the cells. 800 µl of the supernatant
was discarded and the pellet was resuspended with the remaining supernatant. A 100 µl
of the transformed cells were plated on the LB agar plates using a spreader. The plates
were then incubated overnight (16 hours) at 37 ºC incubator.
31
2.4.6 Recombinant Colonies Screening
When the desired PSMA fragments was inserted into the LacZ’ gene of M13
cloning vector, it inactivates the β-galactosidase synthesis causing the formation of
white colonies on the LB/ Ampicillin/ IPTG/ X-gal plates after overnight incubation.
Blue colonies were formed when there is no inserts in this gene.
Under a sterile condition using aseptic technique, white colonies which are
represented by one cell each was picked to build library on a new LB/ Ampicillin/
IPTG/ X- gal plates. The library later was incubated at 37°C overnight (16 hours).
While constructing the library, the loop that is used to pick up the colony is immersed in
50 μl of autoclaved distilled water in a 0.5 ml microcentrifuge tube before being flame
sterilised. Tubes containing the transformed colonies were boiled at 99°C for
10 minutes to lyse the cells. This was then proceeded by colony PCR using M13
forward and reverse primers. The PCR product was then analysed by mixing 1 volume
of 6× loading dye and 5 volumes of purified DNA and electrophoresis in a 1% stained
agarose gel.
2.5 Isolation of Plasmids
A positive screened colony (with correct insert) was selected from the library
plate and cultured in 10 ml sterile LB broth containing 50 μg/ml ampicillin (Sigma,
USA) in a universal bottle. The universal bottle was capped loosely and was left
incubating in a shaking (220 rpm) waterbath at 37 °C overnight (16 hours) to increase
the transformed cells quantity for plasmid extraction. The following steps were carried
out in sterile condition with aseptic techniques. 150 µl of 100% glycerol (AnalaR,
England), was pipetted into each 1.5 ml microcentrifuge tube. Then, 850 μl of overnight

32
culture was added into the microcentrifuge tubes contain the culture and glycerol
(AnalaR, England) were then mixed before being kept at -80 °C for future usage.
The remaining overnight culture was poured into 15 ml falcon tubes and was
centrifuged at 6000 rpm for 15 minutes at room temperature. Then, the supernatant was
discarded and the bacterial pellet was resuspended using 200 μl ice cold Solution I
(50 mM glucose, 10 mM EDTA, 25 mM Tris Cl) by pulse vortexing. The suspended
pellet was then transferred into a new 1.5 ml microcentrifuge tube and 200 μl of freshly
prepared Solution II (0.2 N NaCl, 1% SDS) was added. The sample was then mixed by
gently inverting and was left to stand in room temperature for 4 minutes. 200 µl of ice
cold Solution III (3 M KoAc, 11.5% glacial acetic acid) was added. The sample was
mixed by gentle inversion and was incubated on ice for 15 minutes. The sample was
then centrifuged at 13000 rpm for 10 minutes. The supernatant was then transferred into
sterile 1.5 ml microcentrifuge tubes, and 3 μl of RNase (50mg/ml) (Sigma-Aldrich,
USA) was then added. This was subsequently incubated in a water bath for an hour at
37 °C.
After incubating, 600 μl of ice cold phenol (Pierce, USA) was added. It was then
vortexed followed by centrifuging at 13000 rpm for 5 minutes. The upper layer of
supernatant was transferred to a new 1.5 ml microcentrifuge tube. The supernatant was
then added with 600 μl of chloroform (Merk, Germany). It was then vortexed and
centrifuged at 13000 rpm for 5 minutes.
The upper layer of supernatant was transferred to a new 1.5 ml microcentrifuge
tube. Then 0.1 volume of 5 M sodium chloride was then added followed by 2.5 volume
of ice cold isopropanol (Merck, Germany). It was then left to incubate on ice for
20 minutes to collect precipitate. The sample was then centrifuged at 13000 rpm for
15 minutes and the supernatant was discarded.
33
1 ml of ice cold 70% ethanol was added. It was then centrifuged at 13000 rpm
for 5 minutes. The supernatant was then discarded. The pellet formed was pure DNA
and was dried in speed vacuum for 5 minutes. Lastly, 50 μl of autoclaved distilled water
was added and the pellet was left in 4°C overnight for the pellet to dissolve. The
dissolved pellet was subsequently quantified through spectrophotometric method to
identify the purity and the quantity of the isolated plasmid.
2.5.1 Plasmid digestion with Sfi1 and Not1
To carry out the cloning of the desired PSMA fragments into plasmid vectors,
both of them need to be modified to make integration possible. The plasmid and the
PSAM fragments were subjected to RE digestion to generate identical cohesive or
sticky ends. In this case, the inserted DNA and plasmids were cleaved with Sfi1 and
Not1 restriction enzymes at the Sfi1 /Not1 cleave sites.
Firstly, concentrations of DNA samples were determined using spectrophotometer
(Eppendorf, USA). Later, based on OD reading a master mix was prepared. 1X Tango
buffer (Fermentas, Canada), 1 U of Sfi1 restriction endonuclease (Promega, USA), 1 U
of Not1 restriction endonuclease (Fermentas, Canada), 100 ng DNA samples, and
adequate sterile distilled water, were mixed together and placed in 0.5 ml tubes and left
in 37°C waterbath for 3 hours. Heat inactivated used for 10 minutes at 99°C. Small
aliquot of digested plasmid was checked by agarose gel electrophoresis to check
complete digestion. The digested plasmid Stored at -20°C.
34
2.5.2 Plasmid purification
After vector was completely digested, phenol/chloroform washing step was
used, the solution was centrifuged to pellet DNA. 5M NaCl/ice cold isopropanol were
added, and the pellet washed with 70% ethanol, air-dried and resuspended in 30 μl
sterile distilled water. Incubated overnight at 4°C then stored at -20°C. Plasmids were
checked by restriction and electrophoretic analysis, and then purified plasmids were sent
for sequence analysis (Applied Biosystems, Japan).
2.6 Cloning with pPICZαA vector
2.6.1 Ligation reaction with pPICZαA vector
Ligation reaction involved a combination of 2X ligation buffer, DNA inserts and
plasmid vectors, T4 DNA ligase enzyme (Promega, USA) and adequate volume of
sterile distilled water. The mixture was prepared with consideration of the insert-vector
ratio (3:1). The components were aliquoted in 0.5 ml tubes, then mixed by pipetting and
incubated at 4°C overnight. After ligation, the vectors have to be transformed into host
cells.
2.6.2 Preparation of low salt Luria Bertani (LSLB) medium
The LSLB mediums were prepared in two forms, agar plates and broth. For
LSLB agar plate preparation, 2% of peptone (Pronadisa, Canada), 3% of agar
(Amresco, Canada), 1% of NaCl (Promega, USA) and 1% of yeast extract (Pronadisa,
Canada), were added before stirred with 190 ml of sterile distilled water using a stirrer
(LMS, Japan).
35
The pH of the solution was adjusted to 7.5 using a pH meter (Sartorius, China)
and the volume was brought up to 200 ml, the solution was then autocalved for 15
minutes at 121ºC. The autoclaved broth was cooled down with running tap water until
temperature was around 55ºC. Next, 25 μg/ml of zeocin (Invitrogen, USA) was added to
the broth before being poured into labeled clean petri-dishes. The plates were left at
room temperature to solidify, and kept in 4ºC for maximum three months.
For LSLB broth preparation, 1% of peptone was mixed with 0.5% of yeast
extract and NaCl in 90 ml of sterile distilled water. PH was adjusted to 7.5 and total
volume was topped up to 100 ml. Broth were then aliquoted, 10 ml into each universal
bottle and autocalved.
2.6.3 Transformations into Top10 cells
Prior to transformation, the host cells have to be prepared with the same
procedure, which mentioned in (section 2.4.1). 100 μl of the frozen stocks of E. coli
Top10 cells in each tube were thawed on ice for 5 minutes. Then, 5 μl of ligation
reaction was transferred into each tube (s) containing competent cells, mixed gently by
flicking and incubated on ice for 30 minutes. After that, the mixtures were heat shocked
at 42°C for 90 seconds and immediately chilled on ice for 5 minutes. 900 μl room
temperature LSLB broth (Appendix A) was added to the mixture and incubated for
1.5 hours at 37°C with shaking (~250 rpm). After transformation, 100 μl of each
transformation mix were spread on the LSLB medium containing zeocin and incubated
overnight (16-24 hours) at 37°C. Plates were placed at 4°C for short term storage.

36
2.6.4 Recombinant colonies screening
Cells that were successfully transformed will be conferred resistance to zeocin
antibiotic present in the medium. Using sterilized looped wire, the colonies were picked
randomly since all colonies were white. Tip touched onto library plate drawn with 6×6
grids while the rest were mixed in 30-50 μl of sterile distilled water. The tubes
containing the transformed colonies were heated at 99°C for 10 minutes to lyse the cells
before proceeding to colony PCR. Meanwhile, the library plates were incubated at 37°C
overnight.
2.6.5 Colony PCR
This PCR method was employed for selection of colonies that were successfully
transformed with vectors containing inserted DNA. Inserted sequences were amplified
with a thermocycler (as previously mentioned). Clones providing an amplicon of correct
size were identified by agarose gel electrophoresis. Right clones were picked up, and
grown in 10 ml LSLB broth containing 2.5 μl zeocin, and then incubated overnight at
37°C. Cells were grown and recombinant product was isolated by using convential
procedure (section 2.4.7) and linearized by restriction endonuclease Sac1 (Fermentas,
Canada).
2.7 Transformation into Pichia pastoris
Recombinant plasmid DNA was first linearized by restriction endonuclease Sac1
(Fermentas, Canada) and then transformed into P. pastoris strain X33 (Prondisa,
Canada) by using EasyComp Transformation kit (Invitrogen, USA), following
manufacturer’s instructions.
37
3. Results
In order to obtain a full length sequence of the PSMA gene for cloning and
expression of the protein two approaches were used. One of the approaches is by
overlapping the three fragments from the PCR product. The other approach was by
cloning the gene fragments into a vector system (pGEM-T vector) and then overlapped
them from the isolated plasmids.
3.1 Construction of PSMA gene from PCR product
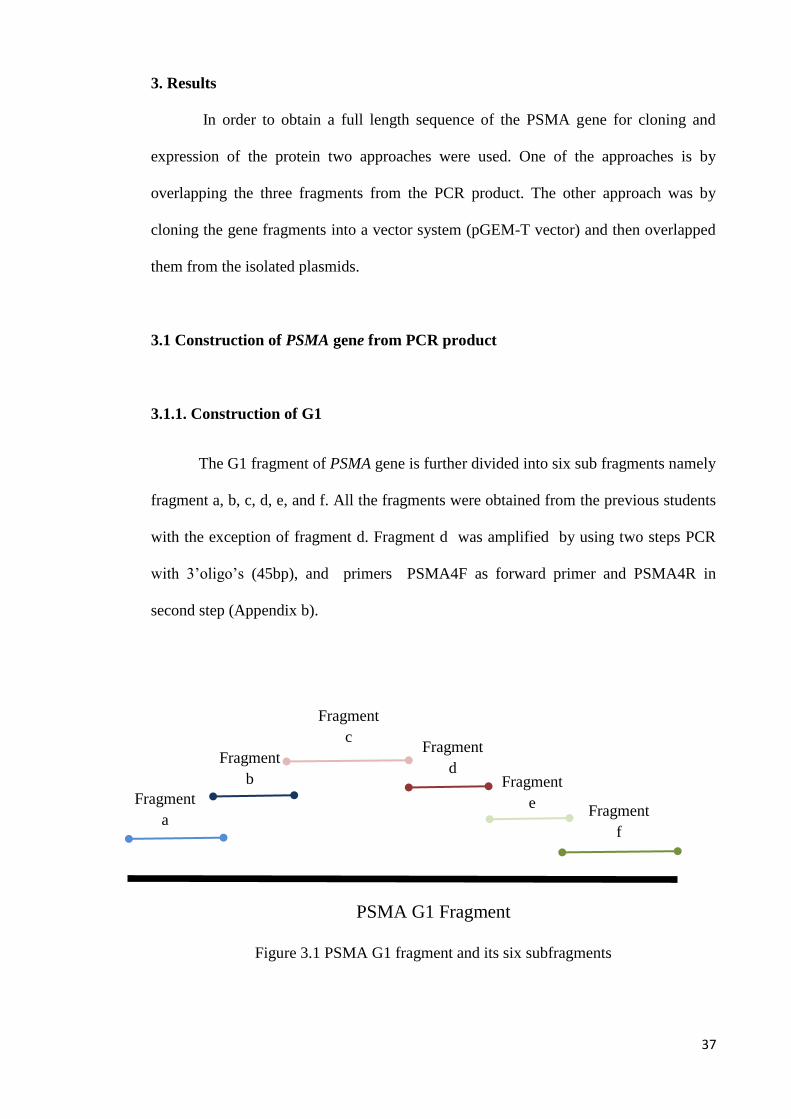
3.1.1. Construction of G1
The G1 fragment of PSMA gene is further divided into six sub fragments namely
fragment a, b, c, d, e, and f. All the fragments were obtained from the previous students
with the exception of fragment d. Fragment d was amplified by using two steps PCR
with 3’oligo’s (45bp), and primers PSMA4F as forward primer and PSMA4R in
second step (Appendix b).
PSMA G1 Fragment
Figure 3.1 PSMA G1 fragment and its six subfragments
Fragment
a
Fragment
b
Fragment
c Fragment
d Fragment
e Fragment
f

38
PCR amplification was carried out to amplify the desired fragments and sub
fragments which was subsequently needed for the construction of the PSMA gene. In
figure 3.1, the fragment G1-d was successfully amplified using two steps PCR and the
band produced was sufficiently bright at the desired size of 101bp.
Figure 3.1: Two steps PCR for G1-d fragment of the PSMA gene. Lane L is the 100bp
ladder (Seegene, Korea), lane N is the negative control, and lane 1, 2, and 3
is the amplification product of the two steps PCR for fragment G1-d of the
PSMA gene.
As the gel picture shows there are traces of unspecific bands in this PCR product
as well as primer dimers. In order to proceed with the construction of the PSMA gene
only the specific fragment is needed. Hence the product here in figure 3.1 was
subsequently purified using the gel extraction method to eliminate the unspecific band
which are present in the gel.
L N 1 2 3
~101 bp
1500bp
1000bp
500bp
100bp
39
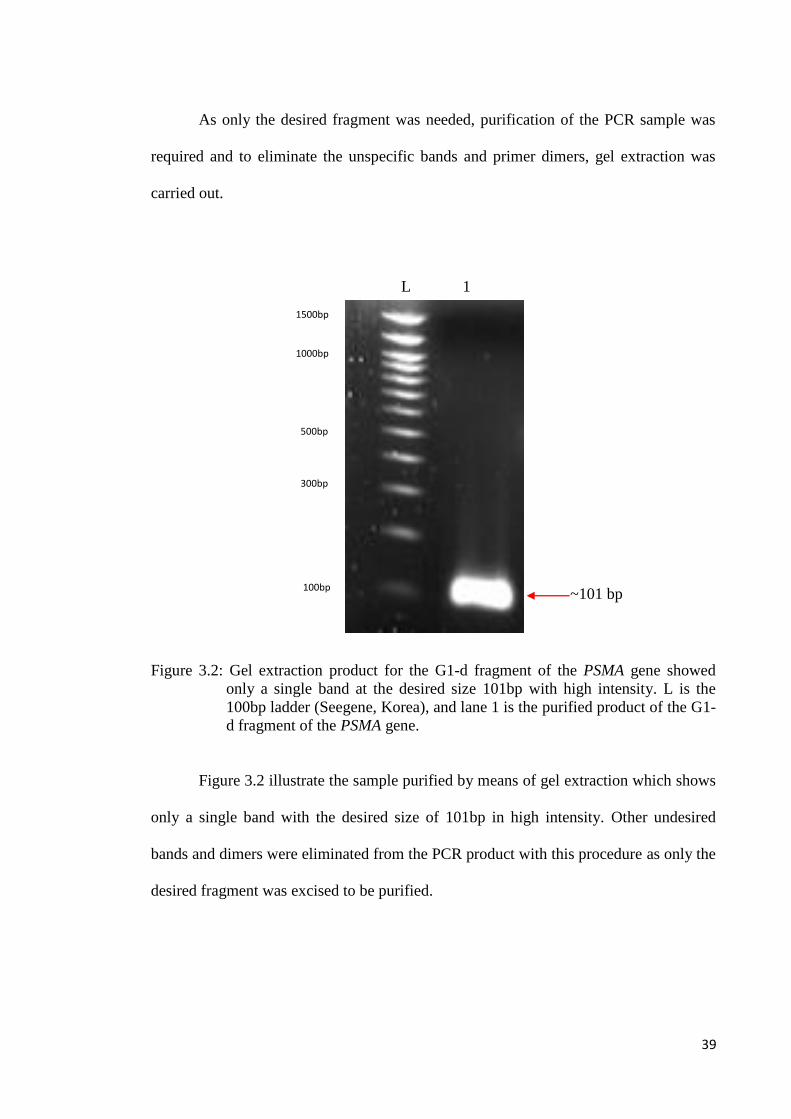
As only the desired fragment was needed, purification of the PCR sample was
required and to eliminate the unspecific bands and primer dimers, gel extraction was
carried out.
Figure 3.2: Gel extraction product for the G1-d fragment of the PSMA gene showed
only a single band at the desired size 101bp with high intensity. L is the
100bp ladder (Seegene, Korea), and lane 1 is the purified product of the G1-
d fragment of the PSMA gene.
Figure 3.2 illustrate the sample purified by means of gel extraction which shows
only a single band with the desired size of 101bp in high intensity. Other undesired
bands and dimers were eliminated from the PCR product with this procedure as only the
desired fragment was excised to be purified.
L 1
~101 bp
1500bp 1000bp 500bp 300bp 100bp
40
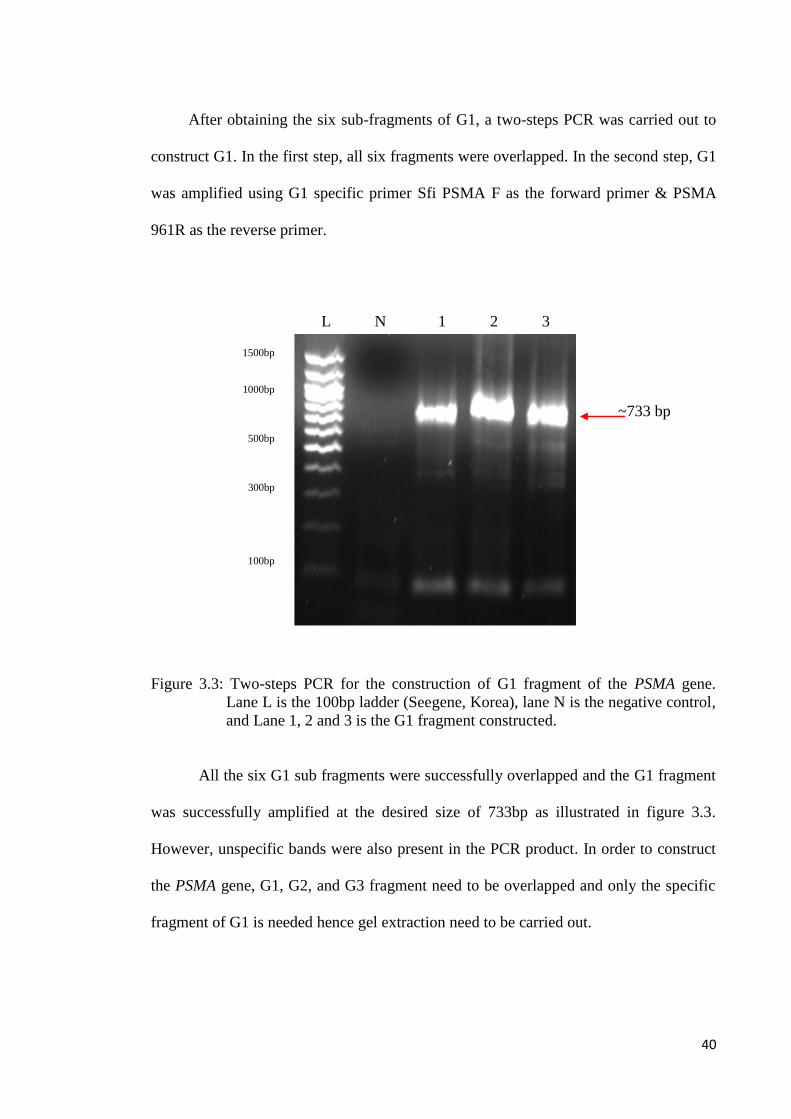
After obtaining the six sub-fragments of G1, a two-steps PCR was carried out to
construct G1. In the first step, all six fragments were overlapped. In the second step, G1
was amplified using G1 specific primer Sfi PSMA F as the forward primer & PSMA
961R as the reverse primer.
Figure 3.3: Two-steps PCR for the construction of G1 fragment of the PSMA gene.
Lane L is the 100bp ladder (Seegene, Korea), lane N is the negative control,
and Lane 1, 2 and 3 is the G1 fragment constructed.
All the six G1 sub fragments were successfully overlapped and the G1 fragment
was successfully amplified at the desired size of 733bp as illustrated in figure 3.3.
However, unspecific bands were also present in the PCR product. In order to construct
the PSMA gene, G1, G2, and G3 fragment need to be overlapped and only the specific
fragment of G1 is needed hence gel extraction need to be carried out.
L N 1 2 3
~733 bp
1500bp
1000bp
500bp
300bp
100bp

41
3.1.2 Amplification of PSMA G2
The results shown on figure 3.4 is a gel picture for the PCR amplification of the
G2 fragment of the PSMA gene using specific primers PSMA 961 F as forward primer
and PSMA 1741 R as reverse primer. The G2 fragment was successfully amplified and
this produces band with the expected size of 723 bp.
Figure 3.4: PCR amplification of the G2 fragment of the PSMA gene using Pfu
polymerase. Lane L is the 100bp ladder (Seegene, Korea), Lane 1, 2, 3, 4
and 5 is the G2 fragment amplified which were amplified at the expected
size, and lane N is the negative control.
Unspecific bands were also present in these PCR products and hence gel
extraction was needed to be carried out to obtain the pure G2 fragment for subsequent
procedure of overlapping the fragments PSMA gene.
L 1 2 3 4 5 N
~723 bp
1500bp
700bp
500bp
300bp
100bp

42
3.1.3 Amplification of PSMA G3
The results illustrated on figure 3.5 is a gel picture for the PCR amplification of
the G3 fragment of the PSMA gene using specific primers PSMA 800 F as forward
primer and PSMA facXa-Not1R as reverse primer with the expected size 790 bp. The
G3 fragment was successfully amplified and this produces band with the expected size
of 790 bp.
Figure 3.5: PCR amplification of the G3 fragment of the PSMA gene using Pfu
polymerase. Lane L is the 100bp ladder (Seegene, Korea), lane 1, 2, and 3 is
the G3 fragment amplified which were amplified at the expected size, and
lane N is the negative control.
Unspecific bands were also present in these PCR products and hence gel
extraction was needed to be carried out to obtain the pure G3 fragment for subsequent
procedure of overlapping the fragments PSMA gene.
L 1 2 3 N
~790 bp
1500bp 800bp 700bp 500bp 300bp 100bp
43
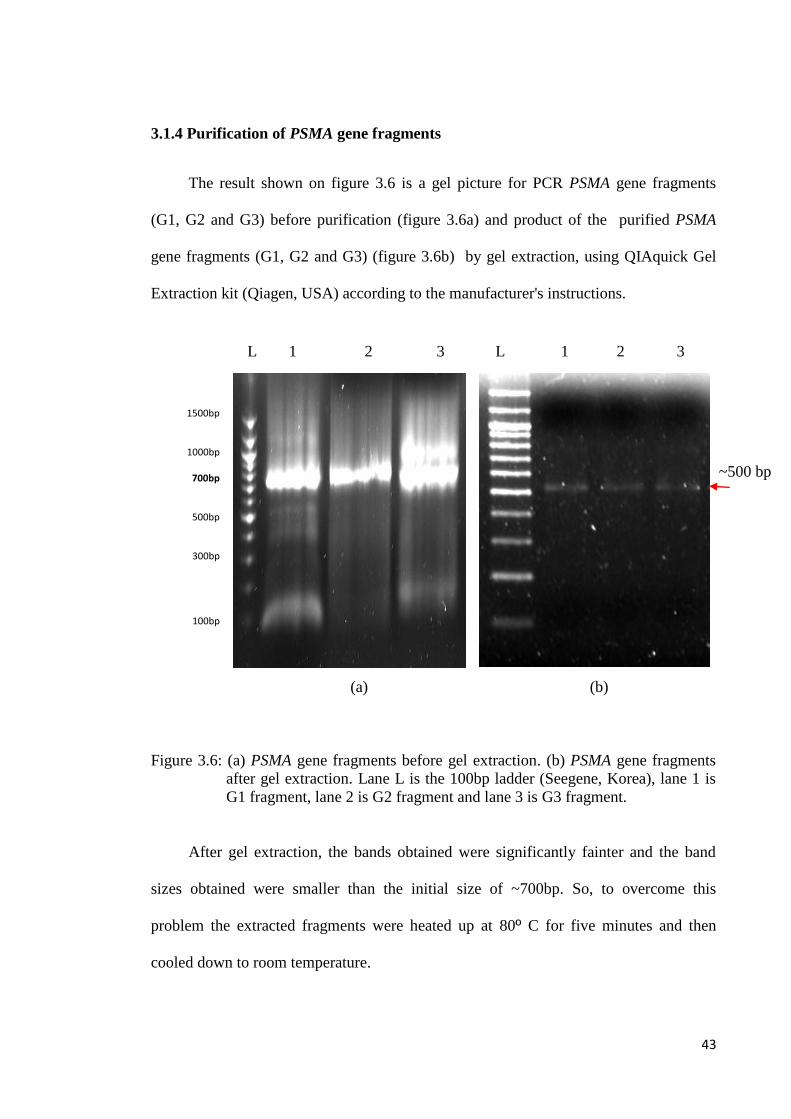
3.1.4 Purification of PSMA gene fragments
The result shown on figure 3.6 is a gel picture for PCR PSMA gene fragments
(G1, G2 and G3) before purification (figure 3.6a) and product of the purified PSMA
gene fragments (G1, G2 and G3) (figure 3.6b) by gel extraction, using QIAquick Gel
Extraction kit (Qiagen, USA) according to the manufacturer's instructions.
(a) (b)
Figure 3.6: (a) PSMA gene fragments before gel extraction. (b) PSMA gene fragments
after gel extraction. Lane L is the 100bp ladder (Seegene, Korea), lane 1 is
G1 fragment, lane 2 is G2 fragment and lane 3 is G3 fragment.
After gel extraction, the bands obtained were significantly fainter and the band
sizes obtained were smaller than the initial size of ~700bp. So, to overcome this
problem the extracted fragments were heated up at 80º C for five minutes and then
cooled down to room temperature.
L 1 2 3 L 1 2 3
~500 bp
1500bp
1000bp
700bp
500bp
300bp
100bp

44
3.1.5 Overlap extension from PCR product
The combination of the three fragments should be joined as following table:
Table 3.1: PSMA fragment combinations
Overlap extension PCR Fragment 1 Fragment 2 Expected size
1st PSMA G1 PSMA G2 1456 bp
2nd
PSMA G1-G2 PSMA G3 2246 bp
Figure 3.7 is the gel picture showing the overlapped extension from the
fragment G1 and G2. The overlapped fragment was amplified using the primers
Sfi PSMA –F as forward primer and Psma 1741 R as reverse primer with expected size
1456bp. The overlapped fragments shows smear after running in the gel and no clear
band obtained.
Figure 3.7: Overlap extension of G1 and G2 fragments. Lane L is the 100bp ladder
(Seegene, Korea). Lane 1 to 4 is the result of the overlapped extension of
G1-G2, and lane N is the negative control.
1456bp
L 1 2 3 4 N
1500bp
1000bp
700bp
500bp
300bp
100bp

45
3.1.6 PCR optimization to amplify G1-G2 after overlapping
With no clear band obtained, a temperature gradient PCR was carried out to
further optimize the amplification of G1-G2. Six different temperatures were chosen
and the temperature ranged from 45ºC to 65ºC.
The best temperature for the amplification is 50.5 ºC in lane 3 as shown in
figure 3.8; however, there is still no clear bands obtained at the expected size ~1456 bp.
Figure 3.8: A temperature gradient PCR for the amplification of overlapped G1-G2.
Lane L is the 100bp ladder (Seegene, Korea), Lane 1 is PCR at 45.0 ºC, lane
2 at 48.2 ºC, lane 3 at 50.5 ºC, lane 4 at 56.7ºC, lane 5 at 61.8 ºC and lane 6
at 65.0 ºC.
1456 bp
L 1 2 3 4 5 6
1500bp
1000bp
700bp
500bp
300bp
100bp
46
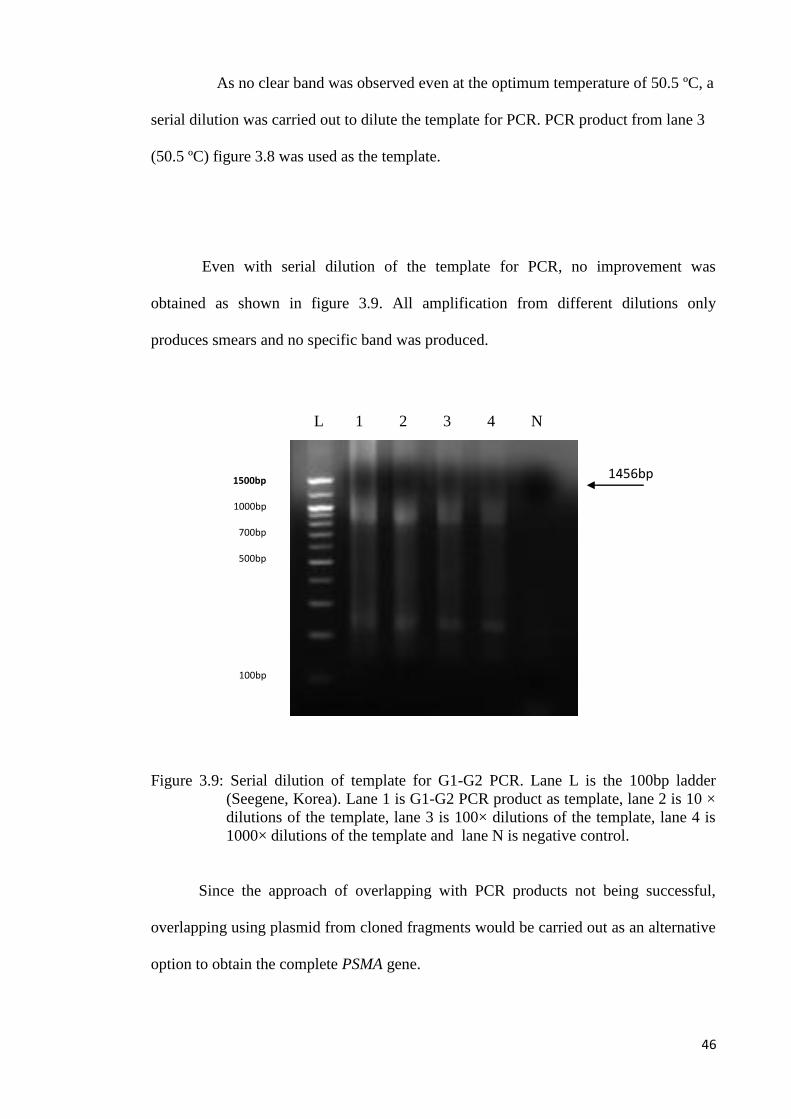
As no clear band was observed even at the optimum temperature of 50.5 ºC, a
serial dilution was carried out to dilute the template for PCR. PCR product from lane 3
(50.5 ºC) figure 3.8 was used as the template.
Even with serial dilution of the template for PCR, no improvement was
obtained as shown in figure 3.9. All amplification from different dilutions only
produces smears and no specific band was produced.
Figure 3.9: Serial dilution of template for G1-G2 PCR. Lane L is the 100bp ladder
(Seegene, Korea). Lane 1 is G1-G2 PCR product as template, lane 2 is 10 ×
dilutions of the template, lane 3 is 100× dilutions of the template, lane 4 is
1000× dilutions of the template and lane N is negative control.
Since the approach of overlapping with PCR products not being successful,
overlapping using plasmid from cloned fragments would be carried out as an alternative
option to obtain the complete PSMA gene.
1456bp
L 1 2 3 4 N
1500bp
1000bp
700bp
500bp
100bp

47
3.2. Cloning
3.2.1Cloning of PSMA G1, G2and G3
Cloning method was used for each PSMA fragments to get high quantity of the
fragments. Two approaches were applied in this project to clone the fragments with
pGEM-T vector and transformed into JM109 competent cells. First approach was
cloning of each fragment separately. Second approach was cloning of overlapped
fragments that are PSMA G1-G2, PSMA G2-G3 & PSMA G1-G2-G3. After that, all
these are to be used in construction PSMA gene.
G1, G2 and G3 fragments was amplified individually using Taq polymerase and
the PCR product was subsequently purified and used for cloning.
Figure 3.10: Gel extraction of amplified PCR product of G1, G2 and G3. Lane 1 is G1,
lane 2 is G2 and lane 3 is G3. Lane L1 is 100bp ladder (Seegene, Korea).
1000bp
700bp 500bp 200bp 100bp
1 2 3 L1
700bp
48
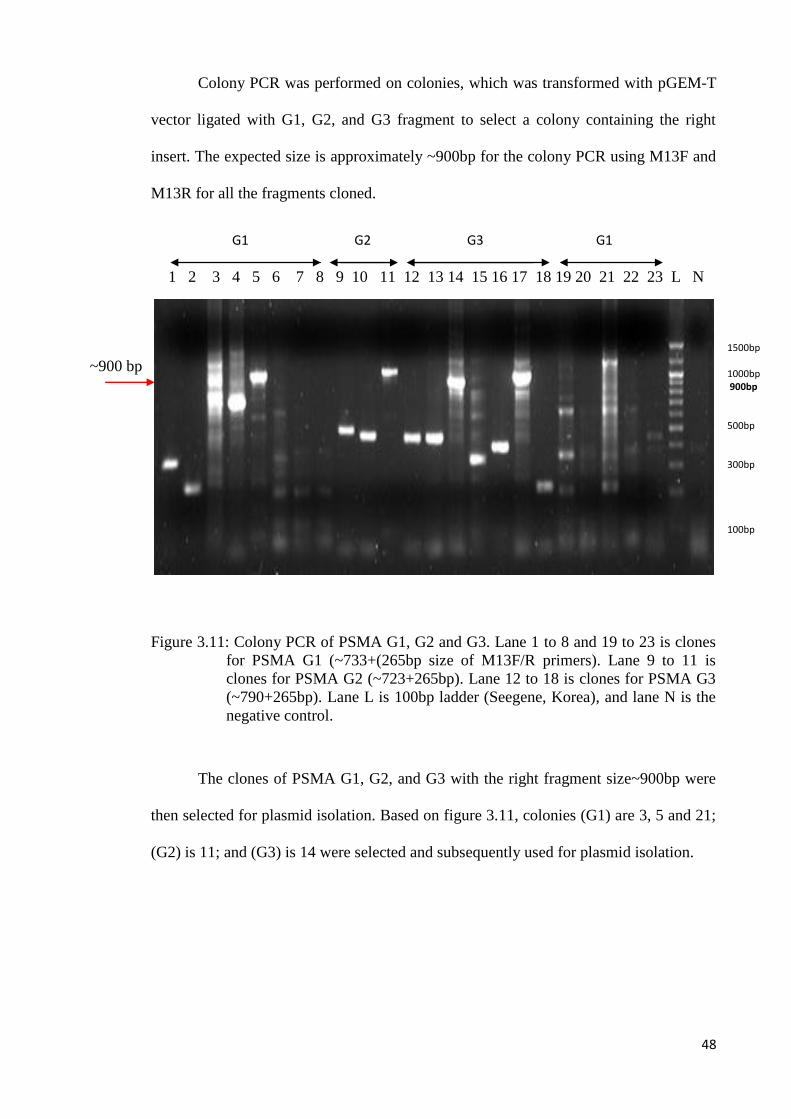
Colony PCR was performed on colonies, which was transformed with pGEM-T
vector ligated with G1, G2, and G3 fragment to select a colony containing the right
insert. The expected size is approximately ~900bp for the colony PCR using M13F and
M13R for all the fragments cloned.
Figure 3.11: Colony PCR of PSMA G1, G2 and G3. Lane 1 to 8 and 19 to 23 is clones
for PSMA G1 (~733+(265bp size of M13F/R primers). Lane 9 to 11 is
clones for PSMA G2 (~723+265bp). Lane 12 to 18 is clones for PSMA G3
(~790+265bp). Lane L is 100bp ladder (Seegene, Korea), and lane N is the
negative control.
The clones of PSMA G1, G2, and G3 with the right fragment size~900bp were
then selected for plasmid isolation. Based on figure 3.11, colonies (G1) are 3, 5 and 21;
(G2) is 11; and (G3) is 14 were selected and subsequently used for plasmid isolation.
1 2 3 4 5 6 7 8 9 10 11 12 13 14 15 16 17 18 19 20 21 22 23 L N
~900 bp
1500bp 1000bp 900bp 500bp 300bp 100bp
G1 G2 G3 G1

49
Clones containing the right expected size fragments were cultured and the
plasmids isolated, show in figure 3.12.
Figure 3.12: Plasmid Isolated for clones of PSMA G1, G2 & G3. Lane L is 100bp
(Seegene, Korea), lane 1 is PSMA G1 fragment plasmid isolated from
cloned 3, lane 2 is PSMA G1 fragment plasmid isolated from cloned 5, lane
3 is PSMA G2 fragment plasmid isolated from cloned 11, lane 4 is PSMA
G3 fragment plasmid isolated from cloned 14 and lane 5 is PSMA G1
fragment plasmid isolated from cloned 21. Each one has two bands except
G3 (14) no band appear due to failed in plasmid isolation or low
concentration of the plasmid isolated.
The plasmid isolation step was successfully carried out as plasmids were
obtained from most of the clones except one.
L 1 2 3 4 5
1500bp
1000bp 900bp
500bp
300bp
100bp
50
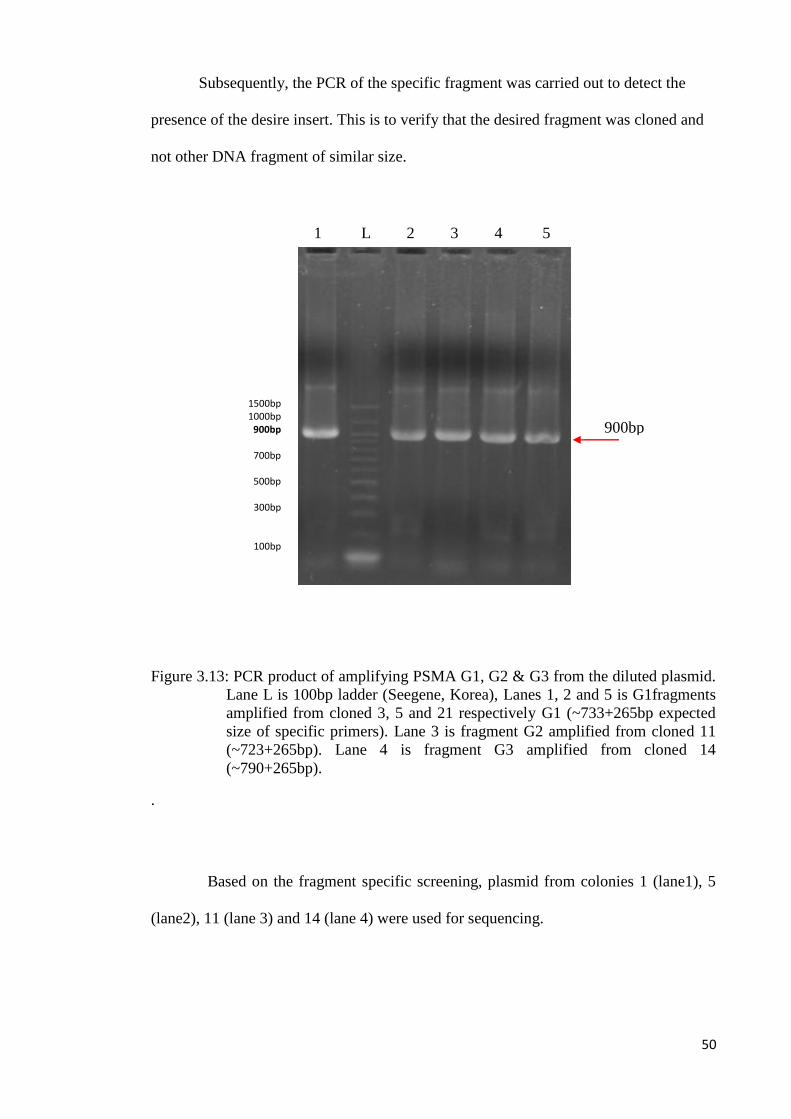
Subsequently, the PCR of the specific fragment was carried out to detect the
presence of the desire insert. This is to verify that the desired fragment was cloned and
not other DNA fragment of similar size.
Figure 3.13: PCR product of amplifying PSMA G1, G2 & G3 from the diluted plasmid.
Lane L is 100bp ladder (Seegene, Korea), Lanes 1, 2 and 5 is G1fragments
amplified from cloned 3, 5 and 21 respectively G1 (~733+265bp expected
size of specific primers). Lane 3 is fragment G2 amplified from cloned 11
(~723+265bp). Lane 4 is fragment G3 amplified from cloned 14
(~790+265bp).
.
Based on the fragment specific screening, plasmid from colonies 1 (lane1), 5
(lane2), 11 (lane 3) and 14 (lane 4) were used for sequencing.
900bp
1 L 2 3 4 5
1500bp 1000bp 900bp
700bp
500bp
300bp
100bp

51
3.2.2 Sequencing result of PSMA G1, PSMA G2 and PSMA G3
The sequencing results for the PSMA G1, result shows that there is a deletion in
both sample of PSMA G1 that is clone a3 and a5 (figure 3.14a and 3.14b)
Figure 3.14: G1 sequencing results (a) showed the deletion of G nucleotide at 459 in G1
sequencing in sample number 3 (b) showed the deletion of G nucleotide at
845 in G1 sequence in sample number 5. Due to the deletion in G1
sequence, cloning of the PSMAG1 fragment was repeated.
The fragment for PSMA G2 (clone 11) and G3 (clone 14) were successfully
cloned and the complete sequence of the fragment were obtained
(Appendix C). Based on the sequencing result cloning of G1 have to be repeated.
(a)
(b)

52
3.2.3 Re-cloning of G1 Fragment
In figure 3.15, colonies that were selected were screened by carrying out colony
PCR using M13F and M13R primers. Lanes 1, 2, 3, 4 and 5 shows faint bands of 900
bp, which was the expected size, while lane 7 and 9 are colonies with wrong inserts.
Figure 3.15: Colony PCR amplifications using M13F and M13R primers. Lane 1 to 9
(a1- a9), are all colonies picked from cloning of the fragment G1, lane N is
negative control and lane L is 100bp ladder (Seegene, Korea).
Three colonies (a1, a2 and a4) were selected from the colony PCR and proceed for
plasmid isolation process.
Figure 3.16: Plasmid isolated from colonies of G1. Lane 1 is plasmid from colony a4,
lane 2 is plasmid from colony a2, lane 3 is plasmid from colony a1 and lane
L is the 100 bp ladder (Seegene, Korea).
1 2 3 4 5 6 7 8 9 N L
1 2 3 L
~900 bp
1500bp
1000bp
900bp
500bp
300bp
100bp
1500bp
1000bp
900bp
500bp
300bp
100bp
53
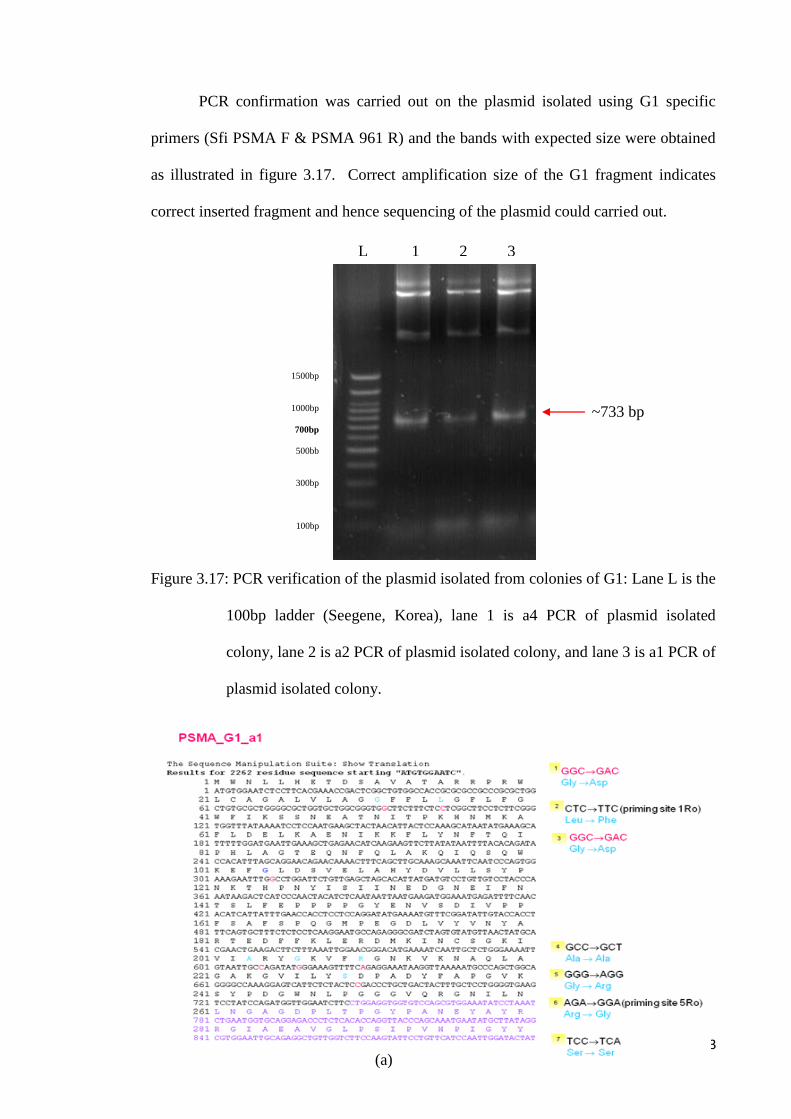
PCR confirmation was carried out on the plasmid isolated using G1 specific
primers (Sfi PSMA F & PSMA 961 R) and the bands with expected size were obtained
as illustrated in figure 3.17. Correct amplification size of the G1 fragment indicates
correct inserted fragment and hence sequencing of the plasmid could carried out.
Figure 3.17: PCR verification of the plasmid isolated from colonies of G1: Lane L is the
100bp ladder (Seegene, Korea), lane 1 is a4 PCR of plasmid isolated
colony, lane 2 is a2 PCR of plasmid isolated colony, and lane 3 is a1 PCR of
plasmid isolated colony.
L 1 2 3
~733 bp
1500bp
1000bp
700bp
500bb
300bp
100bp
(a)
54
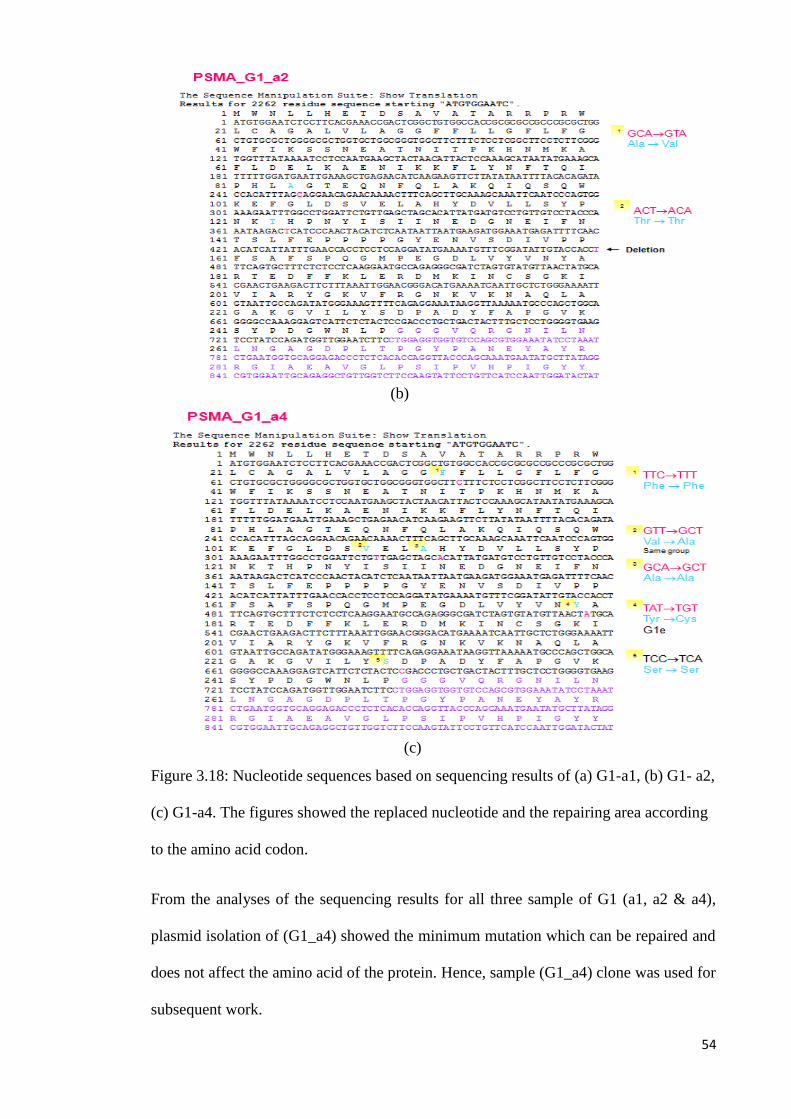
Figure 3.18: Nucleotide sequences based on sequencing results of (a) G1-a1, (b) G1- a2,
(c) G1-a4. The figures showed the replaced nucleotide and the repairing area according
to the amino acid codon.
From the analyses of the sequencing results for all three sample of G1 (a1, a2 & a4),
plasmid isolation of (G1_a4) showed the minimum mutation which can be repaired and
does not affect the amino acid of the protein. Hence, sample (G1_a4) clone was used for
subsequent work.
(b)
(c)

55
3.2.4 Overlapping of PSMA G1, G2 and G3 fragments from plasmid isolation
product
Overlap extension PCR was conducted in three different combinations of
template. All the overlapping combination and the expected size showed in the
following table.
Table 3.2: PSMA G1, G2 and G3 fragments combination for overlapping PCR
combination Fragment 1 Fragment2 Fragment 3 Expected size
1 G1 G2 - 1456bp
2 G2 G3 - 1513bp
3 G1 G2 G3 2246bp
Figure 3.19: Two Steps PCR were done; both steps were carried out with Pfu
polymerase enzyme. Lane L is 1kb ladder (Promega, USA), Lane 1 to 4 is
G1-G2 fragment (1456bp), lane 5 to 8 is G2-G3 fragment (1513bp), lane 9
to 12 is G1-G2-G3 fragment (2232bp) and lane N is the negative control.
L 1 2 3 4 5 6 7 8 9 10 11 12 N
10000bp
3000bp
2500bp
2000bp
1500bp
1000bp
500bp
250bp
G1-G2 G2-G3 G1-G2-G3
56
10000bp
8000bp
2500bp
2000bp
1500bp
1000bp
750bp
500bp
250bp
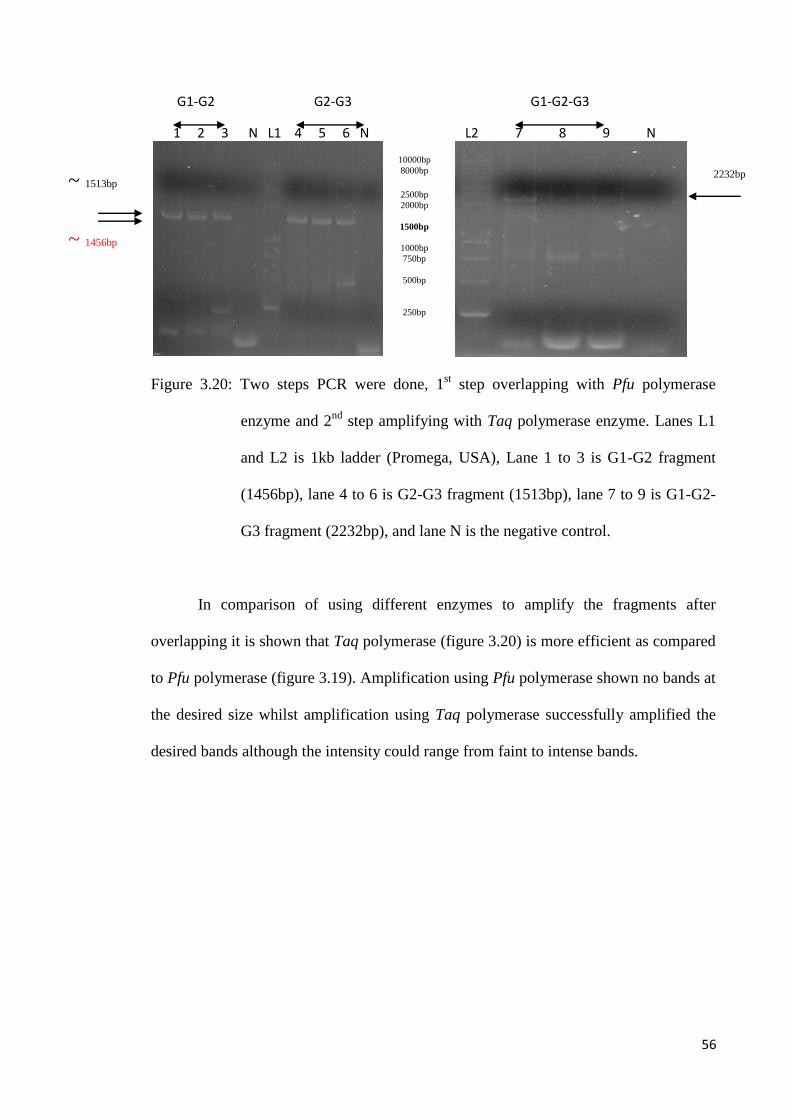
Figure 3.20: Two steps PCR were done, 1st step overlapping with Pfu polymerase
enzyme and 2nd
step amplifying with Taq polymerase enzyme. Lanes L1
and L2 is 1kb ladder (Promega, USA), Lane 1 to 3 is G1-G2 fragment
(1456bp), lane 4 to 6 is G2-G3 fragment (1513bp), lane 7 to 9 is G1-G2-
G3 fragment (2232bp), and lane N is the negative control.
In comparison of using different enzymes to amplify the fragments after
overlapping it is shown that Taq polymerase (figure 3.20) is more efficient as compared
to Pfu polymerase (figure 3.19). Amplification using Pfu polymerase shown no bands at
the desired size whilst amplification using Taq polymerase successfully amplified the
desired bands although the intensity could range from faint to intense bands.
1 2 3 N L1 4 5 6 N L2 7 8 9 N
~ 1456bp
2232bp
G1-G2 G2-G3 G1-G2-G3
~ 1513bp

57
Figure 3.21: Gel extraction of PSMA G1-2, PSMA G2-3 & PSMA G1-2-3. Lane L is
1kb ladder (Promega, USA), lane 1 is PSMAG1-2, lane 2 is PSMA G2-3
and lane 3 is PSMA G 1-2-3.
3.2.5 Sequencing of the overlapped fragments
All fragments after purification only had shown faint bands due to much of it
being lost in the purification process. The purified fragments PSMA G1-G2, PSMA G2-
G3 & PSMA G1-G2-G3 were then cloned in JM109 cells but did not produce
significant results as the sequencing results indicated the presence of partially inserted
sequence and the sequence with mutation (data not shown).
Since this approach yielded no results, another attempt was done by amplifying
the G1 fragment from the isolated plasmid and amplify G2-G3 overlapped fragment
using the isolated plasmid and then overlapping both of these amplified products.
L 1 2 3
1500bp
2000bp
10000bp
4000bp
2000bp
1500bp
1000bp
750bp
500bp
250bp
250bp

58
3.2.6 PCR optimization to amplify G1
In the PCR optimization of G1, the enzyme type and quantity were the
parameters, which were manipulated at this stage. Two types of the enzymes were used,
namely Taq polymerase and Pfu polymerase, to amplify PSMA G1 fragment. The
amplified product using Pfu polymerase was used in overlapping while which amplified
with Taq was used in cloning.
Figure 3.22: PCR amplification of G1using plasmid (colony a4) as template with one unit of Pfu
polymerase enzyme and one unit of Taq polymerase enzyme. Lane 1 to 3 is the G1
fragment amplified with one unit of Pfu polymerase enzyme, lane 4 to 6 are G1 fragment
amplified with one unit of Taq polymerase enzyme, lane N is the negative control and
lane L is 100bp ladder (Seegene, Korea).
.
Figure 3.23: PCR amplification of G1using plasmid (colony a4) as template with 1.5
unit of Pfu polymerase enzyme.
1 2 3 N L N 4 5 6
1 2 3 4 5 N L
~733 bp
~733 bp
1500bp
1000bp
700bp
500bp
300bp
100bp
1500bp
1000bp
700bp
500bp
300bp
100bp

59
It is shown that Pfu polymerase could only amplify using a much higher
concentration as shown in figure 3.23, using one unit of Pfu polymerase did not yield
any bands (figure 3.22) while by using 1.5 units of Pfu polymerase the desired fragment
could be amplified.
3.2.7 PCR optimization of overlapping G2-G3
PCR optimization was carried out to obtain optimal amplification of G2-G3
fragment after the overlapping PSMA G2 and G3, which carried out using plasmid of
G2 and G3 clones. The parameter, which manipulated was the concentration of the
enzyme for each PCR reaction.
(a) (b)
Figure 3.24: (a): Overlap PCR of PSMA G2 and G3 fragments using one unit of Taq
polymerase enzyme. Lane L is 1kb ladder (Promega, USA), lane N is
the negative control and lane 1 to 3 is the Overlap PCR amplification
(b): Overlap PCR of PSMA G2 and G3 fragments using two units of Taq
polymerase enzyme. Lane L is 1kb ladder (Promega, USA), lane N
is the negative control and lane 1 to 2 is the Overlap PCR
amplification.
L N 1 2 3 L N 1 2
10000bp
40000bp
2000bp
1500bp
1000bp
500bp
250bp
10000bp
4000bp
2000bp
1500bp
1000bp
500bp
250bp
1513bp
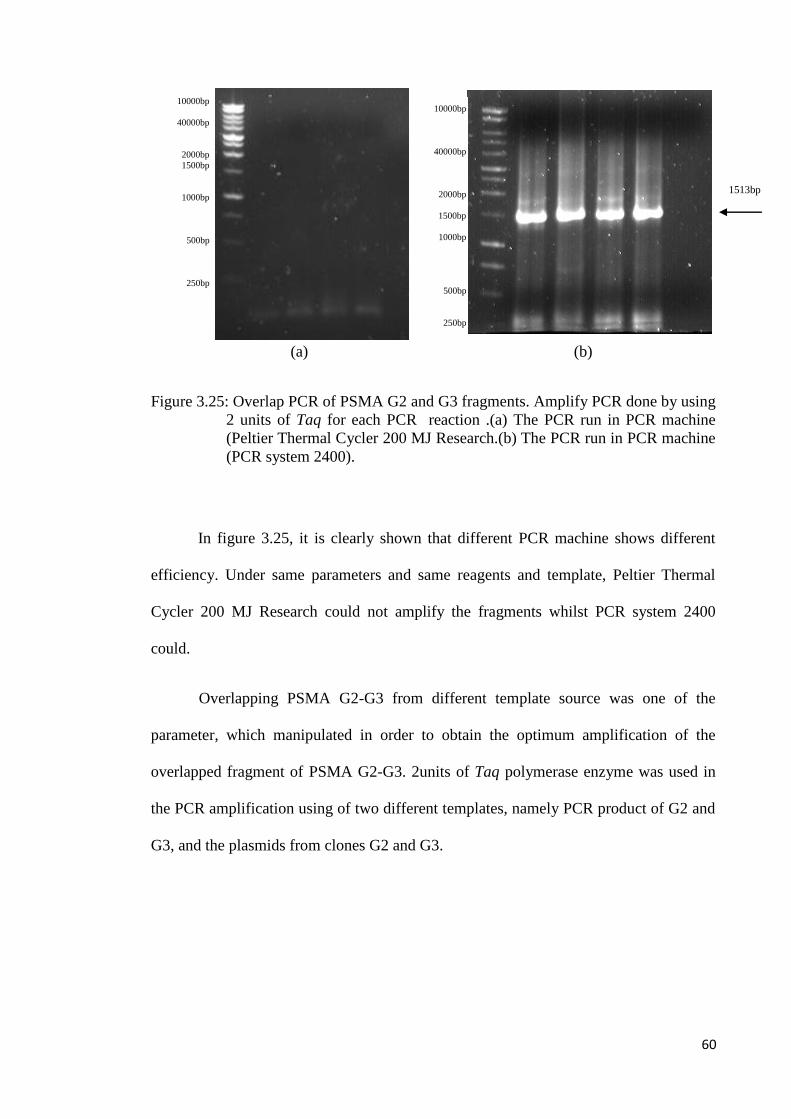
60
(a) (b)
Figure 3.25: Overlap PCR of PSMA G2 and G3 fragments. Amplify PCR done by using
2 units of Taq for each PCR reaction .(a) The PCR run in PCR machine
(Peltier Thermal Cycler 200 MJ Research.(b) The PCR run in PCR machine
(PCR system 2400).
In figure 3.25, it is clearly shown that different PCR machine shows different
efficiency. Under same parameters and same reagents and template, Peltier Thermal
Cycler 200 MJ Research could not amplify the fragments whilst PCR system 2400
could.
Overlapping PSMA G2-G3 from different template source was one of the
parameter, which manipulated in order to obtain the optimum amplification of the
overlapped fragment of PSMA G2-G3. 2units of Taq polymerase enzyme was used in
the PCR amplification using of two different templates, namely PCR product of G2 and
G3, and the plasmids from clones G2 and G3.
1513bp
10000bp
40000bp
2000bp
1500bp
1000bp
500bp
250bp
10000bp
40000bp
2000bp
1500bp
1000bp
500bp
250bp
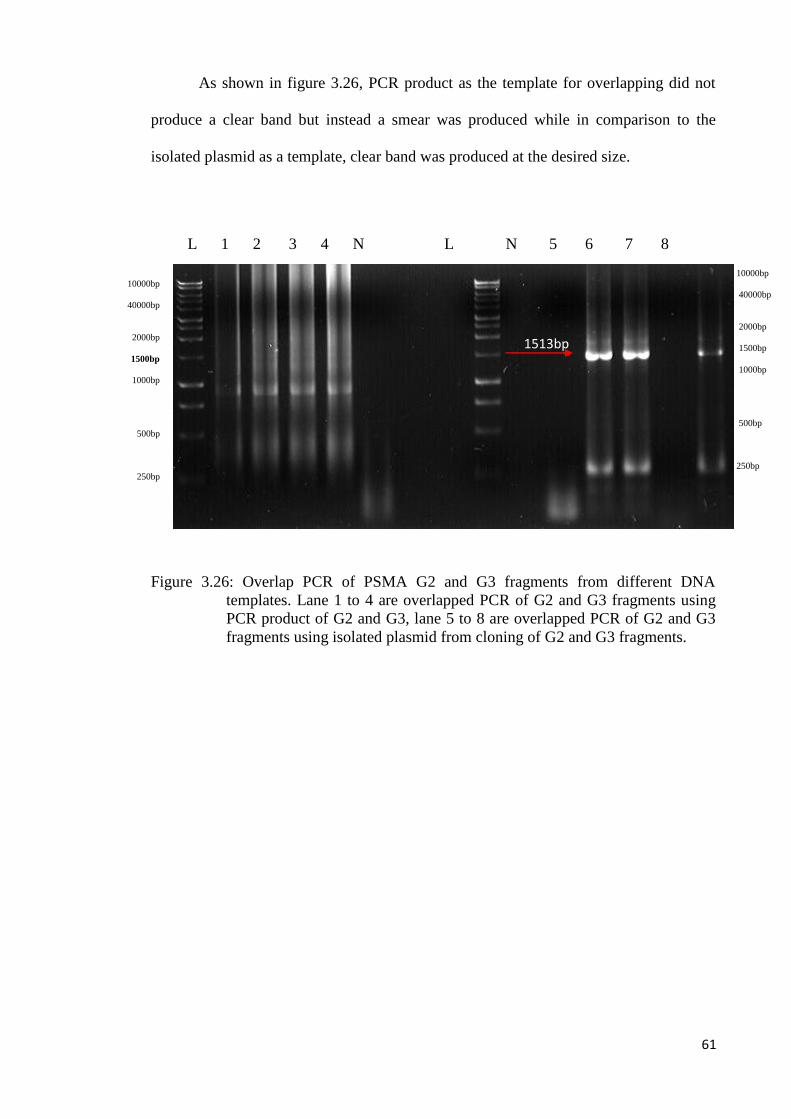
61
As shown in figure 3.26, PCR product as the template for overlapping did not
produce a clear band but instead a smear was produced while in comparison to the
isolated plasmid as a template, clear band was produced at the desired size.
Figure 3.26: Overlap PCR of PSMA G2 and G3 fragments from different DNA
templates. Lane 1 to 4 are overlapped PCR of G2 and G3 fragments using
PCR product of G2 and G3, lane 5 to 8 are overlapped PCR of G2 and G3
fragments using isolated plasmid from cloning of G2 and G3 fragments.
L 1 2 3 4 N L N 5 6 7 8
1513bp
bp
10000bp
40000bp
2000bp
1500bp
1000bp
500bp
250bp
10000bp
40000bp
2000bp
1500bp
1000bp
500bp
250bp
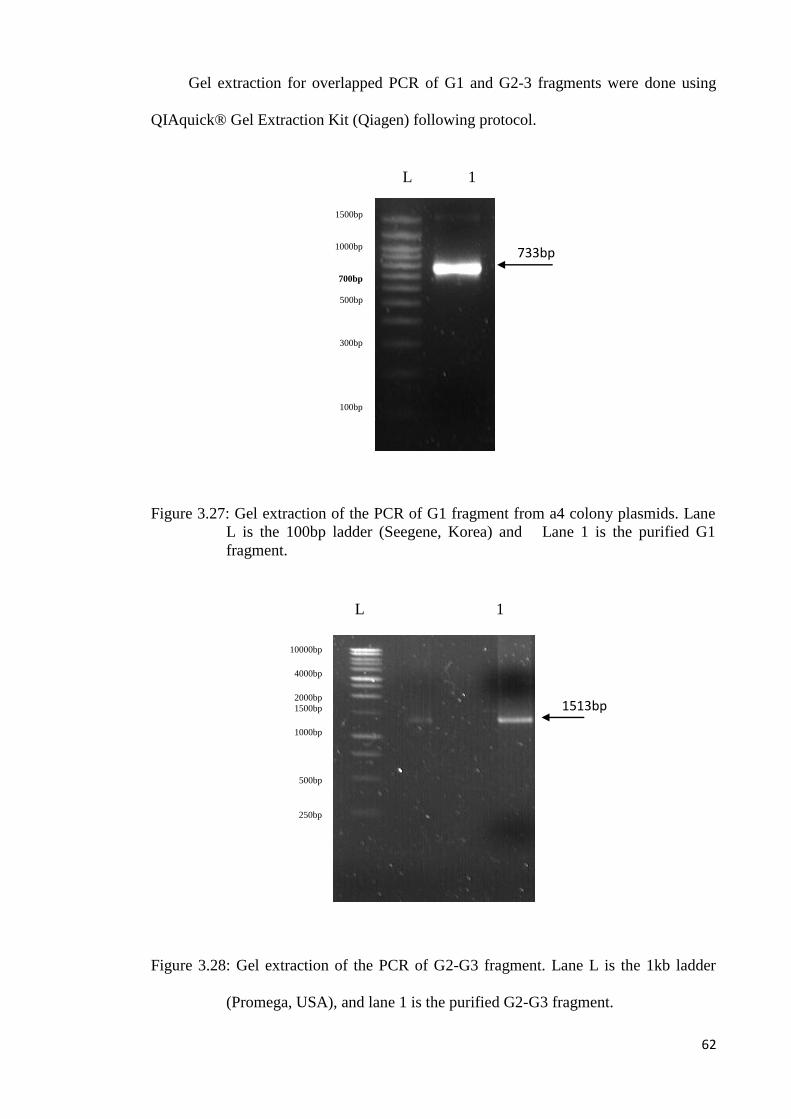
62
Gel extraction for overlapped PCR of G1 and G2-3 fragments were done using
QIAquick® Gel Extraction Kit (Qiagen) following protocol.
Figure 3.27: Gel extraction of the PCR of G1 fragment from a4 colony plasmids. Lane
L is the 100bp ladder (Seegene, Korea) and Lane 1 is the purified G1
fragment.
Figure 3.28: Gel extraction of the PCR of G2-G3 fragment. Lane L is the 1kb ladder
(Promega, USA), and lane 1 is the purified G2-G3 fragment.
L 1
L 1
733bp
1513bp
1500bp
1000bp
700bp
500bp
300bp
100bp
10000bp
4000bp
2000bp
1500bp
1000bp
500bp
250bp

63
3.2.8 Overlapping PSMA G2-G3 with G1:
Figure 3.29: Overlap PCR of PSMA G2-G3 with PSMA G1. Lane L is 1kb ladder
(Promega, USA), lane 1 and 2 is PSMA G1-G2-G3, and lane N is the
negative control.
Figure 3.30: PCR optimization of PSMA G1-G2-G3 sample through annealing
temperature ranging between 45ºC to 63.4ºC. Lane 1 at 45.0ºC, lane 2 at
48.2ºC, lane 3 at 50.5ºC, lane 4 at 56.7ºC, lane 5 at 59.6ºC and lane 6 at
63.4ºC and lane L is 1kb ladder (Promega, USA).
L 1 2 N
1 2 3 4 5 6 L
2246bp
2246bp
10000bp
40000bp
2000bp
1500bp
1000bp
750bp
500bp
250bp
2000bp
1500bp
1000bp
750bp
500bp
250bp
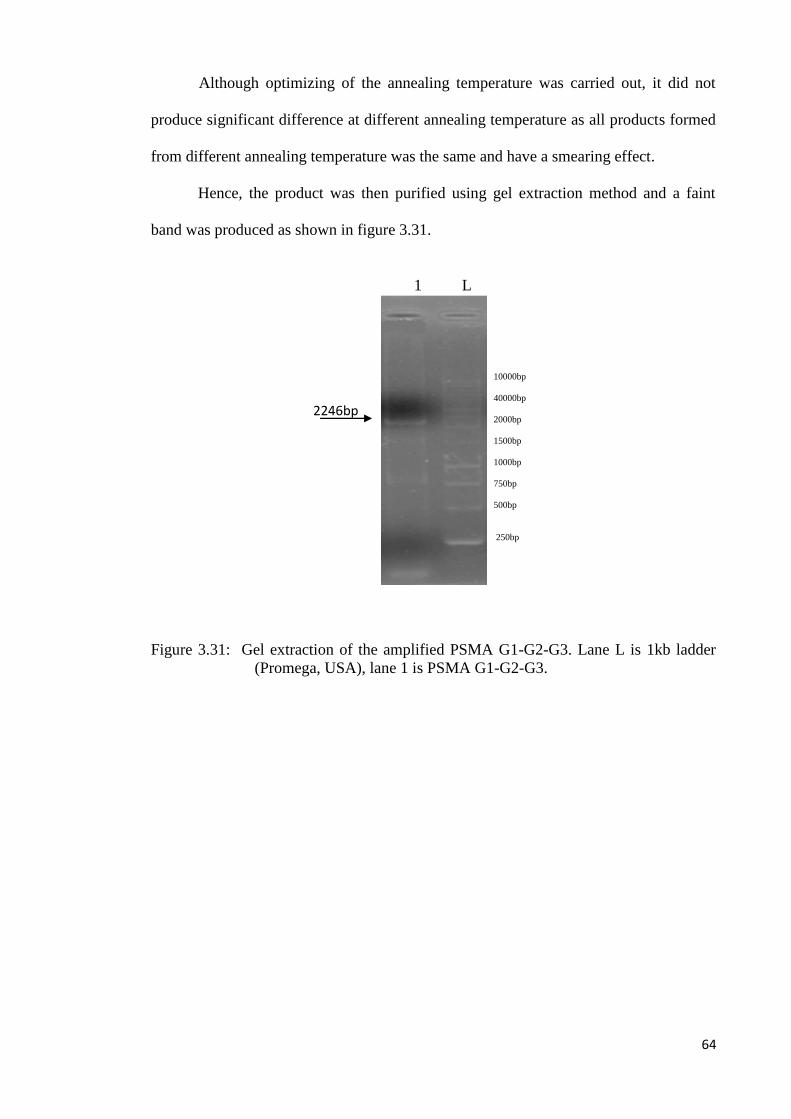
64
Although optimizing of the annealing temperature was carried out, it did not
produce significant difference at different annealing temperature as all products formed
from different annealing temperature was the same and have a smearing effect.
Hence, the product was then purified using gel extraction method and a faint
band was produced as shown in figure 3.31.
Figure 3.31: Gel extraction of the amplified PSMA G1-G2-G3. Lane L is 1kb ladder
(Promega, USA), lane 1 is PSMA G1-G2-G3.
1 L
2246bp
10000bp
40000bp
2000bp
1500bp
1000bp
750bp
500bp
250bp

65
The purified product was subsequently cloned using pGEM®-T vectors to
amplify the fragment.
Figure 3.32: Colony PCR of PSMA G1-2-3 by using M13 forward and reverse primers.
Colonies containing the insert were successfully identified through colony
PCR. Lanes 2, 3, 9 and 13 showed bands at the expected size ~2500 bp
(2246bp+ 256bp size of specific primers) due to colony having the correct
insert. Lane L is 1kb ladder (Promega USA); lane N is the negative control.
Figure 3.33: Plasmid isolation of PSMA G1-2-3 of the samples 2, 3, 9 and 13. Lane L is
1kb ladder (Promega USA).
1 2 3 4 5 6 7 8 N L 9 10 11 12 13 14 15
2500 bp
10000bp
4000bp
3000bp
1500bp
1000bp
750bp
500bp
250bp
2 3 9 13 L
L
10000bp
40000bp
3000bp
2000bp
1000bp
750bp
500bp
250bp

66
The plasmid samples were sent for sequencing, and subsequently cloned using
pPICZαA vector to amplify the fragment after digestion with SfiI and NotI restriction
enzymes.
3.3 Plasmid digestion with Sfi1 and Not1
To determine if the insert is in the correct size, the plasmid from both sides was
digested with Sfi1 and Not1 in a total volume of 50 μl. The mixtures were incubated at
37ºC for 3 hours. Results of digestion revealing approximately 2246bp can be seen in
figure 3.34. Digested and purified plasmids were analyzed by 1% agarose gel
electrophoresis and sent for sequencing.
Figure 3.34: Analysis of SfiI and Not1 restriction enzymes. Double digestion of plasmid
isolated from PSMA G123 colonies. Lane L is 1kb ladder, lane 1- 4 showed
a restricted plasmid, indicating that digestion has occurred.
1 2 L 3 4
10000bp
40000bp
3000bp
2500bp
2000bp
1500bp
1000bp
750bp
500bp
250bp
2246bp

67
3.4 Colony PCR of PSMA G123
Colony PCR was conducting after ligation of the restricted plasmid PSMA G123
into digested pPICZαA vector and transformed into E. coli strain (Top10). 23 colonies
were selected and verified by PCR. The PCR was done by using vector primers
(Forward primer: α-factor, Reverse primer: 3’AOX). Thus the expected PCR product
was 2246bp + 300bp (vector primer size), approximately 2500bp. results of colony PCR
are presented in figure 3.35.
Figure 3.35: Colony PCR: Colonies containing the insert were successfully identified
through colony PCR. Lane L is 1kb ladder. Lane 1 to 23 showed inserted
(3 and 6), and non-inserted colonies, which were determined according to
exactly expected size. Lane N is a negative control (PCR reaction without
DNA).
Selected colonies, which were determined according to expected size 2500bp, were
proceeding for plasmid isolation.
1 2 3 4 5 6 7 8 9 10 11 12 L 13 14 15 16 17 18 19 20 21 22 23 N
10000bp
40000bp
3000bp
2000bp
1500bp
1000bp
750bp
500bp
250bp
2500bp
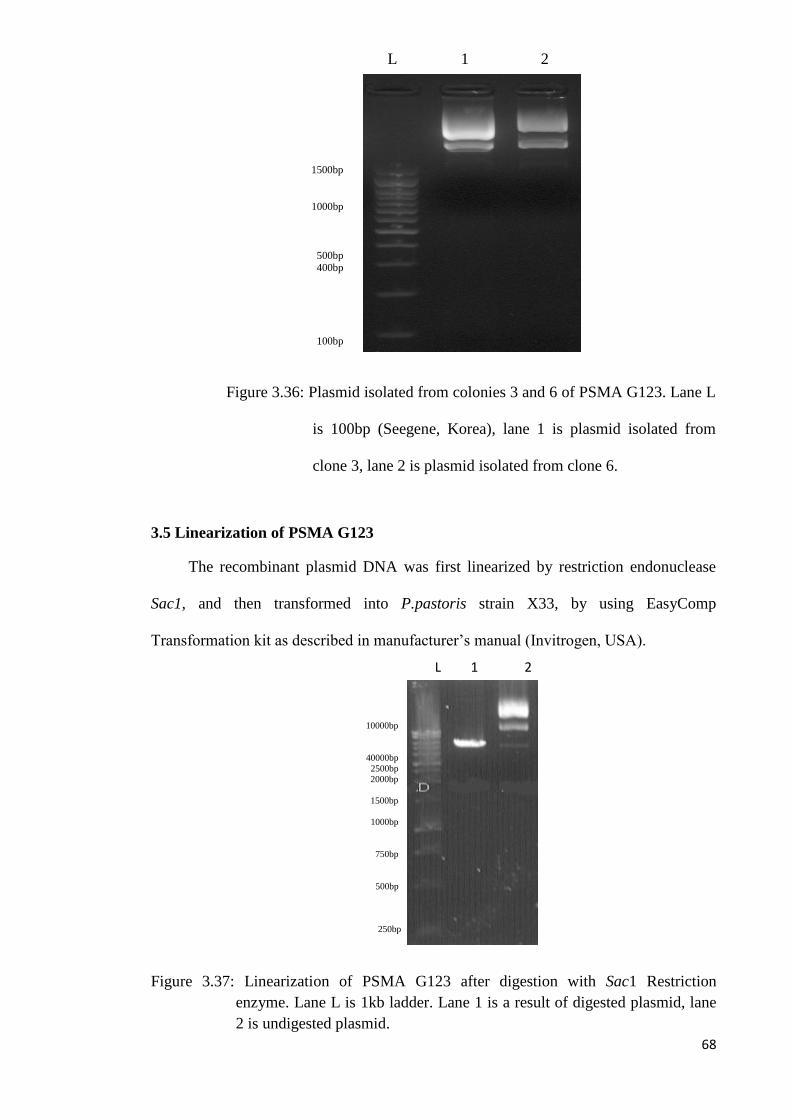
68
Figure 3.36: Plasmid isolated from colonies 3 and 6 of PSMA G123. Lane L
is 100bp (Seegene, Korea), lane 1 is plasmid isolated from
clone 3, lane 2 is plasmid isolated from clone 6.
3.5 Linearization of PSMA G123
The recombinant plasmid DNA was first linearized by restriction endonuclease
Sac1, and then transformed into P.pastoris strain X33, by using EasyComp
Transformation kit as described in manufacturer’s manual (Invitrogen, USA).
Figure 3.37: Linearization of PSMA G123 after digestion with Sac1 Restriction
enzyme. Lane L is 1kb ladder. Lane 1 is a result of digested plasmid, lane
2 is undigested plasmid.
1500bp
1000bp
500bp 400bp
100bp
100bp
L 1 2
10000bp
40000bp
2500bp
2000bp
1500bp
1000bp
750bp
500bp
250bp
L 1 2

69
4. Discussion
PSMA cDNA consists of 2.65 kilobase and a portion of the coding region from
nucleotide 1250 to 1700 has 54% homology to the human transferrin receptor mRNA
(Israeli RS et al., 1993). In contrast to PSA and prostatic acid phosphatase which are
secreted proteins, the prostate specific membrane antigen is an integral membrane
protein.
The PSMA (molecular weight 100,000) similarly has representation on both
benign and neoplastic prostate cells with more intense staining seen with malignant
cells. Moreover, PSMA is an integral membrane protein rather a secreted protein as is
PSA and, therefore, may be an even more appropriate vaccine component.
The foregoing list of known antigens which are over-represented on prostate: prostatic
acid phosphatase (PAP); prostate specific antigen (PSA); and prostate specific
membrane antigen (PSMA) is offered for the purpose of illustration. These well known
antigens (or the epitope bearing fragments thereof) are proteins (or peptides) and are
useful in the vaccines of the invention. However, the invention includes any other
antigens substantially uniquely present on the prostate gland so that prostate derived
tissue can be distinguished from other tissue by virtue of the presence of these antigens
(Watt et al., 1986; Lundwall and Lija, 1987).
For antigens that are proteins or peptides, a number of options is available in
addition to isolation and purification. In addition to genetic engineering techniques,
peptides, and even proteins, can be prepared using standard chemical synthesis
methods, preferably the commercially available solid-phase-based techniques. These
techniques are well known and according to the manufacturer's instructions automated
systems to conduct them can be purchased and employed.

70
In addition, protein or peptide antigens may be prepared using genetic
engineering. Procedures for the production of pure antigens from the DNA encoding the
desired antigen are well known to those skilled in the art. Briefly, the preferred DNA is
expressed in a suitable recombinant expression vector such as those adapted for E. coli;
yeast, such as Saccharomyces cerevisiae or Pichia pastoris; or filamentous fungi such as
Aspergillus nidulans (Berzofsky J & Berkower I., 1989).
The preparation of recombinant forms of protein antigens in a variety of host
cells results in a variety of posttranslational modifications which affect the
immunogenicity and other pharmaceutical properties, such as pharmacokinetics, of the
product. Accordingly, although human prostate-specific antigen (PSA) isolated from
human tissues has been used to induce the production of antibodies for diagnostic use,
the immunogen prepared in this way differs from the immunogen as prepared in
nonhuman cells, such as insect cells. The post-translational modifications peculiar to the
recombinant host result in alternations in glycosylation pattern, folding, and the like
(Houghten R, 1985).
The technique of recombinant expression may also be used to produce portions
of the desired antigen rather than the entire antigen. Whether the antigen or a suitable
epitope is prepared synthetically or recombinantly, it may be prepared initially as a
fusion protein containing amino acid sequence heterologous to the amino acid sequence
of interest. Construction of such fusion proteins is common in recombinant production
in order to stabilize the product produced in the cell. It may be unnecessary to stabilize
the desired peptide or protein in this way, especially if it is to be secreted from the
recombinant cell (Houghten R, 1985, Berzofsky J & Berkower I, 1989).

71
However, the fusion protein itself may be useful as an ingredient in the vaccine,
especially if the additional heterologous amino acid sequence supplies an
immunogenicity enhancing property on the relevant epitope. Thus, the fusion proteins
which contain the relevant amino acid sequences may be used simply as precursors of
the immunogen or may provide the end-product for use in the vaccine. If the fusion
protein is intended as an intermediate, it is useful to provide a cleavage site between the
heterologous portion and the desired epitope. Such cleavage sites include, for example,
the target sequences for various proteolytic enzymes, or, if the epitope does not contain
methionine, may constitute simply a methionine residue, which is cleaved by cyanogen
bromide. Methods to provide suitable cleavage sites are well known in the art (Hruby D,
1988).
The aim of this study was to clone the complete fragment of PSMA gene, but
since it is length was about 2.5 kb and it faced difficulties in cloning. So, in this study
PSMA gene was divided into three parts named as G1 as the first part of the gene, G2 as
the second part of the gene and G3 as the last part of the gene.
It is noted that in this study, two steps PCR were used to overlap and
amplify the expected fragments to provide a template for amplification. To amplify G1,
it was also divided into six sub fragments named a, b, c, d, e and f to facilitate cloning.
All was cloned previously except d, so this sub-fragment was amplified by overlapping
with other fragments and it later gave the complete G1. The length was 733 bp. To
amplify G2 and G3, it was done successfully and the length was 723 bp and 790 bp
respectively.
As it was shown in the results, when these three fragments were applied to
gel extraction to excise accordingly, surprisingly the excised fragments appeared in

72
shorter length. The problems was solved by heating the extracted fragment at 80º C for
five minutes and then cooled down to room temperature.
To find the whole PSMA gene, these three fragments were subjected to
overlapping and amplification in two steps PCR. To overlap these three, G1-G2 were
subjected to overlap and then were supposed to join to G3, but this step as was shown in
the results did not give any results, so Gradient PCR was done to find the right
annealing temperature. A concentrated and smear pattern was found at 50.5º C, whereas
no clear band was shown in other temperatures, so this smear pattern was applied for
dilution to overcome the problem. Unfortunately after three times dilution, no clear
band was found. The expected length was around 1.5 kb based on the length of G1 and
G2.
Since amplification of G1-G2 was failed, subsequently the amplification of
the joint G1-G2-G3 would also failed, so it seemed that this approach is not correctly
chosen. To find the whole PSMA gene containing G1-G2-G3, each fragment was cloned
separately into pGEM-T vector to proceed for overlapping. On the other side, it is also
useful to clone each fragments individually to prepare a good amount of DNA for
overlapping step.
Therefore, amplified fragments individually applied for gel extraction and
successfully obtained. All were cloned into pGEM-T vector individually and expected
clones were picked for plasmid isolation. Although one of the samples showed a faint
band (Refer to Fig3.12) in plasmid isolation step due to low resolution of agarose gel
but the presence of inserted fragment was proved by PCR and showed a clear band at
expected size (900bp), which means that a little amount of template would be enough
for amplification in PCR whereas it would not be shown on agarose gel.
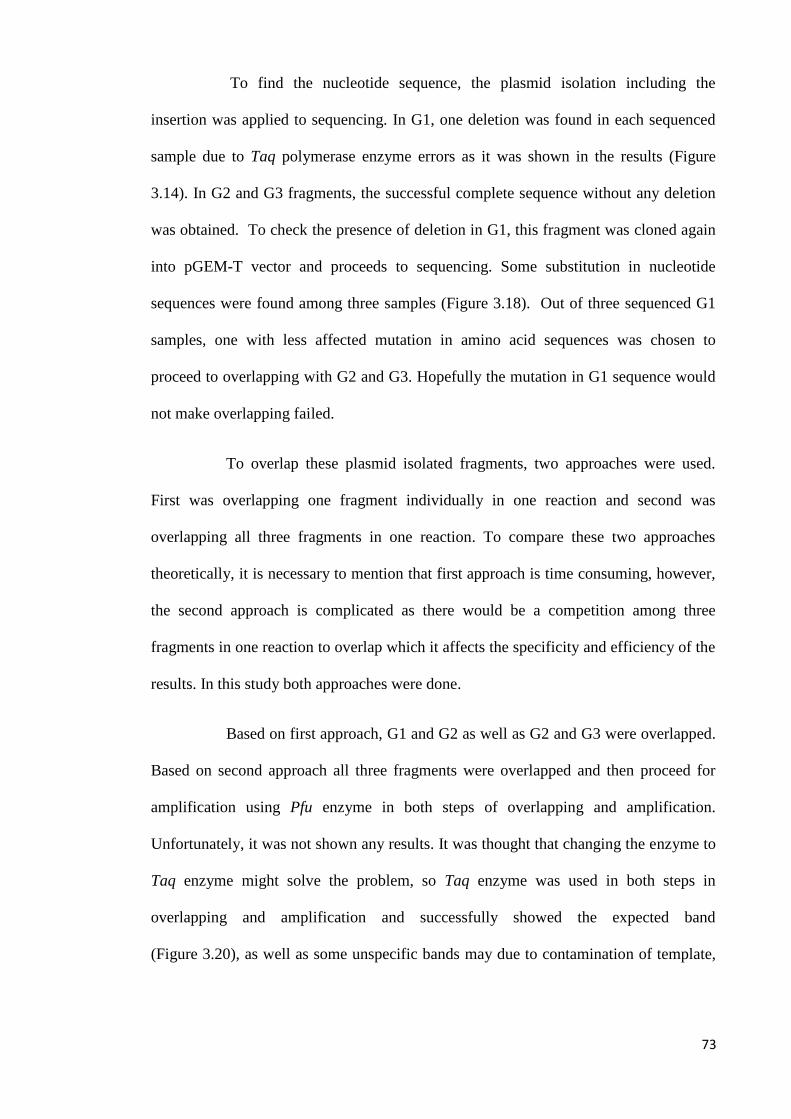
73
To find the nucleotide sequence, the plasmid isolation including the
insertion was applied to sequencing. In G1, one deletion was found in each sequenced
sample due to Taq polymerase enzyme errors as it was shown in the results (Figure
3.14). In G2 and G3 fragments, the successful complete sequence without any deletion
was obtained. To check the presence of deletion in G1, this fragment was cloned again
into pGEM-T vector and proceeds to sequencing. Some substitution in nucleotide
sequences were found among three samples (Figure 3.18). Out of three sequenced G1
samples, one with less affected mutation in amino acid sequences was chosen to
proceed to overlapping with G2 and G3. Hopefully the mutation in G1 sequence would
not make overlapping failed.
To overlap these plasmid isolated fragments, two approaches were used.
First was overlapping one fragment individually in one reaction and second was
overlapping all three fragments in one reaction. To compare these two approaches
theoretically, it is necessary to mention that first approach is time consuming, however,
the second approach is complicated as there would be a competition among three
fragments in one reaction to overlap which it affects the specificity and efficiency of the
results. In this study both approaches were done.
Based on first approach, G1 and G2 as well as G2 and G3 were overlapped.
Based on second approach all three fragments were overlapped and then proceed for
amplification using Pfu enzyme in both steps of overlapping and amplification.
Unfortunately, it was not shown any results. It was thought that changing the enzyme to
Taq enzyme might solve the problem, so Taq enzyme was used in both steps in
overlapping and amplification and successfully showed the expected band
(Figure 3.20), as well as some unspecific bands may due to contamination of template,
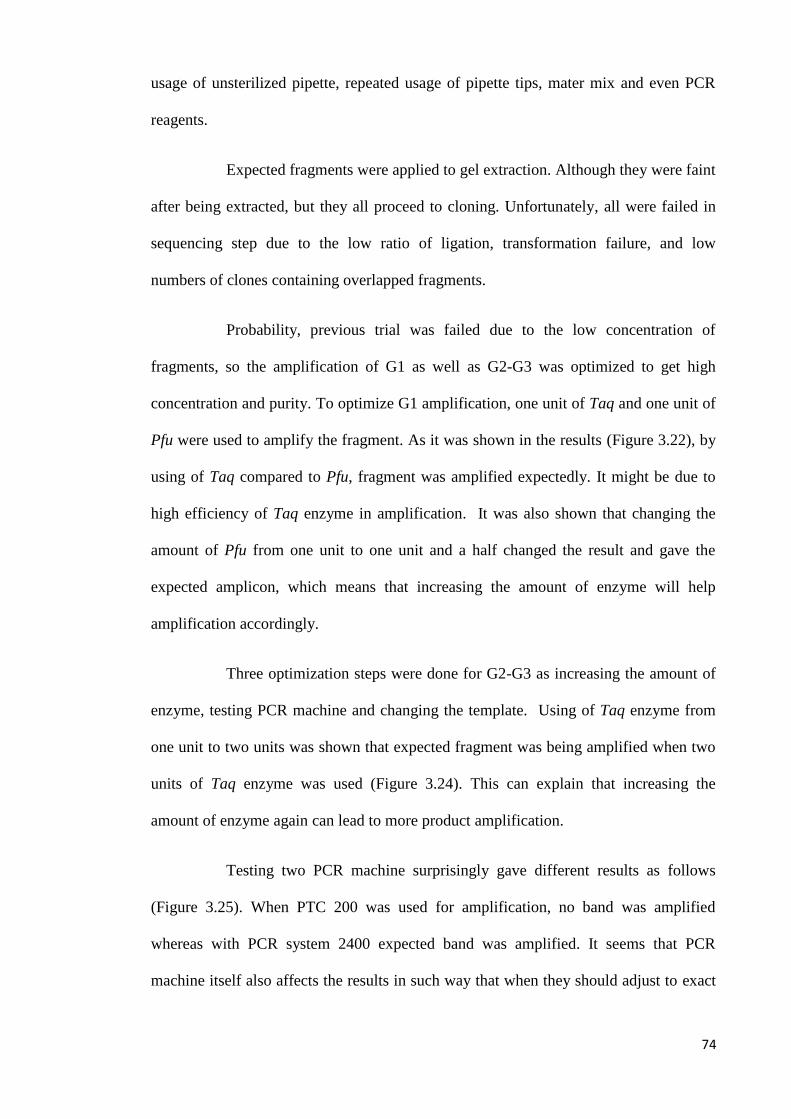
74
usage of unsterilized pipette, repeated usage of pipette tips, mater mix and even PCR
reagents.
Expected fragments were applied to gel extraction. Although they were faint
after being extracted, but they all proceed to cloning. Unfortunately, all were failed in
sequencing step due to the low ratio of ligation, transformation failure, and low
numbers of clones containing overlapped fragments.
Probability, previous trial was failed due to the low concentration of
fragments, so the amplification of G1 as well as G2-G3 was optimized to get high
concentration and purity. To optimize G1 amplification, one unit of Taq and one unit of
Pfu were used to amplify the fragment. As it was shown in the results (Figure 3.22), by
using of Taq compared to Pfu, fragment was amplified expectedly. It might be due to
high efficiency of Taq enzyme in amplification. It was also shown that changing the
amount of Pfu from one unit to one unit and a half changed the result and gave the
expected amplicon, which means that increasing the amount of enzyme will help
amplification accordingly.
Three optimization steps were done for G2-G3 as increasing the amount of
enzyme, testing PCR machine and changing the template. Using of Taq enzyme from
one unit to two units was shown that expected fragment was being amplified when two
units of Taq enzyme was used (Figure 3.24). This can explain that increasing the
amount of enzyme again can lead to more product amplification.
Testing two PCR machine surprisingly gave different results as follows
(Figure 3.25). When PTC 200 was used for amplification, no band was amplified
whereas with PCR system 2400 expected band was amplified. It seems that PCR
machine itself also affects the results in such way that when they should adjust to exact
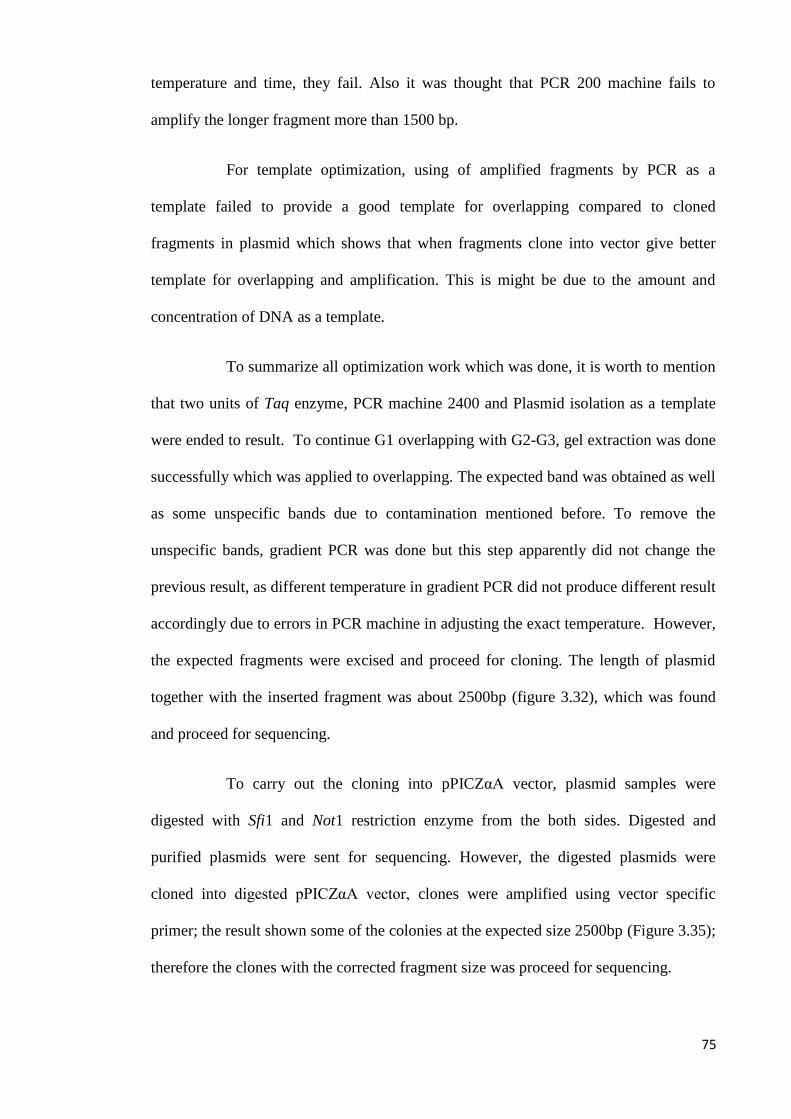
75
temperature and time, they fail. Also it was thought that PCR 200 machine fails to
amplify the longer fragment more than 1500 bp.
For template optimization, using of amplified fragments by PCR as a
template failed to provide a good template for overlapping compared to cloned
fragments in plasmid which shows that when fragments clone into vector give better
template for overlapping and amplification. This is might be due to the amount and
concentration of DNA as a template.
To summarize all optimization work which was done, it is worth to mention
that two units of Taq enzyme, PCR machine 2400 and Plasmid isolation as a template
were ended to result. To continue G1 overlapping with G2-G3, gel extraction was done
successfully which was applied to overlapping. The expected band was obtained as well
as some unspecific bands due to contamination mentioned before. To remove the
unspecific bands, gradient PCR was done but this step apparently did not change the
previous result, as different temperature in gradient PCR did not produce different result
accordingly due to errors in PCR machine in adjusting the exact temperature. However,
the expected fragments were excised and proceed for cloning. The length of plasmid
together with the inserted fragment was about 2500bp (figure 3.32), which was found
and proceed for sequencing.
To carry out the cloning into pPICZαA vector, plasmid samples were
digested with Sfi1 and Not1 restriction enzyme from the both sides. Digested and
purified plasmids were sent for sequencing. However, the digested plasmids were
cloned into digested pPICZαA vector, clones were amplified using vector specific
primer; the result shown some of the colonies at the expected size 2500bp (Figure 3.35);
therefore the clones with the corrected fragment size was proceed for sequencing.

76
PSMA G123 fragment was then linearized by using sac1 restriction
enzyme. Additionally, linearized DNA can be inserted in high efficiency via
homologous recombination procedures to generate stable cell lines whilst expression
vectors can be readily prepared that allow multiple copies of the target protein.
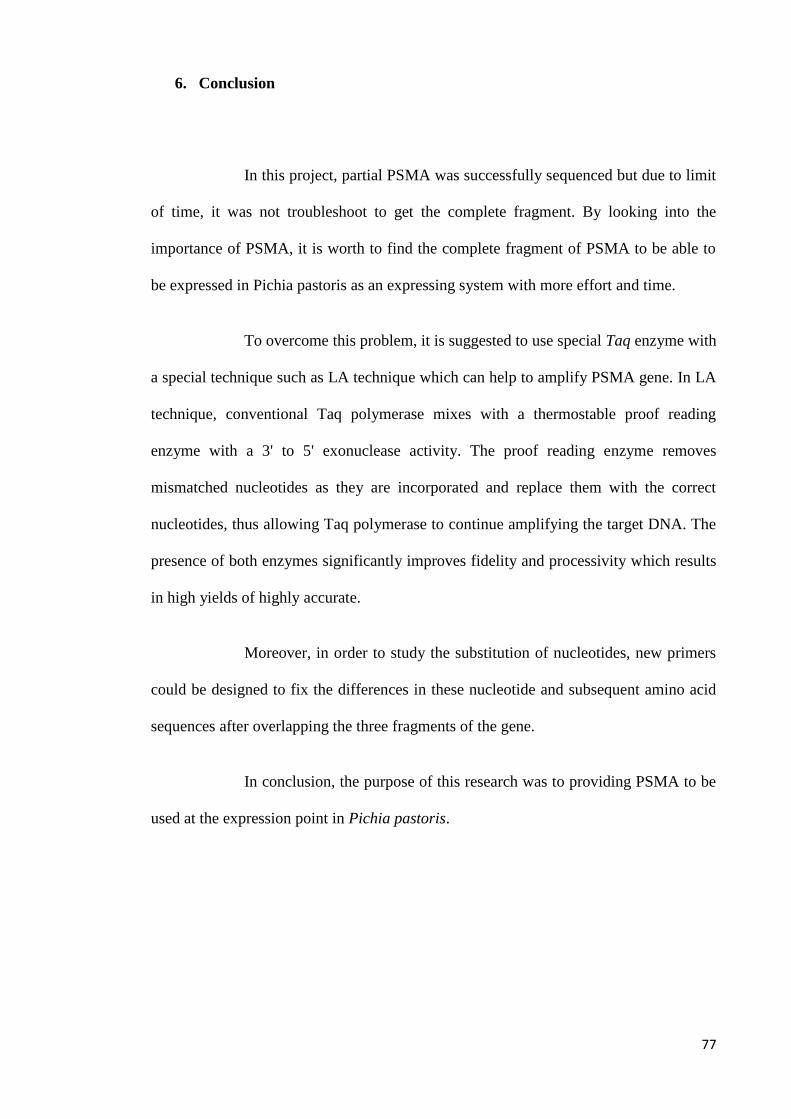
77
6. Conclusion
In this project, partial PSMA was successfully sequenced but due to limit
of time, it was not troubleshoot to get the complete fragment. By looking into the
importance of PSMA, it is worth to find the complete fragment of PSMA to be able to
be expressed in Pichia pastoris as an expressing system with more effort and time.
To overcome this problem, it is suggested to use special Taq enzyme with
a special technique such as LA technique which can help to amplify PSMA gene. In LA
technique, conventional Taq polymerase mixes with a thermostable proof reading
enzyme with a 3' to 5' exonuclease activity. The proof reading enzyme removes
mismatched nucleotides as they are incorporated and replace them with the correct
nucleotides, thus allowing Taq polymerase to continue amplifying the target DNA. The
presence of both enzymes significantly improves fidelity and processivity which results
in high yields of highly accurate.
Moreover, in order to study the substitution of nucleotides, new primers
could be designed to fix the differences in these nucleotide and subsequent amino acid
sequences after overlapping the three fragments of the gene.
In conclusion, the purpose of this research was to providing PSMA to be
used at the expression point in Pichia pastoris.
78
Reference
Aisen P. (2004). Transferrin receptor 1. Int J Biochem Cell Biol, 36:2137–2143.
Anilkumar G, Rajasekaran S, Wang S, Hankinson O, Bander N, and Rajasekaran A.
(2003). Prostate-specific membrane antigen association with filamin A modulates its
internalization and NAALADase activity. Cancer Res, 63:2645–2648.
Berzofsky J, and Berkower I. (1989). Fundamental Immunology 2nd edition, Raven
Press W.E.Paul (ed.) pp.169-208.
Bott R, Williamson M, and Kirby R. (2003). Genetic Changes and Their Prognostic
Significance in Prostate Cancer. In: Prostate cancer science and clinical practice
(Mydlo, J. H. & Godec, C. J., eds.), pp. 101-112. Academic Press.
Brown T. (2002). Gene Cloning and DNA Analysis, An Introduction. Gosport, Hants:
Blackwell Science.
Cregg J. (1999). Expression in the methylotrophic yeast Pichia Pastoris. In Gene
expression system: Using nature for the art of expression. Oregon USA: Invitrogen.
Dawson L, Maitland N, Turner A, and Usmani B. (2004). Stromal-epithelial
interactions influence prostate cancer cell invasion by altering the balance of
metallopeptidase expression. Br J Cancer, 90:1577–1582.
Ghosh A, and Heston W. (2003). Effect of carbohydrate moieties on the folate
hydrolysis activity of the prostate specific membrane antigen. Prostate, 57:140–151.
Ghosh A, and Heston W. (2004). Tumor target prostate specific membrane antigen
(PSMA) and its regulation in prostate cance. J. Cell. Biochem., 91:528–539.
Higuchi R, Krummel B, and Saki R. (1988). A general method of in vitro preparation
and specific mutagenesis of DNA fragments: study of. Nucleic Acids Research,
16:7351-7367.
Holmes E, Greene T, Tino W, Boynton A, Aldape H, Misrock S, and Murphy G.
(1996). Analysis of glycosilation of prostate specific membrane antigen derived from
LNCaP cells, prostatic carcinoma tumors and serum from prostate cancer patients.
Prostate Suppl. 7:25-29.
Houghten R. (1985). General method for the rapid solid-phase synthesis of large
numbers of peptides: specificity of antigen-antibody interactions at the level of
individual amino acids. Proc Natl Acad Sci USA. 82:5131-5135.
Hruby D, Vet Parasitol. (1988). 29:281-282, and by Uiu, SI "AIDS Research Reviews"
Dekker, Inc. (1991) 1:403-416.
Lawrence C, Ray S, Babyonyshev M, Galluser R, Borhani D, and Harrison S. (1999).
Crystal structure of the ectodomain of human transferrin receptor. Science, 286:779–
782.
79
Lee S, Kim H, Yu R, Lee K, Gardner T, Jung C, Jeng M, Yeung F, Cheng L, and Kao
C. (2002). Novel prostate-specific promoter derived from PSA and PSMA enhancers.
Mol. Ther., 6:415–421.
Leonhartsberger S. (2006). E. coli expression system efficiently secreted recombinant
proteins into culture broth. Bioprocess international, 4(4):64–66.
Lytton B. (2001). Prostate Cancer: a brief history and the discovery of hormonal
ablation therapy. j urology, 165:1859-1862.
Lowsley O. (1912). The development of the human prostate gland with the reference to
development of other structures at the neck of the urinary bladder. Am. J. Anatomy ,
13:299-348.
Lundwall A, Lilja H. (1987). Molecular cloning of human prostate specific antigen
cDNA. FEBS Lett. 214:317-322.
Mahadevan D. and Saldanha J. (1999). The extracellular regions of PSMA and the
transferrin receptor contain an aminopeptidase domain: implications for drug design.
Protein Sci, 8:2546–2549.
Marchal C, Redondo M, Padilla M, Caballero J, Rodrigo I, Garcia j, Quian J, and
Boswick D. (2004). Expression of prostate specific membrane antigen (PSMA) in
prostatic adenocarcinoma and prostatic intraepithelial neoplasia. Histol.
Histopathol.19:715–718.
Miesfeld, R. L. (2001, October 9). Use of PCR in Diagnostics and Research. Retrieved
December 16, 2009, from Applied Molecular Genetics:
http://www.biochem.arizona.edu/classes/bioc471/pages/Lecture14/Lecture14.html.
Moul J, Armstrong A, Hollenbeck B, Lattanzi J, Bradley D, and Hussain M. (2008).
Prostate Cancer. In R. W. Padzur, Cancer Management: A Multidisciplinary Approach.
11th ed. Lawrence, KS: CMP; 3:393-423.
O'keefe D, Su S, Bacich D, Horiguchi Y, Luo Y, Powell C, Zandvliet D, Russell P,
Molloy P, Nowak N, Shows T, Mullins C, Vonder Haar R, Fair W, and Heston W.
(1998). Mapping, genomic organization and promoter analysis of the human prostate-
specific membrane antigen gene. Biochim Biophys Acta, 1443:113-127.
Pinto J, Suffoletto B, Berzin T, Qiao C, Lin S, Tong W, May F, Mukherjee B and
Heston W. (1996). Prostate-specific membrane antigen: a novel folate hydrolase in
human prostatic carcinoma cells. Clin Cancer Res, 2:1445-1451.
Rajasekaran S, Anilkumar G, Oshima E, Bowie J, Liu H, Heston W, Bander N, and
Rajasekaran A. (2003). A novel cytoplasmic tail MXXXL motif mediates the
internalization of prostate-specific membrane antigen. Mol Biol Cell, 14:4835–4845.
Rawlings N, and Barrett A. (1997). Structure of membrane glutamate carboxypeptidase.
Biochim Biophys Acta, 1339:247-252.
Robert B, Donald K, Raphael P, Ralph W, James H, and Emil F. (2000). Holland-Frei
Cancer Medicine (5th ed.). Hamilton.
Rubenstein J, and McVary K (2008)."Transurethral Microwave Thermotherapy of the
Prostate (TUMT)". eMedicine.

80
Schlessinger J. (2002). Ligand-induced, receptor-mediated dimerization and activation
of EGF receptor. Cell, 110:669–672.
Schülke N, Varlamova A, Donovan P, Ma D, Gardner P, Morrissey M, Arrigale R,
Zhan C, Chodera J, Surowitz G, Maddon J, Heston D, and Olson C. (2003). The
homodimer of prostate-specific membrane antigen is a functional target for cancer
therapy. Proc Natl Acad Sci USA, 100:12590–12595.
Slusher B, Vornov J, Thomas A, Hurn P, Harukuni I, Bhardwaj A, Traystman R,
Robinson M, Britton P, Lu X, Tortella F, Wozniak K, Yudkoff M, Potter B, and
Jackson P. (1999). Selective inhibition of NAALADase, which converts NAAG to
glutamate, reduces ischemic brain injury. Nat Med, 5:1396–1402.
Strax J. (2008). PSA rising, prostate cancer survivor, J Urol. 54(4):816-23.
Su S, Huang I, Fair W, Powell C, Heston W. (1995). Alternatively spliced variants of
prostate-specific membrane antigen RNA: ratio of expression as a potential
measurement of progression. Cancer Res., 55:1441–1443.
Sumitomo M, Shen R, Walburg M, Dai J, Geng Y, Navarro D, Boileau G, Papandreou
C, Giancotti F, Knudsen B, and Nanus D. (2000). Neutral endopeptidase inhibits
prostate cancer cell migration by blocking focal adhesion kinase signaling. J Clin
Invest, 106:1399–1407.
Sung S, and Chung L. (2002). Prostate tumor-stroma interaction: molecular mechanisms
and opportunities for therapeutic targeting. Differentiation, 70:506–521.
The Cancer Council Victoria. (2007, August). Prostate problems. Retrieved December
15,2009,from:http://www.ipsas.upm.edu.my/caed/download/download_factsheet/MAS
ALAH%20PROSTAT/Infosheet_prostate_probs_08.pdf.
Walsh P, and Worthington J. (2002). Dr. Patrick Walsh's Guide to Surviving Prostate
Cancer. Grand Central Publishing.
Watt K, Lee P,'Timkulu T, Chan W, and Loor R. (1986). Human prostate-specific
antigen: structural and functional similarity with serine proteases. Proc Natl Acad Sci
USA 83:3166-3170.
Watt F, Martorana A, Brookes D, Ho T, Kingsley E, O'Keefe D (2001). A tissue-
specific enhancer of the prostate-specific membrane antigen gene, FOLH1. Genomics,
73:243–254.
Wong Y, and Wang Y. (2000). Growth factors and epithelial-stromal interactions in
prostate cancer development. Int Rev Cytol, 199:65–116.
Wright G, Grob B, Haley C, Grossman K, Newhall K, Petrylak D, Troyer J, Konchuba
A, Schellhammer P, Moriarty R. (1996). Upregulation of prostate-specific membrane
antigen after androgen-deprivation therapy. Urology, 48:326–334.
Zhou M, and Sanchez C. (2000). Universal TA Cloning. Curr. Issues Mol. Biol. ,
2(1):1-7.

81
Appendix
Source: www.promega.com
Source: www.invitrogen.com
(a) The summary of features available on the pGEM-T and pPICZαA vectors used
to clone the PSMA fragments into JM109 and Top10 competent cells
respectively.
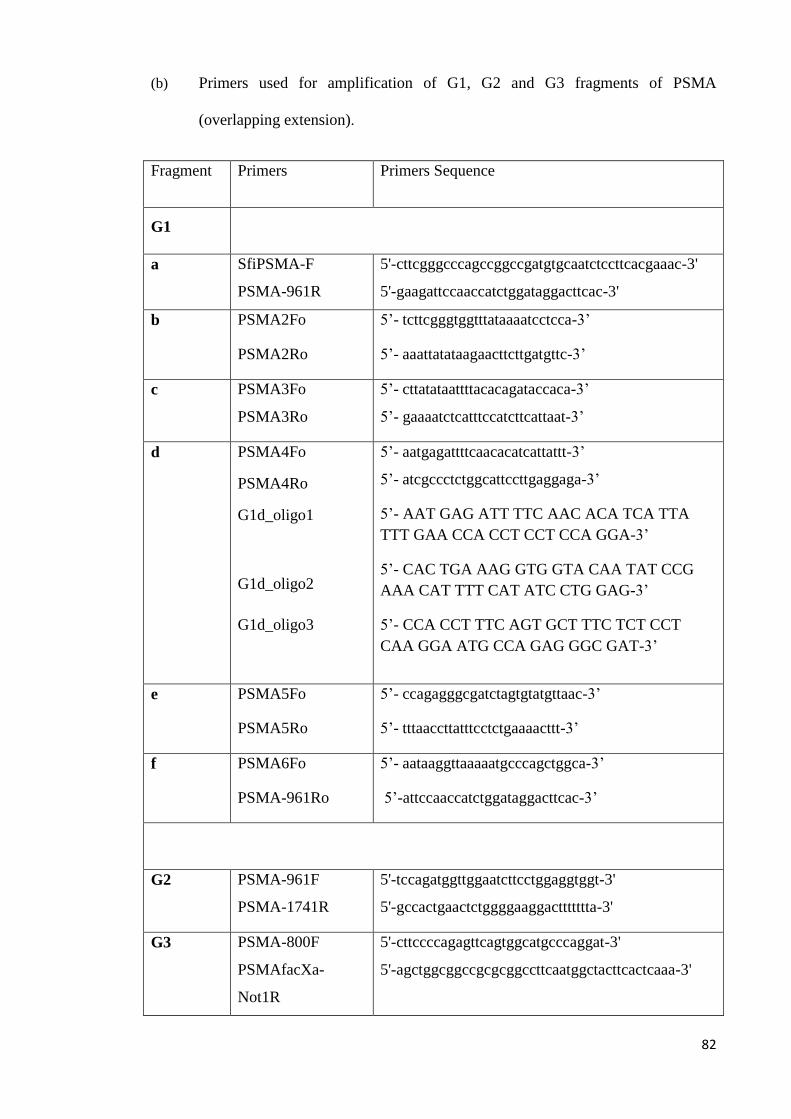
82
(b) Primers used for amplification of G1, G2 and G3 fragments of PSMA
(overlapping extension).
Fragment Primers Primers Sequence
G1
a SfiPSMA-F
PSMA-961R
5'-cttcgggcccagccggccgatgtgcaatctccttcacgaaac-3'
5'-gaagattccaaccatctggataggacttcac-3'
b PSMA2Fo
PSMA2Ro
5’- tcttcgggtggtttataaaatcctcca-3’
5’- aaattatataagaacttcttgatgttc-3’
c PSMA3Fo
PSMA3Ro
5’- cttatataattttacacagataccaca-3’
5’- gaaaatctcatttccatcttcattaat-3’
d PSMA4Fo
PSMA4Ro
G1d_oligo1
G1d_oligo2
G1d_oligo3
5’- aatgagattttcaacacatcattattt-3’
5’- atcgccctctggcattccttgaggaga-3’
5’- AAT GAG ATT TTC AAC ACA TCA TTA
TTT GAA CCA CCT CCT CCA GGA-3’
5’- CAC TGA AAG GTG GTA CAA TAT CCG
AAA CAT TTT CAT ATC CTG GAG-3’
5’- CCA CCT TTC AGT GCT TTC TCT CCT
CAA GGA ATG CCA GAG GGC GAT-3’
e PSMA5Fo
PSMA5Ro
5’- ccagagggcgatctagtgtatgttaac-3’
5’- tttaaccttatttcctctgaaaacttt-3’
f PSMA6Fo
PSMA-961Ro
5’- aataaggttaaaaatgcccagctggca-3’
5’-attccaaccatctggataggacttcac-3’
G2 PSMA-961F
PSMA-1741R
5'-tccagatggttggaatcttcctggaggtggt-3'
5'-gccactgaactctggggaaggacttttttta-3'
G3 PSMA-800F
PSMAfacXa-
Not1R
5'-cttccccagagttcagtggcatgcccaggat-3'
5'-agctggcggccgcgcggccttcaatggctacttcactcaaa-3'
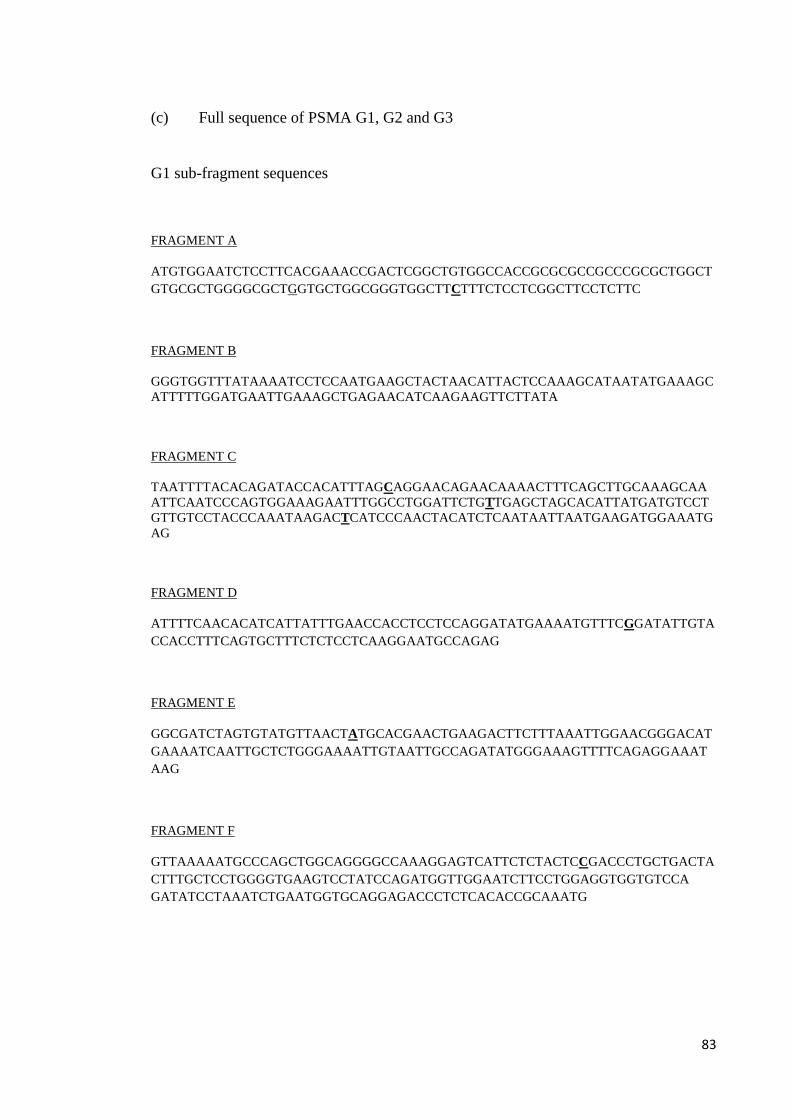
83
(c) Full sequence of PSMA G1, G2 and G3
G1 sub-fragment sequences
FRAGMENT A
ATGTGGAATCTCCTTCACGAAACCGACTCGGCTGTGGCCACCGCGCGCCGCCCGCGCTGGCT
GTGCGCTGGGGCGCTGGTGCTGGCGGGTGGCTTCTTTCTCCTCGGCTTCCTCTTC
FRAGMENT B
GGGTGGTTTATAAAATCCTCCAATGAAGCTACTAACATTACTCCAAAGCATAATATGAAAGC
ATTTTTGGATGAATTGAAAGCTGAGAACATCAAGAAGTTCTTATA
FRAGMENT C
TAATTTTACACAGATACCACATTTAGCAGGAACAGAACAAAACTTTCAGCTTGCAAAGCAA
ATTCAATCCCAGTGGAAAGAATTTGGCCTGGATTCTGTTGAGCTAGCACATTATGATGTCCT
GTTGTCCTACCCAAATAAGACTCATCCCAACTACATCTCAATAATTAATGAAGATGGAAATG
AG
FRAGMENT D
ATTTTCAACACATCATTATTTGAACCACCTCCTCCAGGATATGAAAATGTTTCGGATATTGTA
CCACCTTTCAGTGCTTTCTCTCCTCAAGGAATGCCAGAG
FRAGMENT E
GGCGATCTAGTGTATGTTAACTATGCACGAACTGAAGACTTCTTTAAATTGGAACGGGACAT
GAAAATCAATTGCTCTGGGAAAATTGTAATTGCCAGATATGGGAAAGTTTTCAGAGGAAAT
AAG
FRAGMENT F
GTTAAAAATGCCCAGCTGGCAGGGGCCAAAGGAGTCATTCTCTACTCCGACCCTGCTGACTA
CTTTGCTCCTGGGGTGAAGTCCTATCCAGATGGTTGGAATCTTCCTGGAGGTGGTGTCCA
GATATCCTAAATCTGAATGGTGCAGGAGACCCTCTCACACCGCAAATG
84
G2 fragment sequence
GCAGGAgAcCCTCTCACACCAGGTTACCCAGCAAATGAATATGCTTATAGGCGTGGAATT
GCAGAGGCTGTTGGTCTTCCAAGTATTCCTGTTCATCCAATTGGATACTATGATGCACAG
AAGCTCCTAGAAAAAATGGGTGGCTCAGCACCACCAGATAGCAGCTGGAGAGGAAGTCTC
AAAGTGCCCTACAATGTTGGACCTGGCTTTACTGGAAACTTTTCTACACAAAAAGTCAAG
ATGCACATCCACTCTACCAATGAAGTGACAAGAATTTACAATGTGATAGGTACTCTCAGA
GGAGCAGTGGAACCAGACAGATATGTCATTCTGGGAGGTCACCGGGACTCATGGGTGTTT
GGTGGTATTGACCCTCAGAGTGGAGCAGCTGTTGTTCATGAAATTGTGAGGAGCTTTGGA
ACACTGAAAAAGGAAGGGTGGAGACCTAGAAGAACAATTTTGTTTGCAAGCTGGGATGCA
GAAGAATTTGGTCTTCTTGGTTCTACTGAGTGGGCAGAGGAGAATTCAAGACTCCTTCAA
GAGCGTGGCGTGGCTTATATTAATGCTGACTCATCTATAGAAGGAAACTACACTCTGAGA
GTTGATTGTACACCGCTGATGTACAGCTTGGTACACAACCTAACAAAAGAGCTGAaAAGC
CCTGATGAAGGCTTTGAAGGCAAATCTCTTTATGAAAGTTGGACTAAAAAAAGTCCTTCC
CCAGA
G3 fragment sequence
GTTCAGTGGCATGCCCAGGATAAGCAAATTGGGATCTGGAAATGATTTTGAGGTgtCTTC
CAACGACTTGGAATTGCTTCAGGCAGAGCACGGTATACTAAAAATTGGGAAACAAACAAA
TTCAGCGGCTATCCACTGTATCACAGTGTCTATGAAACATATGAGTTGGTGGAAAAGTTT
TATGATCCAATGTTTAAATATCACCTCACTGTGGCCCAGGTTCGAGGAGGGATGGTGTTT
GAGCTAGCCAATTCCATAGTGCTCCCTTTTGATTGTCGAGATTATGCTGTAGTTTTAAGA
AAGTATGCTGACAAAATCTACAGTATTTCTATGAAACATCCACAGGAAATGAAGACATAC
AGTGTATCATTTGATTCACTTTTTTCTGCAGTAAAGAATTTTACAGAAATTGCTTCCAAG
TTCAGTGAGAGACTCCAGGACTTTGACAAAAGCAACCCAATAGTATTAAGAATGATGAAT
GATCAACTCATGTTTCTGGAAAGAGCATTTATTGATCCATTAGGGTTACCAGACAGGCCT
TTTTATAGGCATGTCATCTATGCTCCAAGCAGCCACAACAAGTATGCAGGGGAGTCATTC
CCAGGAATTTATGATGCTCTGTTTGATATTGAAAGCAAAGTGGACCCTTCCAAGGCCTGG
GGAGAAGTGAAGAGACAGATTTATGTTGCAGCCTTCACAGTGCAGGCAGcTGCaGAGACT
TTGAGTGAAGTAGCCATTGAAGGCCGC
Related Documents