1

1. Inequality and poor quality in South African education 2.
Dec 13, 2015
Welcome message from author
This document is posted to help you gain knowledge. Please leave a comment to let me know what you think about it! Share it to your friends and learn new things together.
Transcript

1

Inequality and poor quality in South African education
2

What would you like to be when you grow up?
3

Lawyer
4
• Teacher• Policeman
• Doctor
• President
• Astronaut

5
‘(Still) just hewers of wood and drawers of water?’

6
Quantity vs Quality in educational achievement in matric in the Western Cape
The Matric performance of the Province’s 352 public secondary schools can be thought of as being like a three-layered cake.

7
The 160 odd exHOR schools are the ‘filling in the middle’ with varying achievement levels – around a quarter of the learners fail Matric. And in key subjects, the ‘filling’ has collapsed into the base.
The 60-odd exDET schools represent a thick base of severe under-achievement – around half the learners in these schools fail Matric.
The 120 odd exCED schools are the thick icing on the achievement cake here almost no-one fails Matric.
Mathematics & Physical Sciences

STATEMENT OF THE PROBLEMUnder-achievement in mathematics and physical sciences is now endemic in the majority of schools outside of the exCED sector here in the Western Cape.
In 2008, in both exDET and exHOR schools, the chances of a learner achieving a 50%+ pass in both mathematics and physical sciences was around 1:30.
‘The opportunity index’
Compared to in an exCED school, where a learner’s chance was 1:5 (i.e. 6 times greater).

9
POPULATION1991 329 000
2011 525 000?
STATE SCHOOLING: 29 Preprimary (pre-Grade R – R)30 Primary (Grades R - 7)
5 Intermediate (Grades R – 9)20 Secondary (Grades 8 – 12)
3 LSEN (‘Special Needs’)
Just under 56 000 learners were registered in Grades 1 - 12 in State educational institutions in Khayelitsha in 2011.
Schooling in Khayelitsha

10
Matric results: 2007 - 2010

11
In 2010, the pass rate in Khayelitsha stood at 50,3%; in the Eastern Cape it stood at 58,3%.

12
2007 2008 2009 2010Schools with pass rates lower than 60%
6 9 14 13

13
In 2009, 1 245 students wrote maths literacy, and ¾ (75%) passed. However, what was the quality of these passes?

14
In 2009, only 22 candidates out of the 1,245 who wrote maths literacy scored 70% or higher...

15
250 B (i.e. university entrance) passes 8,5% of candidates
2009 matric results – just over 50% pass rate

But in 2009…
Grade 12 Maths & Physical Sciences candidates
Grade 12 Maths & Physical Sciences passes at the 50% plus level
Only 26 out of 1,283 matriculants who passed in Khayelitsha obtained 50%+ passes in both mathematics & physical sciences
This is 1:50!

17
In 2009, 1 in 50 matriculants who passed, passed both mathematics &
physical sciences at 50%+ level.
18
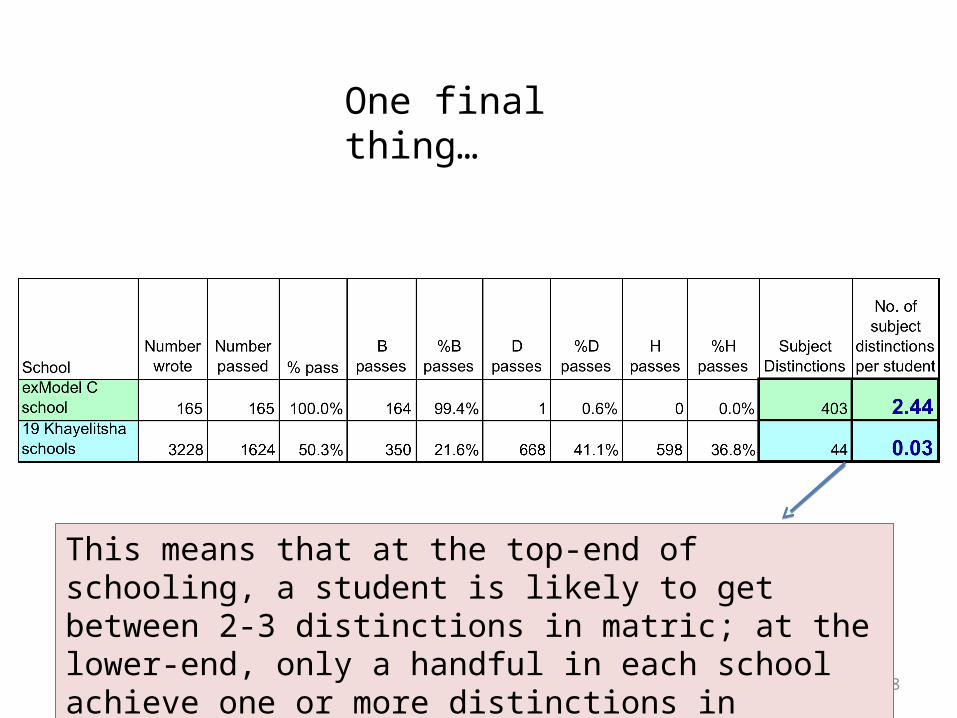
This means that at the top-end of schooling, a student is likely to get between 2-3 distinctions in matric; at the lower-end, only a handful in each school achieve one or more distinctions in matric.
One final thing…

19
Verwoerd’s legacy…
Number wrote
Number passed
Subject distinctions
1 exModel C school 165 165 403
19 Khayelitsha schools 3228 1624 44

20
“Quantity, quantity, everywhere…. but not a quality drop to drink!”
‘On the playing field of life there is nothing more important than the quality of education…’
President Zuma, 2011
Related Documents