of public policies in the European Union: what happens with enlargement? 2. Inequalities, Employment and Income Convergence: Evidence from Regional Data Papers by: 1. Figari, Paulus, and Sutherland (FPS) 2. Galbraith and Garcilazo (GG) Comments by: Lars Osberg Economics, Dalhousie University

1. Income inequality and the effect of public policies in the European Union: what happens with enlargement? 2. Inequalities, Employment and Income Convergence:
Dec 27, 2015
Welcome message from author
This document is posted to help you gain knowledge. Please leave a comment to let me know what you think about it! Share it to your friends and learn new things together.
Transcript
1. Income inequality and the effect of public policies in the European Union: what happens with enlargement?2. Inequalities, Employment and Income Convergence: Evidence from Regional Data
Papers by:1. Figari, Paulus, and Sutherland (FPS)2. Galbraith and Garcilazo (GG)
Comments by: Lars Osberg Economics, Dalhousie University
Common Focus: Determinants of Inequality within the European Union
FPS: impacts of tax/transfer policy on inequality & relative poverty EU15→EU19
GG: pay inequality (within/between regions) & unemployment rates for 187 European Regions 1984-2003.
Motivating Concern: “Social Cohesion” & Inequality in a possibly fragile federation A shared problem of EU, Canada & others
Quibble: both papers have rhetoric of “social cohesion” but only data is income inequality
Is it vertical or horizontal equity that matters more for a sense of common citizenship?

FPS: Income inequality and the effect of public policies in the European Union: what happens with enlargement?
15 pre-2004 EU states plus Estonia, Hungary, Poland and Slovenia
Methodology: EUROMOD static micro-simulation
model direct taxes, social contributions, cash
benefits simulated in a comparable way using tax-benefit rules in place + info in survey datasets
Income Concept & Measurement
Pre-Tax Income[1] “market income” = pre-tax gross earnings (not
including employer social insurance contributions) + self-employment income + capital income + private pensions & transfers
[2] “market income plus public pensions”
Adjustments modified OECD equivalence scale top and bottom coded/truncated Eurostat PPP indexes for GDP
5% confidence intervals - nonparametric bootstrap. 1000 for each country & 250 for EU
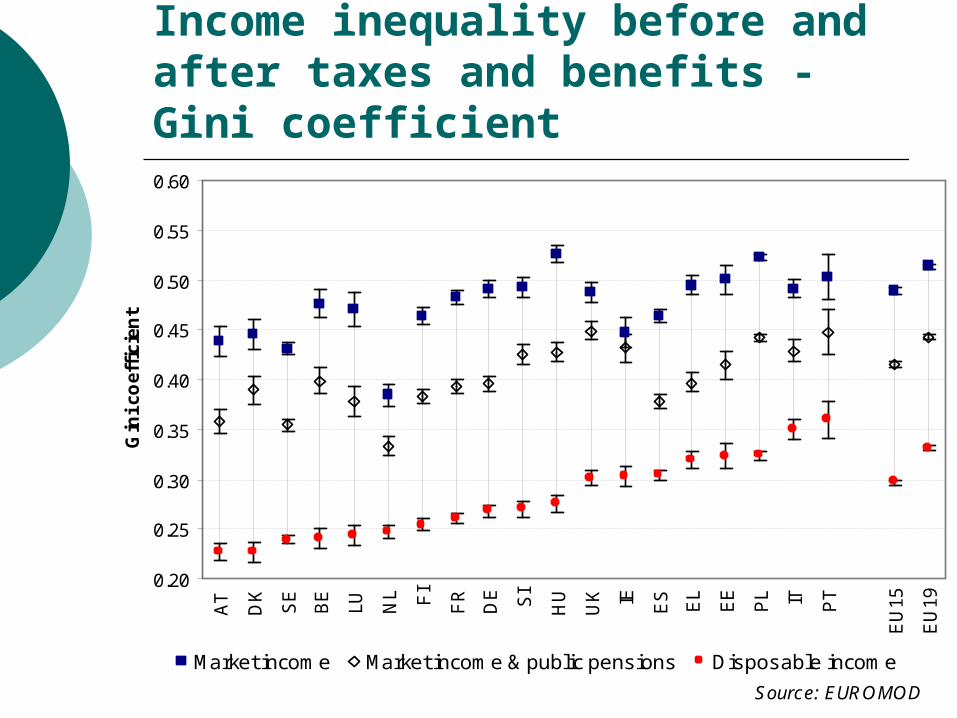
Income inequality before and after taxes and benefits - Gini coefficient
Source: EUROMOD
0.20
0.25
0.30
0.35
0.40
0.45
0.50
0.55
0.60
AT
DK
SE
BE
LU NL FI
FR
DE SI
HU
UK IE ES EL
EE
PL IT PT
EU
15
EU
19
Gin
i co
effi
cien
t
Market income Market income & public pensions Disposable income
Diversity within the EU
Public pensions play widely varying role in reducing inequality
Tax/transfer systems Reduce inequality to differing degrees
Netherlands, Southern European, Estonia & Anglo-Saxon redistribute the least
Change inequality ordering
EU-15:Gini (market income→PDI) = 0.50 → 0.30 inequality reduced by 39%
EU-19:Gini (market income→PDI) = 0.52 → 0.33 inequality reduced by 35%
Did enlargement imply a “big” change?
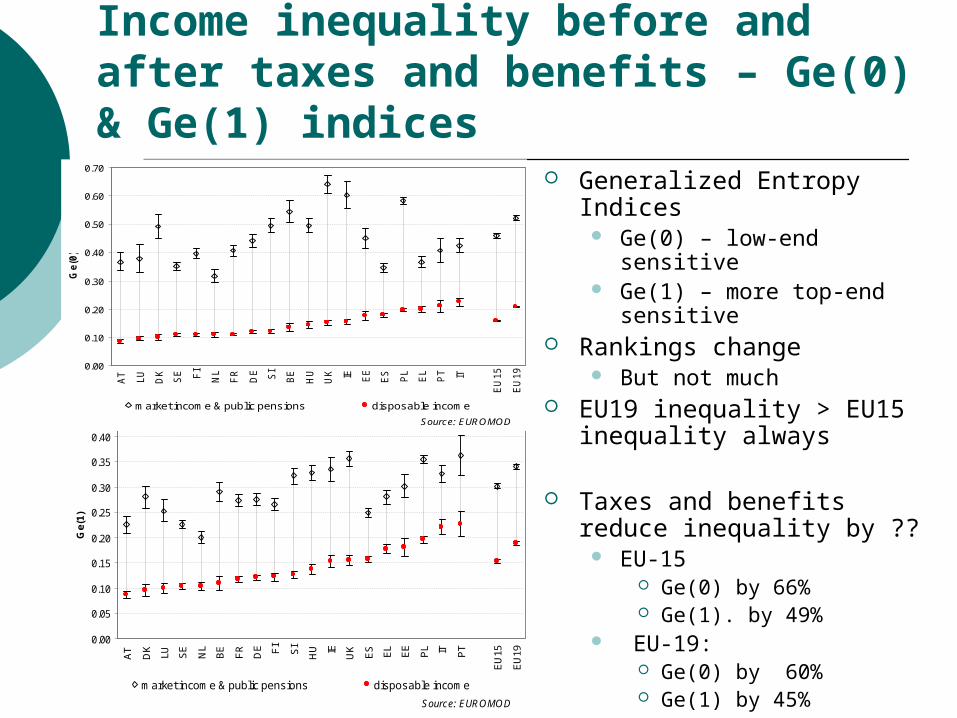
Income inequality before and after taxes and benefits – Ge(0) & Ge(1) indices
Generalized Entropy Indices Ge(0) – low-end sensitive Ge(1) – more top-end
sensitive Rankings change
But not much EU19 inequality > EU15
inequality always
Taxes and benefits reduce inequality by ??
EU-15 Ge(0) by 66% Ge(1). by 49%
EU-19: Ge(0) by 60% Ge(1) by 45%
Source: EUROMOD
0.00
0.05
0.10
0.15
0.20
0.25
0.30
0.35
0.40
0.45
AT
DK
LU SE
NL
BE
FR
DE FI
SI
HU IE UK
ES EL
EE
PL IT PT
EU
15
EU
19
Ge(
1)
market income & public pensions disposable income
Source: EUROMOD
0.00
0.10
0.20
0.30
0.40
0.50
0.60
0.70
AT
LU
DK
SE FI
NL
FR
DE SI
BE
HU
UK IE EE
ES
PL
EL
PT IT
EU
15
EU
19
Ge(0
)
market income & public pensions disposable income

SensitivitiesGINI
DPI
EU15 Euro 0.31
EU 15 PPP 0.3
EU19 -Euro 0.36
EU19 -PPP 0.33
Top & Bottom coding make little difference Equivalence scale
Income per capita or OECD ? – slightly less decrease in Gini
Inequality Decomposition
EU-15 Essentially all of EU15 inequality in
market income + public pensions explained within countries
EU-19 More (2-14%) of total EU19 inequality
explained by inequality between countries

Which tax and benefit components make a difference?
Household income composition: whole population
Source: EUROMOD
-80
-60
-40
-20
0
20
40
60
80
100
120
140
160
180
200P
L
EE
HU
PT SI
EL
ES IT FR FI
DE
UK
SE
BE
DK
AT
NL IE LU
EU
15
EU
19
% o
f d
isp
osab
le in
co
me
market income personal taxes
social insurance contributions public pensionsmeans-tested benefits non means-tested benefits
A buried gem!
“Overall, market income at 100% of disposable income in Figure 4a means that direct taxes and cash benefits balance each other” Implication: the consumptive activities
of the state are entirely financed by indirect taxation
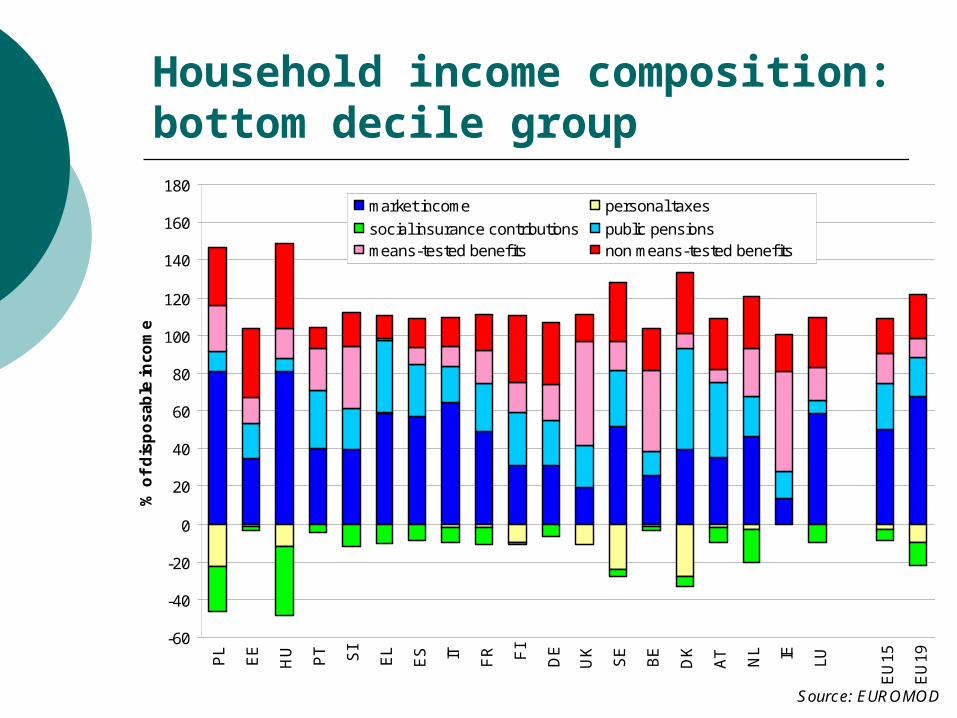
Household income composition: bottom decile group
Source: EUROMOD
-60
-40
-20
0
20
40
60
80
100
120
140
160
180
PL
EE
HU PT SI
EL
ES IT FR FI
DE
UK
SE
BE
DK
AT NL IE LU
EU
15
EU
19
% o
f d
isp
osa
ble
inco
me
market income personal taxes
social insurance contributions public pensionsmeans-tested benefits non means-tested benefits

“Similar” individuals are not treated “similarly” by the state in EU nations.
Does horizontal equity matter for a sense of common citizenship in a European polity? “Similar” treatment does NOT require
identical treatment Net Fiscal Residuum similar? “reasonably comparable levels of public
services at reasonably comparable levels of taxation”
36(2) Constitution Act of Canada, 1982

Income poverty rates - Before & after taxes and benefits (Poverty line = 60% of national median equivalised household income)
Source: EUROMOD
5%
10%
15%
20%
25%
30%
35%
40%
45%LU D
K
AT
BE
FR
SE
NL FI
DE
HU
UK SI
PL
EE
ES
EL IT PT IE
EU
15
EU
19
Excl. all benefits(except public pensions) Excl. means-tested benefits
Excl. non means-tested benefits Disposable income

Means tested benefits often target poverty gap – but to differing degrees!
% Change in Poverty due to Means Tested Programs
0.0%
10.0%
20.0%
30.0%
40.0%
50.0%
60.0%
70.0%
80.0%
90.0%
Rate FGT(0)
Intensity FGT(1)

Comments (LO) FPS recognize “rules ≠ reality”
Nontake-up of benefits, evasion of taxes imply EUROMOD = idealized picture
UK & other Anglo nations Big news 1980+ is the exploding share of top 1% Survey based micro-data can only track trends
among ‘the middle 90%’ Can social cohesion survive the increasingly
conspicuous consumption of the top 1% ?
Quantitative impact & sociological impact? ‘Social Cohesion’ & quantitatively small stereotypes Addition of small, poor nations cannot move
aggregate stats much – but can affect politics
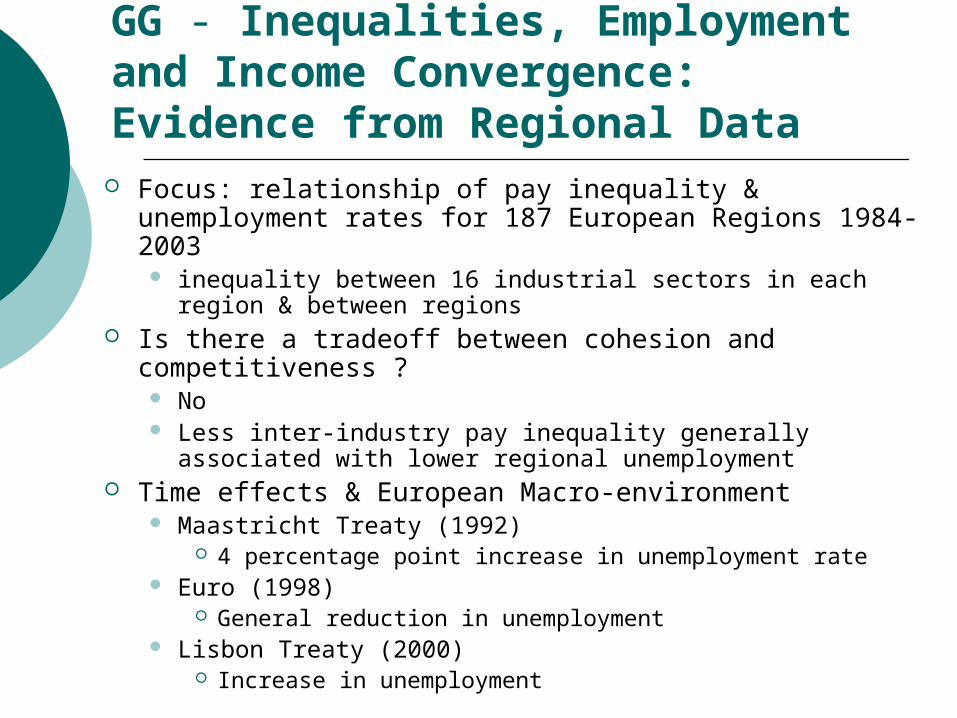
GG - Inequalities, Employment and Income Convergence: Evidence from Regional Data
Focus: relationship of pay inequality & unemployment rates for 187 European Regions 1984-2003 inequality between 16 industrial sectors in each region &
between regions Is there a tradeoff between cohesion and
competitiveness ? No Less inter-industry pay inequality generally associated with
lower regional unemployment Time effects & European Macro-environment
Maastricht Treaty (1992) 4 percentage point increase in unemployment rate
Euro (1998) General reduction in unemployment
Lisbon Treaty (2000) Increase in unemployment

Methodology: Theil Decomposition
Time series payroll data 1984-2003 Wages & Employment
LO: FT or PT? Time period? Wage Concept ?
16 Industries in 187 regions Theil’s entropy measure decomposed into:
Between sectors, within region component Between region component
Contribute to inequality ‘from below’ or ‘from above’?
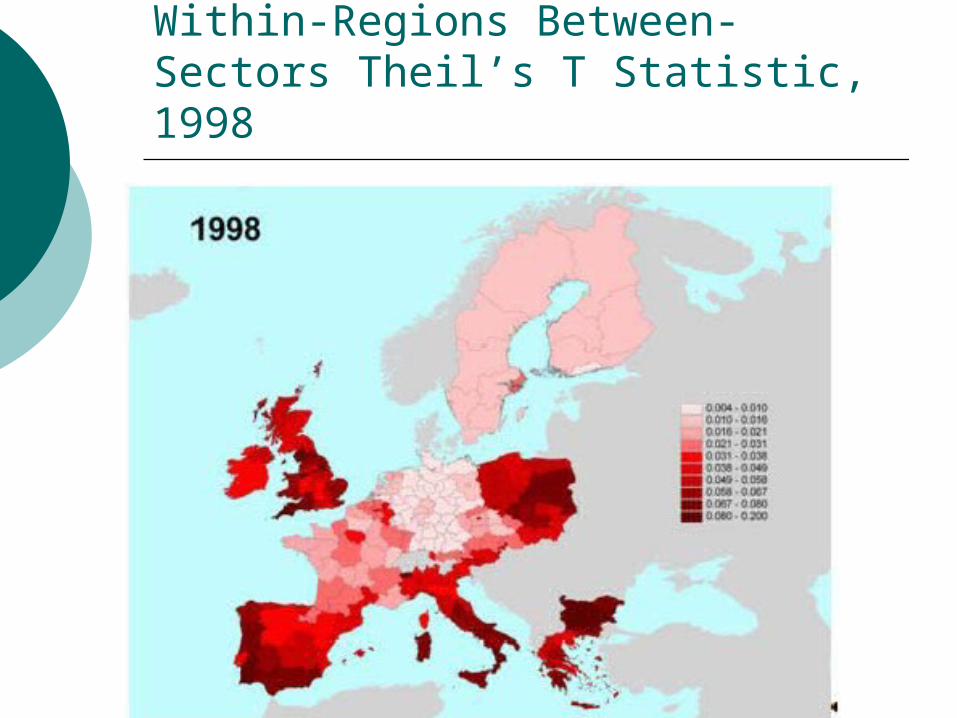
Within-Regions Between-Sectors Theil’s T Statistic, 1998
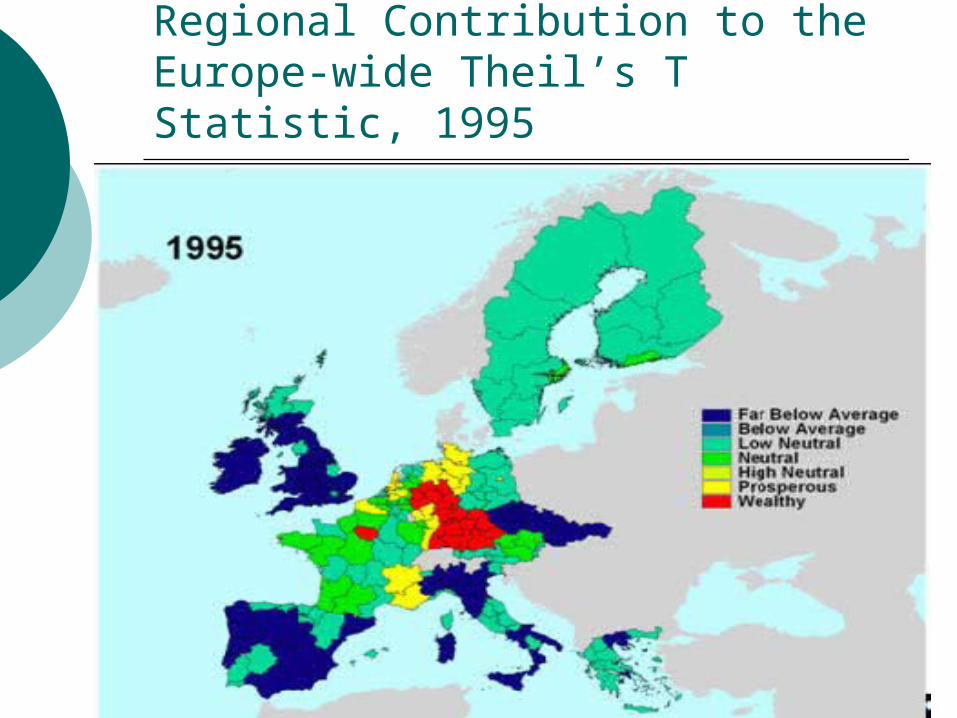
Regional Contribution to the Europe-wide Theil’s T Statistic, 1995
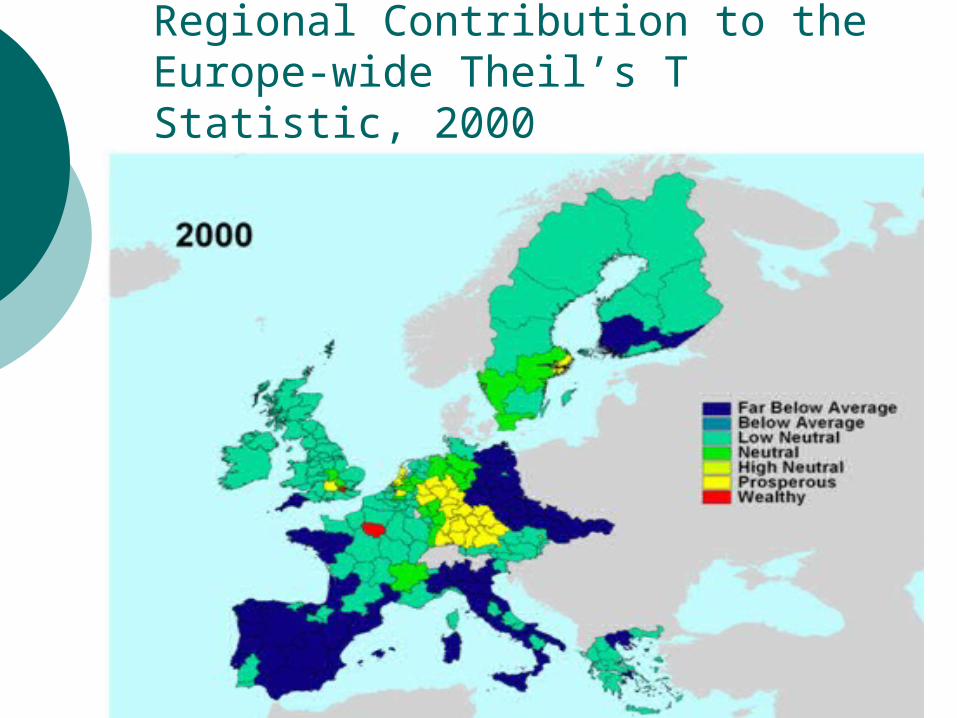
Regional Contribution to the Europe-wide Theil’s T Statistic, 2000
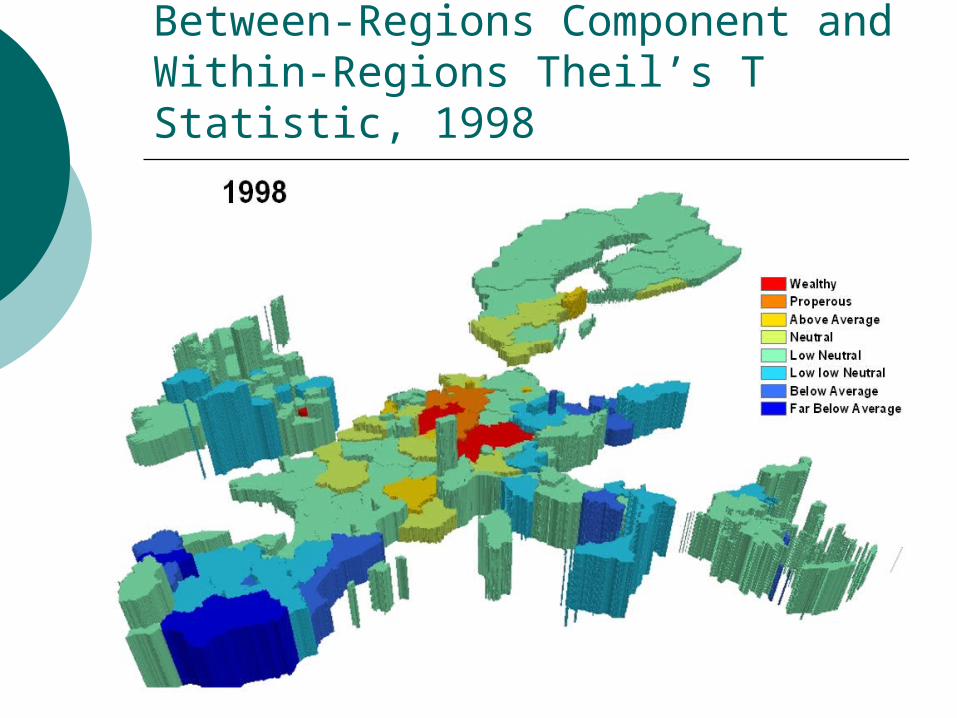
Between-Regions Component and Within-Regions Theil’s T Statistic, 1998
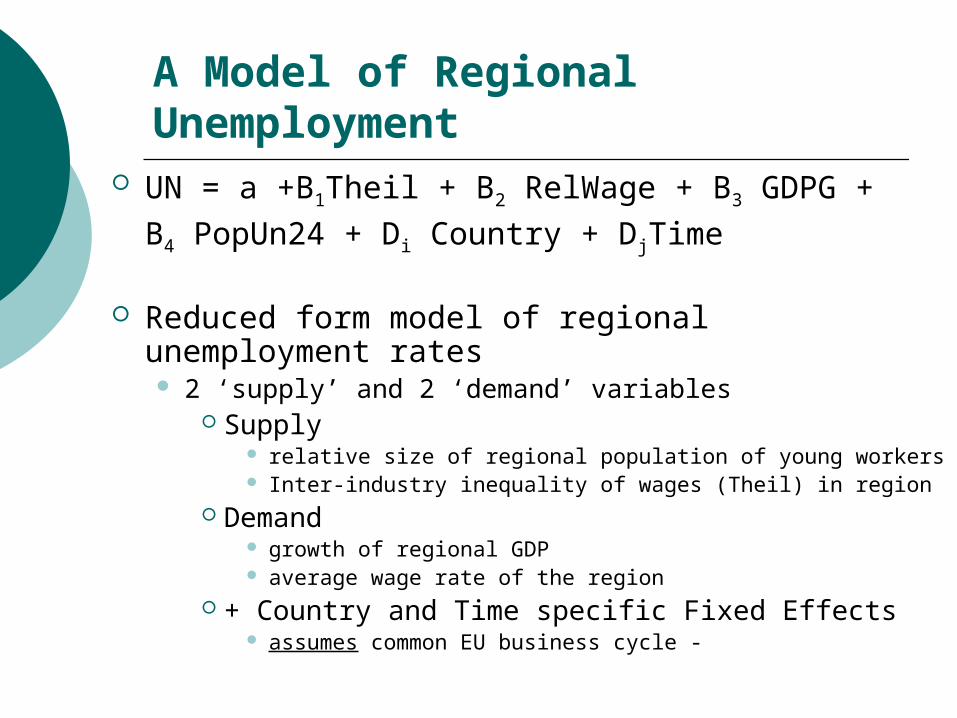
A Model of Regional Unemployment UN = a +B1Theil + B2 RelWage + B3 GDPG +
B4 PopUn24 + Di Country + DjTime
Reduced form model of regional unemployment rates 2 ‘supply’ and 2 ‘demand’ variables
Supply relative size of regional population of young workers Inter-industry inequality of wages (Theil) in region
Demand growth of regional GDP average wage rate of the region
+ Country and Time specific Fixed Effects assumes common EU business cycle -

Coefficient Estimates: Linear Model - (1984-2003)
Relative regional wage rate not significant More inequality between industry wages – more unemployment
tot_un Beta P>|t| Beta P>|t| Beta P>|t| Beta P>|t| Beta P>|t|wn_theil 4.326 0.002 3.806 0.002 7.207 0.000 12.168 0.000 3.994 0.001
pop24 54.715 0.000 48.115 0.000 72.367 0.000 103.683 0.000 38.898 0.000relwage -0.084 0.077 -0.025 0.615 -0.079 0.276 -0.250 0.110 -0.031 0.444g_gdp -10.255 0.000 -10.654 0.000 -7.507 0.003 -15.870 0.000 -8.863 0.000
constant -8.588 0.000 -8.696 0.000 -11.736 0.000 -10.881 0.000 -6.246 0.000R^2
N 1834 1824 1829 1791 1833
Model 1 Model 2 Model 3 Model 4 Model 5ElderlyMale
0.5695 0.568 0.5994 0.603 0.5356
Total Female Youth
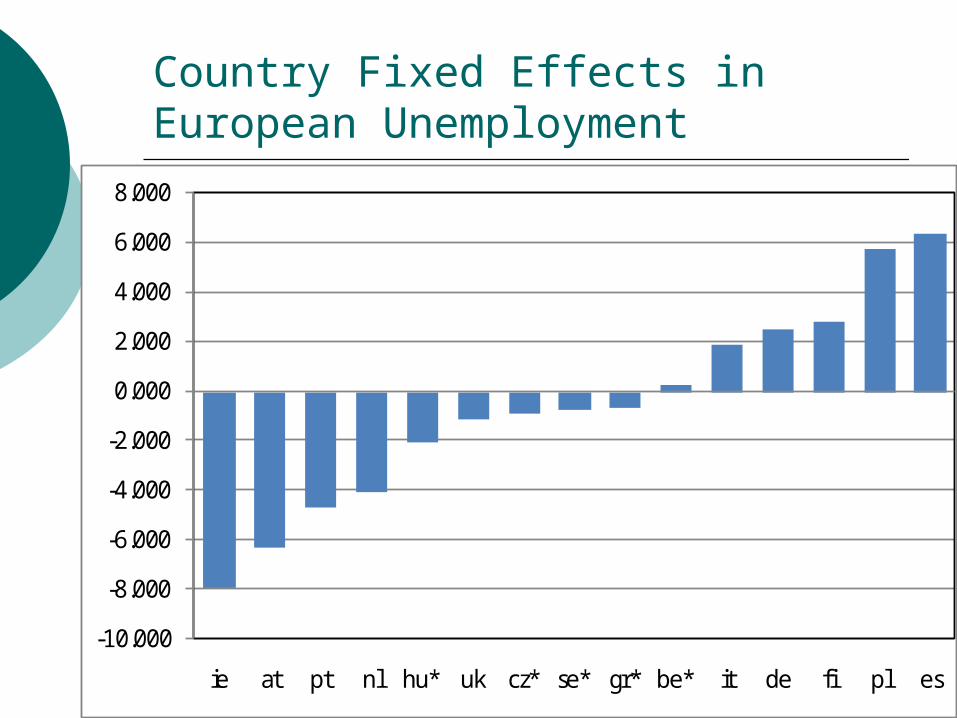
Country Fixed Effects in European Unemployment
-10.000
-8.000
-6.000
-4.000
-2.000
0.000
2.000
4.000
6.000
8.000
ie at pt nl hu* uk cz* se* gr* be* it de fi pl es

Time Fixed Effects in European Unemployment
-6.000
-4.000
-2.000
0.000
2.000
4.000
6.000
Un
em
plo
ymen
t
Years
Total Male Female <25 Yrs >25 Yrs
Single European Act
Maastrich Treaty
Euro
Lisbon Treaty

GG Conclusions: “ Positive impact of pay inequality on
unemployment suggests that promoting cohesion in the structure of pay in lagging regions could lead to a catching-up process leading to territorial cohesion”
Counter to argument that “pay flexibility’ is needed
Specific Suggestions: “raising minimum wages, targeting industrial
development policies in poor areas, active labor market polices for the unemployed, policies to improve workers’ skills such as on-the-job training, adult education, and assistance programs for people at the bottom”
“expanding university enrollments is perhaps the proven effective route to reducing youth unemployment”
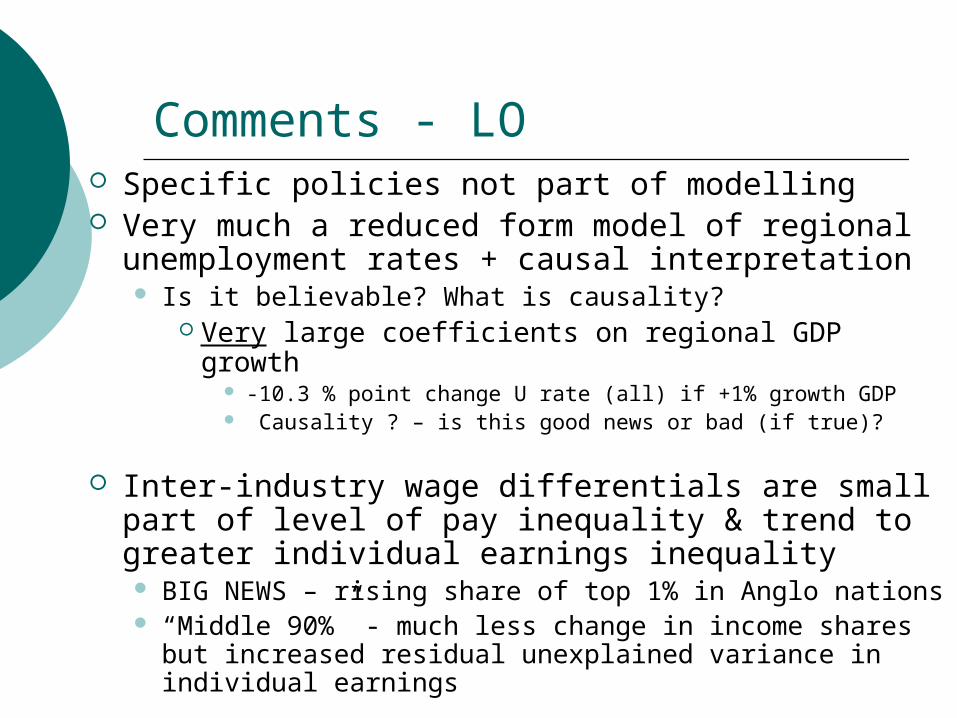
Comments - LO Specific policies not part of modelling Very much a reduced form model of regional
unemployment rates + causal interpretation Is it believable? What is causality?
Very large coefficients on regional GDP growth -10.3 % point change U rate (all) if +1% growth GDP Causality ? – is this good news or bad (if true)?
Inter-industry wage differentials are small part of level of pay inequality & trend to greater individual earnings inequality BIG NEWS – rising share of top 1% in Anglo nations “Middle 90%” - much less change in income shares but
increased residual unexplained variance in individual earnings
Related Documents