Naval Research Laboratory 0ontemy, CA 93943-5502 NRUIPU/7541-92-O01 AD-A277 993 Forecasters Handbook for the Philippine Islands and Surrounding Waters DTIC Am ELECTE APR 1 1 1994 FORREST R. WnimS AND GLENN H. JuNe 0 Department of Meteorology Naval Postgraduate School. Monterey, CA 93943-5000 RONALD E. ENGLEE;RmoN Science Applications International Corporation Monterey, CA 93940 Prepared for: Forecast Support Branch Marine Meteorology Division December 1993 pT-IC Qt-A44.Li 1 '~)~ Approved for public release: distribution unlimited. 4"(94-10813 '40 1 iHI|IB1 - 4 4 8 0 16

Welcome message from author
This document is posted to help you gain knowledge. Please leave a comment to let me know what you think about it! Share it to your friends and learn new things together.
Transcript
Naval Research Laboratory0ontemy, CA 93943-5502
NRUIPU/7541-92-O01
AD-A277 993
Forecasters Handbook for the PhilippineIslands and Surrounding Waters
DTICAm ELECTE
APR 1 1 1994
FORREST R. WnimS AND GLENN H. JuNe 0Department of MeteorologyNaval Postgraduate School.Monterey, CA 93943-5000
RONALD E. ENGLEE;RmoN
Science Applications International CorporationMonterey, CA 93940
Prepared for:Forecast Support BranchMarine Meteorology Division
December 1993
pT-IC Qt-A44.Li 1 '~)~
Approved for public release: distribution unlimited.
4"(94-10813 '401 iHI|IB1 - 4 4 8 0 16
r Fcm AAPFiV~dREPORT DOCUMENTATION PAGE 011SA(. 0704-188I"maim f uW r in~m anews sim i h"SuuA a aniaui wS awsp mi f ow mammwL ekiiq "ine ow mowo i19 a- SW1 QW.kVWVM do 8"a 9N 1W4
umfnmaMi.u m, a.w"#AVMVas- ,I 4000watef swewo SWVt~rV a"11 "oomwMW b.u.. 0 W Vw HemeawiS 5So". OmD.waottu tiSWft Osw~a~ aiW A~.M jai S smm 00m iopV w" &ftla. Ambow VA =202 -4 &Wl uaanw" ad smog"psa. o P A RdsiP"ugMaf7"4441r. W@"Wnp OCa20m0
rAgency Use Only (Leaew bW*n). L. Report Date. 3. Report Type and Data* CoveedIDecember 1993 Final ____________
4.1Title and Subtitle. Fudn Numbers
Forecasters Handbook for the Philippine Islands PE O&M,Nand Surrounding Waters AN DN656794
6. Author(s).
Forrest R. Williams, Glenn H. Jung, Ronald E. Englebretson*k
7. Performing Organization Name(s) and Addrose(es). .Performing Organization
Naval Postgraduate School Reor laimber.
Department of MeteorologyMonterey, CA 93943-5000
9. Sponeoring~Monitoring Agency Name~s) and Addrsesa(es). 10 pe qrigmoniong Agency
Naval Oceanography Conmmand, Stennis Space Center, MS PofNiurabs.
39529-5000; Naval Research Laboratory, Marine Meteorology NRL/PU/7541--92-0001Division, Monterey, CA 93943-5502; Naval PostgraduateSchool, Monterey, CA 93943-5000
11. Supplemnentary Notes
NRL Monterey monitor: Dennis C. Perryman, Forecast Support Branch, code 7541.*Third author affiliation: Science Applications International Corp., Monterey CA 93940
7 MoibuoW~eftMty tatmem12b. Distribution Code.
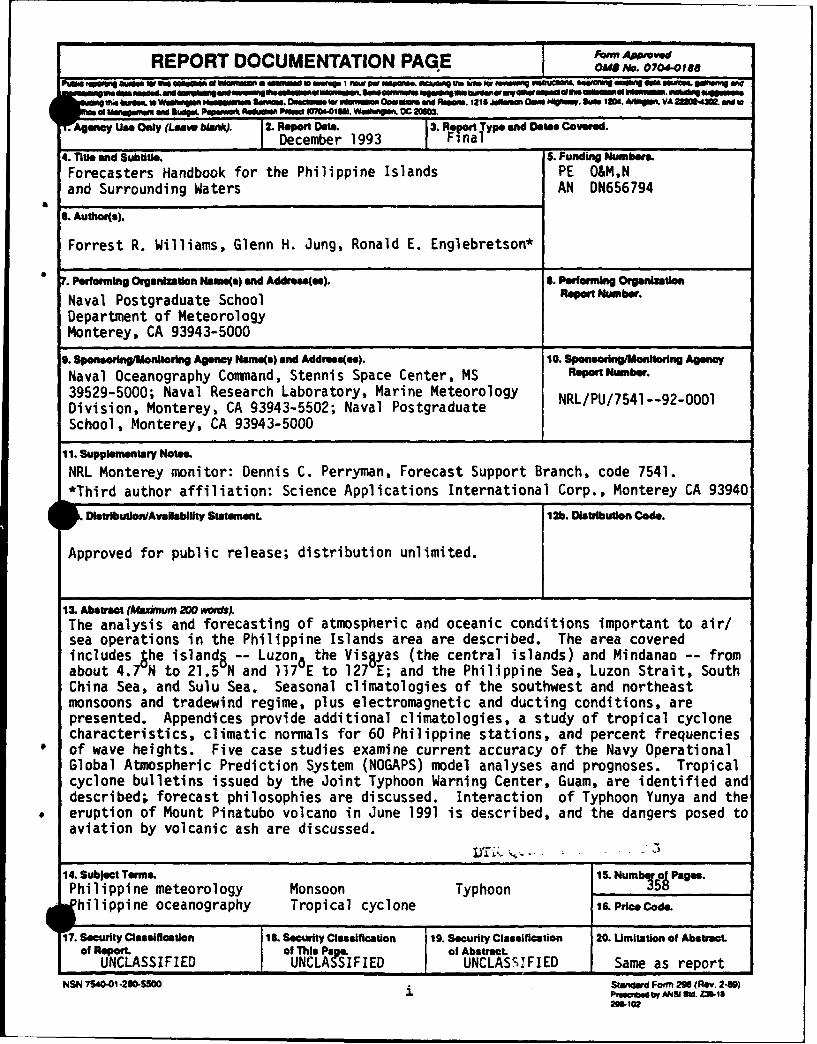
13. Abstract (Maxb'nm 200 wrts).The analysis and forecasting of atmospheric and oceanic conditions important to air/sea operations in the Philippine Islands area are described. The area coveredincludes Vhe islanda -- Luzon 6 the Visgyas (the central islands) and Mindanao -- fromabout 4.7 N to 21.5 N and 117 E to 127 E; and the Philippine Sea, Luzon Strait, SouthChina Sea, and Sulu Sea. Seasonal climatologies of the southwest and northeastmonsoons and tradewind regime, plus electromagnetic and ducting conditions, arepresented. Appendices provide additional climatologies, a study of tropical cyclonecharacteristics, climatic normals for 60 Philippine stations, and percent frequencies
* of wave heights. Five case studies examine current accuracy of the Navy OperationalGlobal Atmospheric Prediction System (NOGAPS) model analyses and prognoses. Tropicalcyclone bulletins issued by the Joint Typhoon Warning Center, Guam, are identified anddescribed; forecast philosophies are discussed. Interaction of Typhoon Yunya and the
* eruption of Mount Pinatubo volcano in June 1991 is described, and the dangers posed toaviation by volcanic ash are discussed.
~ 0
14. Subject Terms. IS. Numb% cPages.Philippine meteorology Monsoon Typhoonhilippine oceanography Tropical cyclone I&.Price Code.
17. Security Classification 18. Security Classification 19. security Ciassiflcation 20. Limitation of Abstract.of Report. of This Page. of Abstract.
UNCLASSIFIED UNCLAS~SIF IED UNCLASSIFIED ISame as reportNSN 754001 .260.500 jSumards Fatm 298 (Rev. 2-89)
Pim-mIlby ANSI Sid. Z3S.18

* Contents
Foreword ......... ..................................... vPreface ......... ...................................... viiAcinowledgments ......................................... viiiRecord of Changes ......... ................................ ix
1 The Philippine Islands 1-11.1 General Introduction ........ ............................... 1-11.2 Philippine Geography and Topography ........................... 1-21.3 Meteorological Stations of the Philippine Islands ................... 1-4
2 Seasonal Climatology 2-12.1 Introduction ......... .................................... 2-12.2 Southwest Monsoon ........ ............................... 2-4
2.2.1 June-November (Months of Heavier Precipitation) ............. 2-72.3 Tropical Cyclones ......................................... 2-10
2.3.1 Introduction ........ ............................... 2-102.3.2 Tropical Cyclone "Thumb Rules" .......................... 2-11
2.4 Northeast Monsoon and the Trade Wind Regime ................... 2-142.4.1 December-May (Months of Lighter Precipitation) ............. 2-17
3 Typhoon (and other) Forecasting 3-13.1 The Danger of Volcanic Ash to Aviation .......................... 3-13.2 JTWC Bulletins ........ ................................. 3-43.3 Forecasting Philosophies .................................... 3-7
3.3.1 Formation ......................................... 3-73.3.2 Movement ......................................... 3-73.3.3 Intensity .......................................... 3-10
3.4 Recent Tropical Cyclones Striking the Philippine Islands ............. 3-143.4.1 Typhoons striking Luzon ....... ........................ 3-143.4.2 . Tropical Storm and Super Typhoon striking Visayas ........... 3-263.4.3 Tropical Cyclones striking Mindanao ....................... 3-33
3.5 Case Studies using NOGAPS ....... .......................... 3-353.5.1 Typhoon Eli, 9-13 July 1992 ...... ...................... 3-363.5.2 Typhoon Bobbie, 23-27 June 1992 ........................ 3-713.5.3 An Atypical Southwest Monsoon Surge, 8-18 August 1992 ...... .3-853.5.4 Southwest Monsoon Surge "Snapshot", 4 September 1992 ...... .3-1153.5.5 Northeast Monsoon Cold Surge, 6-8 February 1992 ............ 3-1223.5.6 Lessons Learned while preparing Case Studies ................ 3-144
11ioo

4 Geological Structure and Physical Oceanography 4-14.1 Geological Structure ............................... 4-14.2 Ocean Parameters ........ ................................ 4-9
4.2.1 Introduction ........ ............................... 4-94.2.2 Ocean Parameters by Region ............................ 4-104.2.2.AWestern Philippine Sea ....... ......................... 4-104.2.2.B South China Sea (northern portion) ........................ 4-494.2.2.C Sulu Sea ......... .................................. 4-644.2.2.DLuzon Strait (Bashi Channel) ............................ 4-764.2.2.E Shallow Seas (between islands) ........................... 4-87
5 Oceanic Aspects of Operational Weather Forecasting 5-15.1 Introduction ......... .................................... 5-15.2 Seasonal and Regional Variations ............................... 5-25.3 Ocean Currents and Associated Fronts ........................... 5-35.4 Marine Planetary Boundary Layer ...... ....................... 5-55.5 Introduction to Electro-Optical and Electromagnetic Conditions ........ 5-5
5.5.1 E-O and the Atmosphere as a Medium .................. 5-55.5.2 Comments on E-O/EM and Atmospheric Interactions .......... 5-75.5.3 High Energy Laser ....... ............................ 5-85.5.4 Forward Looking Infrared ....... ........................ 5-85.5.5 Radar and Microwave ....... .......................... 5-105.5.6 Elevated and/or Surface Based Ducts ..................... 5-105.5.7 Forecast Aids for Elevated and/or Surface Based Ducts ......... 5-12
5.6 Regional Atmospheric Circulation Patterns ........................ 5-165.6.1 Northeast Monsoon ....... ........................... 5-165.6.2 Shear Lines ........ ................................ 5-175.6.3 Tropical Waves (or Waves in the Easterlies) .................. 5-175.6.4 Southwest Monsoon ....... ........................... 5-185.6.5 Cloudiness ........ ................................ 5-195.6.6 Visibility ........ ................................. 5-195.6.7 Thunderstorms ....... .............................. 5-195.6.8 Turbulence ......... ................................ 5-20
5.7 Forecast Aids for Oceanic Areas East of the Philippines .............. 5-205.7.1 Forecasting Movement of Shear Lines ..... ................. 5-205.7.2 Intertropical Convergence Zone .......................... 5-215.7.3 Tropical Waves (or Waves in the Easterlies) .................. 5-21
REFERENCES R-1
APPENDICES
A Comprehensive Ocean-Atmosphere Data Set A-1
B Characteristics of Tropical Cyclones Affecting the PI B-1
C Climatic Normals of the Philippines (1951-1985) C-1
D Percent Frequencies of Wave Heights D-1
iv
FOREWORD
The Forecasters Handbook for the Philippine Islands and Surrounding Waters wasdeveloped under the continuing effort of the Naval Research Laboratory (NRL) Montereyto improve the quality of operational weather forecasting support in all parts of the world.
While several sources address the environment in the vicinity of the Philippine Islands,the purpose of this document is to accumulate and suitably present the most pertinentinformation available for use by Fleet forecasters who are unfamiliar with the region.
Additionally, the handbook includes case studies to examine the analytic and prognosticskill of the current (1992) Navy Operational Global Atmospheric Prediction System (NO-GAPS 3.3) in the vicinity of the Philippine Islands. The NOGAPS products, preparedby Fleet Numerical Oceanography Center (FNOC), Monterey, California, were receivedvia the Navy Oceanographic Data Distribution System (NODDS) software on a personalcomputer, in real time.
It is intended that this document be responsive to current requirements of U. S. Navyoperating forces; therefore, it has been assembled in loose-leaf form. Users are urged tosubmit to this Command their comments and suggestions regarding its contents.
The Forecasters Handbook for the Philippine Islands and Surrounding Waters wasprepared by Adjunct Professor Forrest R. Williams (CDR, USN, retired) of the Meteorol-ogy Department of the Naval Postgraduate School (NPS), Monterey, California, with Dr.Glenn H. Jung, Professor Emeritus of the Oceanography Department, NPS, who wrotethe Geological Structure and Physical Oceanography Section and Ronald E. Englebretsonof Science Applications International Corporation, Monterey, California, who wrote theOceanic Aspects of Operational Weather Forecasting Section. Mr. Dennis Perryman(NRL Monterey) served as Project Coordinator. The project leading to the developmentof this handbook was sponsored by the Naval Postgraduate School, the Naval Oceanogra-phy Command, Stennis Space Center, MS and the Naval Research Laboratory Monterey.
Accesion For
NTIS CRA&IDTIC TABU;,aiinouijced El
.B .. .......... ....SDi~t. ibutioi I
SAvailability Codes
Dit Avail ad Ior
V
PREFACE
This handbook is published to provide meteorological and oceanographic guidance,as well as regional familiarization, to naval personnel embarked in Fleet units or ashoresupporting naval operations in the vicinity of the Philippine Islands, including the SouthChina Sea and the Philippine Sea.
* In the event of limited planning or preparation time prior to operations, it is rec-ommended that the forecaster first read Section 2 "Seasonal Climatology", including therelevant monsoon season, but concentrating on Subsection 2.3 "Tropical Cyclones", regard-less of season. Next read Section 5 which describes electromagnetic conditions includingstandard and anomalous propagation in ducts, plus forecast aids for relevant atmosphericcirculation patterns. Equally important, the forecaster quickly should become familiarwith Subsection 3.2 "JTWC Bulletins" to ensure their accurate interpretation in com-mand tropical cyclone briefings.
Subsection 3.4 describes forecasts and history of certain catastrophic tropical cyclonesduring the last two years, e.g., Super Typhoon Mike (1990) and Tropical Storm Thelma(1991), as well as the interaction of Typhoon Yunya with the eruption of Mount Pinatubo(1991). Subsection 3.5 presents case studies describing the performance of the currentNOGAPS model (3.3) during typhoons, surges in the southwest monsoon and a cold surgeduring the northeast monsoon affecting the Philippine Islands in 1992. Descriptions ofboth atmospheric and oceanographic conditions are included in the analyses and prognosespresented in the case studies.
If possible, Fleet units should acquire the following publications before deployment-(see References for publishers):
1. Climatology of North Pacific Tropical Cyclone Tracks,
2. U.S. Navy Regional Climatic Study of the Central East Asian Coast and AssociatedWaters,
3. Forecaster's Handbook of the Naval Oceanography Command Facility, Cubi Point,PI, and
4. Typhoon Forecasters Handbook (currently, in preparation by NRL Monterey).
Little needs to be said to alert forecasters to the potential threat of tropical cyclones.Both East and West have witnessed the destructive power demonstrated in 1992 by Hurri-canes Andrew and Iniki and Typhoon Omar. A subsection describing aviation forecastingin the vicinity of volcanic ash plumes is also included.
vii
ACKNOWLEDGMENTS
A very special thanks to Lt. Col. Charles Guard, USAF, Director of the Joint TyphoonWarning Center (JTWC) for both his advice and his detailed review of the handbook.Thanks also to LCDR Nicholas Gural, USN, and especially to Mr. Frank Wells, whobriefed the author on the operations of JTWC and provided DMSP transparencies.
Sincere appreciation is extended to CDR William Johnson, USN, Commanding Offi-cer, Naval Oceanography Command Facility, Cubi Point for his hospitality and assistanceduring the author's visit to the Philippine Islands. Thanks to ENS Scott Oswalt, USN,who provided photographs of the Mount Pinatubo eruption, and to AGC Stephen Smith,USN, and Mr. Silverio Torio, who answered weekly queries by phone. Thanks also to Lt.Col. James Woessner, of Detachment 5, 20th Weather Squadron, Clark AB, RP.
Appreciation is extended to Dr. Roman Kintanar, Director of the Philippine Atmo-spheric, Geophysical and Astronomical Services Administration for provision of the clima-tological normals for 60 Philippine weather observing stations.
The case studies could not have been prepared without the continuous, reliable modelruns and transmissions from Fleet Numerical Oceanography Center, Monterey, CA. Thanksto the staff and especially to Mr. Ralph Loveless who advised on the use of NODDS.Thanks also to the Naval Oceanographic Office, Stennis Space Center, MS for supplyingthe chart depicting the bathymetry surrounding the Philippine Islands.
Appreciation is also extended to Dr. Mark Lander, University of Guam and to Dr.Johnny Chan, City Polytechnic of Hong Kong for sharing their expertise.
Thanks also to Meteorology Department personnel at NPS: Professors Robert Renard,Robert Haney, Carlyle Wash and Philip Durkee for their assistance and encouragement;Jim Cowie for his continual assistance in the maintenance of computer hardware andsoftware; Dr. Jeng-Ming Chen for programming assistance; Professor Russell Elsberry,Professor Chih-Pei Chang, LCDR Lester Carr, USN, and LCDR George Dunnavan, USN,for sharing their tropical expertise; Professor Wendell Nuss for assistance in plotting pro-grams; and Russell Schwanz, Ben Borelli, Sandy Huddleston, Penny Jones, Mark Bootheand David Woody for their assistance and genuine interest in the project.
Thanks to Dennis Perryman and LT Richard Jeffries, USN, of NRL Monterey and toKenneth Richards, Science Applications International Corporations, Monterey, Californiafor proofreading the handbook. Finally, last but not least, a sincere thanks to the NavalPostgraduate School and the Naval Oceanography Command for funding the project.
viii

RECORD OF CHANGES
* Change Date of Date Page E B NoteNumber Change Entered Number t By Notes
ix

a
1. THE PHILIPPINE ISLANDS
1.1 General Introduction
This handbook describes the analysis and forecasting of atmospheric conditions importantto air/sea operations near the Philippine Islands. Following the presentation of geographyand topography in this section, Section 2 presents seasonal climatologies for the Philip-pine Islands. Case studies for respective seasons, using Navy products, are presented inSection 3, while oceanographic and geological aspects are presented in Sections 4 and 5.Finally, a variety of appendixes, presenting relevant climatologies from unique sources,serves to make the handbook a self-sufficient document.
While the vulnerability of the Philippines to tropical cyclones is universally appreciated,* the last decade of the twentieth century has commenced with a variety of natural disasters.
In 1990, a deadly earthquake struck the mountains of northern Luzon. The eruption ofMount Pinatubo in June 1991 wreaked added destruction to the island of Luzon, forcingthe closure of Clark Air Base and threatening the globe with debris carried for monthsin the stratosphere. In November 1991, Tropical Storm Thelma-despite its unimpressivesatellite signature-made landfall in the central Philippines causing flooding that killed anestimated 6000 people on the island of Leyte.
Improved computer programming, better satellite imagery and interactive graphicstechniques are curreLtly providing operational forecasters with better tools for performingtheir tasks. Additionally, it is likely that tropical cyclone (TC) research, as described byElsberry et al. (1987) and elsewhere, will provide improved TC forecasting techniquesin the near future. However, this handbook will emphasize the effects on the PhilippineIslands (PI) of the alternating monsoons. During much of the Northern Hemisphere sum-mer, the southwest1 monsoon dominates over the PI in the lower troposphere. While thenortheast monsoon dominates during the Northern Hemisphere winter. Intrinsically in-cluded within this discussion will be the attendant reversal of the upper-level flow, as wellas the embedded tropical cyclones and air-mass surges.
I Meteorological convention dictates that wind direction is the direction from which the wind is blowing,i.e., southwest winds blow from the southwest (toward the northeast).
1-1
1.2 Philippine Geography and Topography
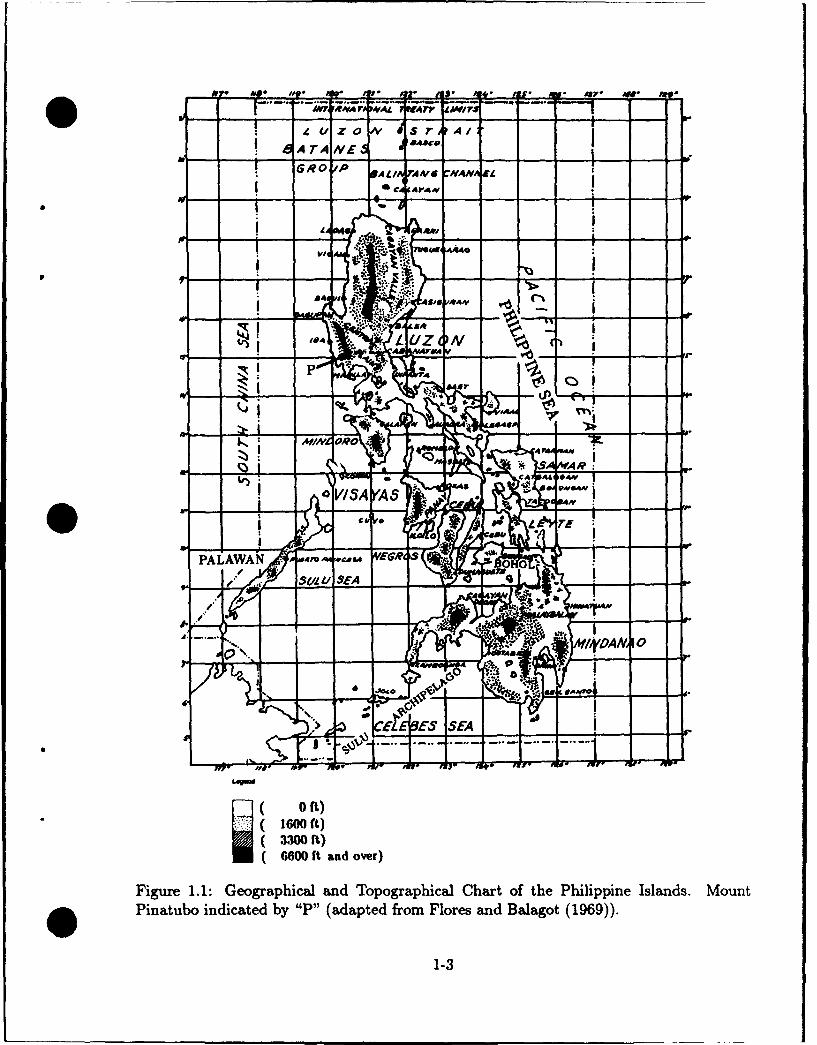
A knowledge of the geography and topography of the Philippines assists in the under-standing of climatology, as well as atmospheric or oceanographic processes. The PhilippineIslands are located in the western North Pacific Ocean, just off the southeastern portion ofthe Asian continent. Lying in a near north to south orientation, the islands extend fromabout 4.7°N to 21.5°N and 117°E to 127°E (Fig. 1.1). The Philippines consist of morethan 7,000 islands, having an area of about 300,000 km 2 (90,000 nm2). The islands aregrouped into three regions: the Luzon Region in the north (composed of Luzon Islandand small islands in its vicinity); the Visayas Region (composed of many islands nearthe center, the largest being, Palawan, Mindoro, Panay, Masbate, Negros, Cebu, Bohol,Leyte and Samar); and the Mindanao Region (composed of Mindanao Island and smallislands in its vicinity). Only the islands of Luzon and Mindanao have areas of more than80,000 kmr2 (23,000 nm 2).
The Philippine Islands are surrounded by large bodies of water. They are boundedon the west by the South China Sea, on the north by the Luzon Strait separating thePhilippine Islands from Taiwan, on the east by the Philippine Sea (and the Pacific Ocean),on the south by the Celebes Sea, and on the southwest by the Sulu Sea separating thePhilippine Islands from Borneo.
Many of the larger islands have narrow coastal plains, generally less than 15 km (8 nm)in width, and interior highland plains and mountain ranges. Many of the ranges, generallyoriented north and south, cover almost the entire length of the islands. Most of themountain ranges have heights of more than 500 m (1600 ft), with large areas having heightsabove 1,000 m (3300 ft), and a small number having heights above 2,000 m (6600 ft).
On the largest island, Luzon, several mountain ranges with heights above 500 m(1600 ft) cover almost one-half of the entire island. On the east coast of north and cen-tral Luzon, lies the Sierra Madre Range. The Ilocos Range (not depicted on Fig. 1.1)runs along the extreme western coast of the northern Luzon, with the Cordillera CentralRange (the longest on the figure) lying between the Sierra Madre Range and the IlocosRange. The Zambales Range located along the western coast of central Luzon containsMount Pinatubo (Point "P" on Fig. 1.1) near its southern extremity. Many of the largerislands of the Visayas have mountain ranges extending most of their entire length, withelevations greater than 500 m (1600 ft). Mindenao has extensive mountain ranges alongits eastern coast, in its central section and along the western coast, with elevations above500 m (1600 ft). Similar to those of Luzon, the ranges of Mindanao cover about one-halfof the island (Flores and Balagot 1969).
1-2
A " J .... Is* A .. " 4 ," *,"
I -1-iV -AVr --
4 U A 0 rAIV A T"- A ' I A"
NOROV
PA- - --W rN r-Y.Na "S,
.E1 O)
A( 3300 v
Z ;
0 "-i---J-"AiN
U~~~C At 060 t ndov
PALAWANý ,CA"
• ;. N, 10
(1600 Rt)3.300 ft)
(6600 rt and over)
Figure 1.1: Geographical and Topographical Chart of the Philippine Islands. Mount* Pinatubo indicated by "P" (adapted from Flores and Balagot (1969)).
1-3
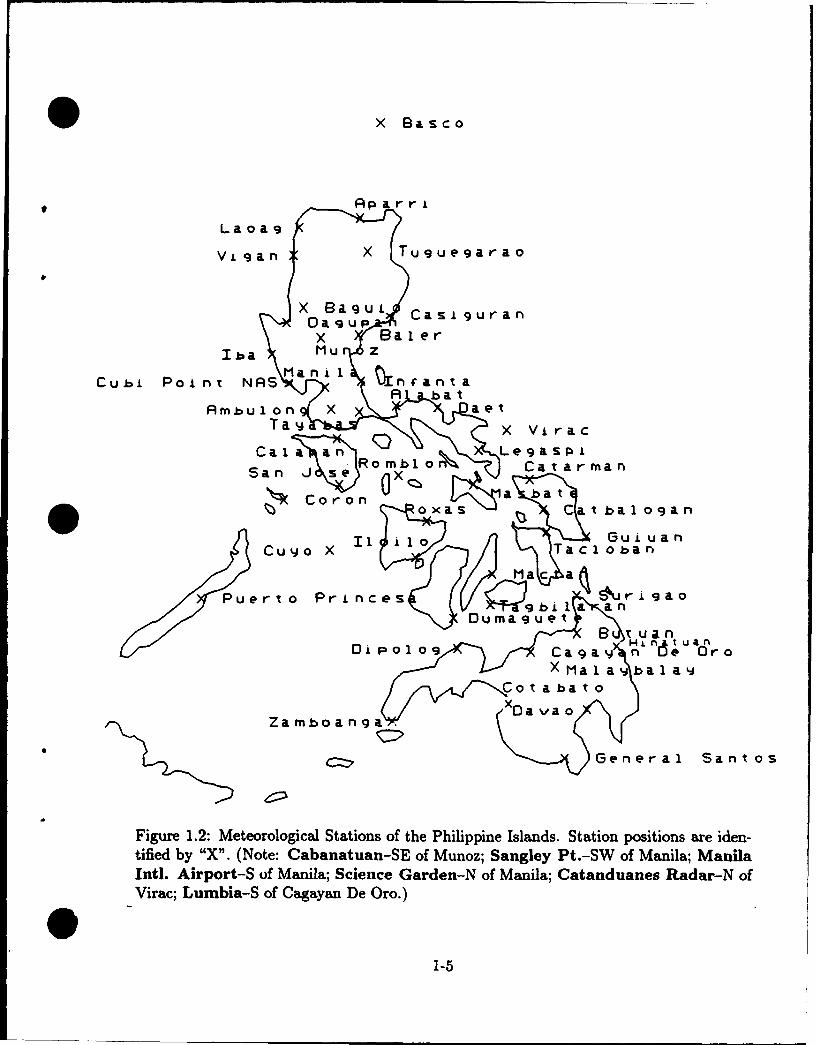
1.3 Meteorological Stations of the Philippine Islands
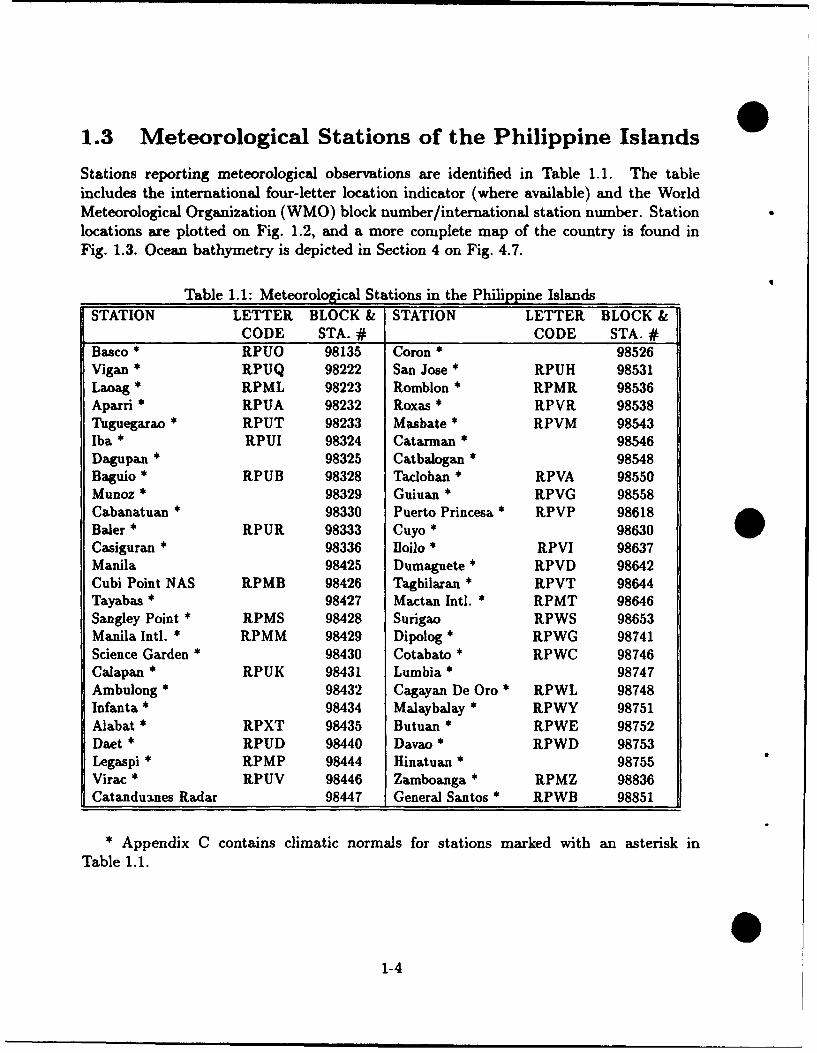
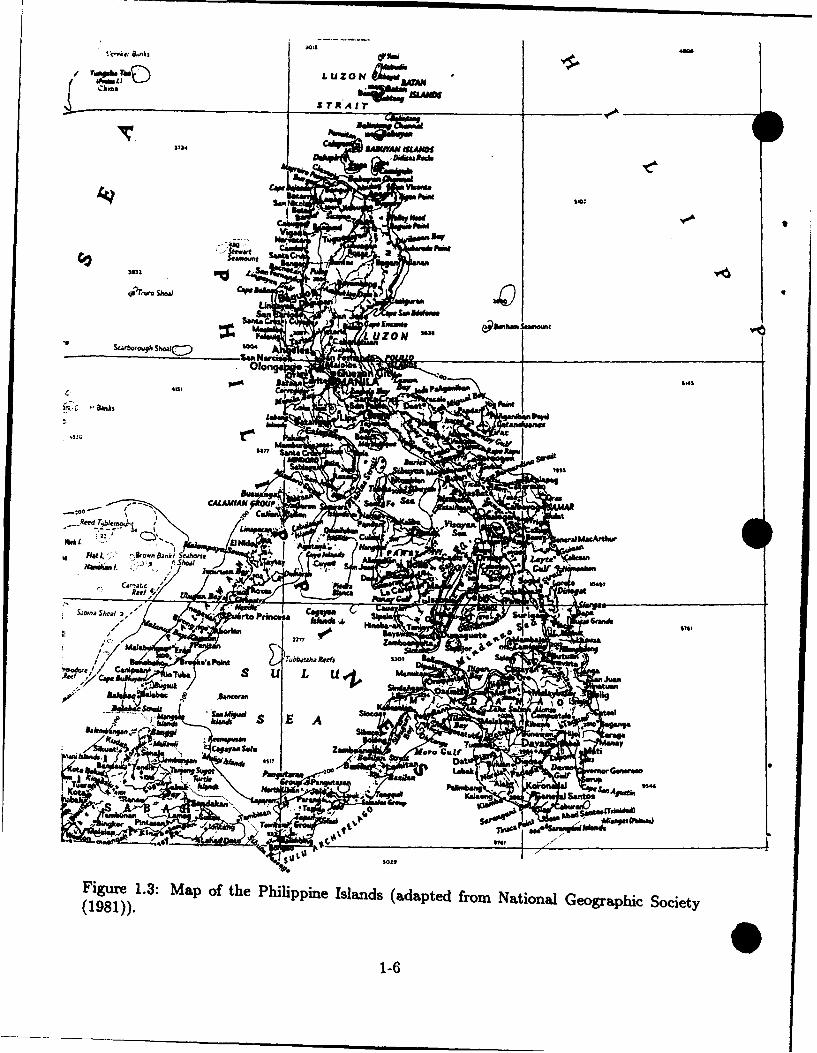
Stations reporting meteorological observations are identified in Table 1.1. The tableincludes the international four-letter location indicator (where available) and the WorldMeteorological Organization (WMO) block number/international station number. Stationlocations are plotted on Fig. 1.2, and a more complete map of the country is found inFig. 1.3. Ocean bathyrnetry is depicted in Section 4 on Fig. 4.7.
Table 1.1: Meteorological Stations in the Philippine IslandsSTATION LETTER BLOCK & STATION LETTER BLOCK &
CODE STA. # CODE STA. #Basco * RPUO 98135 Coron * 98526Vigan * RPUQ 98222 San Jose * RPUH 98531Laoag * RPML 98223 Romblon * RPMR 98536Aparri * RPUA 98232 Roxas * RPVR 98538Tuguegarao * RPUT 98233 Masbate * RPVM 98543Iba * RPUI 98324 Catarman * 98546Dagupan * 98325 Catbalogan * 98548Baguio * RPUB 98328 Tacloban * RPVA 98550Munoz * 98329 Guiuan * RPVG 98558Cabanatuan * 98330 Puerto Princesa * RPVP 98618Baler * RPUR 98333 Cuyo * 98630Casiguran * 98336 Iloilo * RPVI 98637Manila 98425 Dumaguete * RPVD 98642Cubi Point NAS RPMB 98426 Tagbilaran * RPVT 98644Tayabas * 98427 Mactan Intl. * RPMT 98646Sangley Point * RPMS 98428 Surigao RPWS 98653Manila Intl. * RPMM 98429 Dipolog * RPWG 98741Science Garden * 98430 Cotabato * RPWC 98746Calapan * RPUK 98431 Lumbia * 98747Ambulong * 98432 Cagayan De Oro * RPWL 98748Infanta * 98434 Malaybalay * RPWY 98751Alabat * RPXT 98435 Butuan * RPWE 98752Daet * RPUD 98440 Davao * RPWD 98753Legaspi * RPMP 98444 Hinatuan * 98755Virac * RPUV 98446 Zamboanga * RPMZ 98836Catanduanes Radar 98447 General Santos * RPWB 98851
• Appendix C contains climatic normals for stations marked with an asterisk in
Table 1.1.
O1-4
X Basco
*~ Papi r r I
Lao a 9
Vi9an X Tuguegaraop/
X Bagui Casiguran0Da 9 u px Baler
Iba Mu z
Cubi Point NS Man nfant aA ba t
AmbulOn X aetT a j 10X Vi rac
Caia an LegaspiSan ~\~)Ro mbl o~ Cat arrman
Coron .N1baj o x a s Catbalogan
r•~ 1 0rnes(b I Gu i uaoCuyo X TacIot
E),po oCagay• n f6•6r~o
F ' XMac a • laPuert-•Co Prne r ba 9 ao
Za mbo ana
Figure 1.2: Meteorological Stations of the Philippine Islands. Station positions are iden-tified by "X". (Note: Cabanatuan-SE of Munoz; Sangley Pt.-SW of Manila; ManilaIntl. Airport-S of Manila; Science Garden-N of Manila; Catanduanes Radar-N ofVirac; Lumbia-S of Cagayan De Oro.)
1-5
/aSh 7. LUZON
SN S TRAiT
Na-
Pawt irIbI
4V-0
,...)Uzo
C41$101n A
Si. r•" nks
Ree•d T , blem o u•k!
34 C:
St~na Sc~eI 2~' rtoPrmcow
R lat 0 , -".:S:ro. n BJ nk • edharse At k d&
Cerrlat;¢•c)1
h• to,• sM O lfioa sit,•
"-7 .. . 1• ,am . ,,
ima S E A
UI.W.S '.1..S' " .. "" ....SOOtt
Figure 1.3: Map of the Philippine Islands (ada•pted from National Geographic Society(1981)).
1-6

0
2. SEASONAL CLIMATOLOGY
2.1 Introduction
This section of the handbook describes the large-scale circulations dominating the Philip-pine Islands during the northeast and southwest monsoons. As shown in Table 2.1, sourcesoften disagree as to the months constituting each seasonal regime of the Philippines. Ta-ble 2.2 (Ramage 1971) shows the monsoon seasons of continental Asia.
Table 2.1: Seasons of the Philippines
First Weather Wing, 1987
TRANSITION NE TRANSITION TRADE WIND TRANSITION SOUTHWESTITI MONSOON I SEASON II MONSOON
Oct-Nov Dec-Jan Feb-Mar April May-June Jul-Aug-Sep
Commander, Naval Oceanography Command, 1990
NE NE NORTH SWINTER- MONSOON MONSOON PACIFIC INTER- MONSOON SW
MONSOON FORMA- or TRADE MONSOON FORMA- MONSOONPERIOD TION TRADE WIND WIND PERIOD TION (SUMMER)
Oct-Nov Sep-mid Oct Nov-Apr March Apr-May Mar-Jun Jun-Oct
Table 2.2: Monsoon Seasons of Continental Asia (Ramage 1971)HEIGHT OF
AUTUMN SPRING EARLY SUM. ADVANCE SUMMERTRANSITION WINTER TRANSITION TRANSITION OF SUMMER AND ITS WANE
Oct-Nov Dec-Feb Mar-April May Jun-mid July Mid Jul-Sep
02-1
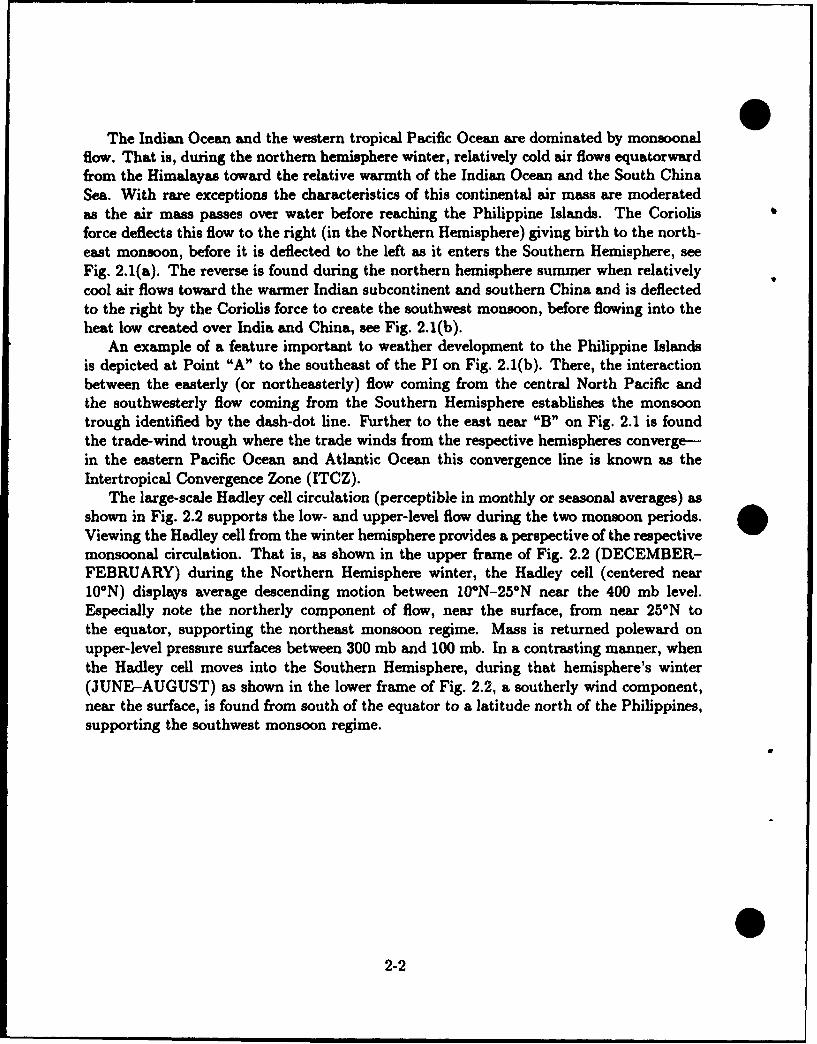
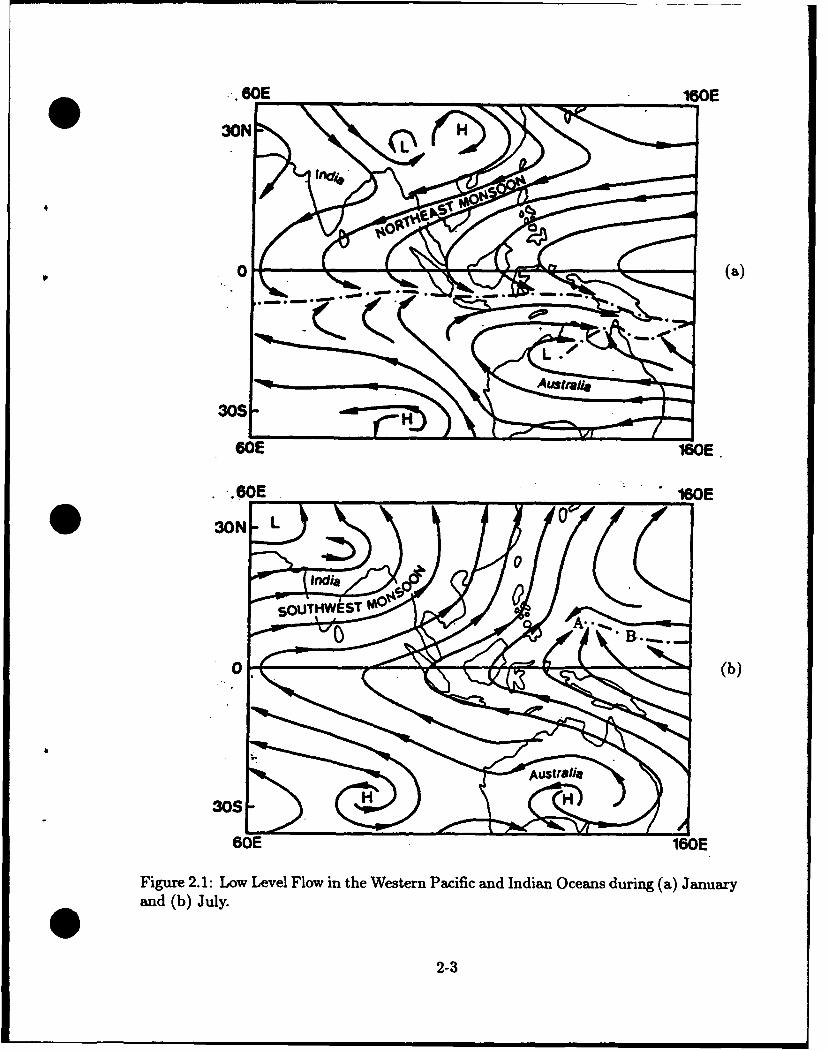
The Indian Ocean and the western tropical Pacific Ocean are dominated by monsoonalflow. That is, during the northern hemisphere winter, relatively cold air flows equatorwardfrom the Himalayas toward the relative warmth of the Indian Ocean and the South ChinaSea. With rare exceptions the characteristics of this continental air mass are moderatedas the air mass passes over water before reaching the Philippine Islands. The Coriolisforce deflects this flow to the right (in the Northern Hemisphere) giving birth to the north-east monsoon, before it is deflected to the left as it enters the Southern Hemisphere, seeFig. 2.1(a). The reverse is found during the northern hemisphere summer when relativelycool air flows toward the warmer Indian subcontinent and southern China and is deflectedto the right by the Coriolis force to create the southwest monsoon, before flowing into theheat low created over India and China, see Fig. 2.1(b).
An example of a feature important to weather development to the Philippine Islandsis depicted at Point "A" to the southeast of the PI on Fig. 2.1(b). There, the interactionbetween the easterly (or northeasterly) flow coming from the central North Pacific andthe southwesterly flow coming from the Southern Hemisphere establishes the monsoontrough identified by the dash-dot line. Further to the east near "B" on Fig. 2.1 is foundthe trade-wind trough where the trade winds from the respective hemispheres converge-in the eastern Pacific Ocean and Atlantic Ocean this convergence line is known as theIntertropical Convergence Zone (ITCZ).
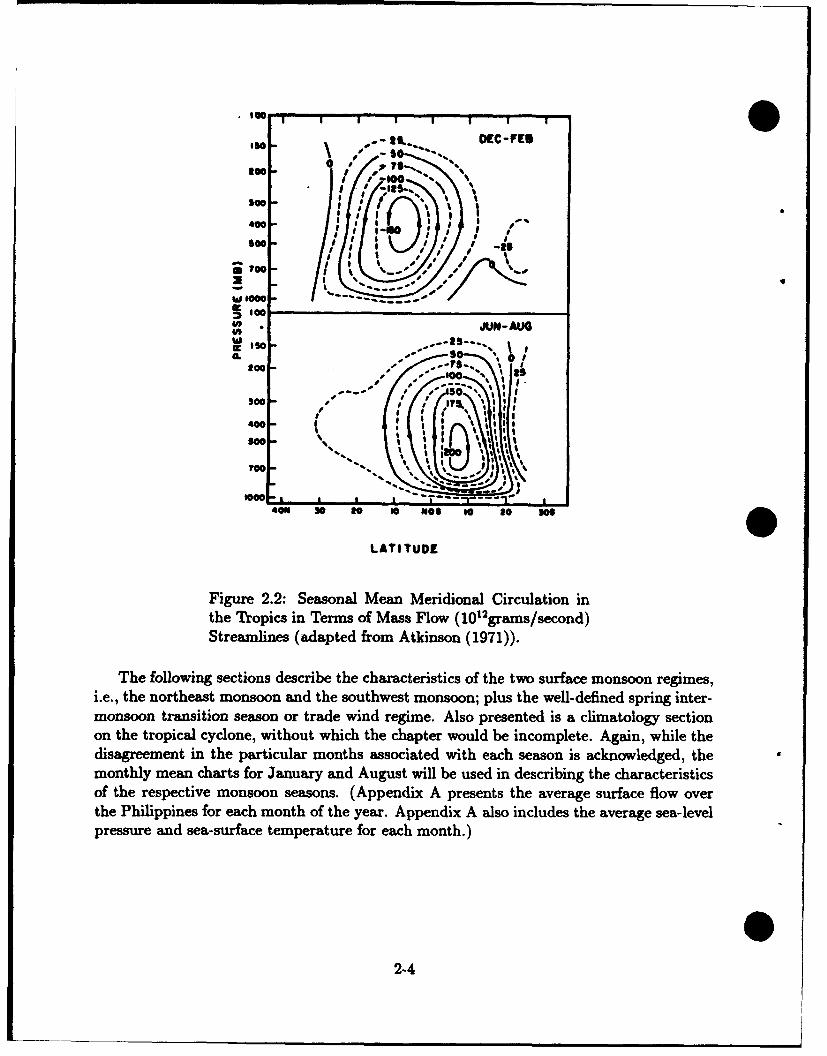
The large-scale Hadley cell circulation (perceptible in monthly or seasonal averages) asshown in Fig. 2.2 supports the low- and upper-level flow during the two monsoon periods.Viewing the Hadley cell from the winter hemisphere provides a perspective of the respectivemonsoonal circulation. That is, as shown in the upper frame of Fig. 2.2 (DECEMBER-FEBRUARY) during the Northern Hemisphere winter, the Hadley cell (centered near10N) displays average descending motion between 10*N-25*N near the 400 mb level.Especially note the northerly component of flow, near the surface, from near 25*N tothe equator, supporting the northeast monsoon regime. Mass is returned poleward onupper-level pressure surfaces between 300 mb and 100 mb. In a contrasting manner, whenthe Hadley cell moves into the Southern Hemisphere, during that hemisphere's winter(JUNE-AUGUST) as shown in the lower frame of Fig. 2.2, a southerly wind component,near the surface, is found from south of the equator to a latitude north of the Philippines,supporting the southwest monsoon regime.
2-
2-2
.60E 160E
0 (a)
G0E I•E.
-,60E 160E
00SSOUT EST
0. (b)
60E 160E_
Figure 2.1: Low Level Flow in the Western Pacific and Indian Oceans during (a) Januaryand (b) July.
22-3
I - DEC-FEI
100* %%
,Sao \ - O..
500 /ewI / S D°,0.".•"
If I400 agW00 / ; I i
W I so I
too I-' I-O T:
lI * S , I ;ig
50l "-","1,'..700 \ \ /
SIoo
1000 ?-
S S -S ...
*0111 W o so N$ t o "400 - o 00 !a 0
LATITUDE
Figure 2.2: Seasonal Mean Meridional Circulation inthe Tropics in Terms of Mass Flow (1012grams/second)Streamlines (adapted from Atkinson (1971)).
The following sections describe the characteristics of the two surface monsoon regimes,i.e., the northeast monsoon and the southwest monsoon; plus the well-defined spring inter-monsoon transition season or trade wind regime. Also presented is a climatology sectionon the tropical cyclone, without which the chapter would be incomplete. Again, while thedisagreement in the particular months associated with each season is acknowledged, themonthly mean charts for January and August will be used in describing the characteristicsof the respective monsoon seasons. (Appendix A presents the average surface flow overthe Philippines for each month of the year. Appendix A also includes the average sea-levelpressure and sea-surface temperature for each month.)
2-4
2.2 Southwest Monsoon
While many manuals place their discussion of the northeast monsoon first-since it can beassociated with January, the first month of the year-the southwest monsoon is presentedfirst in this handbook. Since the author began closely observing and monitoring the Philip-pine Islands (PI) nearly three years ago, it has been obvious that the southwest monsoonregime presents much more interesting and challenging weather for the Philippines. Inparticular, during a 10-day visit during January 1990, the author found most of Luzondevoid of any rainfall, with daytime temperatures in the 80's (*F) and comfortably-lowhumidity. The likelihood of a tropical cyclone (TC) striking the PI during January (andother months during the northeast monsoon) is small and will be discussed in Section 2.3.
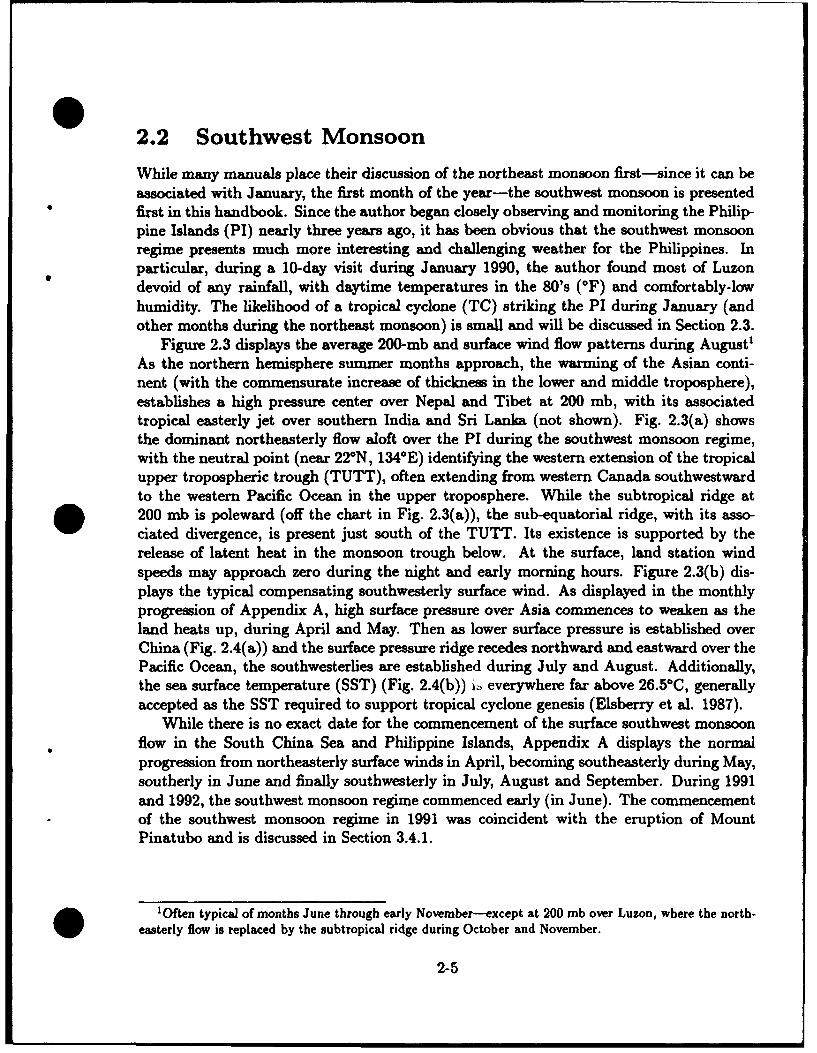
Figure 2.3 displays the average 200-mb and surface wind flow patterns during August1
As the northern hemisphere summer months approach, the warming of the Asian conti-nent (with the commensurate increase of thickness in the lower and middle troposphere),establishes a high pressure center over Nepal and Tibet at 200 mb, with its associatedtropical easterly jet over southern India and Sri Lanka (not shown). Fig. 2.3(a) showsthe dominant northeasterly flow aloft over the PI during the southwest monsoon regime,with the neutral point (near 22°N, 134°E) identifying the western extension of the tropicalupper tropospheric trough (TUTT), often extending from western Canada southwestwardto the western Pacific Ocean in the upper troposphere. While the subtropical ridge at
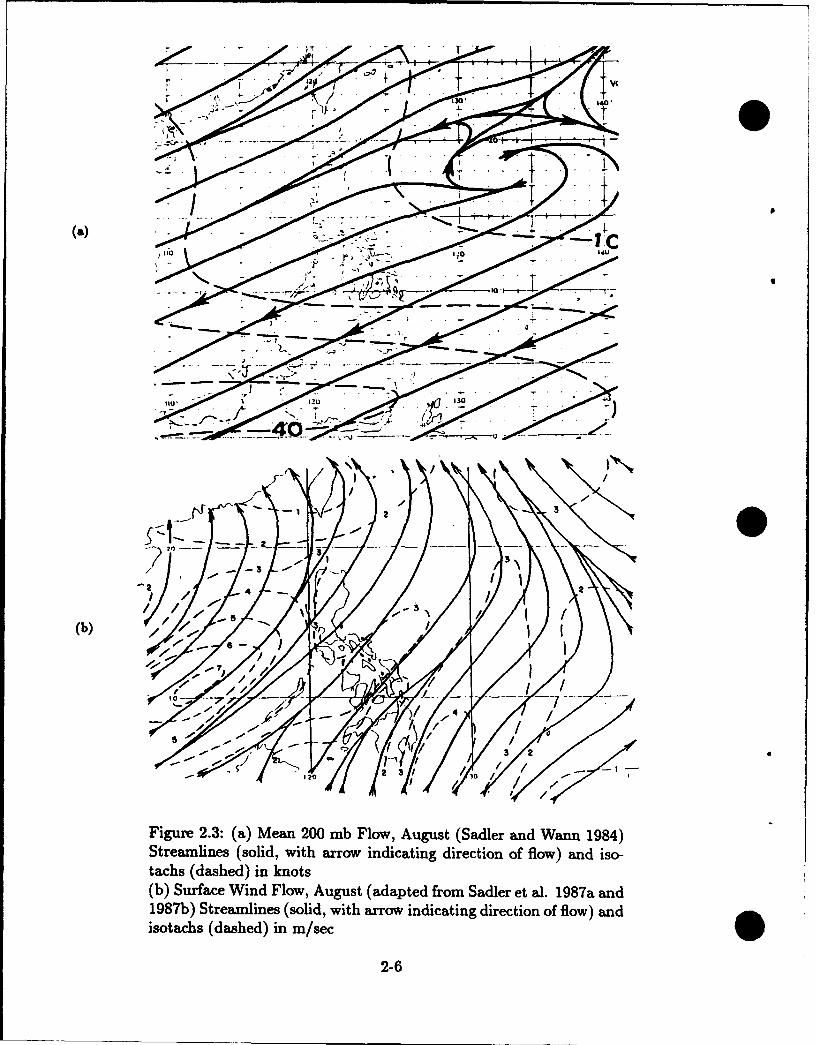
* 200 mb is poleward (off the chart in Fig. 2.3(a)), the sub-equatorial ridge, with its asso-ciated divergence, is present just south of the TUTT. Its existence is supported by therelease of latent heat in the monsoon trough below. At the surface, land station windspeeds may approach zero during the night and early morning hours. Figure 2.3(b) dis-plays the typical compensating southwesterly surface wind. As displayed in the monthlyprogression of Appendix A, high surface pressure over Asia commences to weaken as theland heats up, during April and May. Then as lower surface pressure is established overChina (Fig. 2.4(a)) and the surface pressure ridge recedes northward and eastward over thePacific Ocean, the southwesterlies are established during July and August. Additionally,the sea surface temperature (SST) (Fig. 2.4(b)) 16 everywhere far above 26.5°C, generallyaccepted as the SST required to support tropical cyclone genesis (Elsberry et al. 1987).
While there is no exact date for the commencement of the surface southwest monsoonflow in the South China Sea and Philippine Islands, Appendix A displays the normalprogression from northeasterly surface winds in April, becoming southeasterly during May,southerly in June and finally southwesterly in July, August and September. During 1991and 1992, the southwest monsoon regime commenced early (in June). The commencementof the southwest monsoon regime in 1991 was coincident with the eruption of MountPinatubo and is discussed in Section 3.4.1.
1Often typical of months June through early November--except at 200 mb over Luzon, where the north-easterly flow is replaced by the subtropical ridge during October and November.
2-5
• . •~~ ~ ~ .,-.., . ..... , , . . .• .•,
" ~~~~ . .- .1• .." -- .' ."' .. . .. .. .
7 0
F-I• /
7--
Ito 4 - . /
-- --------
(b) //5
414
Figure 2.3: (a) Mean 200 mb Flow, August (Sadler and Wann 1984)Streamlines (solid, with arrow indicating direction of flow) and iso-tachs (dashed) in knots(b) Surface Wind Flow, August (adapted from Sadler et al. 1987a and1987b) Streamlines (solid, with arrow indicating direction of flow) andisotachs (dashed) in m/sec
2-6
(IT57 at 65 63 67 714 1 as 9 97
-4 7 10* 5r 68 88 33 3 2 9C 4 7390 a2 9o c
220 030 Ia
"2 2 .. 209 267 206 2so 234 02' 22 0 .O46-
261 " 2'.. . . i.212826202020 6 3 6 6 6 6
299
20 26 289 263 269 90 21 2. 2692 232 234' 294
260_ 260 267 26 60, 90 2 o20 290 209 290 293 292 295 263 (b)
--. 5
5 0
/7 1 40
1 6 - / 73) 8 9 R
282 so.8 28 263 282 28 a 83 268 2 s4 26 2 a7 20723
28 7 2282 288 283 26 280 264 284 287 283 2ss8
C.120 130
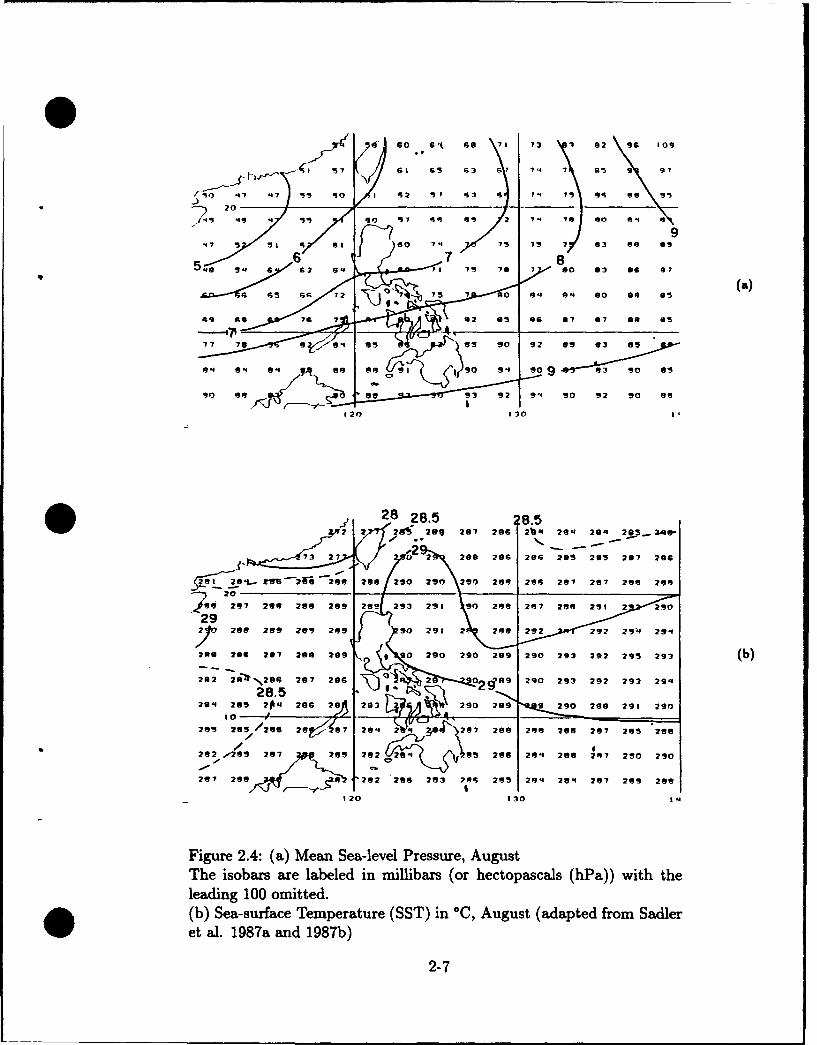
Figure 2.4: (a) Mean Sea-level Pressure, AugustThe isobars are labeled in millibars (or hectopascals (hPa)) with theleading 100 omitted.
O (b) Sea-surface Temperature (SST) in 00, August (adapted from Sadleret al. 1987a and 1987b)
2-7

2.2.1 June-November (Months of Heavier Precipitation)
General
June-AugustMany references classify June as a transition month or a southwest monsoon formation
month; however, this handbook presents June with the following two months. WhileFig. 2.3(b) indicates that the flow is generally from the southwest during August 2, thewind direction may vary, e.g., westerly, southerly, or even southeasterly. During periodsof weak southwest monsoon flow, onshore (sea breeze) and offshore (land breeze) windsmay dominate. The air mass may be classified as maritime equatorial, often extendingto 10 km. The southwest monsoon may appear as early as May, attaining its maximumintensity by July or August (Flores and Balagot 1969).
The southwest monsoon is cloudy 3, hot, humid and wet. Surface temperature maximavary from the mid 80's to the 90's (OF), while the temperature minima range from 65*(probably during an early onset of the NE monsoon) to 75* (see the table of Manilastatistics on page 2-10). Relative humidities are high, though varying diurnally. Theiraverage of 60-80% during the afternoon increases to 85-95% or more during the earlymorning. Cool temperatures only occur due to prolonged lack of insolation; however, thepresence of deep moisture (with its back radiation) keeps nighttime temperatures warm.
The absence of pronounced temperature inversions and the presence of large watervapor magnitudes aloft combine with temperature lapse rates near saturated adiabatic toproduce frequent convective activity. While the air stream is fairly constant, the presenceof a large tropical cyclone to the north (e.g., near the Luzon Strait or approaching Taiwan)may enhance the magnitude of the southwesterly wind. Such a condition may persist fora week or longer with an associated increase in rainfall and it one cause of a surge in thesouthwest monsoon (see case studies in Sections 3.5.3 and 3.5.4). Although the June-August rainfall is high (see the table on page 2-10), it varies widely, from 4-10 inchesa month to 20-45 inches a month. The greatest rainfall occurs at western locations inthe northern Philippines (with rain occurring 20-28 days during a month), while only10-20 days elsewhere. Thunderstorms occur on 5-20 days per month. Gale force winds,though rare, can last for 5-10 minutes during thunderstorms, or longer during passage of"a tropical cyclone-although gale force wind may be intermittent for several days during"a deep surge (USAFETAC 1985).
This period is the cloudiest for the Philippines, and the mean cloud cover varies from60 to 95%. This increase in cloudiness is partially attributed to the monsoon trough mov-ing northward during the period. The location of the trough is displayed in Appendix A,extending from northeastern Luzon toward the southeast during July (Fig. A-8(b)), andthen extending from the Luzon Strait toward the east-southeast during August (FigureA-9(b)). As discussed in Section 2.3, tropical cyclones are often spawned within the mon-soon trough and then move westward to affect the Philippine Islands.
2See Appendix A for monthly climatological wind directions3Clear = 0/10 sky cover, partly cloudy = 1/10-5/10, cloudy = 6/10-9/10 and overcast = 10/10.
2-8
September-NovemberAs described for the previous three months, the surface wind direction may deviate
from the monthly averages displayed in Appendix A. Recognizing the effects or superposi-tion of sea breezes and land breezes, the monthly surface winds change from southwesterlyin September, when the monsoon trough is over northern Luzon (Fig. A-10(b)) to north-easterly in November, when the monsoon trough has returned south to Mindanao (Fig.A-12(b)).
While the weather during September is dominated by the southwest monsoon, thatof October and November experiences less of its effects, as attested by the decrease ofManila rainfall (see table on page 2-10). The normal disappearance of the southwestmonsoon during October, is followed, on the average, by the appearance of northeasterlyflow in the northern Philippines (north of 13*N) during November. However, occasionallythe southwest monsoon may persist even until December (Flores and Balagot 1969). Asmentioned earlier, the monsoon trough passes over the PI moving southward during thisperiod providing cloudy, hot, humid and wet weather. However, the mean cloud coverdecreases from 60-95% in September to 50-85% in November. Mean daily maximumtemperatures are much like the previous three months: 80*F to 90°F, with mean minimadecreasing somewhat: 60-75°F. Relative humidity remains high: 85-95% during the earlymorning, decreasing to 65-80% in the afternoon. While precipitation varies widely from 2to 25 inches a month within the PI, rainfall increases on the windward northeastern coasts.In November, rainfall occurring only 5-10 days a month in western Luzon is contrastedto 20-25 days a month at northeastern locations. Thunderstorm activity decreases infrequency from 4-15 days a month in September to 1-9 days in November. As in theprevious three months (if tropical cyclones are omitted), gale force winds are rare exceptduring thunderstorms when they are common and can last for 5-10 minutes (USAFETAC1985).
Flying Weather (USAFETAC 1985)
June-August
* Good, but conditions axe poor in the mountains.
* Ceilings and visibilities4 _< 5000/6 occur up to 30% of the time.
e < 1500/3: up to 20% of the time.
e < 500/1: about 2% of the time.
4ceiling/visibility, e.g., 5000/6 indicates "ceiling of 5000 feet and/or visibility of 6 miles."
2-9
September-November
* Good.
e Ceilings and visibilities < 5000/6 occur from less than 5 to 30% of the time.
* < 1500/3: less than 20% of the time.
* < 500/1: about 2% of the time.
Terminal Weather, Manila (USAFETAC 1985)
June-AugustGood. Ceiling/visibility • 300/1 occurs less than 1% of the time. Thunderstorms occur
5-10 days of the month. Prevailing surface wind directions vary greatly, easterly throughwesterly, at 5-10 kt or less.
September-NovemberGood. Ceiling/visibility ! 300/1 occurs less than 1% of the time. Thunderstorms
occur on 8 days in September and 2 days in November. Surface winds are light from thenorth or northeast.
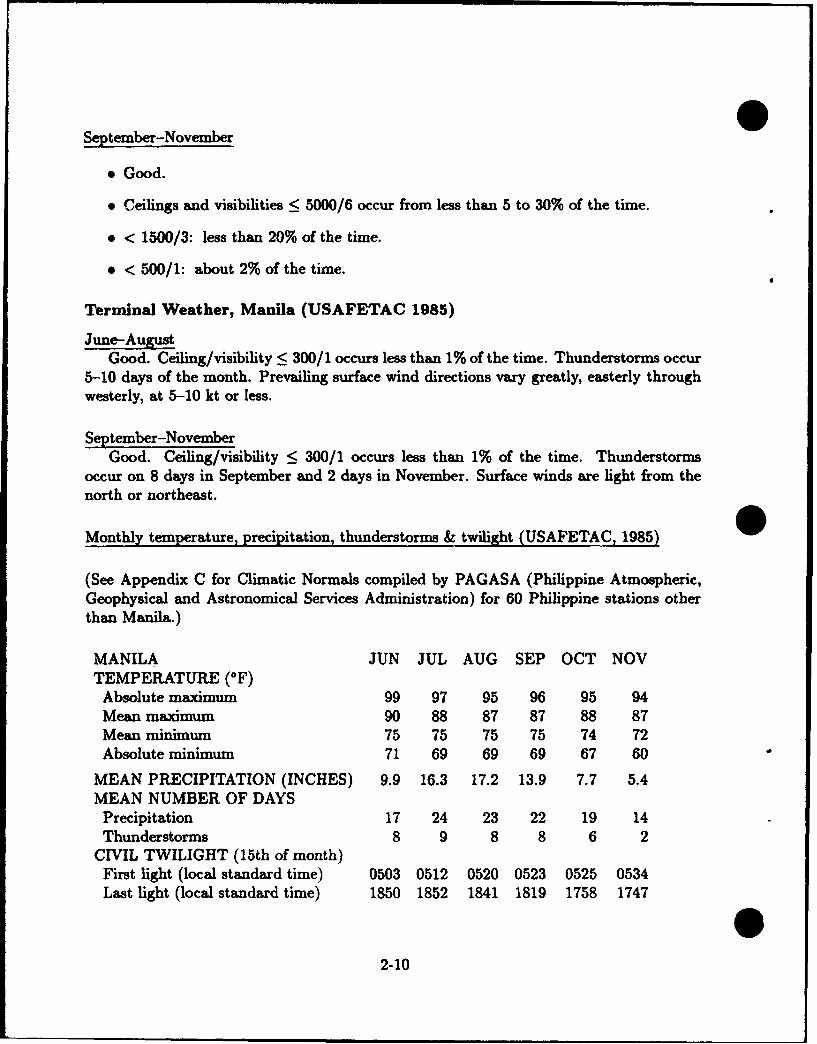
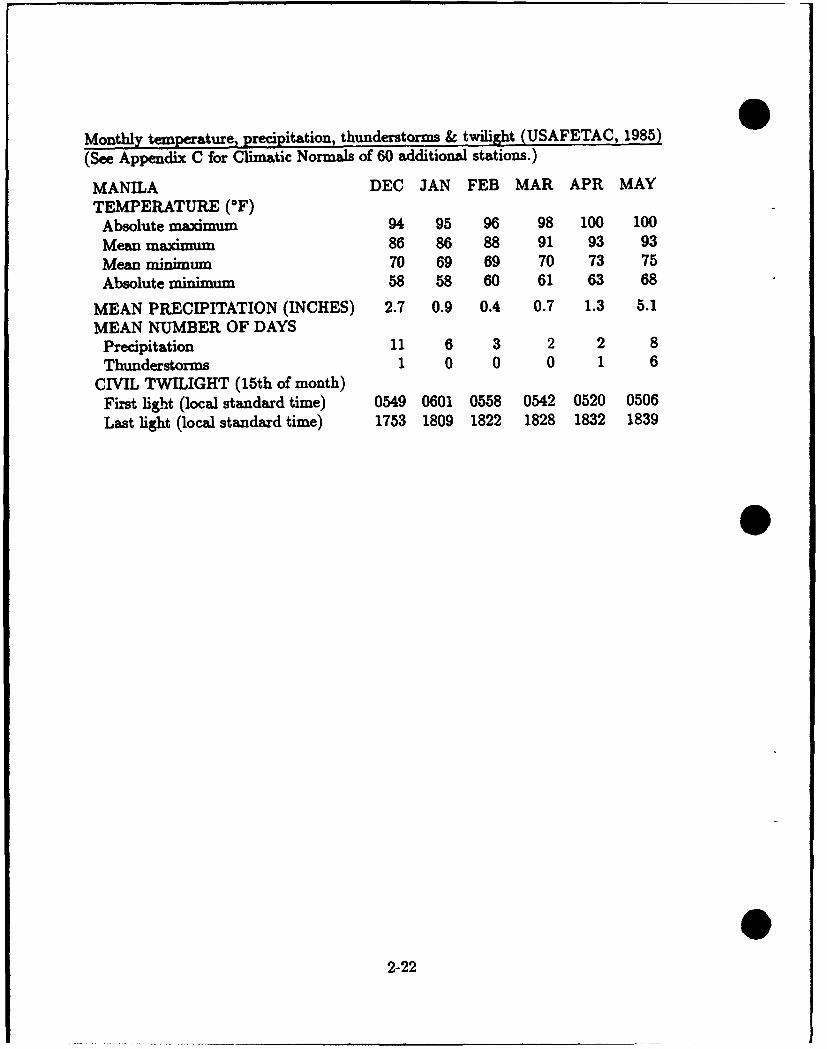
Monthly temperature, precipitation, thunderstorms & twilight (USAFETAC, 1985)
(See Appendix C for Climatic Normals compiled by PAGASA (Philippine Atmospheric,Geophysical and Astronomical Services Administration) for 60 Philippine stations otherthan Manila.)
MANILA JUN JUL AUG SEP OCT NOVTEMPERATURE ('F)
Absolute maximum 99 97 95 96 95 94Mean maximum 90 88 87 87 88 87Mean minimum 75 75 75 75 74 72Absolute minimum 71 69 69 69 67 60
MEAN PRECIPITATION (INCHES) 9.9 16.3 17.2 13.9 7.7 5.4MEAN NUMBER OF DAYS
Precipitation 17 24 23 22 19 14Thunderstorms 8 9 8 8 6 2
CIVIL TWILIGHT (15th of month)First light (local standard time) 0503 0512 0520 0523 0525 0534Last light (local standard time) 1850 1852 1841 1819 1758 1747
2-10
2.3 Tropical Cyclones
2.3.1 Introduction
Tropical cyclones can affect the Philippine Islands during almost any month'. The Clima-tology of North Pacific Tropical Cyclone Tracks (Miller et al. 1988) presents the tracksand statistics of tropical cyclones that have occurred in the entire North Pacific Oceanduring the years 1945-1987. While this voluminous document will not be duplicated here,Thumb Rules from Shoemaker (1991) for forecasting tropical cyclones specifically over thePI will be presented. Before forecasting in or around the Philippine Islands, the readershould review the condensation of Shoemaker's PI study contained in Appendix B.
A review is also recommended of the last several issues of the Annual Tropical CycloneReport (ATCR) published by JTWC, if available. The tracks of all recent TCs strikingthe PI and the verification of various forecasting aids during similar flow patterns shouldbe studied. The 1991 ATCR (U. S. NOCC/JTWC 1992) reveals that during 1991, theNavy Operational Global Atmospheric Prediction System (NOGAPS) Vortex TrackingRoutine (NGPS)6 aid improved (relative to other objective aids discussed in Chapter 3)for the longer forecast periods, i.e., 48-h and 72-h. The 1991 ATCR reports that duringthe period 1959-1991 the average number of tropical cyclones in the entire western NorthPacific Ocean was 31. The year 1991 was an above average year with 32 tropical cyclones:
* 2 tropical depressions (TDs), 10 tropical storms (TSs) and 20 typhoons (TYs), of which 5were super typhoons (STYs).
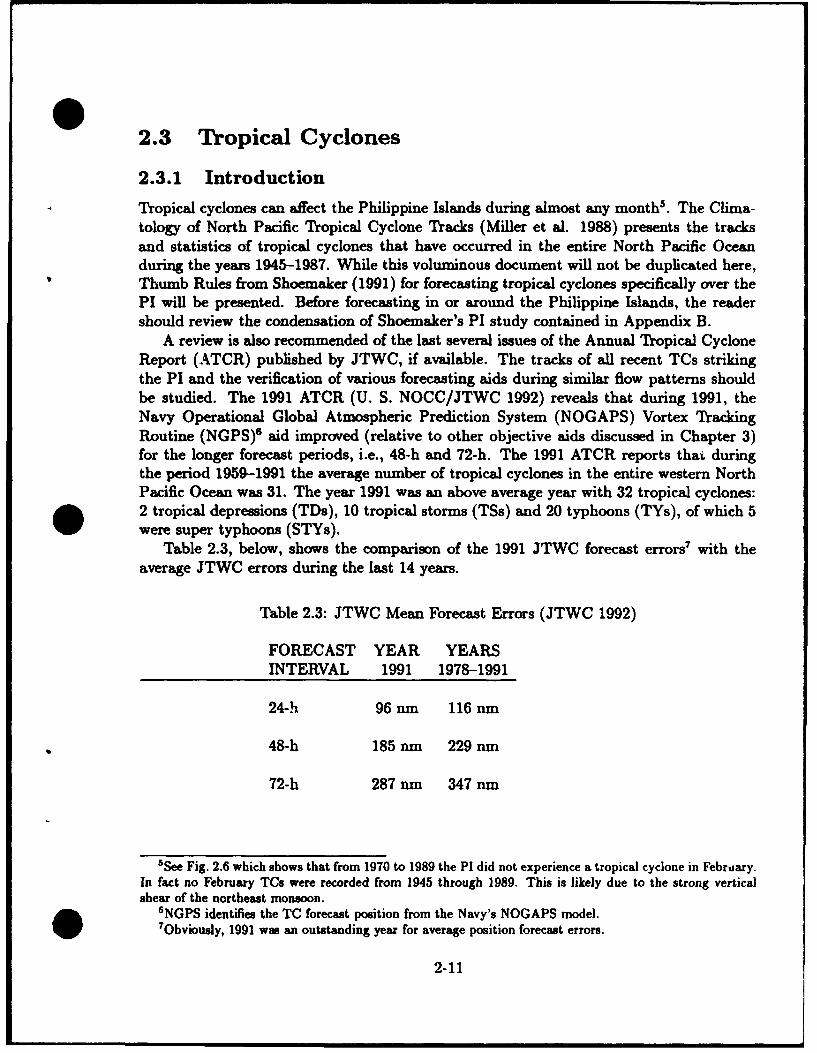
Table 2.3, below, shows the comparison of the 1991 JTWC forecast errors7 with theaverage JTWC errors during the last 14 years.
Table 2.3: JTWC Mean Forecast Errors (JTWC 1992)
FORECAST YEAR YEARSINTERVAL 1991 1978-1991
24-h 96 nm 116 nm
48-h 185 nm 229 nm
72-h 287 nm 347 nm
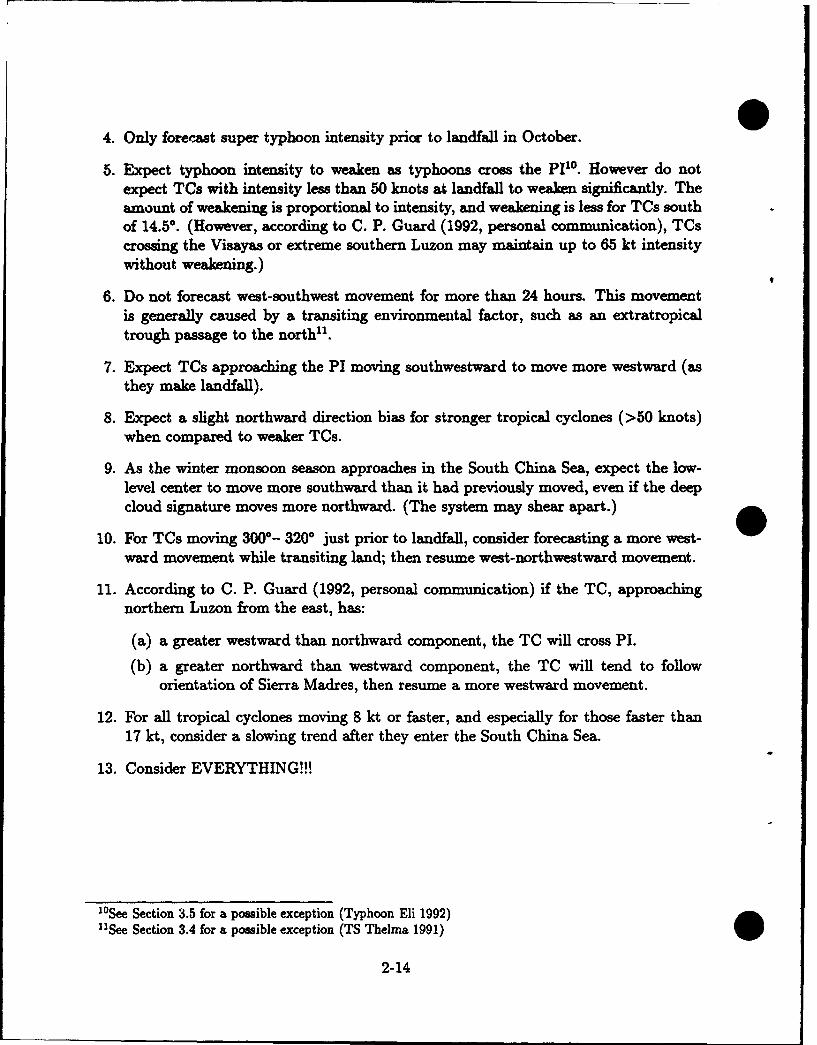
5See Fig. 2.6 which shows that from 1970 to 1989 the PI did not experience a tropical cyclone in February.In fact no February TCs were recorded from 1945 through 1989. This is likely due to the strong verticalshear of the northeast monsoon.
6NGPS identifies the TC forecast position from the Navy's NOGAPS model.7Obviously, 1991 was an outstanding year for average position forecast errors.
2-11
For nearly three years, the effects of tropical cyclones upon the Philippine Islandshave been under surveillance by the author. An average of 31 tropical cyclones occursin the western North Pacific Ocean each year. While it is a highly speculative concept-and the author is not an expert on ENSO0 theory-, it was suspected that 1992 mightbe a year of fewer than normal tropical cyclones for the western North Pacific Ocean,following the ENSO episode of warmer SST, in the east, during 1991/1992. This is basedon the observation that fewer than normal tropical cyclones occurred during the typhoonseasons following the 1976/1977 and the 1982/1983 ENSO episodes. However, C. P. Guard(1992, personal communication) theorizes that an ENSO episode may delay onset of (early)typhoons, but does not necessarily reduce the total number of typhoons.
While the above theory addresses the entire western North Pacific Ocean, Shoemaker(1991) discusses only tropical cyclones affecting the Philippine Islands. His study showsthat during the 20-year period (1970-1989), an average9 of 6.5 TCs struck the PI per year.However, the Philippine Atmospheric, Geophysical and Astronomical Services Adminis-tration (PAGASA) reports an average >10 per year.
2.3.2 Tropical Cyclone "Thumb Rules"
The following rules (Shoemaker 1991) must be applied judiciously to each given situation.They may help "fine tune" a forecast, but are seldom forecasts in themselves. As will beshown, the rules are not irrefutable!
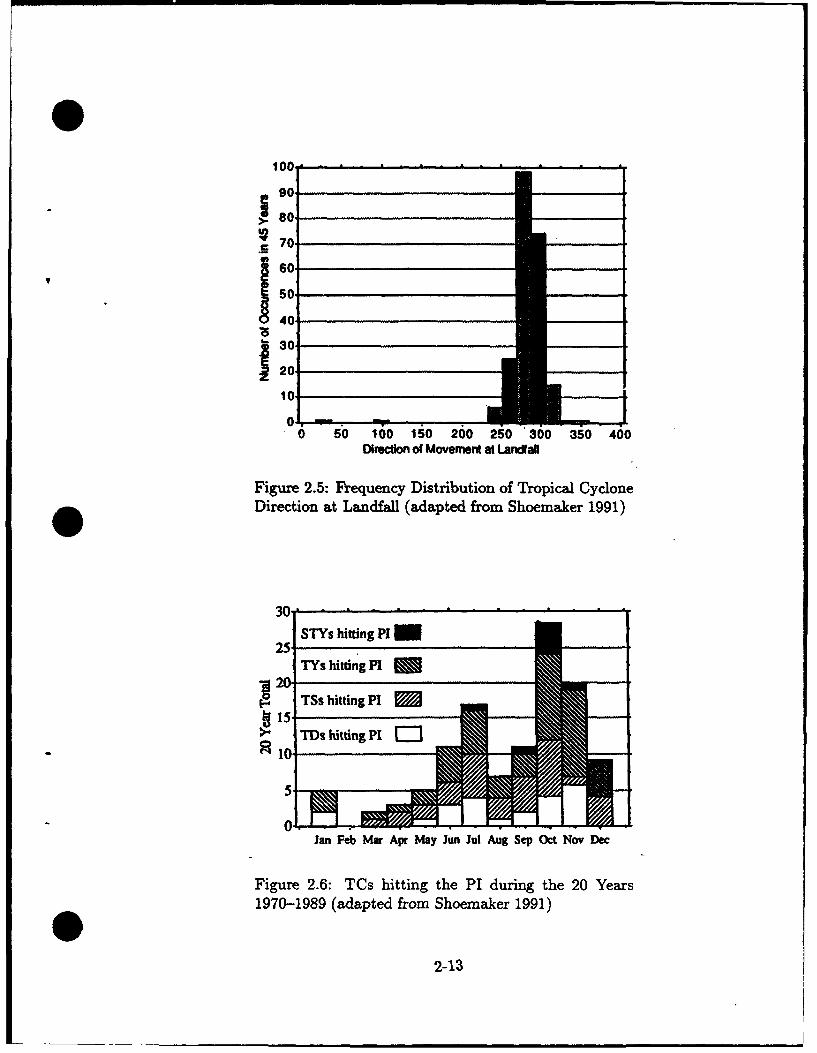
1. If a TC is forecast to be moving 320*- 3600 when approaching the east coast of thePI, forecast recurvature rather than a PI transit (see Fig. 2.5).
2. Do not forecast February, March, or April Philippine Sea TCs to strike the PI (seeFig. 2.6).
3. Consider September-November as the most favorable period for TCs to hit the PI.The June-July period is next most favorable. The monthly number of TCs (Fig. 2.6)is bimodal in consonance with the sun passing over the PI twice per year. (During lateJuly-early September storms generally move north or northeast of Luzon, inducinga monsoon surge.)
"5The El Nino/Southern Oscillation (ENSO) phenomenon exists when an anomalous pressure gradientexists across the tropical Pacific Ocean, i.e., the magnitude of the near-surface easterly trade winds decreases,and nearly simultaneously a thicker, warmer upper-ocean layer forms in the central, then in the eastern,Pacific Ocean. With the anoma' us eastward transport of Pacific Ocean near surface water, upwelling alongthe west coast of South America is inhibited and sea surface temperature (SST) increases. The increased SSTleads to increased atmospheric convection over the central and eastern Pacific with its associated upwardatmospheric motion. This is accompanied by a large scale downward (sinking) atmospheric motion over thewestern tropical Pacific which tends to inhibit the strength of the convection otherwise expected to occurwithin the vicinity of the monsoon trough of the western Pacific. It logically follows that any decrease inconvective activity within the monsoon trough should lessen the likelihood of TC formation in the westernPacific.
9See Page B-2 of Appendix B.
2-12
so,00
sol
S40i
10,
0 50 100 150 200 250 300 350 400Direction of Movement at Landfall
Figure 2.5: Frequency Distribution of Tropical CycloneDirection at Landfall (adapted from Shoemaker 1991)
STYs hitting PI25o
~2 TSs hitting P1
> TDs hitting P1 C
10
Jan Feb Mar Apr May Jun Jul Aug Sep Oct Nov Dec
Figure 2.6: TCs hitting the PI during the 20 Years1970-1989 (adapted from Shoemaker 1991)
2-13
4. Only forecast super typhoon intensity prior to landfall in October.
5. Expect typhoon intensity to weaken as typhoons cross the P110. However do notexpect TCs with intensity less than 50 knots at landfall to weaken significantly. Theamount of weakening is proportional to intensity, and weakening is less for TCs southof 14.50. (However, according to C. P. Guard (1992, personal communication), TCscrossing the Visayas or extreme southern Luzon may maintain up to 65 kt intensitywithout weakening.)
6. Do not forecast west-southwest movement for more than 24 hours. This movementis generally caused by a transiting environmental factor, such as an extratropicaltrough passage to the north".
7. Expect TCs approaching the PI moving southwestward to move more westward (asthey make landfall).
8. Expect a slight northward direction bias for stronger tropical cyclones (>50 knots)when compared to weaker TCs.
9. As the winter monsoon season approaches in the South China Sea, expect the low-
level center to move more southward than it had previously moved, even if the deepcloud signature moves more northward. (The system may shear apart.)
10. For TCs moving 300*- 3200 just prior to landfall, consider forecasting a more west-ward movement while transiting land; then resume west-northwestward movement.
11. According to C. P. Guard (1992, personal communication) if the TC, approachingnorthern Luzon from the east, has:
(a) a greater westward than northward component, the TC will cross PI.
(b) a greater northward than westward component, the TC will tend to followorientation of Sierra Madres, then resume a more westward movement.
12. For all tropical cyclones moving 8 kt or faster, and especially for those faster than17 kt, consider a slowing trend after they enter the South China Sea.
13. Consider EVERYTHING!!!
"1See Section 3.5 for a possible exception (Typhoon Eli 1992)"1See Section 3.4 for a possible exception (TS Thelma 1991)
2-14
2.4 Northeast Monsoon and the Trade Wind Regime
During two recent northeast monsoon seasons (1990/91 and 1991/92), major Asian cold-surge events had little effect upon the Philippine Islands. These major cold-surges (seeBoyle and Chen 1987), emanating from near Lake Baikal in the Russian Republic, movedeastward over Korea and toward Japan, with little perceived effect upon the P1.
Figure 2.7 displays the average 200-mb and surface flow pattern during January12 . InFig. 2.7(a) at 200 mb, the subtropical ridge has been displaced equatorward by the strongwesterlies associated with the polar front jet, which averages 140 kt, to the north near 30°N(not shown). This streamline pattern provides the general poleward mass transport aloft.Figure 2.7(b) then shows the near-surface equatorward return flow, the northeast monsoonregime, described earlier .'n the introduction. The intermittent passage of cold fronts orweaker shear lines, near the surface, are masked by the more prevalent northeasterly flow.That is, the southwesterly flow ahead of the cold surges-normally weak by the timethey reach Luzon-is not visible in the mean flow depicted in Fig. 2.7(b). Cold frontsfrequently pass over Hong Kong and Taiwan through May-even later into June. Whilethey typically penetrated no further south than the Luzon Strait during the most recentseason, forecasters should expect weak cold fronts (or shear lines), with their associatedcloudiness and light showers, to make several penetrations into Luzon during the northeastmonsoon regime. The shear lines may move south, even into the Visayas, and then move
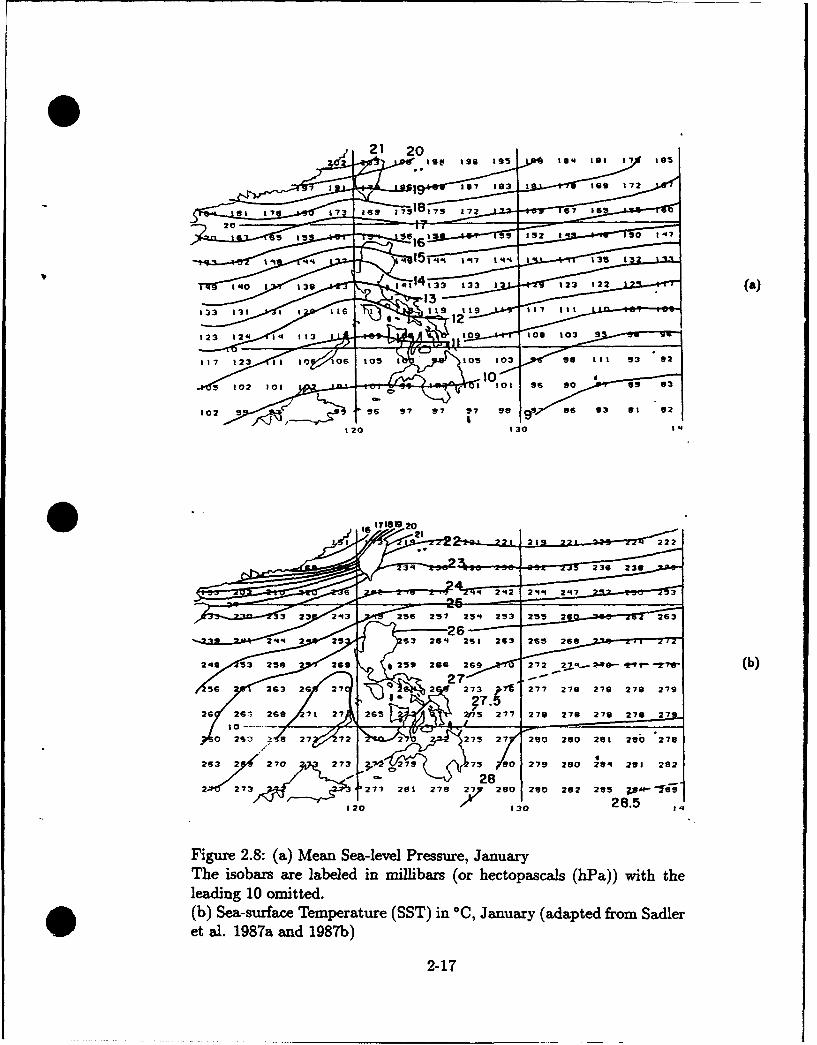
* back over Luzon, with their persistent broken cloudiness, before dissipating (CNOC 1990).Figure 2.8(a) for January shows the reversal of sea-level pressure gradient over the PI
compared with that of August (Fig. 2.4(a)). The lower surface pressure over mainlandChina during August has now been replaced by high pressure (near 1021 hPa or mb)(Fig. 2.8(a)) associated with the very cold, dense winter air mass. The January SSTsurrounding the Philippine Islands (Fig. 2.8(b)) is now 1-5 'C colder than in August, withthe temperature required for TC genesis (26.5°C) restricted to the general vicinity of theVisayas and Mindanao.
During April and May, the Philippine Sea was monitored for tropical waves movingwestward toward the P1. Although several very weak convective centers were detectedmoving westward toward the Visayas, they were of no significant impact-quite differentfrom the frequent convective tropical waves, with their associated precipitation, movingfrom the North Atlantic Ocean westward into the Caribbean Sea (Williams et al. 1989).If they existed farther equatorward, they may have moved westward over Mindanao, butwere probably masked by persistent cloudiness so near to the equator. Also, by late May,the monsoon trough commences its return at the surface (see Appendix A, Fig. A-6(b)),and any convective clusters east of Mindanao can become tropical cyclones.
12The 200-rob flow is typical of months December through April. The subtropical ridge then movesnorthward to the Luzon Strait during May. The surface flow is typical of December through March. Thesurface patterns for April and May are presented Fig. 2.9.
2-15
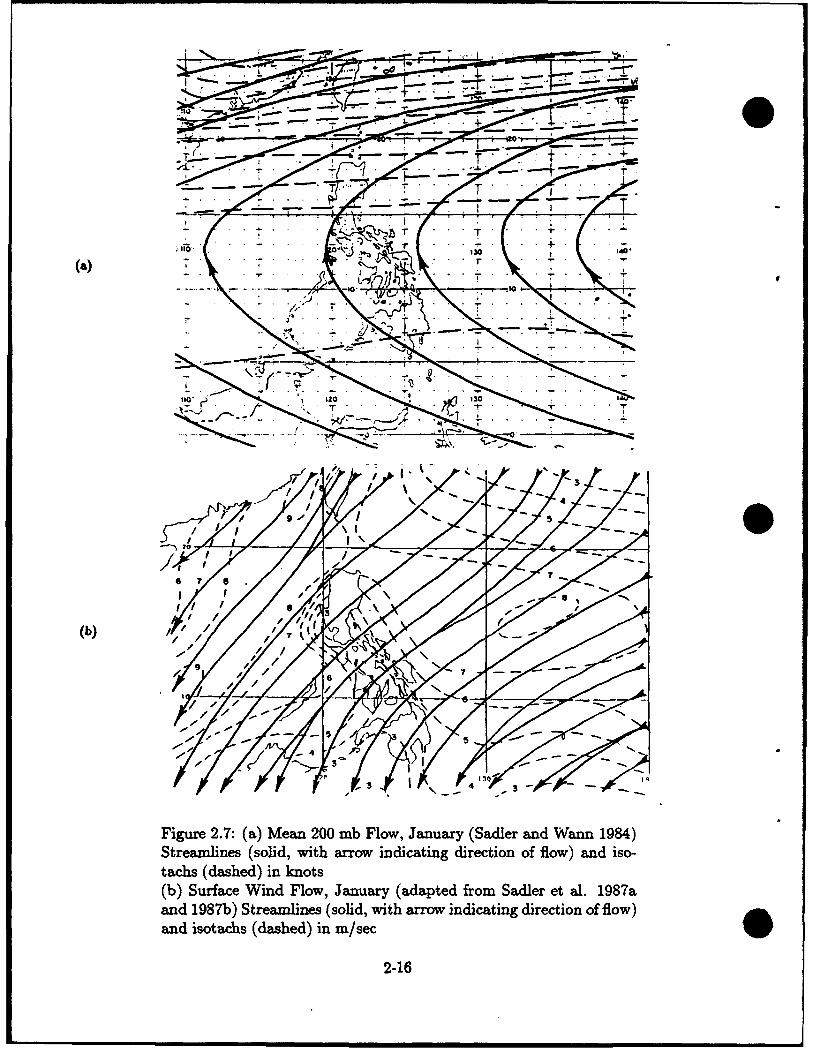
Figue 2.:-(a-Mea 20 -b Flo, Jaur (Sde an , an184
(b) SuracWidlo , Janar (adpte from Sale et .... T987
60. +2106
"1 7(. T,. - U . ,11- -) 12 1-30: -,I• • ' •
-. •.----- ,• • :2 . -•
?ixif
Figure 2.7: (a) Mean 200 mb Flow, January (Sadler and Warm 1984)
Streamlines (solid, with arrow indicating direction of flow) and iso-
tachs (dashed) in knots(b) Surface Wind Flow, January (adapted from Sadler et al. 1987aanand 1987b)istahStreamlinesdahd n(solidmsewith arrow indicating direction of flow)O
2-16
to 195
I
120 1930 1I
20a 7 7 169 1l 58 75 17
13• 2L-2L! 23
123 12 14 3 oto 180
27 71202 • • 130 2 1 -49
1, 111 ,202 .5 ,
Figure~2-'ý 2.8 It) Men22-ee2resr, aur
e2 1987 79d 182"3
2--2-17
2.4.1 December-May (Months of Lighter Precipitation)
General
December-MarchFigure 2.7(b) shows the steady northeast surface flow associated with the northeast
monsoon, although at times it may pulsate in surges. This air stream, originating in thecold, intense Asiatic winter anticyclone, follows a path across Japan or the Ryukyu Islands(the island chain containing Okinawa). As the air mass finally reaches the PI, it may comefrom a northerly through easterly direction. During periods with weaker synoptic winds,the sea breeze or land breeze component may dominate. In fact, the northeast monsoonmay start as early as October, attain maximum strength in January, weaken in March anddisappear in April.
Commencing as a continental polar air mass with temperature near -5* F and a mixingratio (-,0.5 g/kg) near the surface, the air mass is transformed into a maritime polar airmass as it passes over the northwestern Pacific Ocean. Finally arriving over the PhilippineIslands as a maritime sub-tropical air mass, the air mass has a surface temperature ofabout 770 F and a mixing ratio near 12 g/kg.
The air stream has a moderate temperature inversion at about 5000 ft, with most ofthe water content in the layer below the inversion. The northeast monsoon is relativelyshallow, rarely exceeding 8000 ft in depth. Aloft, it normally is overlaid by extratropical(or temperate zone) westerlies over northern Luzon and by North Pacific trades over the Wremainder of the PI. Typically the northeast trades are characterized by heavy stratocu-mulus clouds, with isolated showers or drizzle. While clear conditions exist aloft in theupper-level extratropical westerlies, an upper-level trade regime will bring both middle andhigh clouds (Flores and Balagot 1969).
The northeast monsoon is partly cloudy to cloudy, less humid than the southwestmonsoon regime, but sometimes hot. The mean cloudiness varies between 50 and 85%;however, some locations on the west coast (lee side) of Luzon, experience cloudiness ofonly 25 to 50%. Mean relative humidity, somewhat lower through January, still averages60-80% in the afternoon and 85-95% in the early morning at coastal areas, but less in-land where subsidence over the mountains helps dry the atmosphere. While mean dailymaximum temperatures range from low 80's (°F) to the low 90's, the mean daily minimaare 65-75°(see Manila statistics on page 2-22). Temperatures at mountain sites are about100 lower. Throughout the PI, temperatures rarely go below 550 or above 1000. As willbe noted at the 60 stations in Appendix C, precipitation varies considerably throughoutthe PI. During this period, the smallest rainfall amounts are found along the west coast ofLuzon, with the largest, on the northeast coast along the Sierra Madre mountain range,where the orographic effects produce >20 inches. Similarly, the number of days per monthwith precipitation varies from <5 to 25 days, and the mean number of days a month withthunderstorms, from 0 to 9 days. Gale force winds are rare during this regime, but dooccur near thunderstorms, lasting 5-10 minutes (USAFETAC 1985).
Frequent tropical disturbances may drop considerable precipitation on Mindanao during
2-18
this period, but they seldom develop into TCs. Gales are also common in the Luzon Straitduring NE surges.
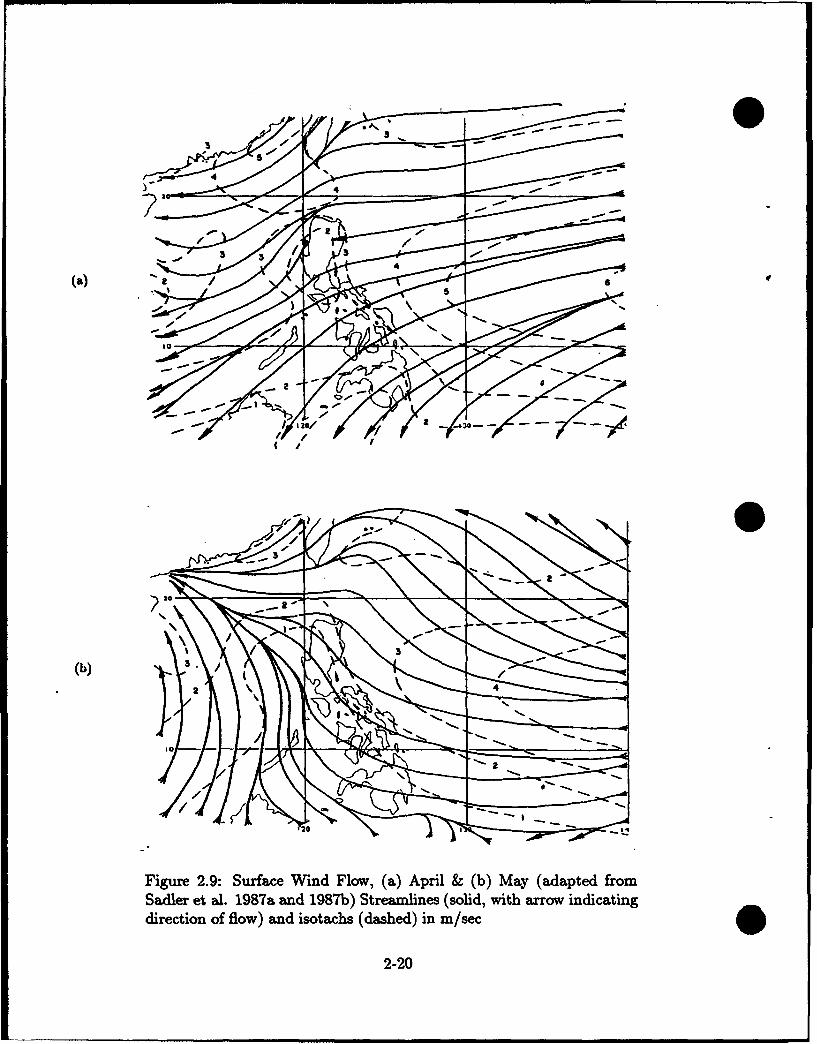
April-MayThis period is classified as the trade wind or transition season. The monthly mean
streamlines for April and May (Figs. 2.9(a) & (b)) demonstrate graphically the evolutionof this transition. The North Pacific trades air stream is the southern portion of the NorthPacific anticyclone and is thus classified as a maritime tropical air mass. Traveling overa vast expanse of the ocean, the air stream arrives at the Philippine Islands from varyingdirections, generally northeast, east or southeast, but sometimes south, or even southwest.The trade winds are generally dominant over the entire PI in April and early May. Asmentioned in the previous section, they usually overlie the northeast monsoon, especiallyover eastern portions of the Philippine Islands.
As seen in the following statistics for Manila, this trade wind regime is the warmestto affect the PI. The air mass has a lapse rate slightly greater than saturated adiabatic,with a weak trade wind inversion at about 5000 ft elevation. The moisture content belowthe inversion is moderate, but very dry above the inversion where the relative humidity isgenerally <25%. While these vertical temperature and moisture profiles make the air massnormally both conditionally and potentially (or convectively) unstable, the relatively dry. upper layers and the general subsidence from the nearby large-scale anticyclone prevent theoccurrence of intense convective activity. Most cloudiness is limited to cumulus humulis(fair weather cumulus) and stratocumulus, except where orographic enhancements lead totowering cumulus and showers (Flores and Balagot 1969).
While May commences with the Philippine Islands under the domination of the tradewinds, May, nevertheless, is part of the southwest monsoon formation season. The monsoontrough begins its northeastward movement across the PI from the southwest (see AppendixA, Fig. A-6(b)). Mean cloudiness during this season varies from 50-80%, except along thewestern coastal areas of Luzon, where it is 25-50%. Relative humidity remains much likeFebruary and March averaging 60-80%, afternoons, to 85-95%, mornings, but more humidover the eastern PI while drier inland. As mentioned earlier, these are the warmest monthsin the Philippine Islands with mean daily maximum temperatures ranging from the low80's to the mid 90's. Mean minimum temperatures range from the mid 60's to the upper70's. Yet, temperatures are very rarely below 550 or above 1000. As the formation of thesouthwest monsoon commences, rainfall increases along the southwest coasts, and decreasesalong the northeast coasts. While rainfall occurs 5-20 days a month, the thunderstormactivity increases with the approach of the monsoon trough. Gale force winds are rareexcept during thunderstorms (USAFETAC 1985).
This is the season for severe, inland thunderstorms. In April the sun is directly over-head, skies are relatively clear and surface heating creates very active convection. Dryair above 5-8000 ft results in strong evaporative cooling and strong thunderstorm down-drafts. Additionally, a strong sea breeze front frequently sets up between Manila Bay andLingayen Gulf, creating thunderstorms with tops in excess of 55,000 ft.
2-19
3A
Figure 2.9: Surface Wind Flow, (a) April & (b) May (adapted fromSadler et al. 1987a and 1987b) Streamlines (solid, with arrow indicatingdirection of flow) and isotachs (dashed) in m/sec
2-20

0Flying Weather (USAFETAC 1985)December-March
* Fair to good.
* Ceilings and visibilities :< 5000/6:
1. Less than 10% of the time along the west coast of Luzon.
2. Up to 33% of the time at eastern locations.
* < 1500/3: From less than 1 to 20% of the time.
* < 500/1: Less than 2% of the time.
April-May
* Good.
* Ceilings and visibilities < 5000/6 occur 5-20% of the time.
* < 1500/3: Less than 12% of the time.
o < 500/1: Less than 1% of the time.
Terminal Weather, Manila (USAFETAC 1985)
December-MarchGood. Ceiling/visibility _5300/1 occurs less than 1% of the time. Surface winds are
northeasterly through southeasterly, 5-15 kt.
April-MayGood. Ceiling/visibility •300/1 occurs less than 1% of the time. Thunderstorms occur
on less than 10 days a month. Surface winds are easterly through southeasterly, 5-15 kt.
2-21
0Monthly temperature, precipitation, thunderstorms & twilight (USAFETAC, 1985)(See Appendix C for Climatic Normals of 60 additional stations.)
MANILA DEC JAN FEB MAR APR MAY
TEMPERATURE (°F)Absolute maximum 94 95 96 98 100 100
Mean maximum 86 86 88 91 93 93
Mean m mum 70 69 69 70 73 75
Absolute minimum 58 58 60 61 63 68
MEAN PRECIPITATION (INCHES) 2.7 0.9 0.4 0.7 1.3 5.1MEAN NUMBER OF DAYS
Precipitation 11 6 3 2 2 8
Thunderstorms 1 0 0 0 1 6
CIVIL TWILIGHT (15th of month)First light (local standard time) 0549 0601 0558 0542 0520 0506
Last light (local standard time) 1753 1809 1822 1828 1832 1839
2
2-22
TYPHOON (AND OTHER)FORECASTING
3.1 The Danger of Volcanic Ash to Aviation
The 1989-90 eruption of Redoubt Volcano in Alaska and the June 1991 eruption of MountPinatubo in the Philippines have resulted in over 16 aircraft damaged; mostly 747 seriescommercial aircraft. The following is quoted from Hufford (1991) reporting items of inter-est to aviation forecasters from the First International Symposium on Volcanic Ash andAviation Safety, held in Seattle, Washington 9-11 July 1991.
It is the forecaster who has the ultimate responsibility to accurately forecastand issue timely advisories on the movement of airborne volcanic debris. It wasthe experience of the forecasters in the Anchorage WSFO that there were de-ficiencies in information that greatly hampered their response. The forecasterhad no information on (1) ash particle size and concentration; (2) initial heightand horizontal extent of the ash plume into the atmosphere; (3) real-time ver-tical profile of the winds near and downstream of the volcano; and (4) rapidaccess to volcanic ash trajectory models.
Volcanoes and Ash
Volcanic eruptions that involve release of volcanic ash in the atmosphere havesome common characteristics. The first portion of the eruptive cloud columnjust above the volcano is called the gas thrust and protrudes 3000-6000 ftinto the atmosphere. This section of the column is a jet of material leavingthe volcano vent. It is characterized by rapid deceleration and loss of coarsevolcanic debris. The second portion of the column is called the convectivethrust zone characterized by acceleration of the gases and small particles dueto the heat energy. The ash/gas cloud ceases to accelerate vertically whenthe temperature of the cloud equals the ambient temperature of the air. Thefinal portion of the eruptive column is called the umbrella and it can push outhorizontally upwind as well as downwind. In the case of Mt. St. Helens, theumbrella pushed 40 km upwind--even farther upwind, for Mt. Pinatubo. It isimportant that the forecaster recognizes that volcanic ash can be upwind of the
3.1
volcano and includes this area in the advisory. There is no known technologyat this time that can be used to provide a reasonable estimate of the ash inthe eruptive column. Thus the concentration and particle size of the ash in aneruptive column is unknown.
Aircraft Damage
It is of interest to the forecaster to understand the damage airborne volcanicash can do to a jet engine. The following types of damage are listed in orderof importance:
1. Glassification of the ash and deposition on hot section components of theengine.
2. Erosion of compressor and turbine components by the ash.
3. Deposition on fuel nozzles and cooling parts (clogging).
4. Windshield crazing causing loss of visibility.
5. Deterioration of engine control system by electrical shorting, dogging ofsensors, etc.
The most critical problem is glassification of the ash. The modern jet engineruns at temperatures approaching 2000°F. This is well above the melting pointof silicate, a major component of ash. The ash enters the engine, melts andcoats the inside of the engine, covering nozzles, air vents, and other criticalcomponents. The engine quits running. Depending on concentration, thisshutdown can occur as quickly as 1 minute (the case of the KLM 747 incident150 km from Redoubt) or as long as 29 minutes (the recent case of a 7471200 km from Pinatubo).
The forecaster must be aware of the location and presence of ash in the atmo-sphere regardless of particle size. Concentration is more important. It was theconclusion of the air industry at the symposium that these areas must simplybe avoided at all costs. At this time there are no sensors onboard the aircraftto detect ash during flight. The only warning to the pilot is the presence of St.Elmo's fire around the windshield, wing tips and engines. This fire-like glowoccurs because of the static charge associated with each ash particle. If ashconcentration is high, the notice of St. Elmo's fire by the pilot may be too latefor the pilot to take evasive action and save the engines from damage.
Ash Detection
The technologies identified as most important in detecting, monitoring andtracking of airborne volcanic ash were satellite imagery, radar, doppler windprofilers and aviation reports (ACARS). Techniques have been developed toutilize NOAA AVHRR imagery to detect volcanic eruptive clouds in a varietyof weather, and both day and night. The techniques use multiple infrared
3-2
channels (bands 4 and 5) in the algorithms. In addition the imagery can beused to track the eruptive clouds as they move downwind. The use of weatherradar (5 cm) to detect ash in the eruptive cloud has been established thoughthere are some limitations; once the ash becomes dispersed and it consists ofvery small particles, the radar is unable to detect it. The radar's use is bestnear the volcano.
The wind profiler is an instrument that provides real-time winds near the vol-cano and at sites downwind. The air industry would like to see critical volcanoesinstrumented with wind profilers along with other sensing equipment. Readyaccess to aircraft winds and temperature (ACARS) are critical in providing theforecaster with information on the wind field in the atmosphere and the ulti-mate movement of volcanic ash. The airlines are now aware of the importanceof these data and are willing to make it available to the NWS in areas whereit is not presently available.
Ash Trajectory Forecasting
NOAA's Forecast Systems Laboratory has developed a Mesoscale Analysis andPrediction System (MAPS) for assimilating surface and tropospheric data everythree hours and providing nowcasting. It uses isentropic coordinates in thefree atmosphere and terrain-following coordinates near the ground. Isentropiccoordinates are well suited for trajectory calculations because air remains onthese surfaces in adiabatic flow. MAPS has been adapted for use in Alaska...
To provide for larger scale and longer term trajectories, the Air ResourcesLaboratory is developing a model to simulate ash transport. MAPS will providethe initial conditions and short-term forecast data. The larger scale and longerterm meteorological data will come from the NMC models. Dispersion and wetand dry deposition is included in the model. Output describes the ash cloudin both space and time. This model should be available to Alaskan forecastersthis winter.
Just before publication of this Handbook, it was learned that the NOAA Air ResourcesLaboratory (ARL) had developed a Volcanic Ash Forecast Transport and Dispersion (VAF-TAD) model (Western Region Headquarters 1992). If the user supplies the name of thevolcano, its location, time of the eruption and the height (in feet) of the volcanic ash cloud,the ash cloud is advected by a computer model on an IBM RISC System/6000 computerlocated at NOAA ARL in Silver Spring, MD. Gridded forecast data (from the NationalMeteorogical Center (NMC) Global Spectral Model (AVN)) out to 48-h (in 6-h intervals)are used to advect the ash cloud. The graphical product will be "faxed" to the requesterproviding concentration of ash, in four layers from the surface to 50,000 feet. Until modelruns become regular NMC products (estimated during the later part of 1993), direct anyoperational requests, to the appropriate regional Naval Oceanography Center of the NavalOceanography Command. The center will provide support via the appropriate laboratoryor the Navy's own model.
3-3
3.2 JTWC Bulletins (U. S. NOCC/JTWC 1992)
While the tLopical maritime climate of the Philippines can produce heavy convection,especially during the southwest monsoon, a tropical cyclone greatly enhances the intensityand the length of time of the rainfall, as well as the magnitude of the winds. To limit bothproperty and human life losses, local and regional planning dictates that the best forecaststhat modern technology permits must be provided. This section describes the bulletinspromulgated by the U. S. Naval Oceanography Command Center/Joint Typhoon WarningCenter (JTWC) in Guam. Following the presentation of TC forecasting philosophies, casehistories of recent tropical cyclones are presented.
In a following section, on case studies, graphical products available to units withinthe Department of Defense (DoD) via the Naval Oceanography Data Distribution System(NODDS) are described. However, forecasters should know the bulletin headings used byJTWC to deliver alphanumeric messages regarding tropical cyclones1 . In particular, NavalOceanography Command (NOC) personnel should be prepared to interpret and explainthe bulletins to the commands supported. The possibility of random behavior of tropicalcyclone movement dictates that JTWC issue timely alerts and warnings to support theFleet, other units of DoD, U. S. territories, and, indirectly, other affected nations andislands in the western Pacific. Table 3.1 from U. S. NOCC/JTWC (1992) lists the relevantmessages issued by JTWC useful in supporting operations in the Philippine Islands andthe western North Pacific Ocean.
The Significant Tropical Weather Advisory, issued by 0600Z daily, describes thelatest tropical cyclone warnings, if any, as well as all tropical disturbances and their po-tential for further development. This advisory may be reissued if the situation warrants.The potential for further development of each suspect area is described by:
"* Poor - Meteorological conditions are currently unfavorable for development.
"* Fair - Meteorological conditions are favorable for development, but significant devel-opment has not commenced or is not expected to occur in the next 24 hours.
"* Good - Potential for development of a disturbance is covered by an alert.
"Tropical Cyclones are classified as follows: Tropical depression (TD) <34 kt, tropical storm (TS)34-63 kt, typhoon (TY) 64-129 kt and super typhoon (ST) > 130 kt. (Winds are 1-minute averaged sustainedwinds.)
3-4
The Tropical Cyclone Formation Alert (TCFA) is issued whenever interpretationof satellite imagery or other meteorological data indicates that formation of a tropicalcyclone is likely. The alert is valid for a period not to exceed 24 hours and must becanceled, reissued or superseded by a warning prior to expiration.
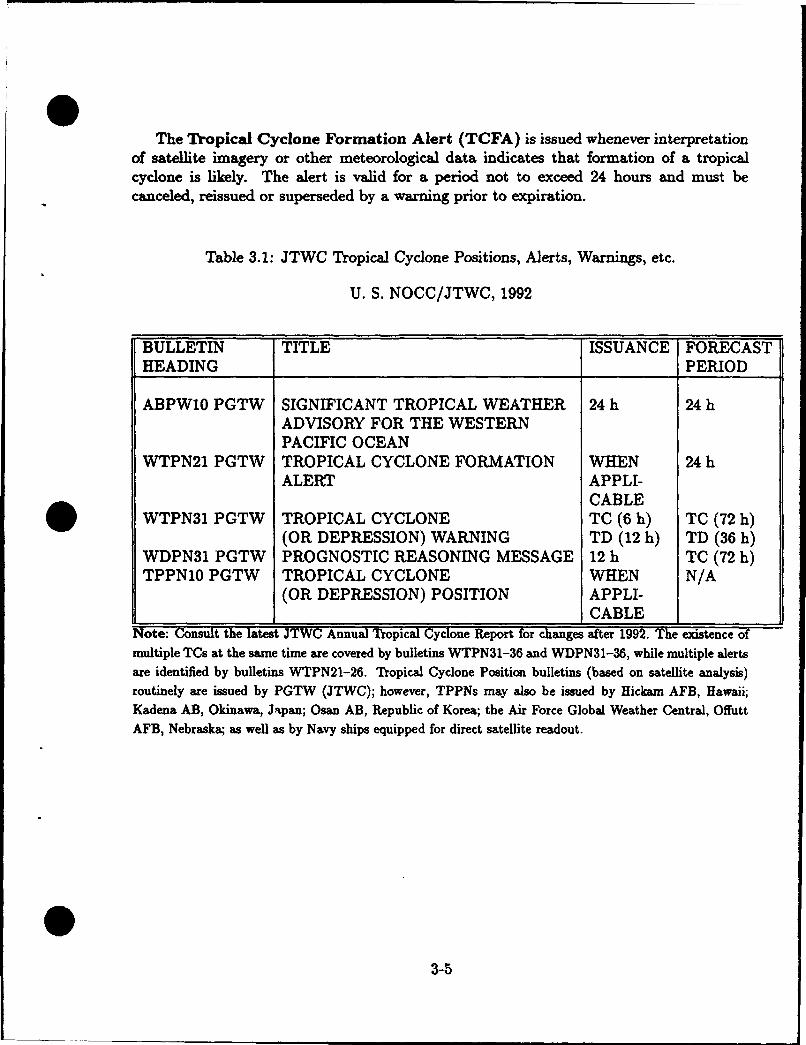
Table 3.1: JTWC Tropical Cyclone Positions, Alerts, Warnings, etc.
U. S. NOCC/JTWC, 1992
BULLETIN TITLE ISSUANCE FORECASTHEADING PERIOD
ABPW10 PGTW SIGNIFICANT TROPICAL WEATHER 24 h 24 hADVISORY FOR THE WESTERNPACIFIC OCEAN
WTPN21 PGTW TROPICAL CYCLONE FORMATION WHEN 24 hALERT APPLI-
CABLEWTPN31 PGTW TROPICAL CYCLONE TC (6 h) TC (72 h)
(OR DEPRESSION) WARNING TD (12 h) TD (36 h)WDPN31 PGTW PROGNOSTIC REASONING MESSAGE 12 h TC (72 h)TPPN10 PGTW TROPICAL CYCLONE WHEN N/A
(OR DEPRESSION) POSITION APPLI-_CABLE I
Note: Consult the latest JTWC Annual Tropical Cyclone Report for changes after 1992. The existence of
multiple TCs at the same time are covered by bulletins WTPN31-36 and WDPN31-36, while multiple alertsare identified by bulletins WTPN21-26. Tropical Cyclone Position bulletins (based on satellite analysis)routinely are issued by PGTW (JTWC); however, TPPNs may also be issued by Hickam AFB, Hawaii;
Kadena AB, Okinawa, Japan; Osan AB, Republic of Korea; the Air Force Global Weather Central, OffuttAFB, Nebraska; as well as by Navy ships equipped for direct satellite readout.
3-5
The Tropical Cyclone Warning is issued when a closed circulation is evident andmaximum sustained winds are forecast to reach 34 kt within 48 hours, or when the TC isin such a position that life or property may be endangered. Each tropical cyclone warningis numbered sequentially and includes the following:
"* Current position of the surface center
"* An estimate of the position accuracy and the supporting reconnaissance (fix) plat-forms
"* The direction and speed of movement during the past six hours
"* The intensity and radial extent of over 35-, 50- and 100-kt surface winds, whenapplicable2 .
"* At forecast intervals of 12, 24, 36, 48 and 72 hours, information on the TC's antici-pated position, intensity and wind radii3
"* Vectors indicating the mean direction and mean speed between forecast positions
"* Additionally, a 3-hour extrapolated position is provided in the remarks section.
The Tropical Depression (TD) Warning is issued for TDs that are not expected toreach the criteria for tropical cyclone warnings, as mentioned above. It contains the sameinformation as a tropical cyclone warning except the TD warning is issued every 12 hoursand extends only to the 36-hour forecast.
The Prognostic Reasoning Message (WDPN) provides meteorologists with therationale for the forecasts. Importantly, they also discuss alternate4 forecast scenarios.NOC personnel can present more descriptive briefings by using the material presented inthis message. These bulletins are required every 12 hours for western North Pacific tropicalcyclones, but are frequently provided every 6 hours (Guard et al. 1992).
The Tropical Cyclone "Satellite" Position (TPPN) is transmitted between theformal warnings and alerts. NOC personnel may find this bulletin useful in perceiving theevolution of the intensity, track and wind radii of respective tropical cyclones, even beforereceiving the official warning from JTWC.
2A 30-kt radius (vice 35-kt radius) was used before 1992.'Before 1992, the 36 hour forecast was omitted.4Several objective aids are available to the the Typhoon Duty Officers at JTWC for use in preparing the
final official forecast. At times the climatology-based and the dynamically-based objective aids differ. W
3-6
3.3 JTWC Forecasting Philosophies
Forecasters in the Philippine Islands and at JTWC are deeply interested in the formation,movement and intensity of tropical cyclones. The environmental conditions used to forecastthese three features are now described.
3.3.1 Formation
Using satellite and conventional data, the forecaster can anticipate the formation of atropical cyclone by being alert to the existence of the following necessary, but not sufficientconditions (Elsberry et al. 1987):
"* Sea surface temperature >26.5°C.
"* Large sustained cloud clusters identified by satellite, indicating weak vertical windshear and large mid-level moisture.
"* Low-level cyclonic circulation, identified by synoptic reports or satellite imagery.
1. This feature is enhanced by the commencement of the Southern Hemispherewinter which provides low-level cross-equatorial southerly winds which are de-flected to the right to become the westerly flow providing the cyclonic shearwith the easterly trade winds located to the north. The area identified by thiscyclonic shear is commonly called the monsoon trough.
2. Residual cyclonic shear associated with an equatorward moving front (or shearline) may also provide the low-level circulation or cyclonic shear.
"* Mean upward motion in the vicinity of the disturbance. This condition may beidentified by anticyclonically curved cirrus on satellite imagery. As identified in thesouthwest monsoon section, the tropical upper tropospheric trough (TUTT) is oftenpresent over the Pacific Ocean near 200 mb. Cyclonic centers, "cells", within theTUTT, often have diffiuent flow, immediately to their east, providing the neededdivergence aloft.
3.3.2 Movement
The task of separating the tropical cyclones that move straight toward the west or north-west before making landfall in Asia from the tropical cyclones that recurve5 toward thenortheast (i.e., come under the steering of the mid-latitude "westerlies") is a very difficulttask, indeed.
'Convention dictates that TCs undergoing even their first change of direction into the mid-latitude west-erlies, i.e., their direction of movement changes from NW to N to NE (poleward of the axis of the mid-tropospheric subtropical ridge), be called "recurvers".
3-7
"* Most TCs have their genesis within the monsoon or near-equatorial trough, and areinitially transported (or steered) in a generally westward or north-westward direction.This drift toward the northwest can be shown to be the result of the variation ofthe Coriolis Parameter6 with latitude (known as the "beta"-effect'), but will not bediscussed here.
"* However, as the TC drifts farther poleward, it crosses the axis of the subtropicalridge or moves around the western periphery of the subtropical ridge, and then issteered (or advected) by the flow in the mid-tropospheric "westerlies".
" Whenever synoptic-scale troughs from the mid-latitudes (or extratropics) extendequatorward (or disrupts the dominance of the subtropical ridge), then the embeddedTC is expected to be steered-at least initially-more northward, and eventually withan eastward component. The approach of an extratropical trough (normally from thewest) can be forecast by synoptic experience, judgement, and satellite interpretation,but most often the forecaster relies upon the prognoses of numerical models to predictthe position of the troughs, especially in 36, 48 and 72 hours.
"* Even in the absence of an identifiable approaching upper-level trough, the forecasteris often presented with a prognosis of a numerical model which depicts the retreatof the subtropical ridge to the east (a condition that might prompt the forecast of"recurvature") or of the penetration of the subtropical ridge farther westward (acondition that would suggest that the TC follows a straighter track).
"* As discussed in the formation section above, TCs often form within the monsoontrough. This trough normally lies on an axis from near the central Philippines (theVisayas) extending toward the southeast. Subsequently, vortices developing alongthis axis typically move toward the northwest, in the direction of the PI. However,during the northern hemisphere summer there are periods when the monsoon axisrotates counterclockwise, and thus lies on an axis extending northeastward fromthe Visayas. Tropical cyclones developing in this anomalously oriented monsoontrough frequently move initially toward the northeast, and thus are often to thenorth of the PI before commencing their movement toward the northwest (MarkLander (1990, personal communication)). In addition, in August the monsoon troughgenerally moves northward with the sun, leading to cyclone development north ofthe Philippine Islands.
"* The Typhoon Duty Officers (TDOs) at JTWC are provided with movement objectiveaids displayed in Table 3.2. In combination with the #-effect, the last three aids inthe table provide the option of using steering from deep or shallow layers.
6Coriolis Parameter, f = 2 -. sine where: 11 = Earth's rotation rate and 4 = *Latitude.
7 Beta = p f / Z y..
3-8
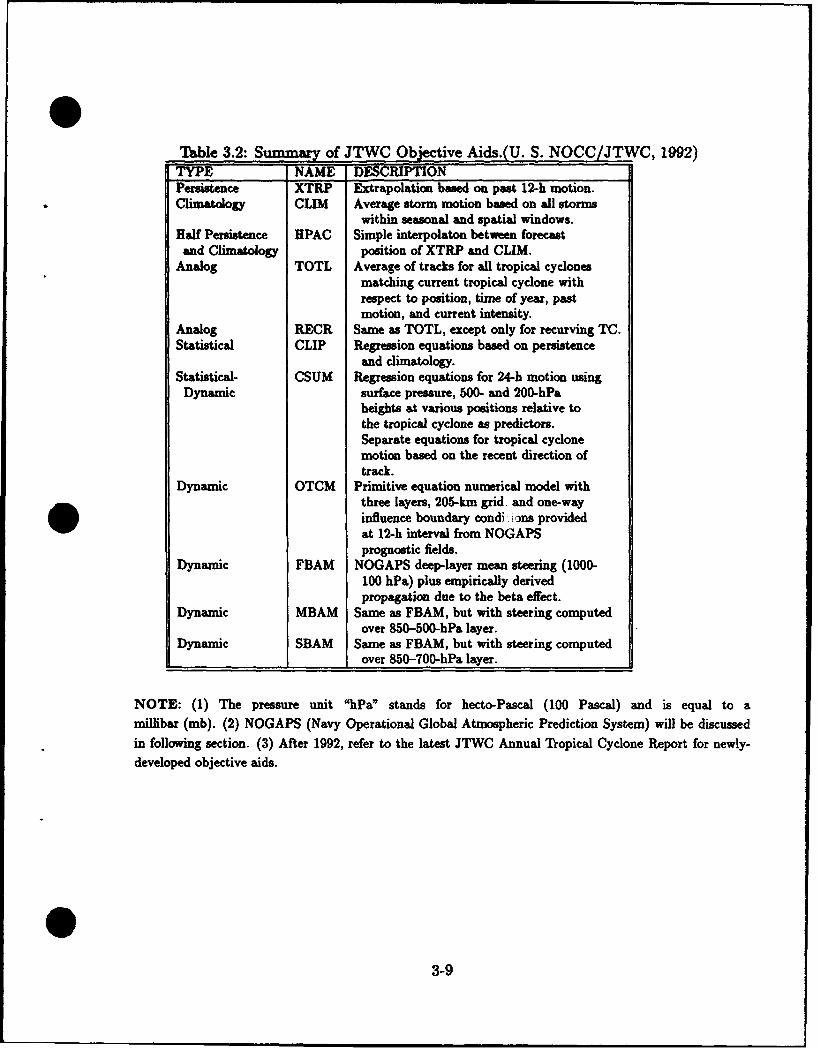
Table 3.2: Summary of JTWC Objective Aids.(U. S. NOCC/JTWC, 1992)TYPE NAME DESCRIPTIONPersistence XTRP Extrapolation based on past 12-h motion.Climatology CLIM Average storm motion based on all storms
within seasonal and spatial windows.Half Persistence HPAC Simple interpolaton between forecast
and Climatology position of XTRP and CLIM.Analog TOTL Average of tracks for all tropical cyclones
matching current tropical cyclone withrespect to position, time of year, pastmotion, and current intensity.
Analog RECR Same as TOTL, except only for recurving TC.Statistical CLIP Regression equations based on persistence
and climatology.Statistical- CSUM Regression equations for 24-h motion using
Dynamic surface pressure, 500- and 200-hPaheights at various positions relative tothe tropical cyclone as predictors.Separate equations for tropical cyclonemotion based on the recent direction oftrack.
Dynamic OTCM Primitive equation numerical model withthree layers, 205-km grid, and one-wayinfluence boundary condi :'ons providedat 12-h interval from NOGAPSprognostic fields.
Dynamic FBAM NOGAPS deep-layer mean steering (1000-100 hPa) plus empirically derivedpropagation due to the beta effect.
Dynamic MBAM Same as FBAM, but with steering computedover 850-500-hPa layer.
Dynamic SBAM Same as FBAM, but with steering computedI over 850-700-hPa layer.
NOTE: (1) The pressure unit "hPa" stands for hecto-Pascal (100 Pascal) and is equal to amillibar (mb). (2) NOGAPS (Navy Operational Global Atmospheric Prediction System) will be discussedin following section. (3) After 1992, refer to the latest JTWC Annual Tropical Cyclone Report for newly-developed objective aids.
3-9
"* There is a documented reaction between tropical cyclones that are <750 n.mi. apart.This effect, known as the Fujiwhara effect, and more recently as binary interaction, isoften visible as the weaker tropical cyclone is steered cyclonically around the stronger.The effect upon equally strong TCs is more easily perceived when their positions areplotted relative to the mid-point (or "centroid") on the line connecting the twotropical cyclones. Both TCs will then exhibit a component of motion cyclonicallyaround the centroid. (JTWC has developed a computer program to calculate thedegree of the Fujiwhara effect and to provide a CLIPER-like forecast of the resultanttyphoon track.)
" Unfortunately, the forecasters of tropical cyclone motion must accept the existenceof TCs that exhibit large directional changes in motion over short periods of time.These cyclones represent a small percentage of the total; however, they may changedirection or loop, often several times. Fortunately, the subtropical ridge is typicallylocated north of the Philippine Islands, providing TC movement in a general west-ward direction. However, this does not negate the possibility of a looper over theLuzon Strait, the South China Sea or wherever!
3.3.3 Intensity
The evolution of the intensity (maximum one-minute sustained winds) of a tropical cyclone,while often "normal" in its developing or weakening, can also be erratic and difficult to Wforecast, as well as to analyze. Since the U. S. Air Force ceased aircraft reconnaissanceflights in 1987 (the U. S. Navy had ceased its operations in 1971), JTWC must primarilyuse satellite imagery to determine tropical cyclone intensity. (Satellite imagery is alsothe primary tool for determining location, although limited radar reports and synopticobservations provide a minimal, but important, contribution.)
* Forecasters having satellite imagery-preferably enhanced infrared (IR) imagery-available can perform their own wind analysis/forecast using the Dvorak technique.The technique uses both visible and IR cloud feature measurements and rules basedon a model of tropical cyclone development to arrive at the current and 24-hourintensity of the TC. For example, the model would describe a normally develop-ing tropical cyclone as having a T-number (Tropical number) T1 on day one, T2on day two, etc. After the analyst has determined the final T-number, rules as-sist the analyst in the determination of a Current Intensity (CI) number (see Ta-ble 3.3 for the empirical relationship between the Current Intensity number (CI)and the maximum wind speed (MWS) for tropical cyclones in the western NorthPacific Ocean). The Dvorak technique dictates that the T-number and CI num-ber be the same for developing or steady TCs. However, the CI is held higherthan the T-number while a cyclone is weakening. This scheme is used because alag is observed between the time a TC pattern indicates that weakening has be-gun and the time when the storm's intensity has actually decreased, i.e., the sur- W
3-10
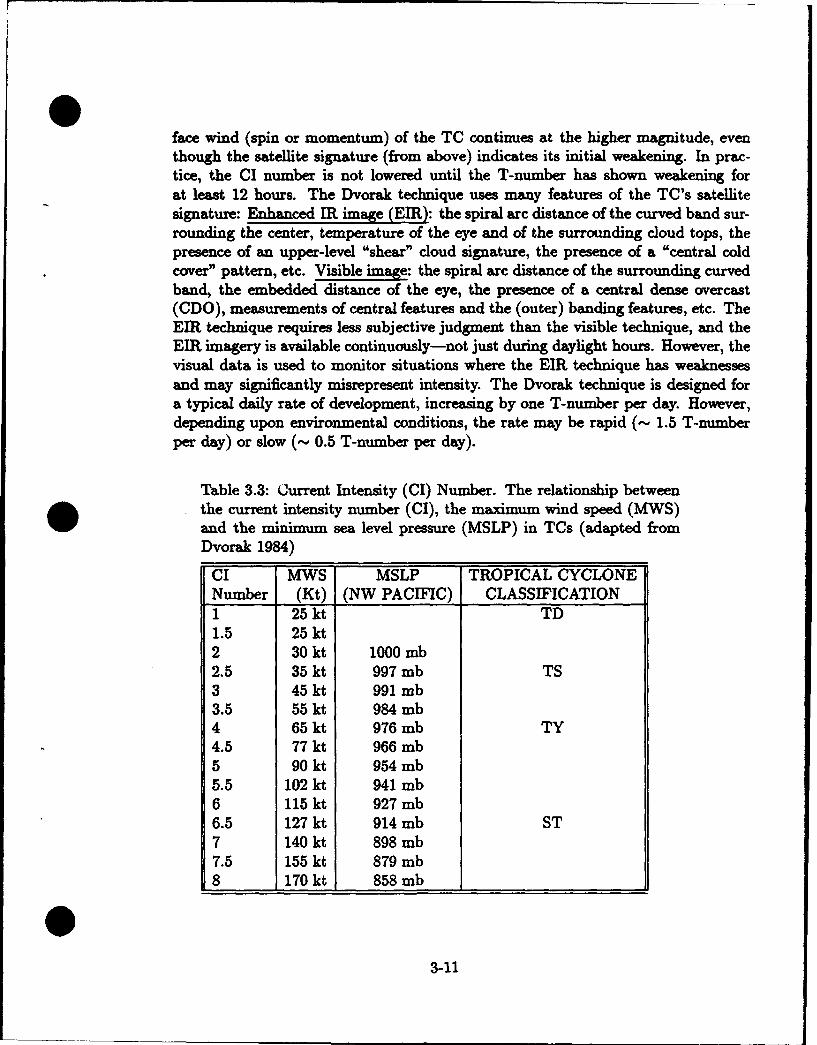
face wind (spin or momentum) of the TC continues at the higher magnitude, eventhough the satellite signature (from above) indicates its initial weakening. In prac-tice, the CI number is not lowered until the T-number has shown weakening forat least 12 hours. The Dvorak technique uses many features of the TC's satellitesignature: Enhanced IR image (EIR): the spiral arc distance of the curved band sur-rounding the center, temperature of the eye and of the surrounding cloud tops, thepresence of an upper-level "shear" cloud signature, the presence of a "central coldcover" pattern, etc. Visible image: the spiral arc distance of the surrounding curvedband, the embedded distance of the eye, the presence of a central dense overcast(CDO), measurements of central features and the (outer) banding features, etc. TheEIR technique requires less subjective judgment than the visible technique, and theEIR imagery is available continuously-not just during daylight hours. However, thevisual data is used to monitor situations where the EIR technique has weaknessesand may significantly misrepresent intensity. The Dvorak technique is designed fora typical daily rate of development, increasing by one T-number per day. However,depending upon environmental conditions, the rate may be rapid (- 1.5 T-numberper clay) or slow (-• 0.5 T-number per day).
Table 3.3: Current Intensity (CI) Number. The relationship betweenthe current intensity number (CI), the maximum wind speed (MWS)and the minimum sea level pressure (MSLP) in TCs (adapted fromDvorak 1984)
CI MWS MSLP TROPICAL CYCLONENumber (Kt) (NW PACIFIC) CLASSIFICATION1 25 kt TD1.5 25 kt2 30 kt 1000 mb2.5 35 kt 997 mb TS3 45 kt 991 mb3.5 55 kt 984 mb4 65 kt 976 mb TY4.5 77 kt 966 mb5 90 kt 954 mb5.5 102 kt 941 mb6 115 kt 927 mb6.5 127 kt 914 mb ST7 140 kt 898 mb7.5 155 kt 879 mb8 170 kt 858 mb I
3-11
Obviously, allowance must be made for long-lived TCs whose history extend beyondthe typical development period of 4-6 days. While a complete description of theDvorak Technique cannot be given in this handbook, interested forecasters are re-ferred to Dvorak (1984). Below are two examples of Dvorak classifications includedin TPPN bulletins:
T4.0/4.0/D1.0/24hrs
Decoded: T-number = 4.0, CI number = 4.0 (65 kt, typhoon, see Table 3.3)Indication of ongoing change (BLANK), i.e., past trend continuingD = Developing (Past change), 1.0 = Amount of past change, +1.0 T-number24 hrs = hours since previous observation.
T5.0/6.OMINUS/WI.5/24hrs
Decoded: T-number = 5.0, CI number = 6.0 (115 kt, typhoon)MINUS = Rapid weakening (Indication of ongoing change)W = Weakening (Past change), 1.5 = Amount of past change, -1.5 T-number24 hrs = hours since previous observation.
. The following are environmental conditions expected to increase the intensity of themaximum sustained winds of a tropical cyclone.
1. Colder tops in the clouds surrounding the TC center and/or warmer eye tem-peratures (Dvorak 1984). These conditions indicate greater convection (upwardvertical motion) in the towers surrounding the TC center and greater subsidenceinto the eye of the TC.
2. Larger spiral arc distance of the curved band around the TC (Dvorak 1984).
3. The TC enters a region of increased diffluence aloft. This is often indicated bythe presence of multiple outflow channels, i.e., the greater outflow of mass aloftleads to a larger fall in the sea level pressure at the TC's surface center furtherleading to larger magnitude inflow (larger winds) at the surface. The multipleoutflow channels are often directed toward cyclonic cells in nearby branches ofa TUTT.
4. The TC approaches a region of weaker vertical wind shear.
5. The TCs exits a land area and begins a track over water with its associatedsmaller surface friction and added latent (and sensible) heat to fuel the tropicalcyclone.
6. The TC enters an oceanic area with a higher sea surface temperature (SST), mthus experiencing additional availability of latent and sensible heat.
3-12

7. The TC departs a large-scale area of low-level stratus or stratocumulus clouds.This would generally indicate that the TC is leaving a region of lower SST andatmospheric subsidence-this situation is more common in the eastern NorthPacific where colder SST is found.
* The following are environmental conditions expected to decrease the intensity of themaximum sustained winds of a tropical cyclone.
1. Warmer tops in the clouds surrounding the TC center and/or colder eye tem-peratures (Dvorak 1984). These conditions indicate less convection (less upwardvertical motion) in the towers surrounding the TC center and less subsidenceinto the eye of the TC.
2. Smaller spiral arc distance of the curved band around the TC center (Dvorak1984).
3. The TC approaches a region of larger vertical wind shear. This may happen inthe tropics, but is most common when the TC moves poleward and approachesthe jet streams of the extratropics. It may also be manifested by southward-moving cirrus appearing less than 100 latitude to the north or west of the stormor a broadscale cyclonically curved cloud band within 25° latitude of a westwardmoving disturbance (or TO) (Dvorak 1984).
4. The TC enters a region of decreased diffluence (or a region of increased conflu-ence) aloft. This is often associated with the condition of larger vertical windshear, i.e., the outflow reduces to one unidirection channel or the efficiency ofoutflow channels is decreased.
5. The TC approaches land with its associated increase in surface friction andlatent and sensible heat loss.
6. The TC enters an oceanic area with a lower sea surface temperature (SST) thusexperiencing a loss of latent heat.
7. The TC enters an area of low-level stratus or stratocumulus clouds, which isoften associated with colder SST and greater low-level stability.
8. The TC begins to draw in cooler and dryer environmental air. However, asthe colder air reaches the eyewall region, it can increase baroclinicity across theeyewall, causing a large but short-lived intensification (Guard 1992, personalcommunication).
3-13
3.4 Recent Tropical Cyclones Striking the PhilippineIslands
3.4.1 Typhoons striking Luzon
Typhoon Yunya, 11-17 June 1991-including the Mount Pinatubo Eruption
The track of Typhoon Yunya, classified as a "Midget" typhoon, is shown in Fig. 3.1.As the legend indicates, Typhoon Yunya made landfall on Luzon, just south of Baler(see Fig. 1.2) at minimal typhoon strength (65 kt). Figure 3.2 indicates that after thetwo forecasts on 13 June, the official JTWC forecast accurately predicted the track ofYunya across central Luzon. The figure also shows that the recurvature was more rapid,than forecast, as the tropical cyclone departed Luzon heading toward the Luzon Strait.Additionally, note in Fig. 3.3, that the JTWC (see the track labeled JTWC) forecastaccurately predicted the subsequent track over central Luzon as early as OOOOZ on 14 June.The JTWC forecast followed the simpler guidance from the climatology aid (CLIM), theColorado State regression equation model aid (CSUM) and the steering-type dynamicalaid (FBAM) (see Table 3.2). It is evident that JTWC had to discount the track forecastfrom the large dynamic models (OTCM, NGPS (U. S. Navy's FNOC NOGAPS Model),JTYM (Japanese Meterological Agency Typhoon Model) and EGRR (the United KingdomMeterological Office Model)) all of which predicted premature recurvature. It appears thatthis problem is endemic to the current generation of vortex-tracking numerical models,i.e., these models have difficulty in describing the interaction between a small TC and itspenetration of the subtropical ridge. Despite a slow speed bias of the JTWC forecasts (notshown), the forecasts that Yunya would cross central Luzon provided key warning supporthelping DoD officials to evacuate Clark Air Base.
This tropical cyclone formed as the surface winds in the South China Sea had changedto southwesterly-i.e., the southwest monsoon had just formed-, with the associatedreturn flow aloft at 200 mb from the northeast. The timing of the arrival of Yunya wasmost unfortunate. If Yunya had not arrived on 15 June, much of the low-level ash fromthe Mount Pinatubo volcano would have been advected toward the north (away from U. S.Navy units in Subic Bay) and the upper-level flow would have carried the higher level ashtoward the southwest (over the South China Sea and west of Subic Bay). Unfortunatelythe deep cyclonic circulation of Yunya swept much of the volcanic ash toward Subic Bayand Manila. The heavy rains and the weight of the ash led to the collapse of roofs and thesubsequent loss of life (U. S. NOCC/JTWC 1992).
3-14
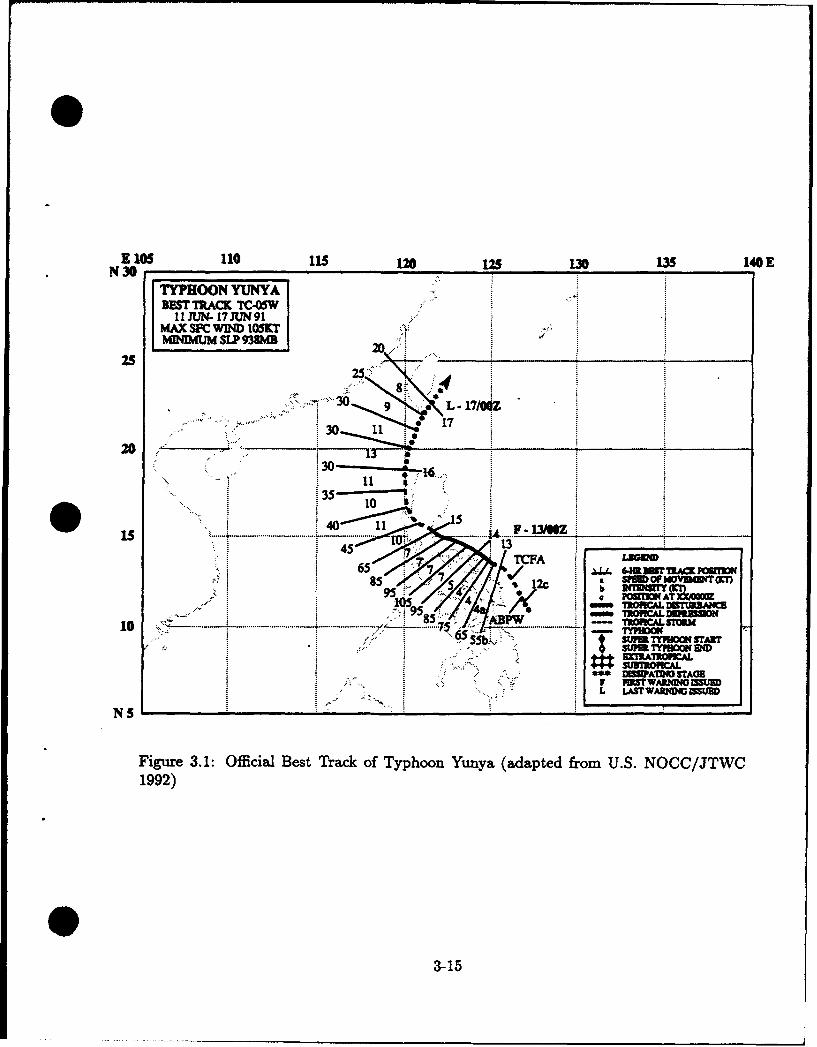
E AS 110 115 I" V5 130 135 140 ES N 30
TYPHOON YUNYA .•BS•T TRACK TC-05W
I1 IIUN- 17AUN 91.U " SLP "aJmB
S.... 20. "
25 "- ..o _ _ _25. 8
-30
20 ..30
1014""~ -LV- Io).
is .. • _ .... ......... ...... .......... . ... .....• A.A6.1 * 11 6OmI1
as56• - 8'S 12€ a sin~oFwovinITr95 S4 b DOFTZYS~rO
4 .... " ,.; K -.. POIlOK.95 ,0 - TROMlALDTO33ANM
10 ......................... 7 . .... . ..-- P T-
~SUMTYmHOOK34:** D5UPATDSTAGE
V BwWARl4NGEIRuL LASTTWARINDIO3SUED
N$S
Figure 3.1: Official Best Track of Typhoon Yunya (adapted from U.S. NOCC/JTWC1992)
3-15
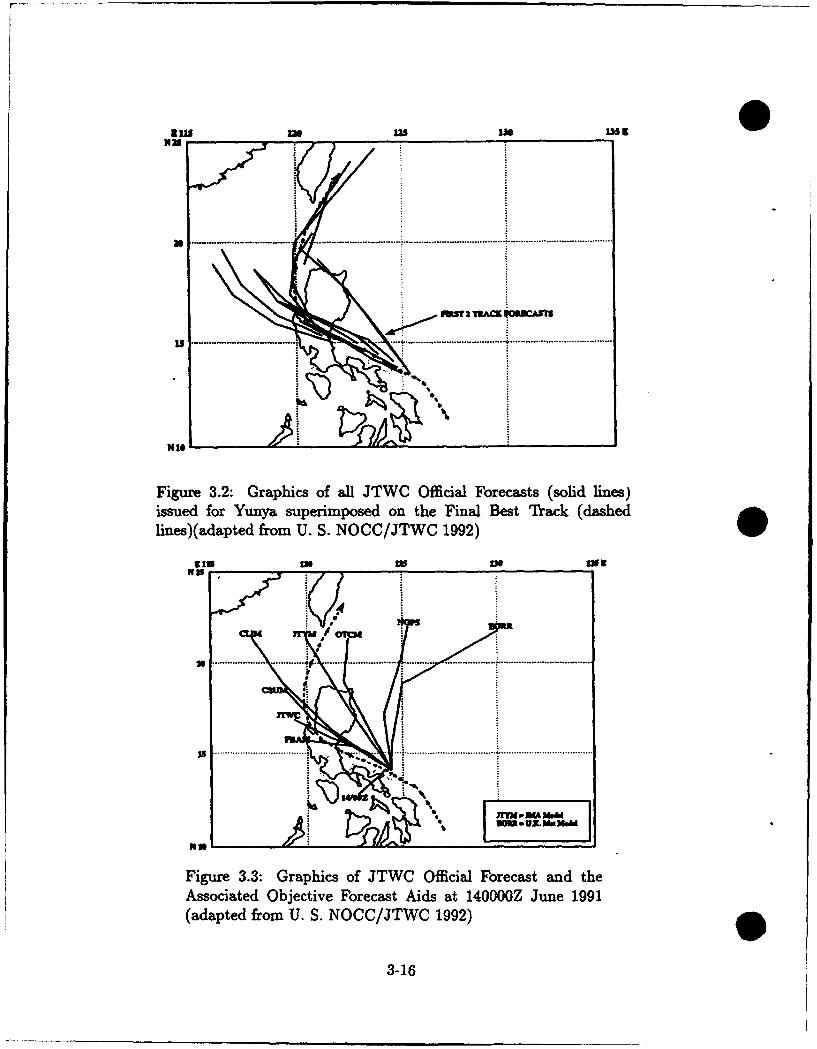
sin1 no12 IMO Ing
Is- -- .......... .
HiS • U. '3 •
Nis I
Figure 3.2: Graphics of all JTWC Official Forecasts (solid lines)issued for Yunya superimposed on the Final Best Track (dashedlines)(adapted from U. S. NOCC/JTWC 1992)
NM
4
3.. ...........................................
Ns --
Figure 3.3: Graphics of JTWC Official Forecast and theAssociated Objective Forecast Aids at 140000Z June 1991(adapted from U. S. NOCC/JTWC 1992)
3-16
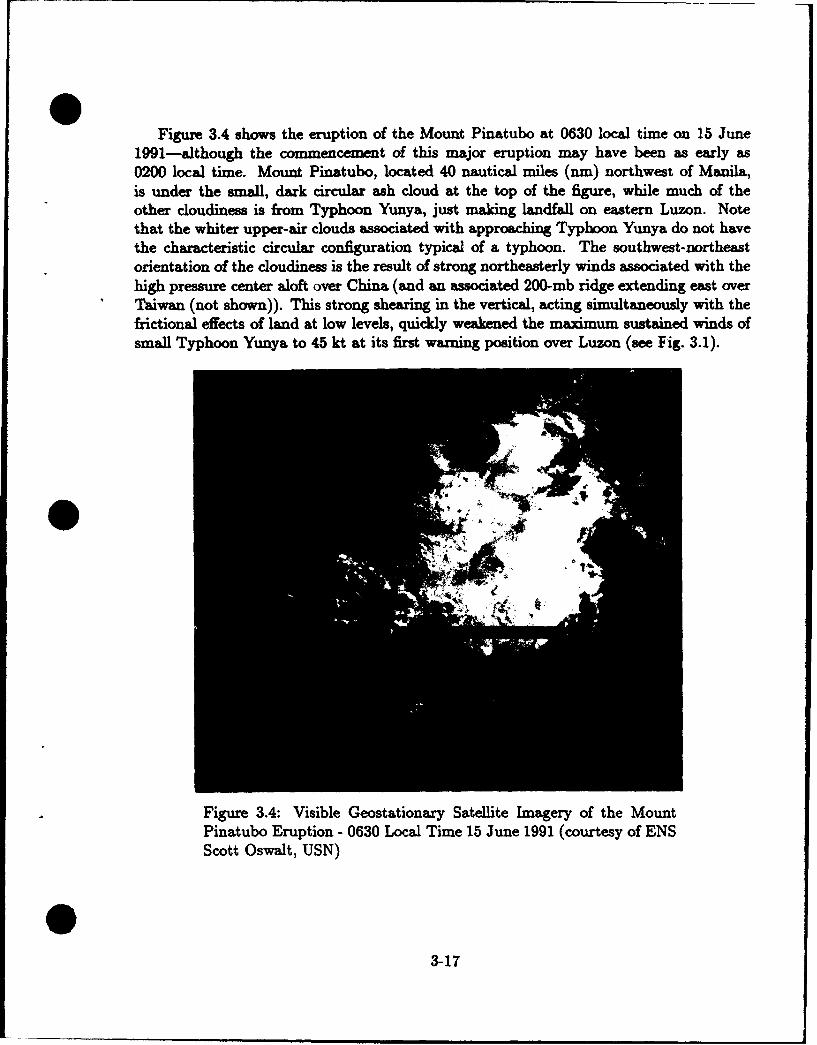
Figure 3.4 shows the eruption of the Mount Pinatubo at 0630 local time on 15 June1991-although the commencement of this major eruption may have been as early as0200 local time. Mount Pinatubo, located 40 nautical miles (nm) northwest of Manila,is under the small, dark circular ash cloud at the top of the figure, while much of theother cloudiness is from Typhoon Yunya, just making landfall on eastern Luzon. Notethat the whiter upper-air clouds associated with approaching Typhoon Yunya do not havethe characteristic circular configuration typical of a typhoon. The southwest-northeastorientation of the cloudiness is the result of strong northeasterly winds associated with thehigh pressure center aloft over China (and an associated 200-mb ridge extending east overTaiwan (not shown)). This strong shearing in the vertical, acting simultaneously with thefrictional effects of land at low levels, quickly weakened the maximum sustained winds ofsmall Typhoon Yunya to 45 kt at its first warning position over Luzon (see Fig. 3.1).
Figure 3.4: Visible Geostationary Satellite Imagery of the MountPinatubo Eruption - 0630 Local Time 15 June 1991 (courtesy of ENSScott Oswalt, USN)
3-17
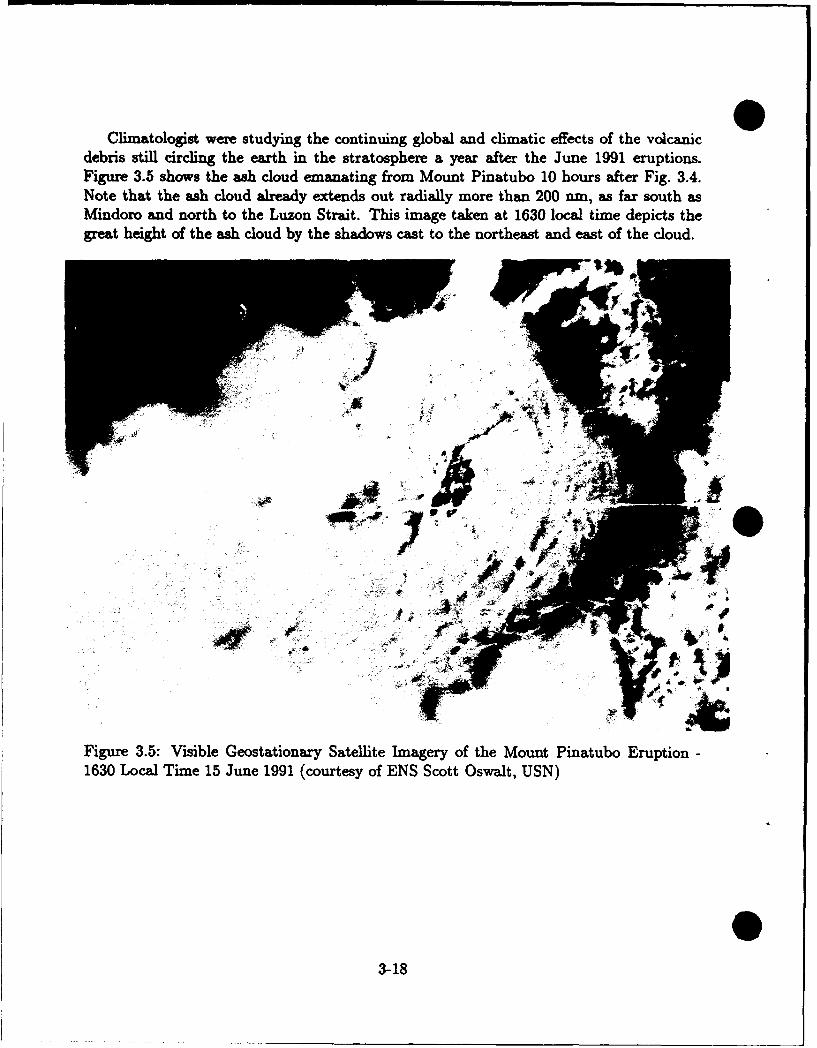
Climatologist were studying the continuing global and climatic effects of the volcanicdebris still circling the earth in the stratosphere a year after the June 1991 eruptions.Figure 3.5 shows the ash cloud emanating from Mount Pinatubo 10 hours after Fig. 3.4.Note that the ash cloud already extends out radially more than 200 nm, as far south asMindoro and north to the Luzon Strait. This image taken at 1630 local time depicts thegreat height of the ash cloud by the shadows cast to the northeast and east of the cloud.
.. •r9V or.
Figure 3.5: Visible Geostationary Satellite Imagery of the Mount Pinatubo Eruption -1630 Local Time 15 June 1991 (courtesy of ENS Scott Oswalt, USN)
3-18
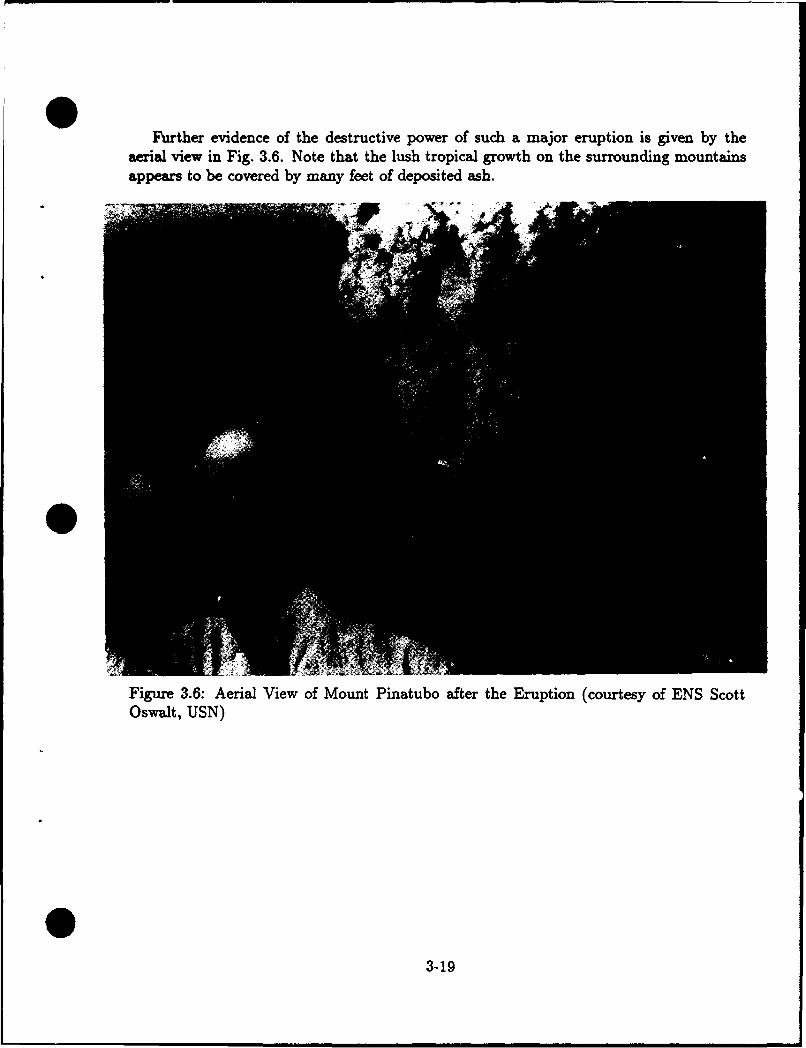
Further evidence of the destructive power of such a major eruption is given by theaerial view in Fig. 3.6. Note that the lush tropical growth on the surrounding mountainsappears to be covered by many feet of deposited ash.
pI
Figure 3.6: Aerial View of Mount Pinatubo after the Eruption (courtesy of ENS ScottOswalt, USN)
3-19

Typhoon Becky, 20-30 August 1990
The tropical disturbance that evenually became Typhoon Becky originated within the sur-face monsoon trough (not shown), when upper-level divergence (associated with a TUTTto its north) developed. As the final best track in Fig. 3.7 indicates, Typhoon Becky fol-lowed a near westward track during its lifetime, although the Philippine forecaster mayhave anticipated that the typhoon might recurve as it was upgraded to a tropical storm atOOOOZ on 25 August (see Fig. 3.7). Sixty hours earlier, the deep layer mean circulation anal-ysis (another product provided to JTWC by FNOC) displayed in Fig. 3.8 showed Beckyapproaching southerly steering flow over the Philippine Islands with a low centers presentover southeastern China, west of Taiwan. However, by 1200Z on 25 August (Fig. 3.9) thedeep layer mean circulation analysis showed that the trough had moved eastward and filled(weakened), as it became the neutral point, just southwest of Japan. Thus Becky cameunder the influence of stronger westward steering and accelerated, making landfall on thenorthern Luzon coast while moving at 12 kt (see Fig. 3.7).
8Comparisons between pressure analyses and streamline analysis: (L)ow = (C)yclonic center; (H)igh(A)nticyclonic center; Col = Neutral point 'x<. 0 = Tropical Storm symbol and = Typhoon symbol.
3-20
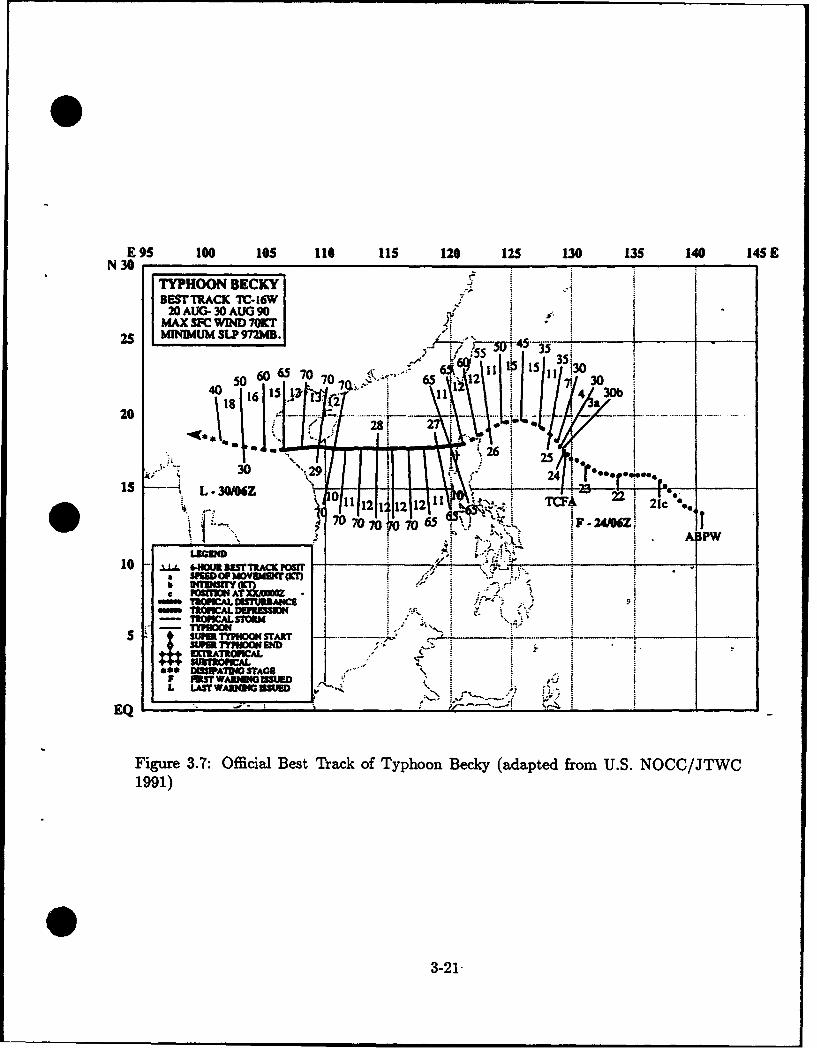
E 95 100 105 110 115 120 125 130 135 140 145 EN 3 0 . ,
TYPHOON BECKYBESTtRACK TC- 16W
20 AUG- 30 AUG 90MAX SEC WfIND 70[CT7
25 MINMUM SLP 97214B.,4.
50 -35
70 70 65 12 3040 16 15 .2 114 30b
20 .: ,-........ ... .V....... ....
i ~ ~ ~ 9 2A *%•- "
707,0mo.t'rxo65• 5 'I :~ ""1c".*.S. "-24 AP,
10l 21 OI 112 11"' _ 21c
70I70 5 o r -F.4
** , D WVIA•h .STAGS ,,-'-V PSTWARUIa INOUSU-.D "I..-• •L ,LA$' WARINIOK SW "- ., ; .,.
Figure 3.7: official Best Track of Typhoon Becky (adapted from U.S. NOCC/JTWC
1991)
3-21
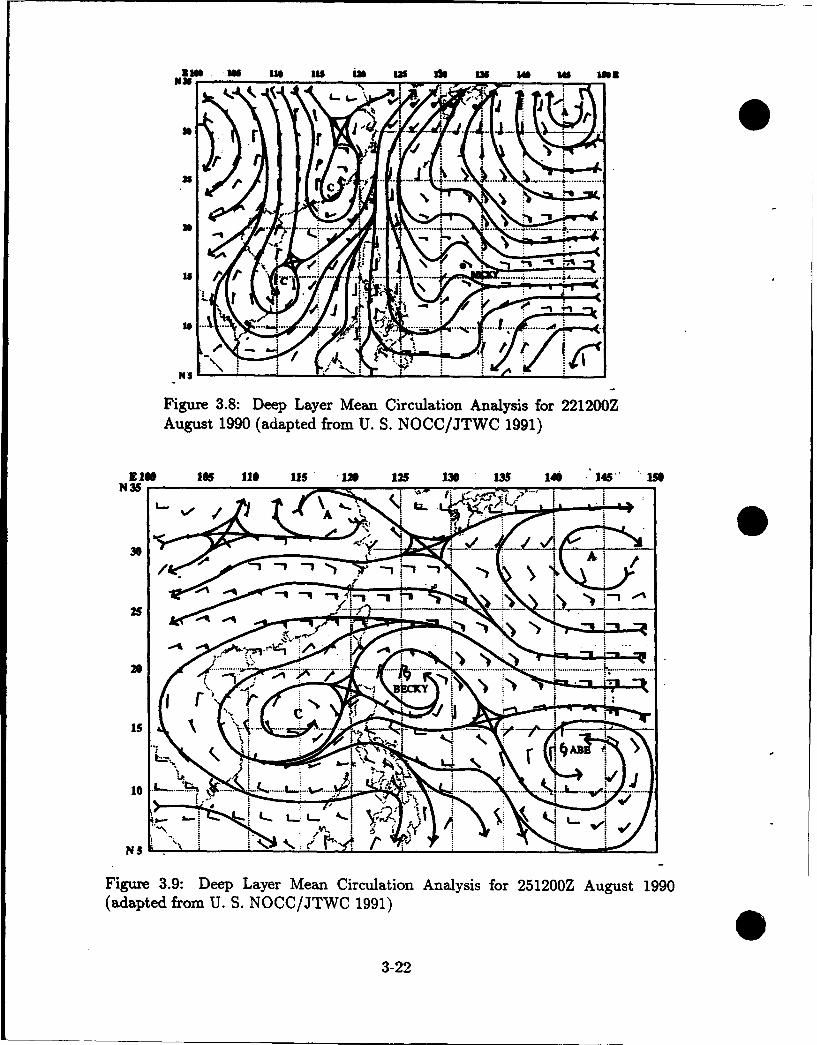
iam , 1o uW Sl i 1 u do in 1* so MS
r r1
25 ~~.4........
3C
,...........
" .. . ......... A.
Figure 3.8: Deep Layer Mean Circulation Analysis for 221200ZAugust 1990 (adapted from U. S. NOCC/JTWC 1991)
R 1is Is 110 11S " 122 125 130 1i 146 345' 151"..35 .
3.
25
'• ~322 .:. ..
20 .......... ....... .... .... .............. .............. ... ........ .................. ...............
1 0 . ..... _' 1. 16 .. .. .. ,. .. ...... .. ..k
NS ' .""
Figure 3.9: Deep Layer Mean Circulation Analysis for 25120OZ August 1990(adapted from U. S. NOCC/JTWC 1991)
3-22
A close examination of the best track (Fig. 3.7) reveals that Becky was upgraded totyphoon intensity at 261200Z while over land, based upon the appearance of a 10-nm eye(not shown) (U. S. NOCC/JTWC 1991). However, a contradiction appears to exist sinceJTWC also reports that Becky had reached minimum typhoon intensity in the DefenseMeteorological Satellite Program (DMSP) visible image (Fig. 3.10) earlier at 260039Z.Consequently, there may have been other factors (synoptic reports, etc.) that dictated adelay in the formal upgrade. While this appears contradictory to the expected weakeningdue to friction at landfall, other environmental factors may have been dominant. Certainlyin this case much of the spiral band of cloudiness associated with Typhoon Becky remainedover water during its short six-hour track over norther Luzon.
Figure 3.11 displays the summary of all official JTWC warnings for Becky. The JTWCwarning tracks were slow in predicting that Becky would track toward the southwest andstrike northern Luzon. This failure was probably attributed to an underestimation ofthe strength of the ridge (which had followed the trough eastward across China, andintensified). Note that the TC performed characteristically as described in Appendix B(Shoemaker 1991), i.e., having approached the PI moving toward the southwest, the TCturned more westward after landfall. The typhoon also followed Shoemaker's rule thatTCs moving 15 kt or slower experience little change in speed of motion. Note, however,that Typhoon Becky's time over land was only about six hours.
As a result of Typhoon Becky's passasge, 32 people were reported killed, and thousandswere forced to evacuate due to heavy flooding in northern Luzon (U. S. NOCC/JTWC1991).
3-23
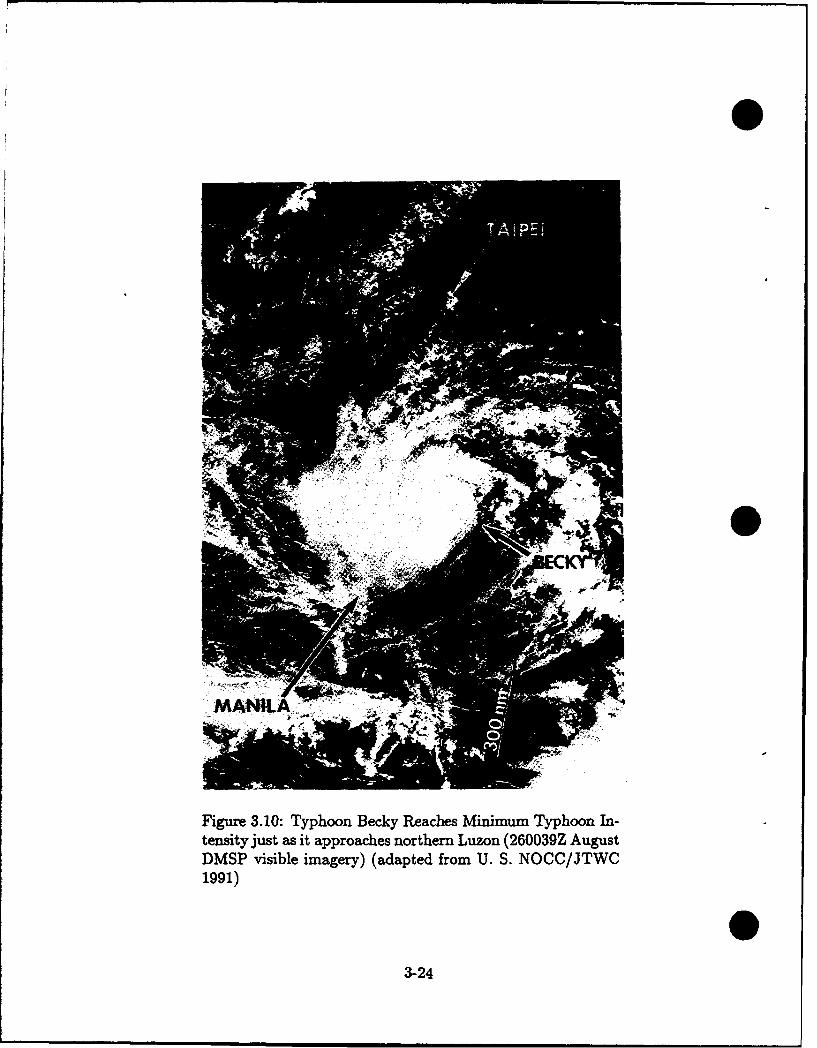
M NILA
Figure 3.10: Typhoon Becky Reaches Minimum Typhoon In-tensity just as it approaches northern Luzon (260039Z AugustDMSP visible imagery) (adapted from U. S. NOCC/JTWC1991)
3-24
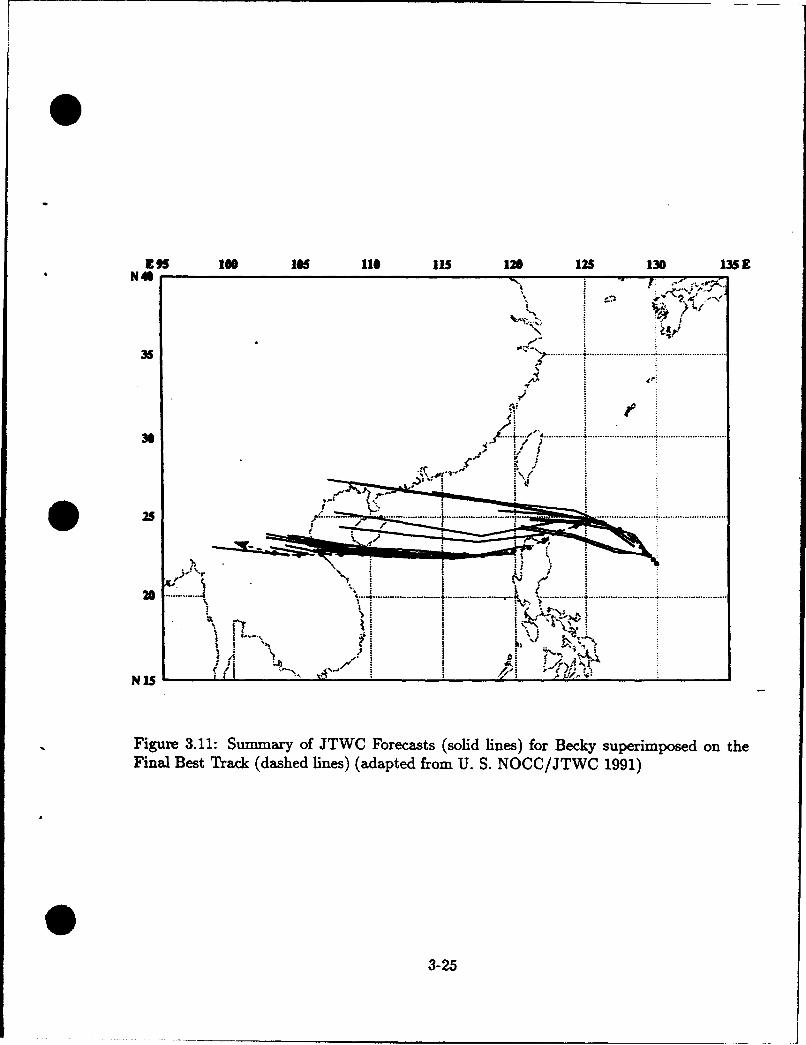
1$95 1 105 110 115 120 125 130 L35
........
30
@225 -• ... " ....... .... ........... .. ......... . ..... ...... . . ." ......................... • ...................... .. .
'A
......... • %.-.'!'• i ...... ..... ........ . ............. i ""i%• .... ..... ........ .,-- -... ............. ...............................
Figure 3.11: Summary of JTWC Forecasts (solid lines) for Becky superimposed on theFinal Best Track (dashed lines) (adapted from U. S. NOCC/JTWC 1991)
3-25
3.4.2 Tropical Storm and Super Typhoon Striking The Visayas
Tropical Storm Thelma, 27 October-08 November 1991
TS Thelma is described to emphasize that tropical cyclones that do not attain typhoonintensity can still be deadly. Tropical Storm Thelma caused the worst loss of life dueto natural disaster in the western North Pacific during 1991. An estimated 6000 peopleperished and 20,000 people were left homeless resulting from the passage of the tropicalstorm.
After persisting for four days as a tropical disturbance, Thelma was made the subjectof a Tropical Cyclone Formation Alert (TCFA) at 311900Z October 1991 (see Fig. 3.12).Following a satellite-derived intensity report of 25 kt, Thelma became the 27th tropicalcyclone of the western North Pacific for 1991, as a Tropical Depression Warning wasissued at 1200Z on 1 November 1991. Approximately one week after being detected as adisturbance, Thelma was upgraded to a Tropical Storm (35 kt) at 031200Z. Simultaneously,the tropical cyclone commenced a track toward the west-southwest. Thelma made landfallon the island of Samar at approximately 041800Z, and continued on a course toward thesouthwest until 051200Z. As recalled by the author, the satellite imagery depicting Thelmawas unimpressive, i.e., a forecaster might mistakenly expect no serious results from itspassage. However, torrential rains dumped an estimated 6 inches of water in 24 hours, asthe tropical storm passed over the island of Leyte. It is noted that the estimated windshad decreased to 40 kt over Leyte (see Fig. 3.12), just six hours after making landfall onSamar, and the maximum sustained winds remained at 35 kt as it finally departed the PI,moving westward from central Palawan.
The catastrophic events resulting from the passage of Tropical Storm Thelma--despiteits never attaining typhoon strength-were attributed to widespread logging (strippingthe hills bare of vegetation) in recent years above the port city of Ormoc on Leyte Island.Ormoc, lying approximately 25 rm southwest of Tacloban (see Fig. 1.1) experienced theeffects of a dam failure, landslides and extensive flash flooding (U. S. NOCC/JTWC 1992)
3-26
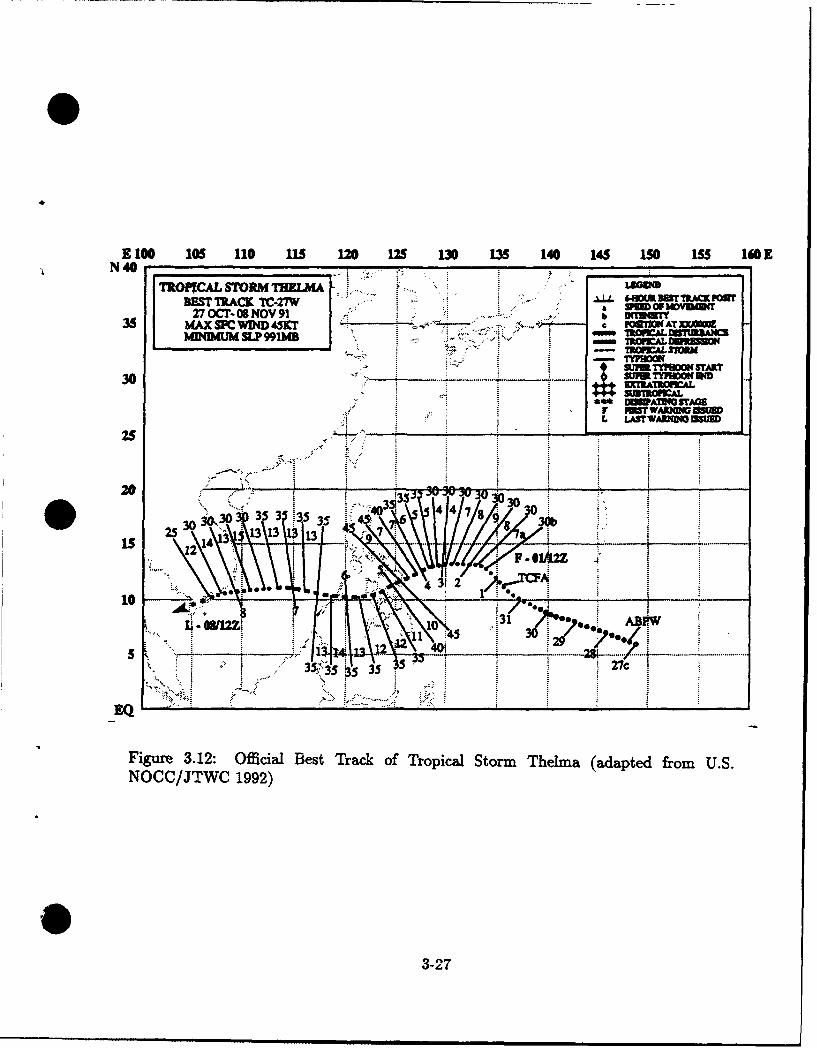
E 100 105 110 115 120 125 130 1I5 140 145 150 155 168 EN 40 _ _ _ _ _ __ _ __
TROPICAL STORM TH•EMA WGWEDBEST TRACK TC-27W • oUTnr'zW27 OCT- 09 NOV 91 b rS•T*M Nf m
3 5..X SF. WD, 4D e "OW1f ATXXUAllDMUM SLPI991MB =.D'T- AiW••±
- UWEALSTORM
30 . . .. TAIOMAL
20 •-- : .... . A't • . 5
NOCV/JTWC 1992)
35 - 30~30 303 35 s 84
1312
5 - mmm '1 mu 3 2
- *353 35 VC
-EQ
Figure 3.12: Official Best Track of Tropical Storm Thelma (adapted from U.S.NOCC/JTWC 1992)
3-2.7
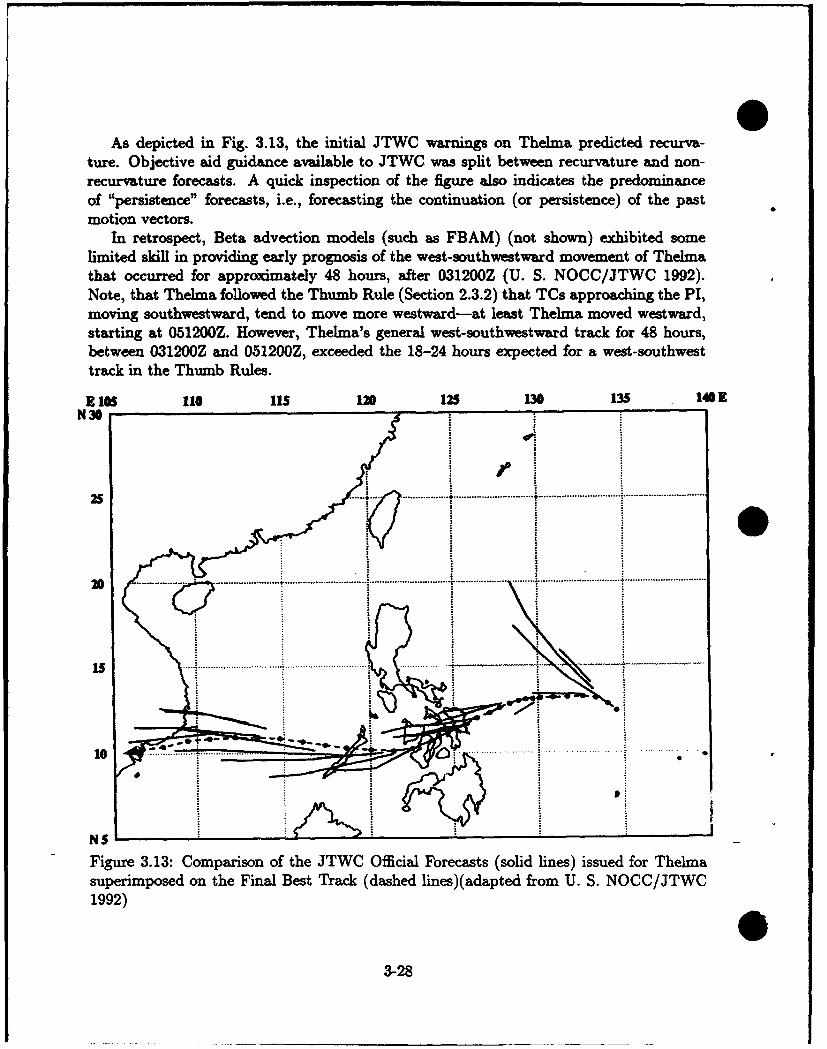
As depicted in Fig. 3.13, the initial JTWC warnings on Thelma predicted recurva-ture. Objective aid guidance available to JTWC was split between recurvature and non-recurvature forecasts. A quick inspection of the figure also indicates the predominanceof "persistence" forecasts, i.e., forecasting the continuation (or persistence) of the pastmotion vectors.
In retrospect, Beta advection models (such as FBAM) (not shown) exhibited somelimited skill in providing early prognosis of the west-southwestward movement of Thelmathat occurred for approximately 48 hours, after 031200Z (U. S. NOCC/JTWC 1992).Note, that Thelma followed the Thumb Rule (Section 2.3.2) that TCs approaching the PI,moving southwestward, tend to move more westward-at least Thelma moved westward,starting at 051200Z. However, Thelma's general west-southwestward track for 48 hours,between 031200Z and 051200Z, exceeded the 18-24 hours expected for a west-southwesttrack in the Thumb Rules.
1 105 110 115 120 125 130 135 140 E
N 1
1@ 0
20 ------ ..'° .. ................. . ........... ................ ......... . ................................ ."...............................
10ii. ......... .......NS
Figure 3.13: Comparison of the JTWC Official Forecasts (solid lines) issued for Thelmasuperimposed on the Final Best Track (dashed lines)(adapted from U. S. NOCC/JTWC1992)
3-28
0Super Typhoon Mike, 6-18 November 1990
The reader must keep in mind that the title of a tropical cyclone indicates the strongestintensity during its history. Thus a tropical cyclone could be only a typhoon, tropicalstorm or less while passing over the Philippine Islands, yet be a super typhoon before orafter hitting the PI. As shown in Fig. 3.14 Super Typhoon Mike decreased from a supertyphoon to a typhoon at 1200Z on 12 November 1990, just before making landfall in Leyte.Nevertheless, in this instance the commercial and transportation capital of the region, Cebu(see Fig. 1.1)-while appearing to be protected by its interior position-received severedamage.
Mike, which had tracked generally west-northwestward since its first warning at 071200Z,slowed to a speed of motion of only 5 kt, dipped to the southwest, developed a 15 nm eyeand intensified rapidly to super typhoon strength at 101200Z. Providing divergence aloftwere dual outflow channels carrying mass out of the center of the TC (not shown). Onechannel led to a 200-mb trough to the northeast, while the other crossed the Equator tothe Southern Hemisphere. Resuming its track toward the northwest and passing only towithin 45 nm of Koror a couple of hours later, the super typhoon caused extensive damageto this island east of Mindanao near 7.50N, 134.5°E.
With the increased friction provided by the mountainous island chain in the path ofthe super typhoon, the weakening of Mike was revealed on satellite imagery by a ragged
* and cloud-filled eye. This change in the satellite imagery prompted the downgrading ofMike to a typhoon before the TC made landfall on Leyte, with maximum sustained windsof 120 kt winds, shortly before 121800Z. Mike then remained a typhoon while crossing thePI and the South China Sea (see Fig. 3.14).
03-29
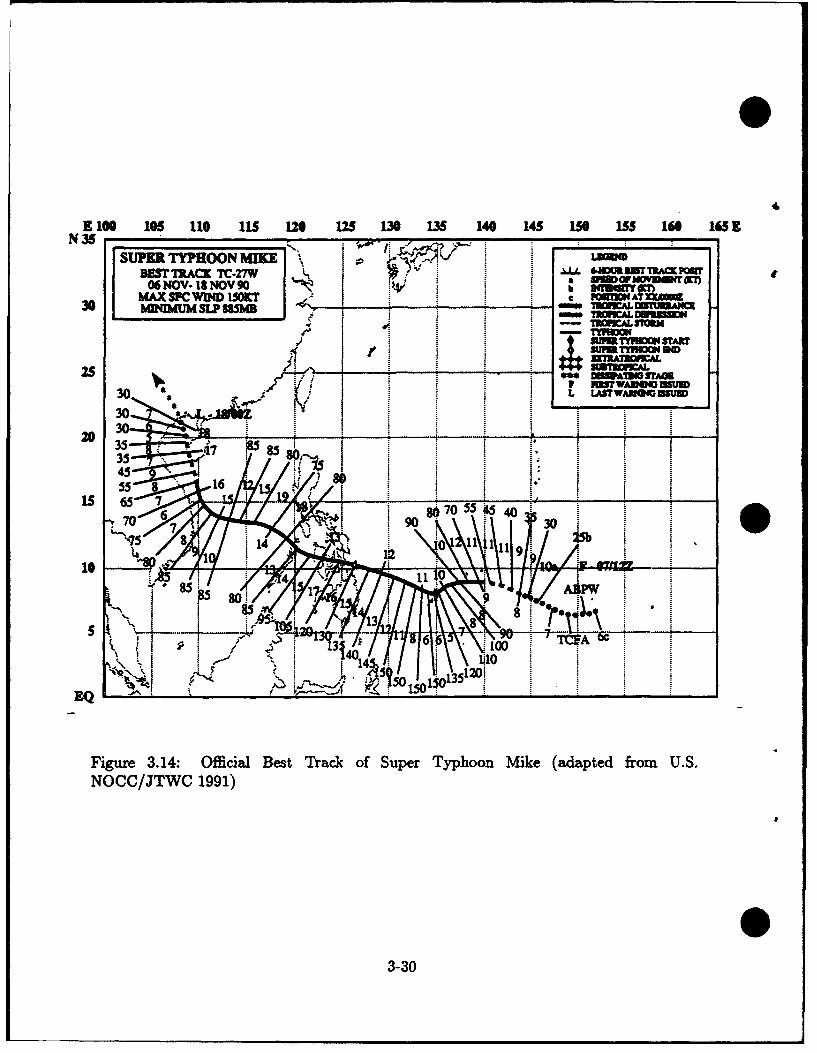
4
EIN 0 10S 110 11 120 125 130 IM 140 145 10 155 160 1651N 35 .,
SUPER TYPHOON MIKE , LOusrm'cx TC 7Y •0-IUt BUT ThtAn POUTD TRAmCK TrC-27W . . W0 .. .. . . . .. M06 NOV- IS NOV 90 N b Of ,.MM
MAX SVC W[ID OW - POUITMATUMIM30 I bONIMhUM SLP SSSN~l -' "_"___ -- - - - - m - 1tALI. nA
_ _ _ _ _ -:i,• Ii -,• mm•m3 -ell IN =AL D ST* UTAWAOM4 START
,2- -- • -"- -5 :" - " '* : iT
e TOWAL iSUw
30 -- /"" ,'- ,
NOCC/JTWC 1WSU1T
3-002S45TAA
205¶ 2
OOC/JTW 1991
70 93 30
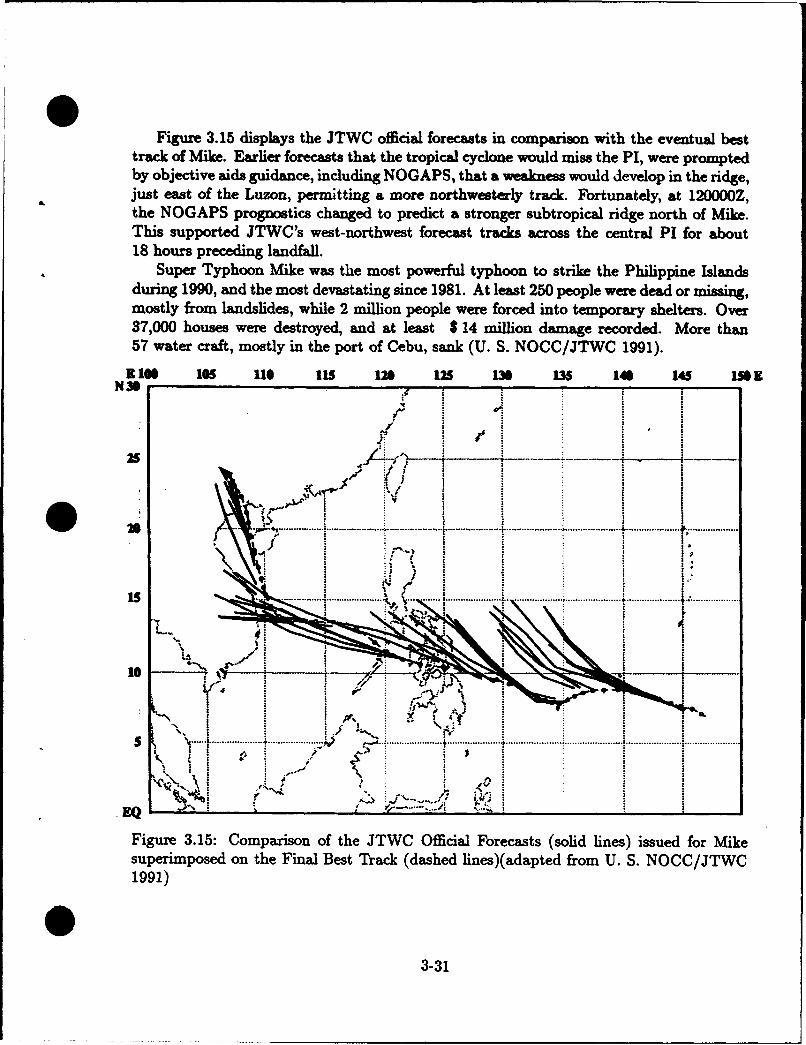
Figure 3.15 displays the JTWC official forecasts in comparison with the eventual besttrack of Mike. Earlier forecasts that the tropical cyclone would miss the PI, were promptedby objective aids guidance, including NOGAPS, that a weakness would develop in the ridge,just east of the Luzon, permitting a more northwesterly track. Fortunately, at 120000Z,the NOGAPS prognostics changed to predict a stronger subtropical ridge north of Mike.This supported JTWC's west-northwest forecast tracks across the central PI for about18 hours preceding landfall.
Super Typhoon Mike was the most powerful typhoon to strike the Philippine Islandsduring 1990, and the most devastating since 1981. At least 250 people were dead or missing,mostly from landslides, while 2 million people were forced into temporary shelters. Over37,000 houses were destroyed, and at least $14 million damage recorded. More than57 water craft, mostly in the port of Cebu, sank (U. S. NOCC/JTWC 1991).
Sis1* 110 le i 10 125 136 135 140 145 150i
N 30
SI .,~ ~
*i.*~ " ".-Ii"X f
•~~3 ... , i",
15
... .'"....................................... ...•.-• ..... ................... ..... ........... ...................... ..................... II......................
.. . .... . * .
rFA .; ...................... - . .-.....'.......,..
EQ x'
Figure 3.15: Comparison of the JTWC Official Forecasts (solid lines) issued for Mikesuperimposed on the Final Best Track (dashed lines)(adapted from U. S. NOCC/JTWC1991)
3-31
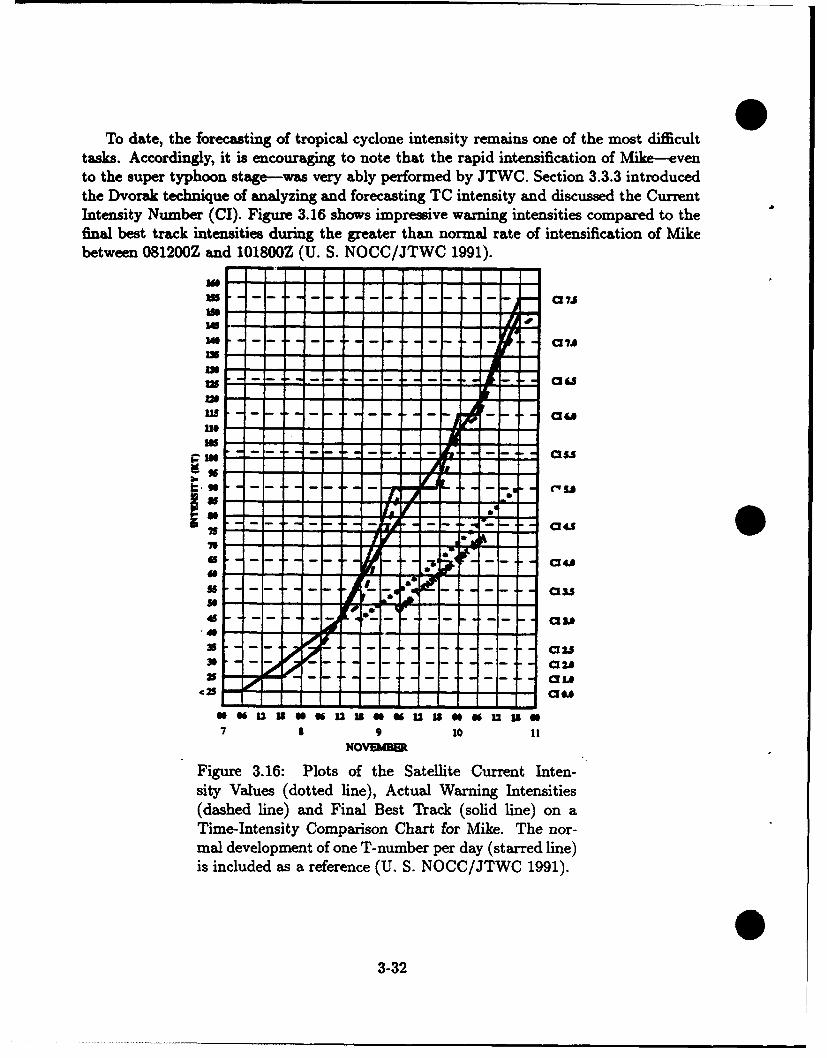
To date, the forecasting of tropical cyclone intensity remains one of the most difficulttasks. Accordingly, it is encouraging to note that the rapid intensification of Mike-evento the super typhoon stage-was very ably performed by JTWC. Section 3.3.3 introducedthe Dvorak technique of analyzing and forecasting TC intensity and discussed the CurrentIntensity Number (CI). Figure 3.16 shows impressive warning intensities compared to thefinal best track intensities during the greater than normal rate of intensification of Mikebetween 081200Z and 101800Z (U. S. NOCC/JTWC 1991).
"in
us""4 -- 4- - '- - Q7I. - .- - - C-IA
S_. _.•,- _ _ Cu
4SA118 . . . I '-- - -,
"- - - - - -- - - - - - - - - - -- a ss
0 U W 06 1 02.5
7 3 9 10 11NOV&ID
Figure 3.16: Plots of the Satellite Current Inten-sity Values (dotted line), Actual Warning Intensities(dashed line) and Final Best Track (solid line) on aTime-Intensity Comparison Chart for Mike. The nor-mal development of one T-number per day (starred line)is included as a reference (U. S. NOCC/JTWC 1991).
03-32
03.4.3 T'ropical Cyclones Striking Mindanao
While rare, Mindanao can get hit-typically by small, but intense typhoons. Typhoon Ike,with 115 kt winds in 1984, killed over 1000 people and caused considerable destruction nearSuragao. During 1990 and 1991, only two tropical cyclones struck Mindanao, and with onlyvery minimal impact. The nearness of Mindanao to the Equator (and the commensuratesmall value of f) reduces the likelihood of tropical cyclones affecting the island. Also,the monsoon trough moves poleward during the Northern Hemisphere summer, and thusremoves this TC genesis region from the vicinity of Mindanao, until its return in latefall. The departure of the monsoon trough during the Northern Hemisphere summer,combined with the sparsity of TC passages, provides much of the island with less than100 inches of rain per year (see Appendix C). There are exceptions such as at Hinatuan,located on the northeast coast (see Fig. 1.1), where the northeast trade wind enhances itsaverage rainfall to about 175 inches. Nevertheless, the island, in its position so near tothe Equator, was covered with cloudiness during a majority of the time during the pasttwo years. Appendix C indicates that all the stations (except one) in Mindanao have anaverage cloud cover of 6 octas (6/8). Although they are not discussed in detail, the onlytwo TCs to affect Mindanao during 1990 or 1991 are shown in Figs. 3.17(a)&(b).
Typhoon Marian, 9-20 May 1.990
* Marian was the only significant tropical cyclone to form in the western North Pacific Oceanduring May 1990. After forming southeast of Koror, Marian moved toward 2800, passingover the southern tip of Mindanao four days later-still as a disturbance (see Fig. 3.17(a)).Its delay in development was attributed to restricted outflow aloft, and then to interactionwith Mindanao to inhibit low-level development. From its inception, Marian traveledabout 1200 nm before being designated a tropical depression when the first warning wasissued at 150600Z May, as it passed by Palawan. Marian then tracked around the westernend of the subtropical ridge (not shown) into the South China Sea, becoming a typhoonand later recurving to strike Taiwan as it was caught up in an approaching cold front andcommenced extratropical transition.
Super Typhoon Owen, 14 November-5 December 1990
While Owen was both the longest lasting and one of the most interesting tropical cyclones(the 30th designated) of 1990, it reached Mindanao in its dying (or dissipating) stage (seeFig. 3.17(b)). As the figure shows, Owen actually developed as a convective cluster east ofthe dateline, 860 nm southwest of Hawaii on 14 November. Owen attained super typhoonstatus twice, once on 23 November when it slowed to a forward speed of only 4 kt (similarto Super Typhoon Mike described earlier, before it hit Visayas) and again on 27 Novemberwhen it was moving faster at a speed of 10 kt. Owen caused extensive property and cropdamage (plus 2 deaths) during its long track through islands and atolls, but no damage to
* Mindanao (U. S. NOCC/JTWC 1991).
3-33
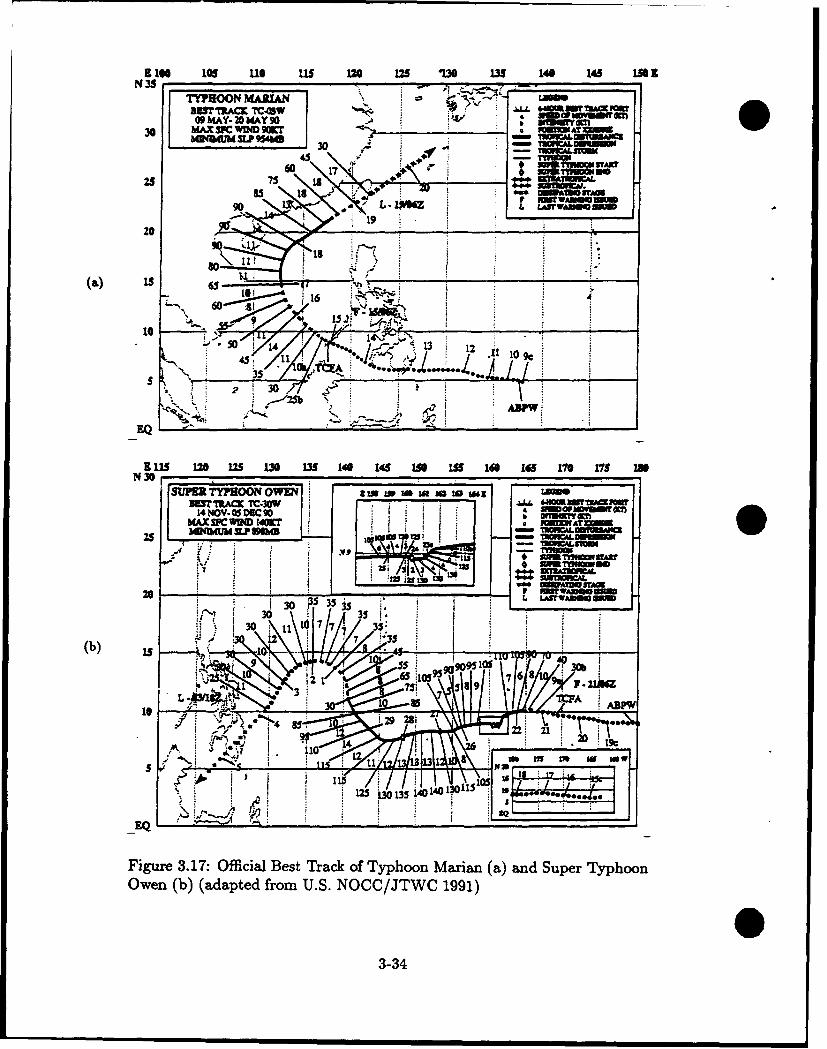
Ri lg 110 115 12 125 tv 135 140 145 1e1 ZN 35
TYPHOON MARAN3511 RACK TC.43W
09 Y- AYgO -" 2 , 90"30 MA SPC WIND 9OAT =Mm
DQWN~4MSLP9Si&6 - imrA, .30 . sr•: - m c. mi
45 L on"60 17 ?"Dn25 17as 18 O ,.WN•. • : .. .&Iaa M ST. M
100 'RMWA12MI 0 9
•m'• xD. , IP & ,, IAWV , ,
is i•• ida i.I
PA.~
0 l l,0-,• L L; . - /,
ME4MU 1LUM 14 13 1
(.) / 5 Tum"oal.•,_ ii "
10 9
"Figure-3.7 Official'- Best ,. Trc of ."• Tyho Maa (a a "d Sue TyhoOwe (b (adpte from/ U.S-..NG/,,TWC/+ 1991), .om+
3-3
s . ,r" . + " +"+ + + " ..,. +..-+ .x --.3.., + + + ... --,.AD M :
$t IE o 1 Q• + + +
•i W ", W M. W W M M W
Nt U310 2 .@ ! 11 44 10 I M 4• I0 I#SU M -- , D O -- -- in IN- --- in --- to . - - --D= T• R ACK. 1:.0 l -- " - "I l • -VW-••-.•-I
14 NOV . 0" DEC 90 b •l1lj• jI l / IWAX.. 91C W= WKT Ul I ? sm -- LU•/ -0"- ' L - 19"s+ ! 3 • • -I - • •
+m~~ ~~ 2 3arm¢-, +•
30 i2 7 7 3i- -"
•~55 90 1. 30b" i l+" ~ ~ ~ ~ ~ 6 "95i'I ,I.:• + •.i' ,.•..;l~,.~ils Il m ,- if1l
0i il,.._." -r• 22 21 mr+ I I
Ow n b)(a apidf om 14S :OC J W 1991
-3-3
Fiur 3I7 Ofica Bes Trc of Tyho Main()adIueyho
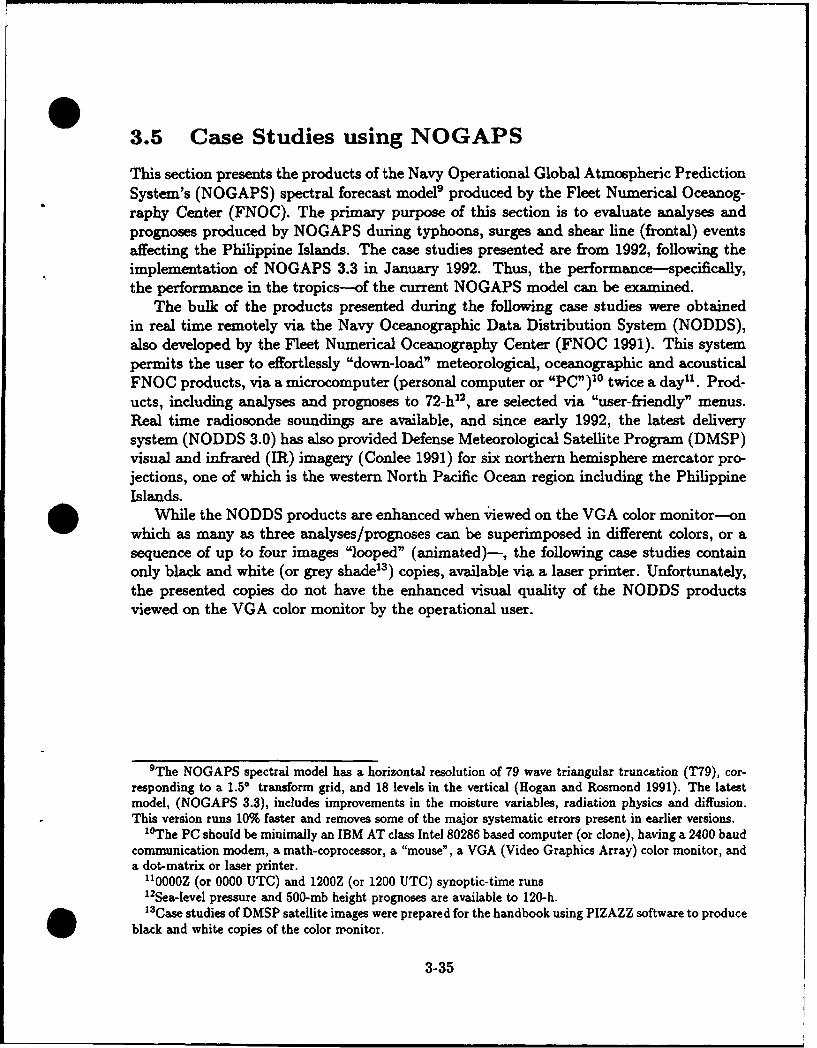
03.5 Case Studies using NOGAPS
This section presents the products of the Navy Operational Global Atmospheric PredictionSystem's (NOGAPS) spectral forecast model9 produced by the Fleet Numerical Oceanog-raphy Center (FNOC). The primary purpose of this section is to evaluate analyses andprognoses produced by NOGAPS during typhoons, surges and shear line (frontal) eventsaffecting the Philippine Islands. The case studies presented are from 1992, following theimplementation of NOGAPS 3.3 in January 1992. Thus, the performance-specifically,the performance in the tropics--of the current NOGAPS model can be examined.
The bulk of the products presented during the following case studies were obtainedin real time remotely via the Navy Oceanographic Data Distribution System (NODDS),also developed by the Fleet Numerical Oceanography Center (FNOC 1991). This systempermits the user to effortlessly "down-load" meteorological, oceanographic and acousticalFNOC products, via a microcomputer (personal computer or "PC")1" twice a day1 . Prod-ucts, including analyses and prognoses to 72-h' 2 , are selected via "user-friendly" menus.Real time radiosonde soundings are available, and since early 1992, the latest deliverysystem (NODDS 3.0) has also provided Defense Meteorological Satellite Program (DMSP)visual and infrared (IR) imagery (Conlee 1991) for six northern hemisphere mercator pro-jections, one of which is the western North Pacific Ocean region including the PhilippineIslands.
While the NODDS products are enhanced when viewed on the VGA color monitor--onwhich as many as three analyses/prognoses can be superimposed in different colors, or asequence of up to four images "looped" (animated)-, the following case studies containonly black and white (or grey shade"3 ) copies, available via a laser printer. Unfortunately,the presented copies do not have the enhanced visual quality of the NODDS productsviewed on the VGA color monitor by the operational user.
9The NOGAPS spectral model has a horizontal resolution of 79 wave triangular truncation (T79), cor-responding to a 1.50 transform grid, and 18 levels in the vertical (Hogan and Rosmond 1991). The latestmodel, (NOGAPS 3.3), includes improvements in the moisture variables, radiation physics and diffusion.This version runs 10% faster and removes some of the major systematic errors present in earlier versions.
"0The PC should be minimally an IBM AT class Intel 80286 based computer (or clone), having a 2400 baudcommunication modem, a math-coprocessor, a "mouse", a VGA (Video Graphics Array) color monitor, anda dot-matrix or laser printer.
"OOOOZ (or 0000 UTC) and 1200Z (or 1200 UTC) synoptic-time runs12Sea-level pressure and 500-mb height prognoses are available to 120-h.""Case studies of DMSP satellite images were prepared for the handbook using PIZAZZ software to produce
black and white copies of the color wonitor.
3-35
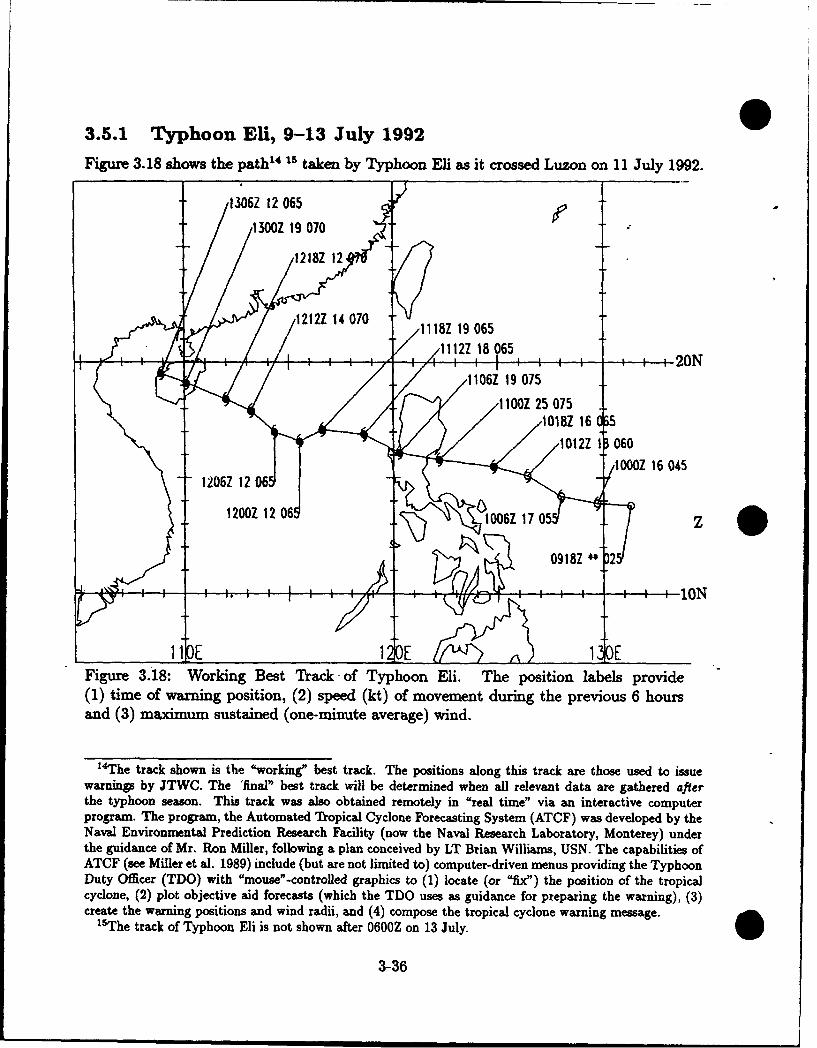
3.5.1 Typhoon Eli, 9-13 July 1992Figure 3.18 shows the path14 15 taken by Typhoon Eli as it crossed Luzon on 11 July 1992.• • ,~1306Z 12 065"
.• / /1300Zi19070 •
1018Z 16 0M5
Figure 3.18: Working Best Track -of Typhoon Eli. The position labels provide(1) time of warning position, (2) speed (kt) of movement during the previous 6 hoursand (3) maximum sustained (one-minute averaige) wind.
"T~he track shown is the "working" best track. The positions along this track are those used to issuewarningls by JTWC. The 'final" best track will be determined when all relevant data are gathered afterthe typhoon season. This track was also obtained remotely in "real time" via an interactive computerprogram. The program, the Automated Trlopical Cyclone Forecasting System (ATOF) was developed by theNaval Environmental Prediction Research Facility (now the Naval Research Laboratory, Monterey) underthe guidance of Mr. Ron Miller, following a plan conceived by LT Brian Williams, USN. The capabilities ofATCF (see Miller et al. 1989) include (but are not limited to) computer-driven menus providing the TyphoonDuty Officer (TDO) with "mouse"-controlled graphics to (1) locate (or "fix") the position of the tropicalcyclone, (2) plot objective aid forecasts (which the TDO uses as guidance for preparing the warning), (3)
create the warning positions and wind radii, and (4) compose the tropical cyclone warning message.
1
1The track of Typhoon Eli is not shown after 0600Z on 13 July.
3-36
ON 17 05
9 July 1992
A Tropical Cyclone Formation Alert (TCFA) was issued by JTWC at 1100Z on 9 Julynoting winds of 20 to 30 kt, with a circulation center, near 13.5°N, 134.80E (point "Z" onFigs. 3.18, 3.19 and 3.20), moving westward at 17 kt. The TCFA commented on the pres-ence of improved convective organization (Fig. 3.19), a low level circulation center (evidentfrom the island station reports and the ship reports in the Philippine Sea in Fig. 3.20),and upper level anticyclonic cirrus outflow indicating that the system was located near alow (vertical) shear region-circulation features were available to forecasters at JTWC viaanimated visible and infrared geostationary satellite data. Sea surface temperatures werequite warm and further development likely.
Figures 3.21(a) and (b) are 1200Z radiosonde soundings1 6 (received via NODDS in realtime) from the island stations of Yap (PTYA, WMO station 91413) and Koror (PTRO,WMO station 91408) east of Mindanao (see Fig. 3.20). The low-level southerly flow andthe large moisture content in the vertical are supportive of the incipient tropical cyclone.
Four hours later at 1600ZI', Cubi Point NAS (RPMB, WMO station 98426) andManila International Airport (RPMM, WMO station 98429) on Luzon were reportingtemperatures/dewpoints's of 27/20 and 28/25 respectively, with light winds from the east(land breeze) and scattered low clouds (not shown). Cubi Point NAS also had Thunder-storm Condition 2 set19 . While Mactan International Airport on Cebu (RPMT, WMO
* station 98646) in Visayas reported temperatures of 27/20, a light northerly wind (landbreeze) and broken multi-level clouds-note that this cloudiness over Visayas was evident3 hours earlier on Fig. 3.19.
At 1800Z, eventual Typhoon Eli was designated the fifth tropical cyclone in the westernNorth Pacific Ocean of the year (05W), and a Tropical Depression Warning was issuedwhen the cyclone's sustained winds reached 25 kt. The warning announced that the TDwas moving rapidly westward as it intensified, and that it would strike the east coast ofLuzon with 60 kt winds in 36 hours (at 110600Z) near 15.4°N, 121.8*E. Note that this firstwarning was only about 30 nm to the south of the point of eventual landfall, although theactual landfall was about 4 hours earlier (see Fig. 3.18).
"1'Until the eruption of Mount Pinatubo in June 1991, OOOOZ and 1200Z soundings were available fromClark AB. Soundings were then available from the Cubi Point Naval Air Station but ceased in early 1992,when preparations for its eventual closing commenced. (The soundings displayed on the VGA monitor arelarger and in color.)
"The Philippine Islands are in the H Time Zone, i.e., 8 hours ahead of Zulu Time, thus 1600Z = 2400Local (midnight).
I'sTemperatures are in degrees Celcius."19Thunderstorm Condition 1 (TI) = Thunderstorms are within 5 miles of the station, possible at the station
within one hour. Thunderstorm Condition 2 (T2) = Thunderstorms possible within 6 hours-commonly setduring the southwest monsoon.
3-37
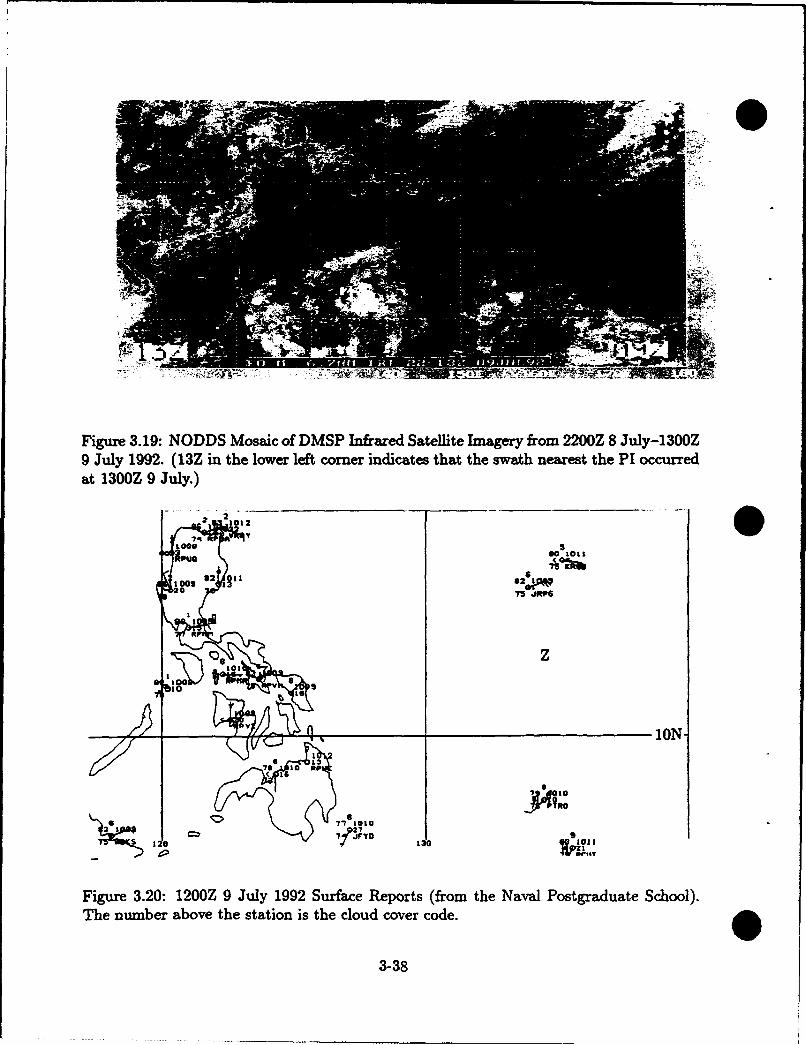
Figure 3.19: NODDS Mosaic of DMSP Infrared Satellite Imagery from 2200Z 8 July-1300Z9 July 1992. (13Z in the lower left comer indicates that the swath nearest the PI occurredat 1300Z 9 July.)
2- 2
75 OE6
ft t
1 0 V to
"V 1iON-
6 13
(16
Figure 3.20: 1200Z 9 July 1992 Surface Reports (from the Naval Postgraduate School).The number above the station is the cloud cover code.O
3-38
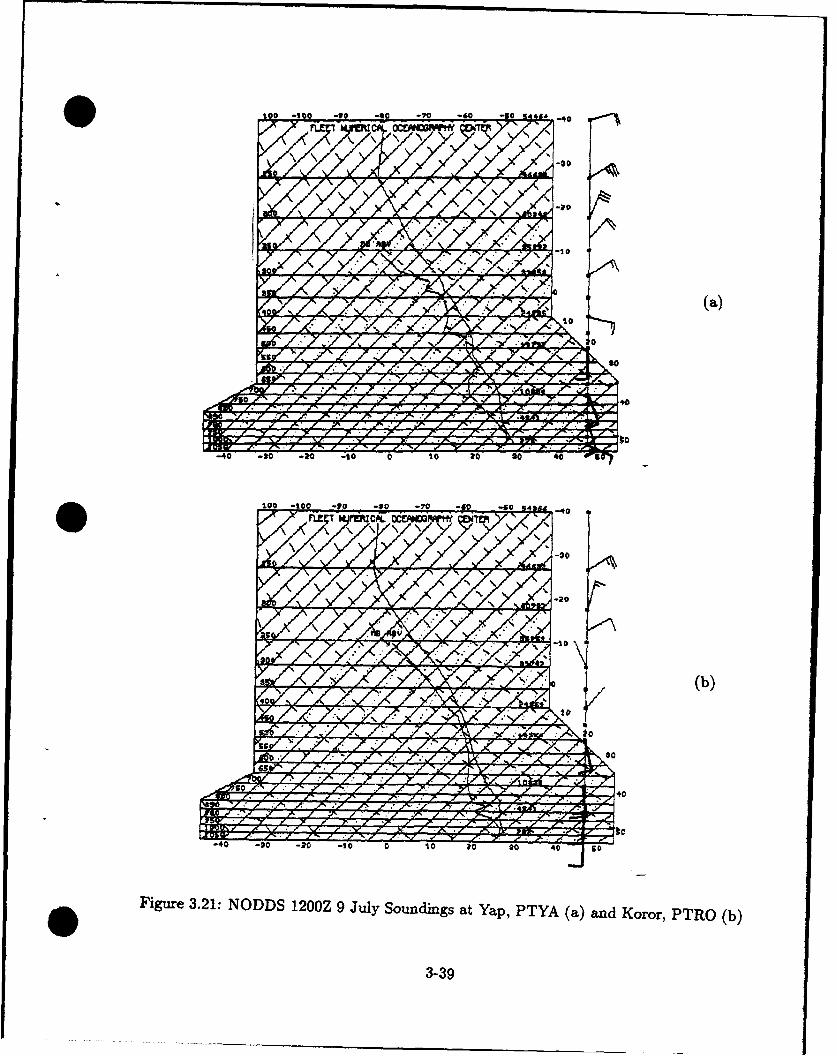
1 0 -100 -to -to -70 -60 -50 9 9A 0
(a)
V, ll• / Y. 'v "le,, Y,,/ l'/ >. /"
•7f2 :X y' X'/ .'.', .- "-./"A 5,77"i"0. • Y _- /i~ . "' 7- ý- tX. -. 7,. ' o
-40 -t0 -10 -to 0 to to to 44
too -100 -to -0o _70 -0 0 -40
3-390
/W/ I N \ \
y X.
e)• . 'I, loll 40".. '• . ",I• ., .', . •, I5 )
-40 -_20 -20C -20 0 10 t'o 2l 0iO
OFigure 3.21: NODDS 1200Z 9 July Soundings at Yap, PTYA (a) and Koror, PTRO(b
3-39
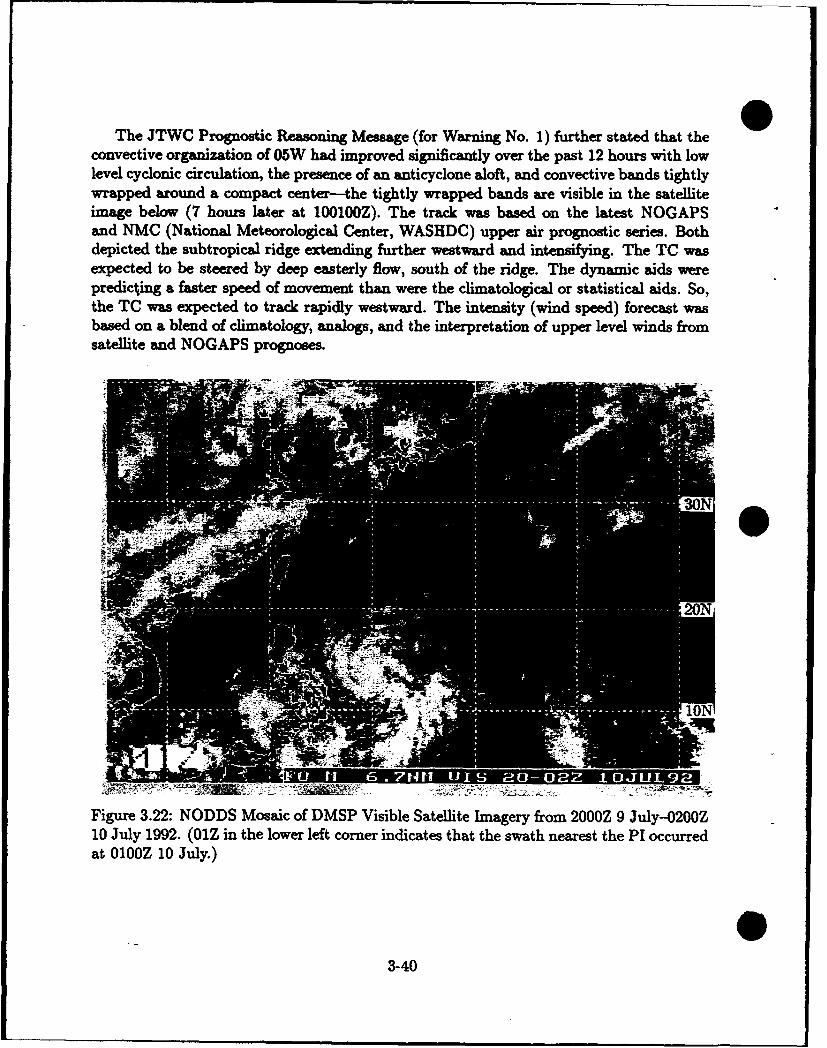
The JTWC Prognostic Reasoning Message (for Warning No. 1) further stated that theconvective organization of 05W had improved significantly over the past 12 hours with lowlevel cyclonic circulation, the presence of an anticyclone aloft, and convective bands tightlywrapped around a compact center-the tightly wrapped bands are visible in the satelliteimage below (7 hours later at 100100Z). The track was based on the latest NOGAPSand NMC (National Meteorological Center, WASHDC) upper air prognostic series. Bothdepicted the subtropical ridge extending further westward and intensifying. The TC wasexpected to be steered by deep easterly flow, south of the ridge. The dynamic aids werepredicting a faster speed of movement than were the climatological or statistical aids. So,the TC was expected to track rapidly westward. The intensity (wind speed) forecast wasbased on a blend of climatology, analogs, and the interpretation of upper level winds fromsatellite and NOGAPS prognoses.
10
Figure 3.22: NODDS Mosaic of DMSP Visible Satellite Imagery from 2000Z 9 July-0200Z10 July 1992. (01Z in the lower left comer indicates that the swath nearest the PI occurredat O10OZ 10 July.)
03-40
10 July 1992
At 100000Z, JTWC upgraded 05W to Tropical Storm Eli having 35 knots of windbased on a Dvorak T-number2° of 2.5 (see Table 3.3 in Section 3.3.3). Eli was trackingwestward in the Philippine Sea toward 2750 at 16 kt. By 100600Z, its intensity increasedto 55 kt-indicating the likelihood that the 100000Z intensity was too low, since this istoo much intensification in 6 hours--and its speed of movement to 17 kt. JTWC reportedthat outflow (aloft) was good in all quadrants. The Prognostic Reasoning Message statedthat the system was expected to slow21 due to land interaction and then accelerate aftercrossing into the South China Sea.
Figure 3.23 shows the -1400Z2 NODDS DMSP IR image corresponding to the 1200ZTropical Cyclone Warning for TS Eli. At 1200Z, Eli had maximum sustained winds of60 kt, with gust to 75 kt, while moving toward 2900 at 16 kt. The 101200Z warningposition (15.1"N, 126.4"E) was a relocation to the north (see the 1012Z--101200Z positionon Fig. 3.18) based on well defined banding features into Eli's center. JTWC reported thatdespite the fact that animated satellite imagery did not show a strong subtropical ridge,the forecast track was toward the west-northwest (see Fig. 3.26) following dynamic' aids.
The NODDS surface pressure analysis, with station and ship synoptic reports, at101200Z, is shown in Fig. 3.24. Figures 3.25(a) and (b) are "zoom" images availablevia NODDS2 4. Figure 3.25(a) plots a ship report (JKRV) '-,100 nza to the east of Eli re-
* porting "3-dot" (continuous, moderate) rain with 35-kt wind from the southeast. An evengreater NODDS zoom, Fig. 3.25(b), plots NAS Cubi Point (WMO 98426) with lightningvisible, with a 5 kt wind from the north and Alabat (WMO 98435) with a thunderstormand 5 kt wind from the north-the circulation of Eli had already reached the PI.
21In a developing TC, Dvorak T-number = Cl number.21Note that the expected slowing after landfall agrees with climatology in Fig. B.12 of Appendix B.
Figure B.14(b) indicates that 20 previous tropical storms decreased their average speed of movement for12 hours, following landfall, and then held their speed; however, Fig. B.15(c) indicates that the speed ofmovement of 21 previous typhoons decreased their speed of movement for the first six hours after landfall,then increased their speed.
22The direct readout of DMSP satellite imagery shown in Fig. 3.35 records the time of the same DMSPimage as -1230Z.
23Dynamic aids are identified in Table 3.2 in Section 3.3.2."24Again, note that the VGA screen images (typically 14-inch diagonals), available to the operational user,
are both larger and in color.
3-41
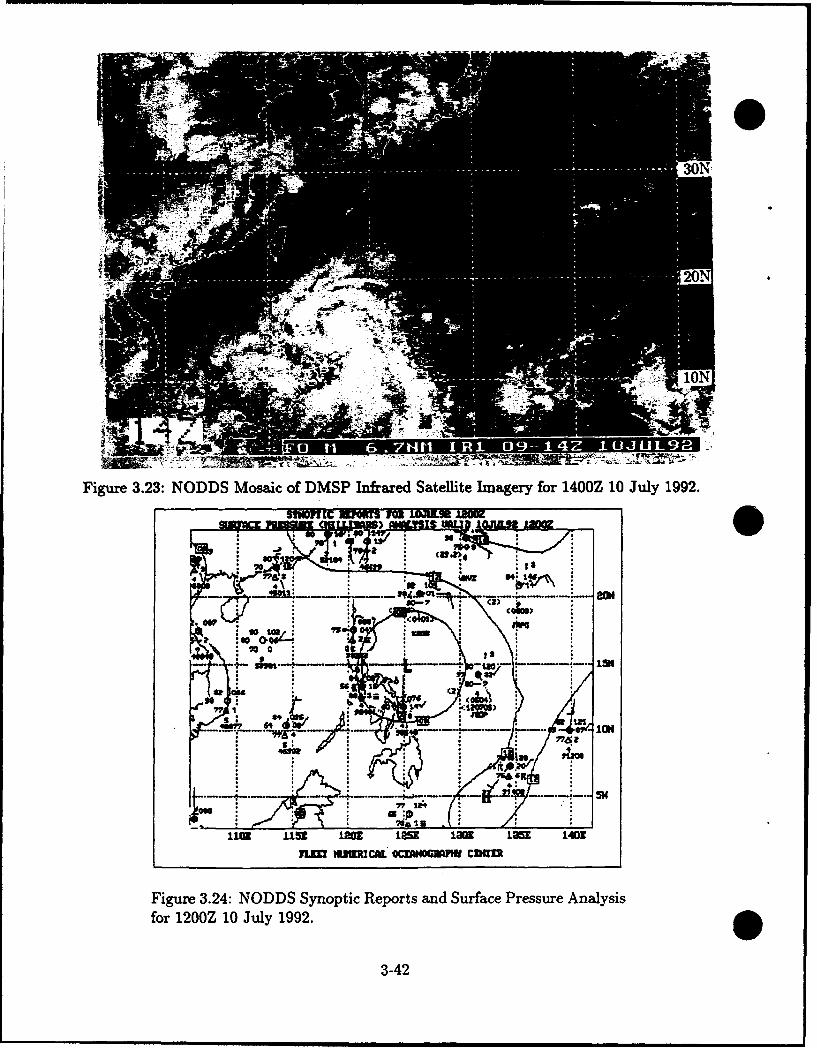
Figure 3.23: NODDS Mosaic of DMSP Infrar~ed Satellite Imagery for 1400Z 10 July 1992.
swwn i uiwrsm wuuas INKNa
W 134
i •0N0
472 13
21 ,We s
"7i 2A •
I= law I=-MM.40
n= mm UCcaL ocrNo6m1H cUIn
Figure 3.24: NODDS Synoptic Reports and Surface Pressure Analysisfor 1200Z 10 July 1992.
3-42
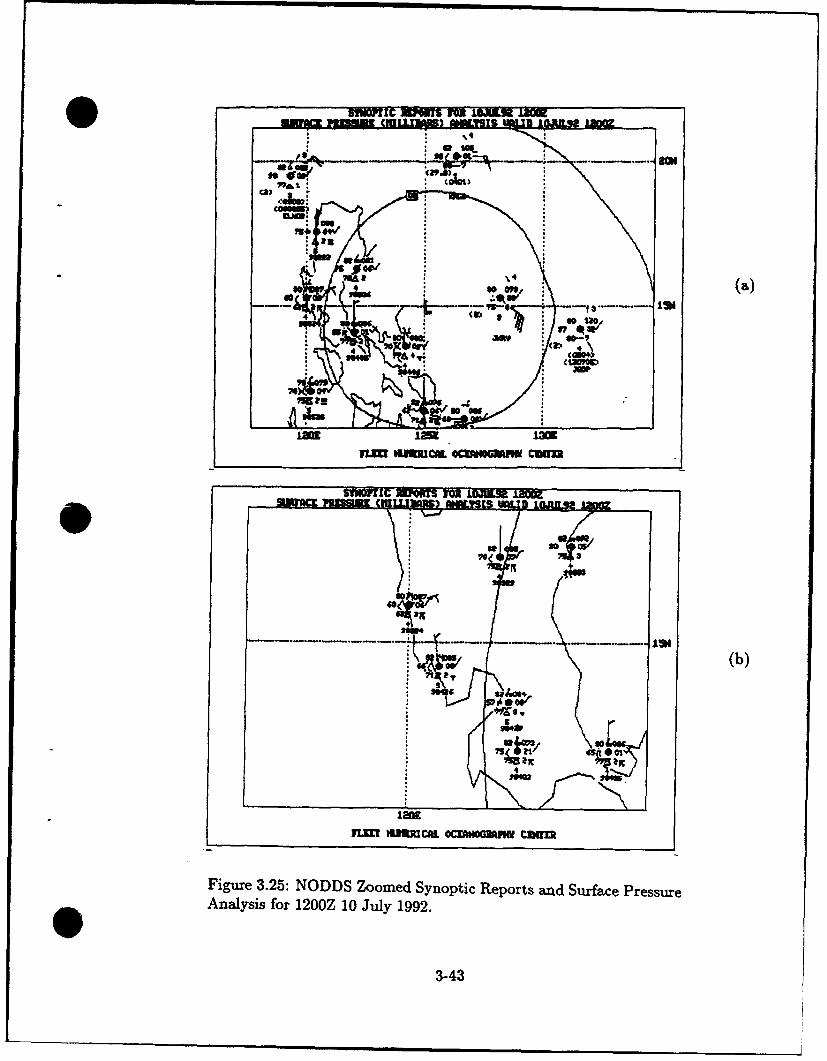
~SMI ww (G.IA)MM.YI UM.K LawUL
ca(n)
120 mainko
"f 3
=•"• -•.•.... '•(b)
Figure 3.25: NODDS Zoomed Synoptic Reports and Surface PressureOAnalysis for 1200Z 10 July 1992.
3-43
m4 7" 4\m u m
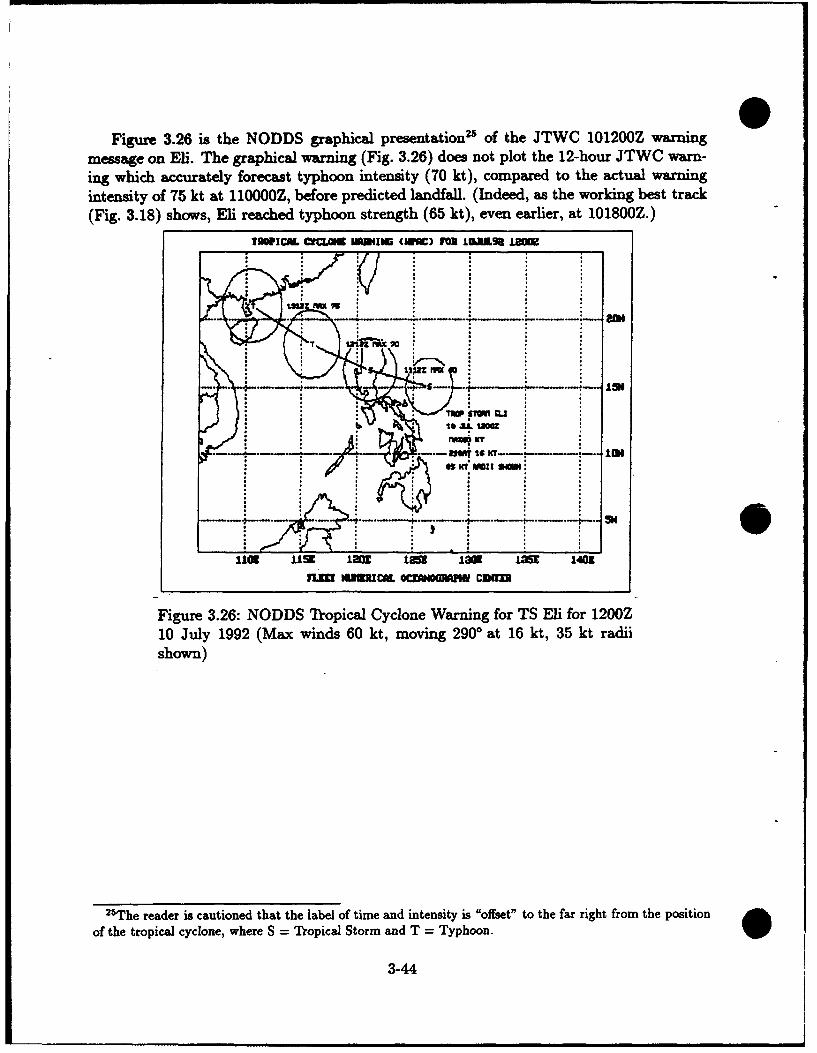
Figure 3.26 is the NODDS graphical presentation5 of the JTWC 101200Z warningmessage on Eli. The graphical warning (Fig. 3.26) does not plot the 12-hour JTWC warn-ing which accurately forecast typhoon intensity (70 kt), compared to the actual warningintensity of 75 kt at 110000Z, before predicted landfall. (Indeed, as the working best track(Fig. 3.18) shows, Eli reached typhoon strength (65 kt), even earlier, at 101800Z.)
TDWICU. CYMASU MINGDI (WW) FOR 133.3 12Mai
irni i
S.- -.-.. - ----- -
11 SIMNLI* Iý Ina
............
11U £1se 1•21 1251 13a 1aw 1401
nL W UUICZI cmNo0M cfUU
Figure 3.26: NODDS Tropical Cyclone Warning for TS Eli for 1200Z10 July 1992 (Max winds 60 kt, moving 290° at 16 kt, 35 kt radiishown)
"2The reader is cautioned that the label of time and intensity is "offset" to the far right from the positionof the tropical cyclone, where S = Tropical Storm and T = Typhoon.
3-44
Figure 3.27 shows the NOGAPS 101200Z surface pressure analysis (solid lines) and24-h forecast (dashed lines). The analysis center's symbol L in Fig. 3.27 represents theposition of Tropical Storm Eli'. The forecast center of low pressure can be estimatedby viewing the dashed isobars of Fig. 3.27, i.e., near Lingayen Gulf on the west coast ofLuzon. This position represents the NOGAPS "objective aid" 24-h forecast position forTS Eli and is a direct result of NOGAPS prognostic model. While it represents a verygood prognosis, forecasting for a "straight-runner", such as Eli, for only 24 hours, is notdifficult-of course, a TC is identified as a "straight runner" only "after the fact."
Figure 3.28 shows the 500-mb trough and the center (L) associated with TS Eli. In theabsence of nearby radiosonde stations, the analysis position of the low at 500 mb (solidcontours), is also a direct result of the bogus soundings (surface to 400 mb) describedin footnote 26. However, the 24-h forecast position (dashed contours) of the 500-mb lowassociated with Eli is a direct result of NOGAPS prognosis.
Similarly, Figs. 3.29(a) and (b) show the NOGAPS analysis and 24-h forecast of thestreamlines27 and winds in the region, on the 925-mb surface. This pressure surface waschosen because of its nearness to the "gradient" level, the level ('-1 km) at which surfacefriction ceases to exist. Tropical analysts typically analyze low-level streamlines at the gra-dient level and upper-level streamlines at 200 mb-actually, JTWC does a surface-gradientcomposite and a 200 mb composite (300 mb-100 mb). Recognizing that no synoptic-scaleanalysis can depict the mesoscale features of a tropical cyclone (e.g., the maximum sus-tained winds at the radius of maximum winds (RMW)), both the analysis, Fig. 3.29(a),and the 24-h forecast, Fig. 3.29(b), appear to be excellent products for operational use.
261n 1990, FNOC automated the insertion of "bogus" soundings (from the surface to 400 mb) based on the
JTWC warning positions-thus forcing the NOGAPS analysis to accept the JTWC analysis position of therespective tropical cyclone. The scheme prescribes 5 bogus soundings for a tropical depression and 13 bogussoundings for TCs of tropical storm strength or greater: TD - one at the center and four at a radius of 2?in the direction of the cardinal points, north, east, south and west; TS or stronger - one at the center andfour staggered at radii of 2?, 4 and 6. Thus the forecaster should be aware that it is not unusual for theNOGAPS analysis to have a trough or low center at a considerable distance from the the position of anincipient tropical cyclone-i.e., no trough or low center where the TC forms, until its position is dictated bythe "bogus" entries. Often this is caused by an absence of wind reports in the vicinity of the forming TC orby the coarse resolution of the NOGAPS model. However, it is also possible that the initial synoptic surfacewind reports-from which an analyst would subjectively discern the position of the forming TC, especially inthe presence of a satellite cloud cluster-are rejected by the NOGAPS Multivariate Optimum Interpolation(01) Analysis scheme (Goerss and Phoebus, 1992).
"27Tropical meteorologists will recognize that these automated NOGAPS 925-mb analyses and forecastsare discontinuous streamlines which are very useful, but present no depiction of the flow pattern of neutralpoints, nor the labels of positive and negative points.
3-45
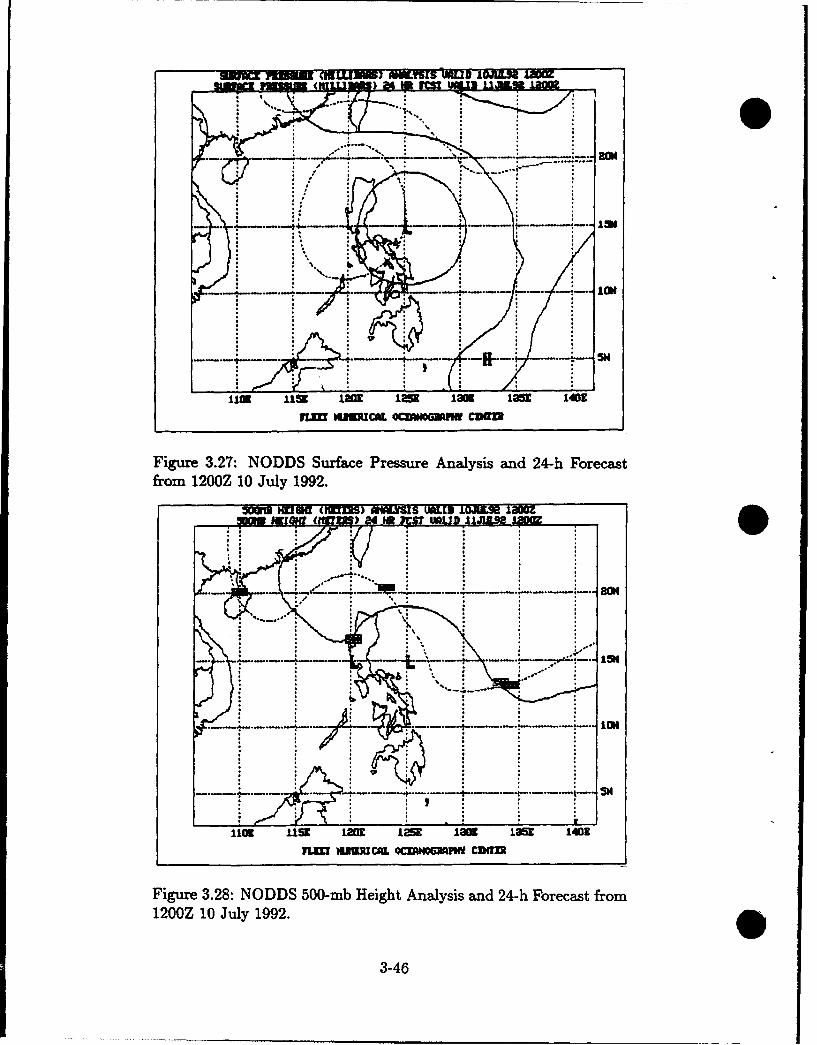
uwacx win I CEbLUA 2•M.vsS MUD 1OJI.amho
: ~ ~ ....... l ....... MS'N
n.T ,,:caL
Figure 3.27: NODDS Surface Pressure Analysis and 24-h Forecas5tfrom 1200Z 10 July 1992.
. . ! -
MMNEL(as)I M I IUERICA OCA OALMW 1=
; M" ,f~ ý %A u ,ý wa a I i m I
ll09 .list 120Kl 12 1E01 t13Sr 1401l
Figure 3.28: NODDS 500-mb Height Analysis and 24-h Forecast from120oZ 10 July 1992.
3-46
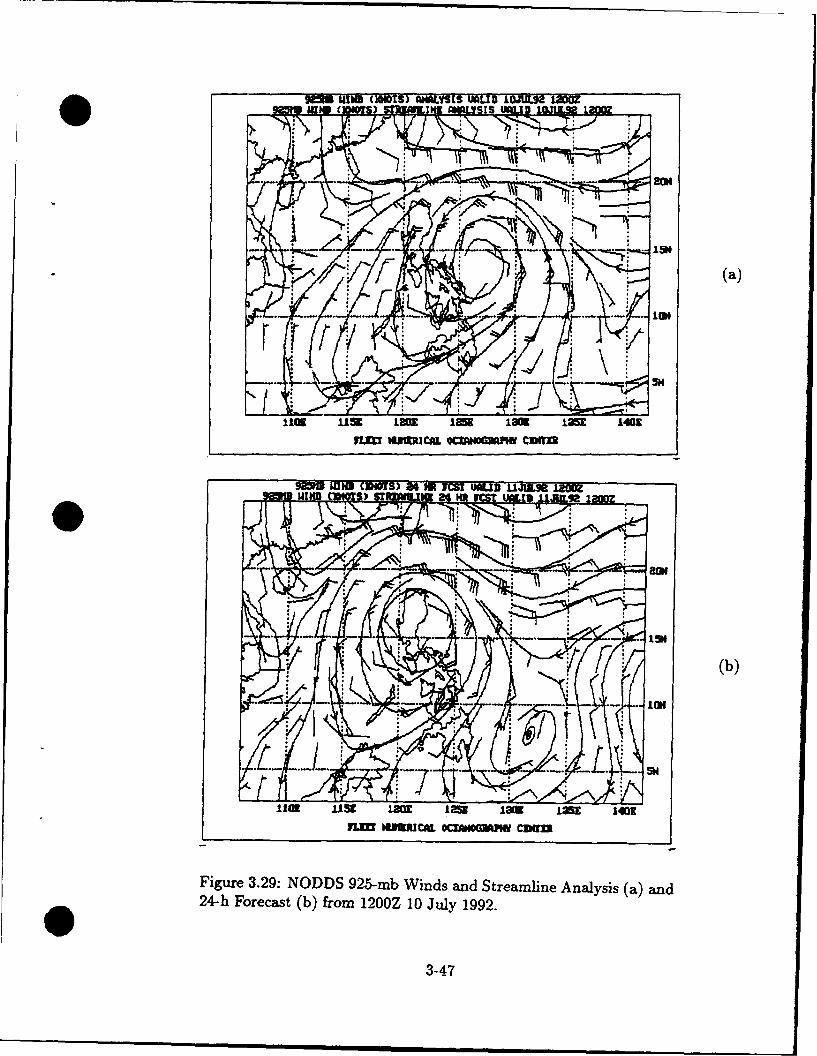
9M 1m (rOoTS) W•W.Y[S VALID MoJawt LIM0
01(l (a)
1im11 M I=Z I= 130It OR3 1402
Y H i CAL. OCLNOPAW CINT/R
92~~3gram CTSM ts its UMJ3 m1JW. 412O a
(b)
*ICU
lids .1,-59 IMl• 125 1308 La 1401•
n=m wuLt caL *czwom4,w curnm
Figure 3.29: NODDS 925-mb Winds and Streamline Analysis (a) and24-h Forecast (b) from 1200Z 10 July 1992.
3-47
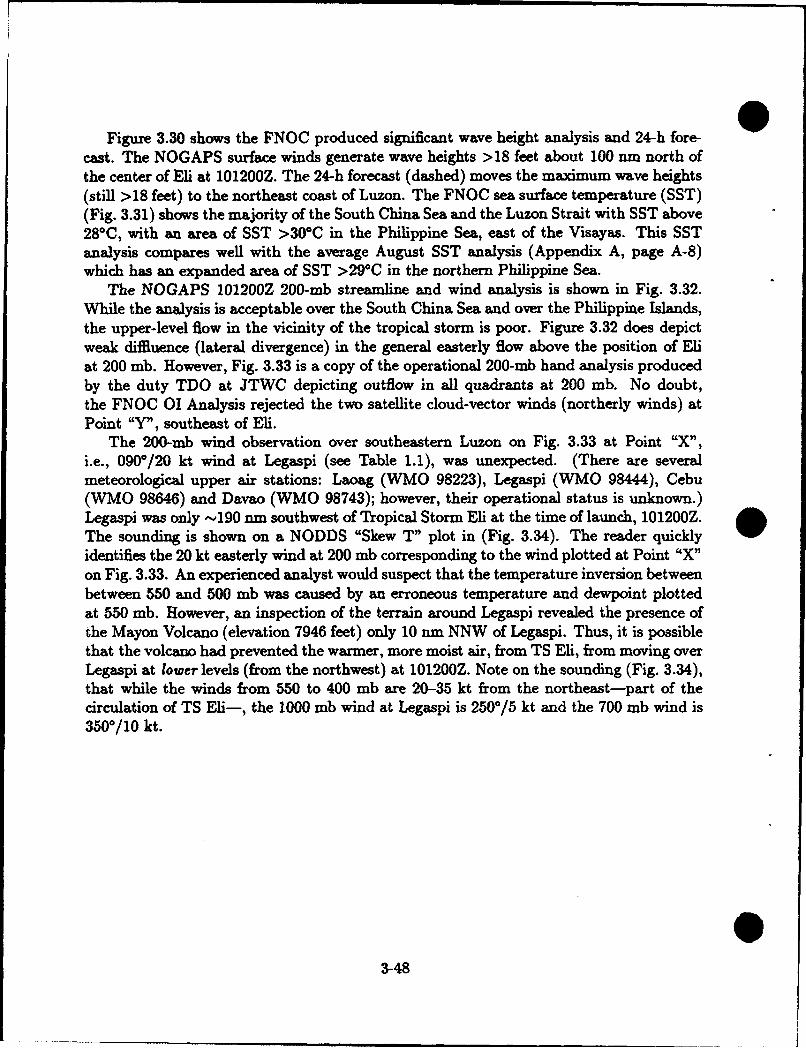
Figure 3.30 shows the FNOC produced significant wave height analysis and 24-h fore-cast. The NOGAPS surface winds generate wave heights >18 feet about 100 nm north ofthe center of Eli at 101200Z. The 24-h forecast (dashed) moves the maximum wave heights(still >18 feet) to the northeast coast of Luzon. The FNOC sea surface temperature (SST)(Fig. 3.31) shows the majority of the South China Sea and the Luzon Strait with SST above28*C, with an area of SST >300C in the Philippine Sea, east of the Visayas. This SSTanalysis compares well with the average August SST analysis (Appendix A, page A-8)which has an expanded area of SST >29°C in the northern Philippine Sea.
The NOGAPS 101200Z 200-mb streamline and wind analysis is shown in Fig. 3.32.While the analysis is acceptable over the South China Sea and over the Philippine Islands,the upper-level flow in the vicinity of the tropical storm is poor. Figure 3.32 does depictweak diffluence (lateral divergence) in the general easterly flow above the position of Eliat 200 rob. However, Fig. 3.33 is a copy of the operational 200-mb hand analysis producedby the duty TDO at JTWC depicting outflow in all quadrants at 200 rob. No doubt,the FNOC 01 Analysis rejected the two satellite cloud-vector winds (northerly winds) atPoint "Y", southeast of Eli.
The 200-mb wind observation over southeastern Luzon on Fig. 3.33 at Point "X",i.e., 0900/20 kt wind at Legaspi (see Table 1.1), was unexpected. (There are severalmeteorological upper air stations: Laoag (WMO 98223), Legaspi (WMO 98444), Cebu(WMO 98646) and Davao (WMO 98743); however, their operational status is unknown.)Legaspi was only 4190 nm southwest of Tropical Storm Eli at the time of launch, 101200Z.The sounding is shown on a NODDS "Skew T" plot in (Fig. 3.34). The reader quicklyidentifies the 20 kt easterly wind at 200 mb corresponding to the wind plotted at Point "X"on Fig. 3.33. An experienced analyst would suspect that the temperature inversion betweenbetween 550 and 500 mb was caused by an erroneous temperature and dewpoint plottedat 550 nib. However, an inspection of the terrain around Legaspi revealed the presence ofthe Mayon Volcano (elevation 7946 feet) only 10 nm NNW of Legaspi. Thus, it is possiblethat the volcano had prevented the warmer, more moist air, from TS Eli, from moving overLegaspi at lower levels (from the northwest) at 101200Z. Note on the sounding (Fig. 3.34),that while the winds from 550 to 400 mb are 20-35 kt from the northeast-part of thecirculation of TS Eli-, the 1000 mb wind at Legaspi is 250°/5 kt and the 700 mb wind is350°/10 kt.
3-48
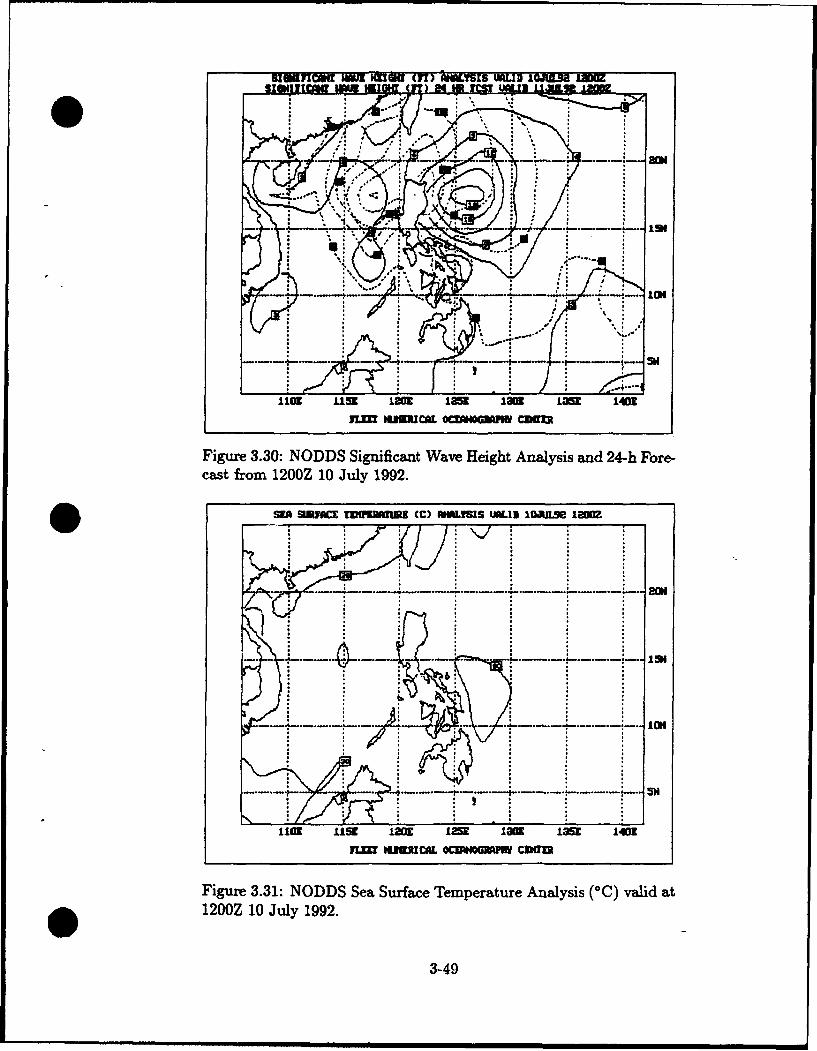
nm' u:ma :~o~w an
Figure 3.30: NODDS Significant Wave Height Analysis and 24-h Fore-cast from 1200Z 10 July 1992.
SIRt S137I TUIMMIIB VCC IiS UWLI3 1(TL) 1hlDa-am
----u1-- ------ 4- H
L3
1101 L15K fO 12 51 11 185LM 1401
"MrU! NIHEICAL 0CZGFAW COwn
Figure 3.31: NODDS Sea Surface Temperature Analysis (aC) valid atS1200Z 10 July 1992.
3-49
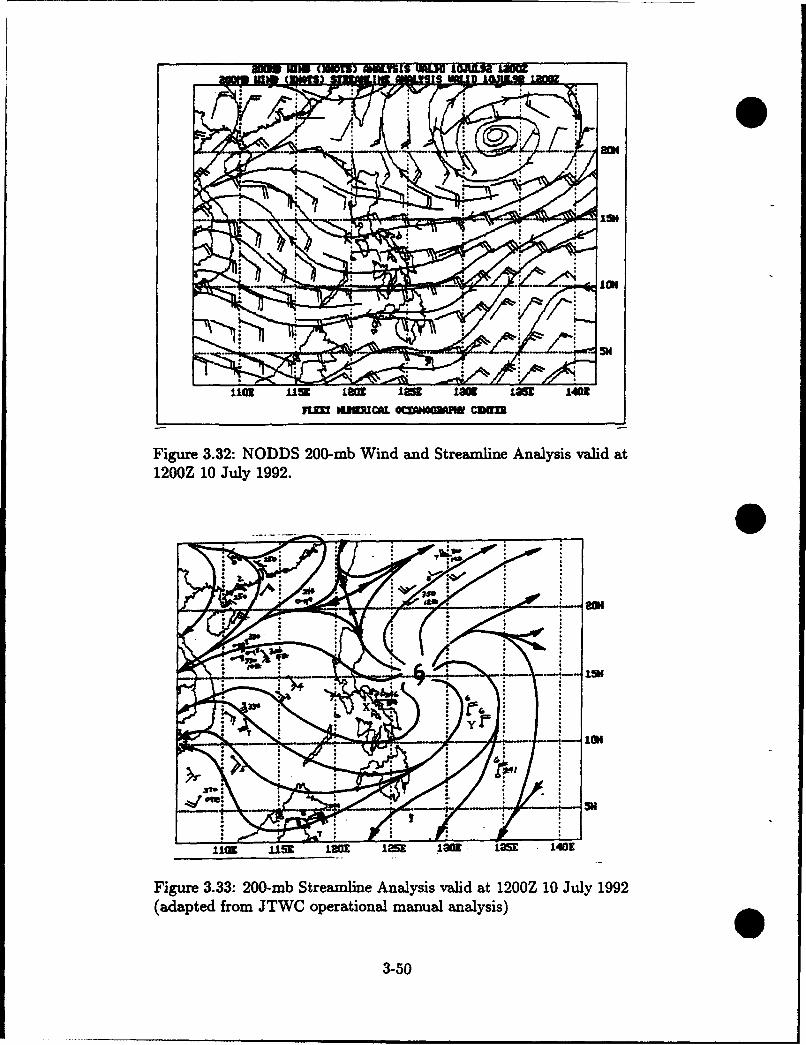
1S103 9 AM 1 law loU jLam 14M1
YL= 1.MCAL MOCUM cram
Figure 3.32: NODDS 200-mb Wind and Streamline Analysis valid at1200Z 10 July 1992.
"1109 1152 la lam 120 135 1401
Figure 3.33: 200-mb Streamline Analysis valid at 1200Z 10 July 1992(adapted from JTWC operational manual analysis)
3-50
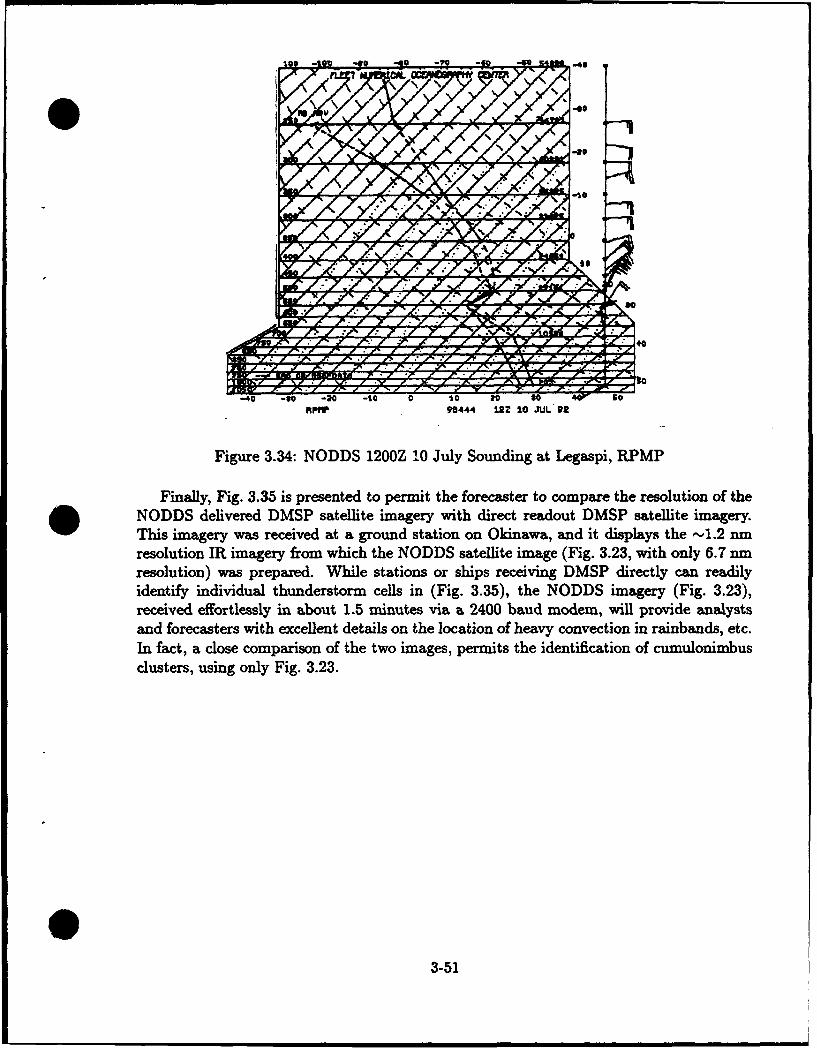
-40 -s0 -00 -10 "0 -C£
* NDD d liv oered DM .. stllit image." ry wih" d:!Q" '#i'rec readout D S sat : ellieiaey
identiFyniidual thu:nODerStr cells in (Fig. 3.35),n th NODSia geiryP Fi..2)
receiODD deffrlessly inS sabote1.5lintesiagr viata 2400 beaudmodem DMPatllpoide analeyst
and forecasters with excellent details on the location of heavy convection in rainbands, etc.In fact, a close comparison of the two images, permits the identification of cumnulonimbusclusters, using only Fig. 3.23.
03-51
IN ýI
Figure 3.35: DMSP IR Satellite Swath for 1229Z 10 July 1992 (received at Kadena AB,Japan)
3-52

11 July 1992
Moving faster and intensifying faster than predicted, 05W became Typhoon Eli withmaximum sustained winds of 75 kt located at 15.8-N, 122.2-E at 110000Z (110800Z LocalTime), moving 275°/21 ktzs. As shown on the 110000Z surface pressure analys:s, Fig. 3.37,NOGAPS locates the low pressure center (L) several degrees to the east of dhe warningposition (see Fig. 3.18); however, the large-scale cyclonic circulation associated with Eli iswell depicted by both ship and land station reports. The 110100Z DMSP visible satelliteimagery, Fig. 3.36, shows the typhoon signatures with convective feeder bands from thesouth and east, one hour after the surface analysis of Fig. 3.37.
The first NODDS zoom, Fig 3.38(a), reveals a ship (7KFY), off the NW coast ofLuzon, with 7.5-foot waves and 9-foot swell-'O, reporting wind 0500/25 kt. A further zoom,Fig. 3.38(b), shows Gasiguran (WMO 98336) with 4-dot (continuous, heavy) rain, wind0450/40 kt, with a 2.2 mb pressure falls3 . Baler (WMO 98333) reports 2-dot (continuous,slight) rain with a larger pressure tendency of -3.4 mb-hinting at the eventual landfall ofEli near Baler, about 2 hours later (see Fig. 3.18). The direction of Baler's wind, 2200, issuspect-likely a transmission error changing its direction from 0200 to 220*-; however,it may be the combination of a terrain-directed land and mountain breeze blowing "down"the valley in the early morning (0800 Local Time).
28The 24-h terminal forecast made by Cubi Point NAS, RP (RPMB, WMO 98426) at 102200Z, availablevia transmission FAPN10 KAWN (not shown), forecast winds gradually becoming 3400/12 kt, with gusts to22 kt in showers between 110500Z and 110700Z. Then, temporarily, the winds becoming variable 18 kt, withgusts to 28 kt, visibility 2 miles in thunderstorms between 110700Z and 112100Z.
29As the geography of Luzon becomes covered by Eli's convection, the reader must visualize the positionof Luzon directly south of Taiwan, which remains visible on Fig. 3.36.
3°Sea and swell are reported in units of 0.5 meter (-1.5 feet); therefore, (0805) = seas with a period of 08seconds, height of 7.5 feet and (081006) = swell from 0800, with a period of 10 seconds and height of 9 feet.
31This barometer fall exists due to the approach of Typhoon Eli, despite the large (tropical) "atmospherictide" increase experienced between 0400 and 1000 Local Time.
3-53
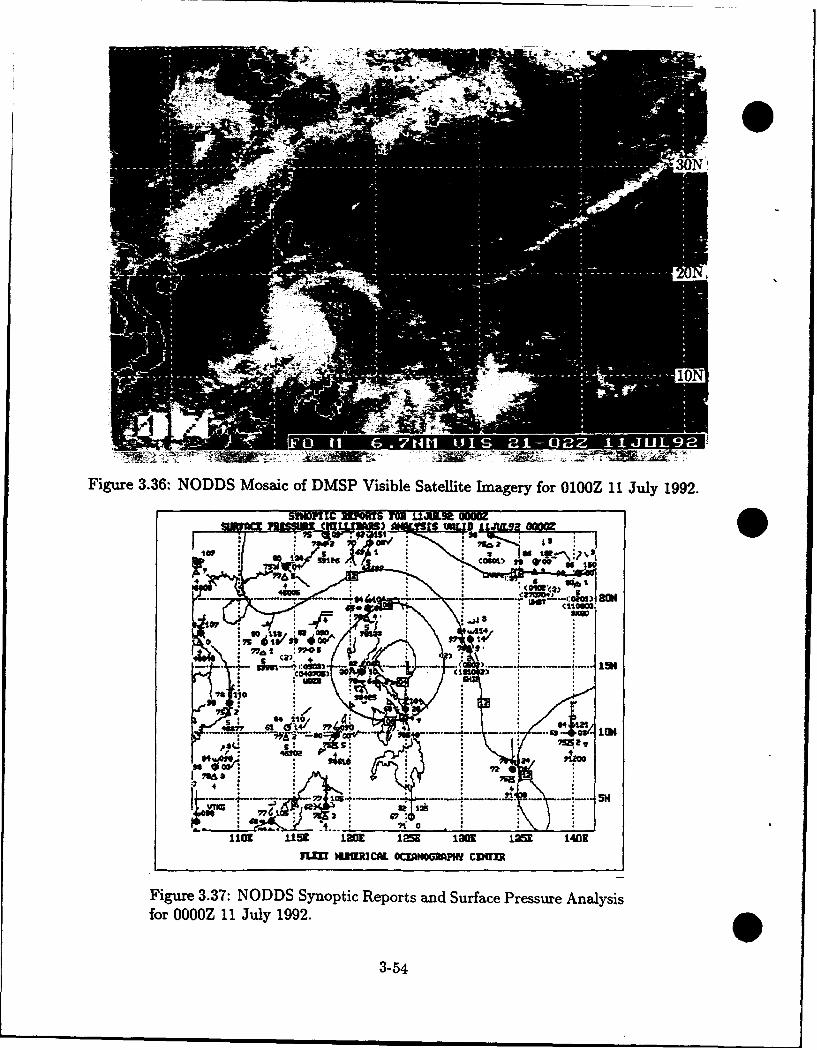
301N
Figure 3.36: NODDS Mosaic of DMSP Visible Satellite Imagery for 0100Z 11 July 1992.smnio~c momus M 1.1=9li2 0ooM
1101 1151 I1 1E 185 • O 1 35)1J. 1401•SfLI? tRICAL OCTAWOGPIWlq CD•TJlt
Figure 3.37: NODDS Synoptic Reports and Surface Pressure Analysisfor O00Z 1I July 1992.W
3-54
45M|
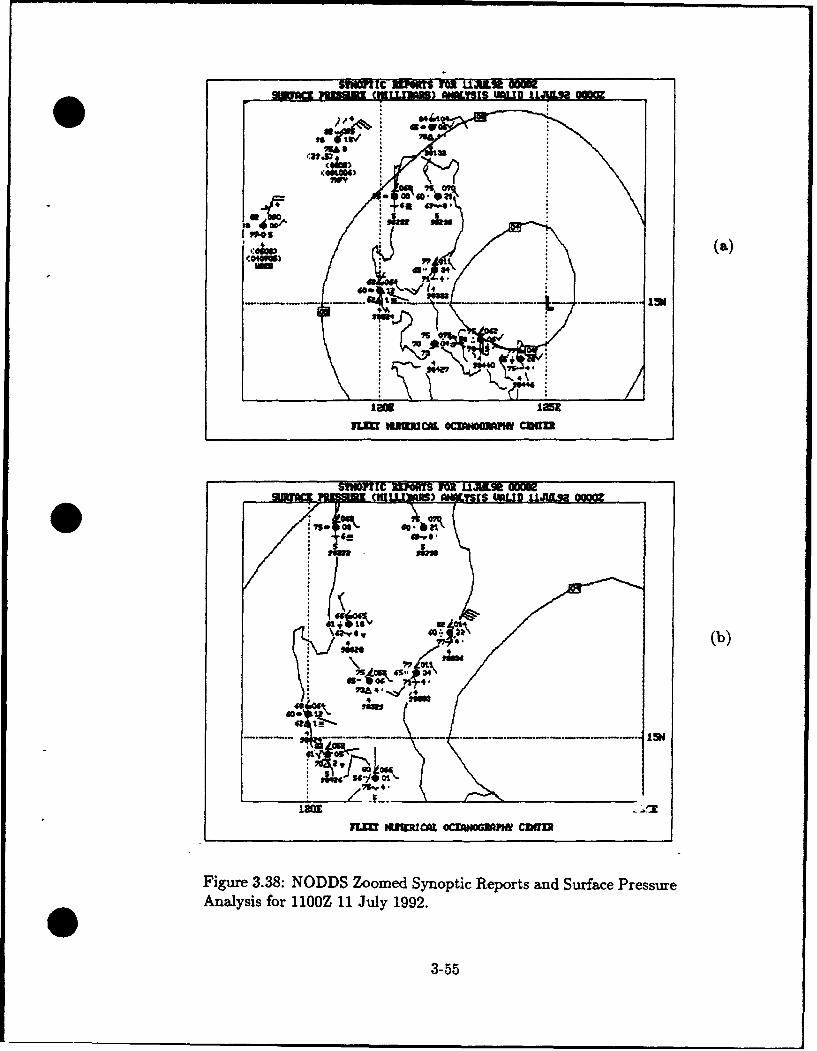
S!•OPUC 3 UULUL GO•Mmar= iM Ii IM w AN ms mUU ILJM =a
"1 w(a.)
34
mIt
70 ,*
43
lawE 1251
SIHMMEC MUMORS 10R ).1,UWE Ow
foz
,• ,€. .•, .. (b)
. ... . ...... i s m
F= LMWT UgR OCZANOGMMW CMwn
Figure 3.38: NODDS Zoomed Synoptic Reports and Surface PressureAnalysis for 110OZ 11 July 1992.
3-55
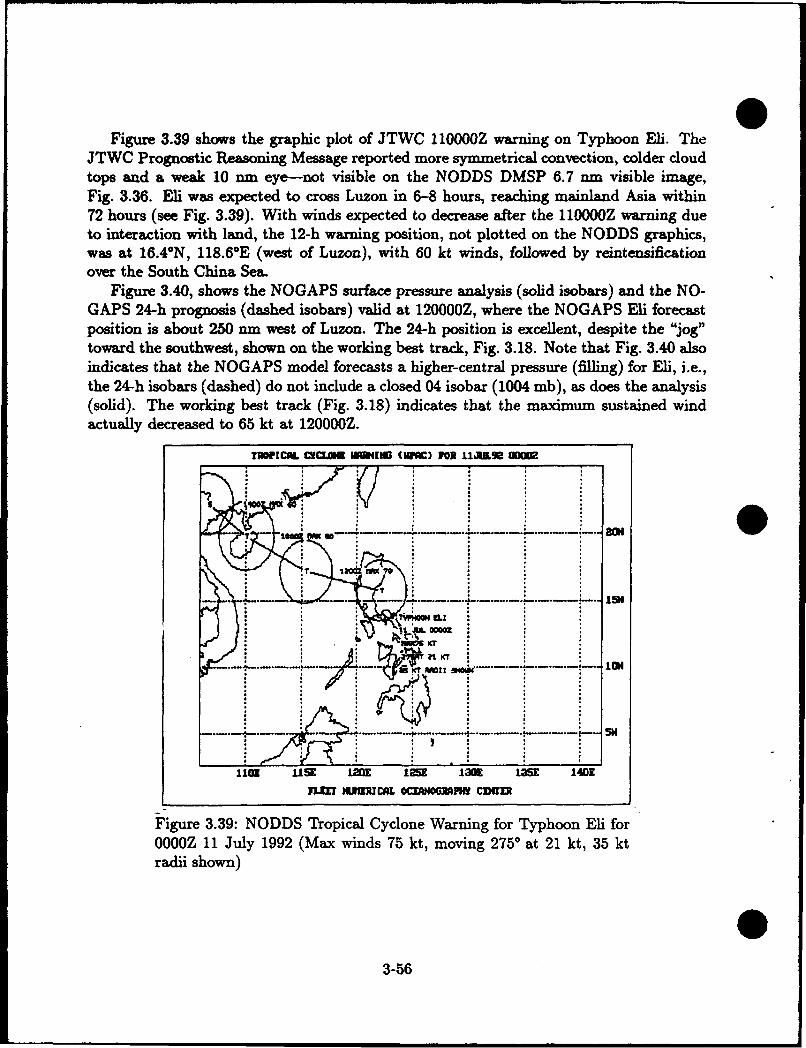
Figure 3.39 shows the graphic plot of JTWC 110000Z warning on Typhoon Eli. TheJTWC Prognostic Reasoning Message reported more symmetrical convection, colder cloudtops and a weak 10 nm eye-not visible on the NODDS DMSP 6.7 nm visible image,Fig. 3.36. Eli was expected to cross Luzon in 6-8 hours, reaching mainland Asia within72 hours (see Fig. 3.39). With winds expected to decrease after the l10000Z warning dueto interaction with land, the 12-h warning position, not plotted on the NODDS graphics,was at 16.4°N, 118.6°E (west of Luzon), with 60 kt winds, followed by reintensificationover the South China Sea.
Figure 3.40, shows the NOGAPS surface pressure analysis (solid isobars) and the NO-GAPS 24-h prognosis (dashed isobars) valid at 120000Z, where the NOGAPS Eli forecastposition is about 250 nm west of Luzon. The 24-h position is excellent, despite the "jog"toward the southwest, shown on the working best track, Fig. 3.18. Note that Fig. 3.40 alsoindicates that the NOGAPS model forecasts a higher-central pressure (filling) for Eli, i.e.,the 24-h isobars (dashed) do not include a closed 04 isobar (1004 mb), as does the analysis(solid). The working best track (Fig. 3.18) indicates that the maximum sustained windactually decreased to 65 kt at 120000Z.
TROPICAL •ansOA SMA•MING (WWt) FOR UIRL8 00002
- , ii, 9:
.. .W 104X........ I, IDZ ................... H
. .. . - -- -. -. ..... . - - - --. --
110! USE i2mi 12 130! 125E14Onnr MI.IJCAL OcLCJ.ORMW CDITfl
Figure 3.39: NODDS Tropical Cyclone Warning for Typhoon Eli forOOOOZ 11 July 1992 (Max winds 75 kt, moving 275° at 21 kt, 35 ktradii shown)
3-56
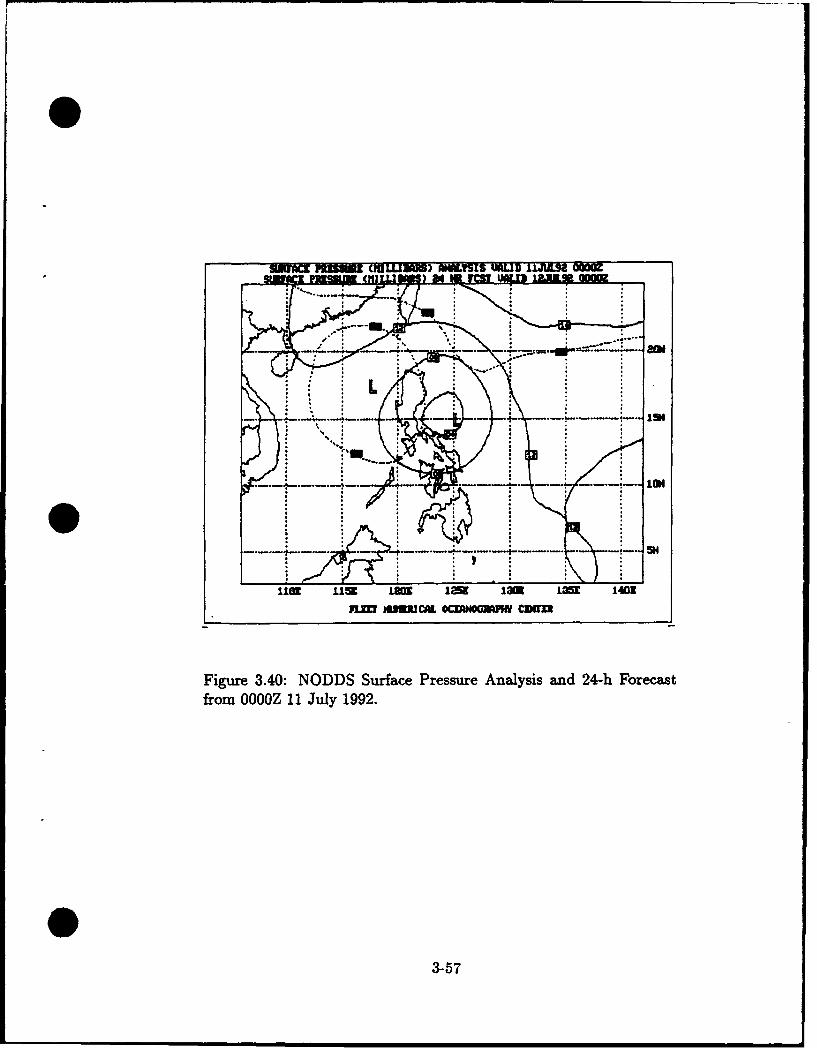
USW= 1 UR1 CiILLIUS) KISIS URUD Llimm O
.111M MLW Jn CZNOGAM Ownl
Figure 3.40: NODDS Surface Pressure Analysis and 24-h Forecastfrom OOOOZ 11 July 1992.
3-57
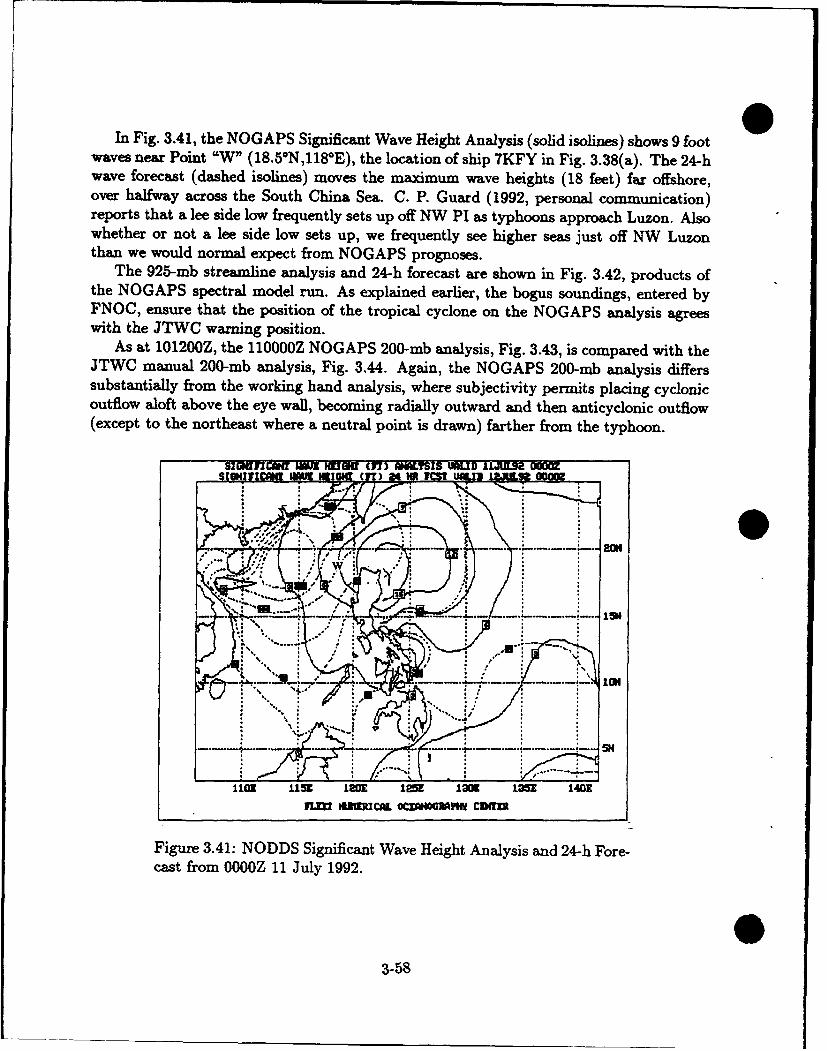
In Fig. 3.41, the NOGAPS Significant Wave Height Analysis (solid isolines) shows 9 footwaves near Point "W" (18.5*N,118 0 E), the location of ship 7KFY in Fig. 3.38(a). The 24-hwave forecast (dashed isolines) moves the maximum wave heights (18 feet) far offshore,over halfway across the South China Sea. C. P. Guard (1992, personal communication)reports that a lee side low frequently sets up off NW PI as typhoons approach Luzon. Alsowhether or not a lee side low sets up, we frequently see higher seas just off NW Luzonthan we would normal expect from NOGAPS prognoses.
The 925-mb streamline analysis and 24-h forecast are shown in Fig. 3.42, products ofthe NOGAPS spectral model run. As explained earlier, the bogus soundings, entered byFNOC, ensure that the position of the tropical cyclone on the NOGAPS analysis agreeswith the JTWC warning position.
As at 101200Z, the 110000Z NOGAPS 200-mb analysis, Fig. 3.43, is compared with theJTWC manual 200-mb analysis, Fig. 3.44. Again, the NOGAPS 200-mb analysis differssubstantially from the working hand analysis, where subjectivity permits placing cyclonicoutflow aloft above the eye wall, becoming radially outward and then anticyclonic outflow(except to the northeast where a neutral point is drawn) farther from the typhoon.
SIOMUTIM IWI NEJUU (IT) AMMYIS IMUD 11-JULSR O6OZSINFA on -Cry 24 M
A41 -- ----- 10Hi:
110Z S 15 2I0E 125E 1901 125 1401kaflW URCAL OCIAWOGIIAN cmaiT
Figure 3.41: NOODS Significant Wave Height Analysis and 24-h Fore-cast from OOOOZ 11 July 1992.
3-58
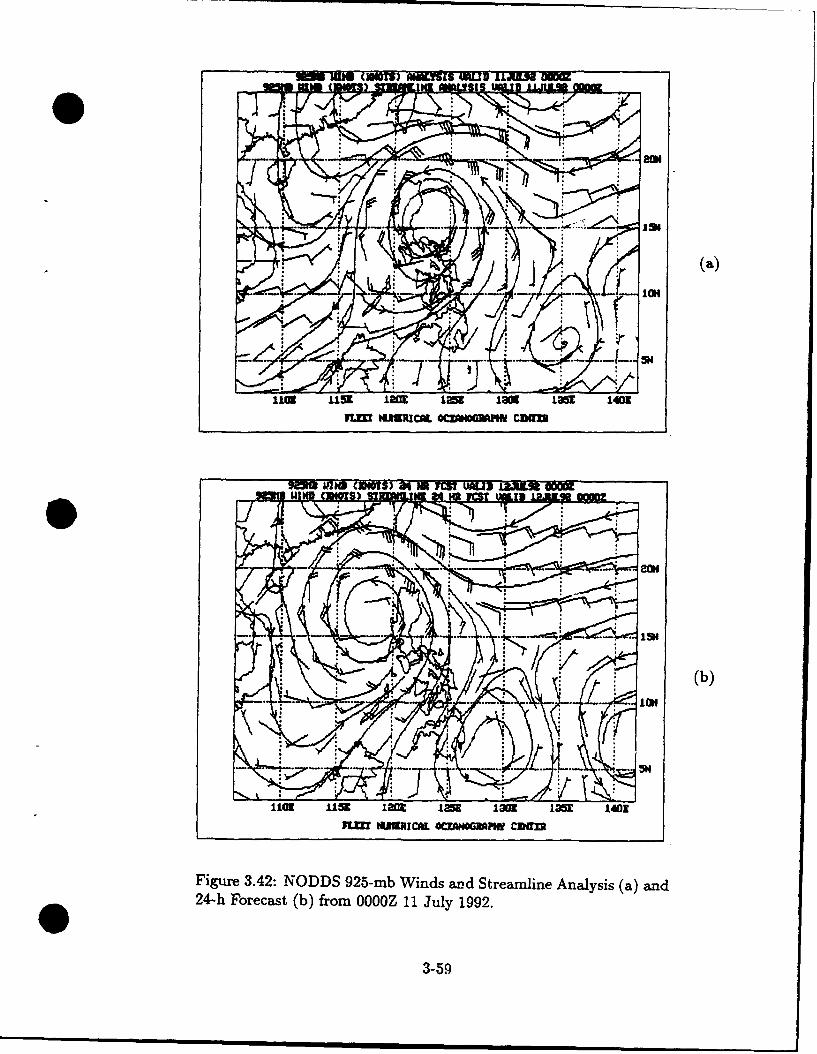
-Ulim (OmS) NMZ5[S 'MUD UJILU• •Om
(a)• --- 10"t
110 • U 59r t2 f I= I=8] LOS 1409e
ILM HIMUUA OCZAokwmw OHMf
tan PONS C"€1S) 51 MR HE UALI MENUmI m
(b)
113 11U3 1.2I• £25B 130 M13E 1401n m muuCAL OCLANOGxPIw Cmal
Figure 3.42: NODDS 925-mb Winds and Streamline Analysis (a) and24-h Forecast (b) from OOOOZ 11 July 1992.
3-59
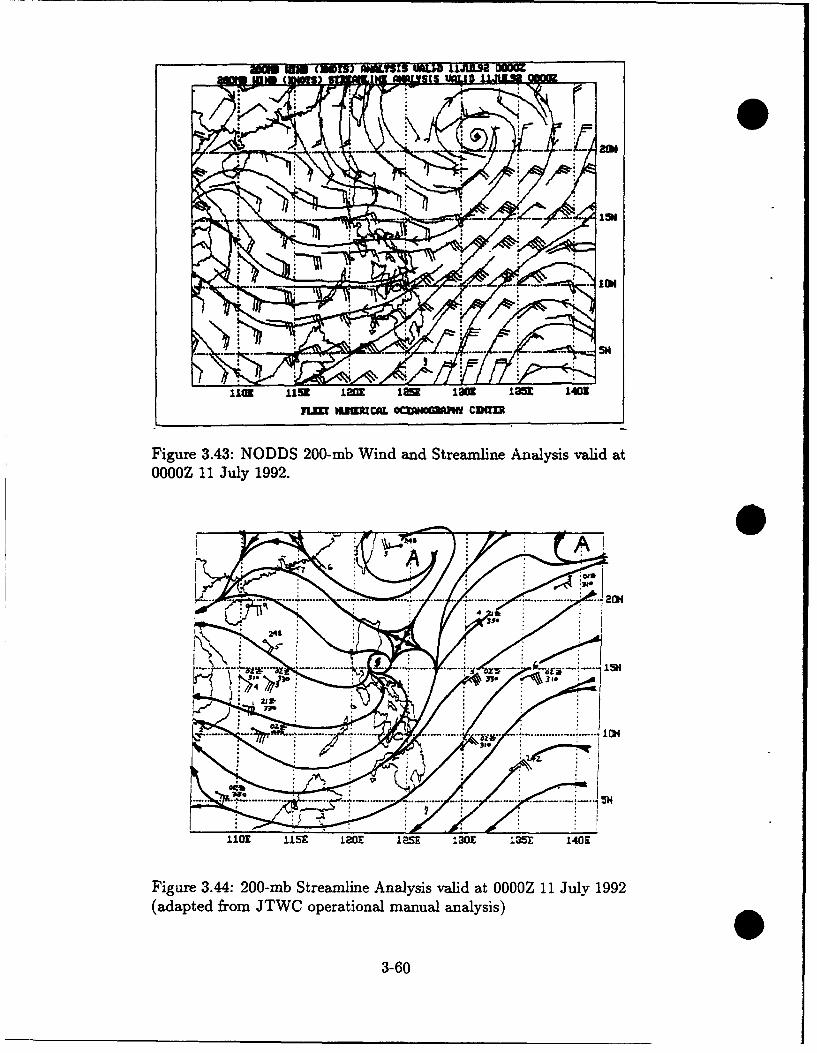
•I'"
fill o M JKl- X S "am 101E 135E 14MW
Figure 3.43: NODDS 200-mb Wind and Streamline Analysis valid atOOOOZ 11 July 1992.
........ ... ....... ... 4 0E
Figure 3.44: 200-mb Streamline Analysis valid at 0000Z 11 July 1992(adapted from JTWC operational manual analysis)
3-60
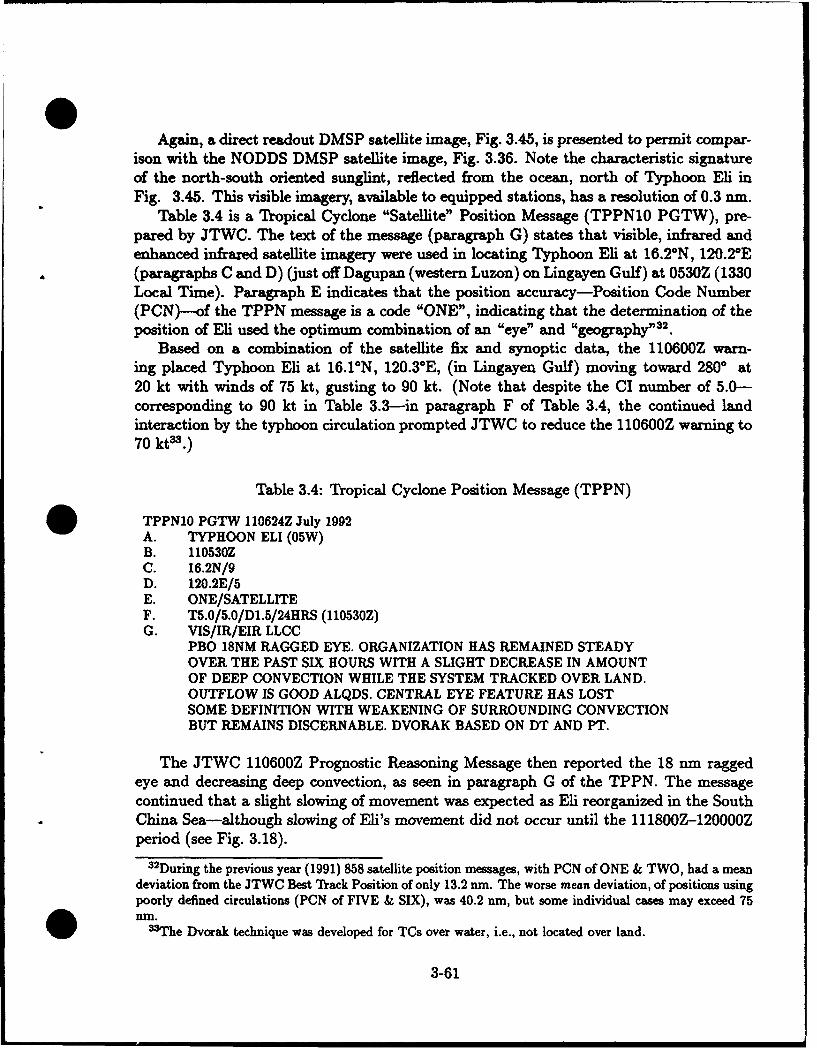
Again, a direct readout DMSP satellite image, Fig. 3.45, is presented to permit compar-ison with the NODDS DMSP satellite image, Fig. 3.36. Note the characteristic signatureof the north-south oriented sunglint, reflected from the ocean, north of Typhoon Eli inFig. 3.45. This visible imagery, available to equipped stations, has a resolution of 0.3 nm.
Table 3.4 is a Tropical Cyclone "Satellite" Position Message (TPPN10 PGTW), pre-pared by JTWC. The text of the message (paragraph G) states that visible, infrared andenhanced infrared satellite imagery were used in locating Typhoon Eli at 16.2*N, 120.2*E(paragraphs C and D) (just off Dagupan (western Luzon) on Lingayen Gulf) at 0530Z (1330Local Time). Paragraph E indicates that the position accuracy-Position Code Number(PCN)--of the TPPN message is a code "ONE", indicating that the determination of theposition of Eli used the optimum combination of an "eye" and "geography" 32 .
Based on a combination of the satellite fix and synoptic data, the 110600Z warn-ing placed Typhoon Eli at 16.1*N, 120.3°E, (in Lingayen Gulf) moving toward 2800 at20 kt with winds of 75 kt, gusting to 90 kt. (Note that despite the CI number of 5.0-corresponding to 90 kt in Table 3.3-in paragraph F of Table 3.4, the continued landinteraction by the typhoon circulation prompted JTWC to reduce the 110600Z warning to70 ktw.)
Table 3.4: Tropical Cyclone Position Message (TPPN)
TPPN10 PGTW 110624Z July 1992A. TYPHOON ELI (05W)B. 110530ZC. I6.2N/9D. 120.2E/5E. ONE/SATELLITEF. T5.0/5.0/D1.5/24HRS (110530Z)G. VIS/IR/EIR LLCC
PBO 18NM RAGGED EYE. ORGANIZATION HAS REMAINED STEADYOVER THE PAST SIX HOURS WITH A SLIGHT DECREASE IN AMOUNTOF DEEP CONVECTION WHILE THE SYSTEM TRACKED OVER LAND.OUTFLOW IS GOOD ALQDS. CENTRAL EYE FEATURE HAS LOSTSOME DEFINITION WITH WEAKENING OF SURROUNDING CONVECTIONBUT REMAINS DISCERNABLE. DVORAK BASED ON DT AND PT.
The JTWC 110600Z Prognostic Reasoning Message then reported the 18 nm raggedeye and decreasing deep convection, as seen in paragraph G of the TPPN. The messagecontinued that a slight slowing of movement was expected as Eli reorganized in the SouthChina Sea-although slowing of Eli's movement did not occur until the 111800Z-120000Zperiod (see Fig. 3.18).
32During the previous year (1991) 858 satellite position messages, with PCN of ONE & TWO, had a meandeviation from the JTWC Best Track Position of only 13.2 nm. The worse mean deviation, of positions usingpoorly defined circulations (PCN of FIVE & SIX), was 40.2 nm, but some individual cases may exceed 75nm.
3The Dvorak technique was developed for TCs over water, i.e., not located over land.
3-61
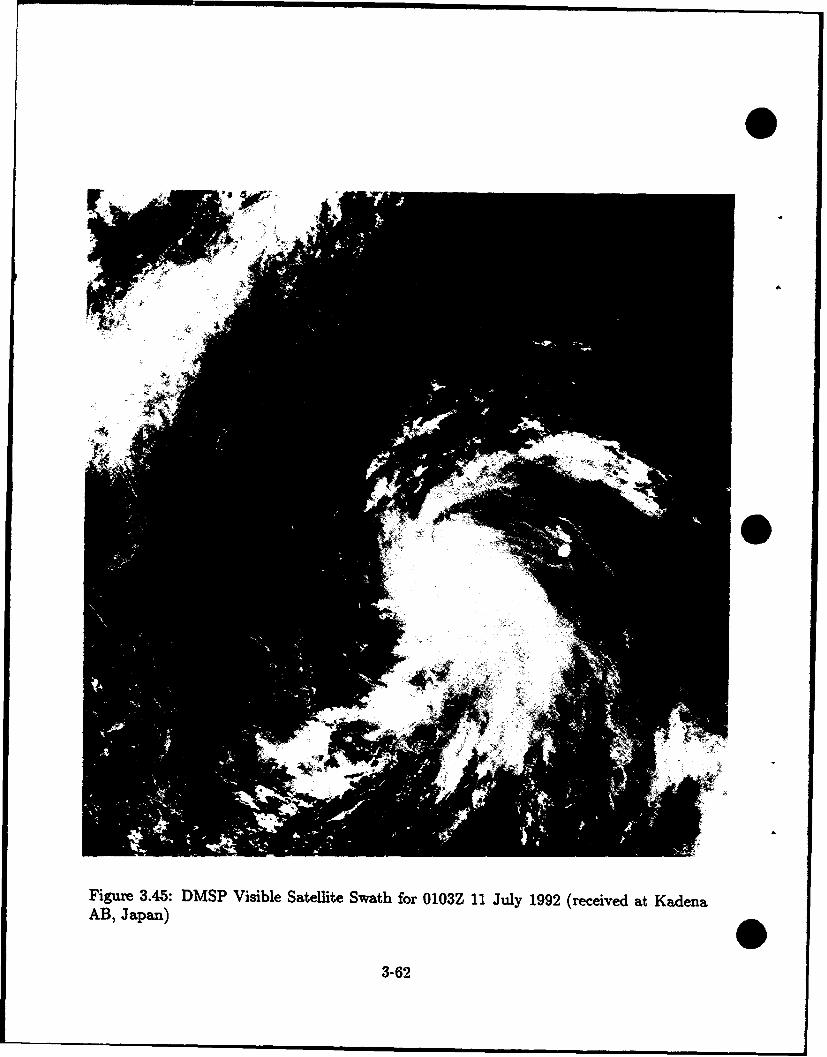
Figure 3.45: DMSP Visible Satellite Swath for 0103Z 11 July 1992 (received at KadenaAB, Japan)
3-62
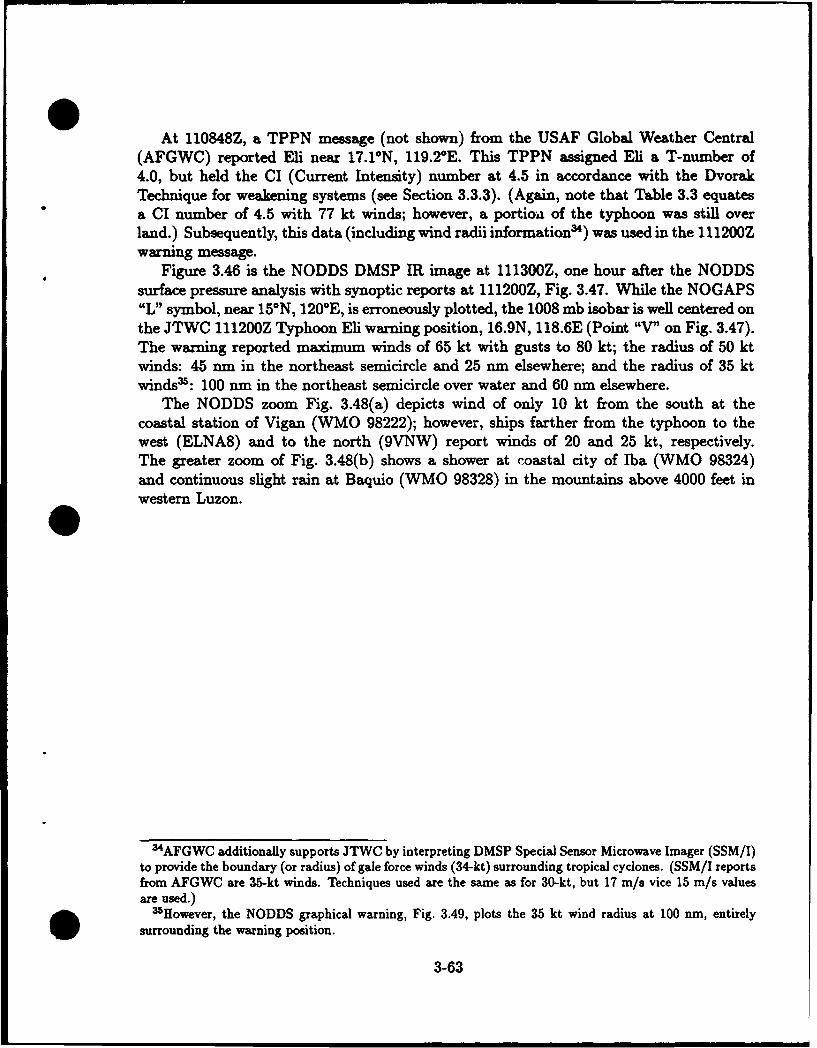
At 110848Z, a TPPN message (not shown) from the USAF Global Weather Central(AFGWC) reported Eli near 17.10N, 119.2°E. This TPPN assigned Eli a T-number of4.0, but held the CI (Current Intensity) number at 4.5 in accordance with the DvorakTechnique for weakening systems (see Section 3.3.3). (Again, note that Table 3.3 equatesa CI number of 4.5 with 77 kt winds; however, a portion of the typhoon was still overland.) Subsequently, this data (including wind radii information4) was used in the 111200Zwarning message.
Figure 3.46 is the NODDS DMSP IR image at 111300Z, one hour after the NODDSsurface pressure analysis with synoptic reports at 111200Z, Fig. 3.47. While the NOGAPS"L" symbol, near 15°N, 120°E, is erroneously plotted, the 1008 mb isobar is well centered onthe JTWC 111200Z Typhoon Eli warning position, 16.9N, 118.6E (Point "V" on Fig. 3.47).The warning reported maximum winds of 65 kt with gusts to 80 kt; the radius of 50 ktwinds: 45 nm in the northeast semicircle and 25 nm elsewhere; and the radius of 35 ktwinds•: 100 nm in the northeast semicircle over water and 60 nm elsewhere.
The NODDS zoom Fig. 3.48(a) depicts wind of only 10 kt from the south at thecoastal station of Vigan (WMO 98222); however, ships farther from the typhoon to thewest (ELNA8) and to the north (9VNW) report winds of 20 and 25 kt, respectively.The greater zoom of Fig. 3.48(b) shows a shower at coastal city of Iba (WMO 98324)and continuous slight rain at Baquio (WMO 98328) in the mountains above 4000 feet inwestern Luzon.
'AFGWC additionally supports JTWC by interpreting DMSP Special Sensor Microwave Imager (SSM/I)to provide the boundary (or radius) of gale force winds (34-kt) surrounding tropical cyclones. (SSM/I reportsfrom AFGWC are 35-kt winds. Techniques used are the same as for 30-kt, but 17 m/s vice 15 m/s valuesare used.)
35However, the NODDS graphical warning, Fig. 3.49, plots the 35 kt wind radius at 100 nm, entirelysurrounding the warning position.
3-63
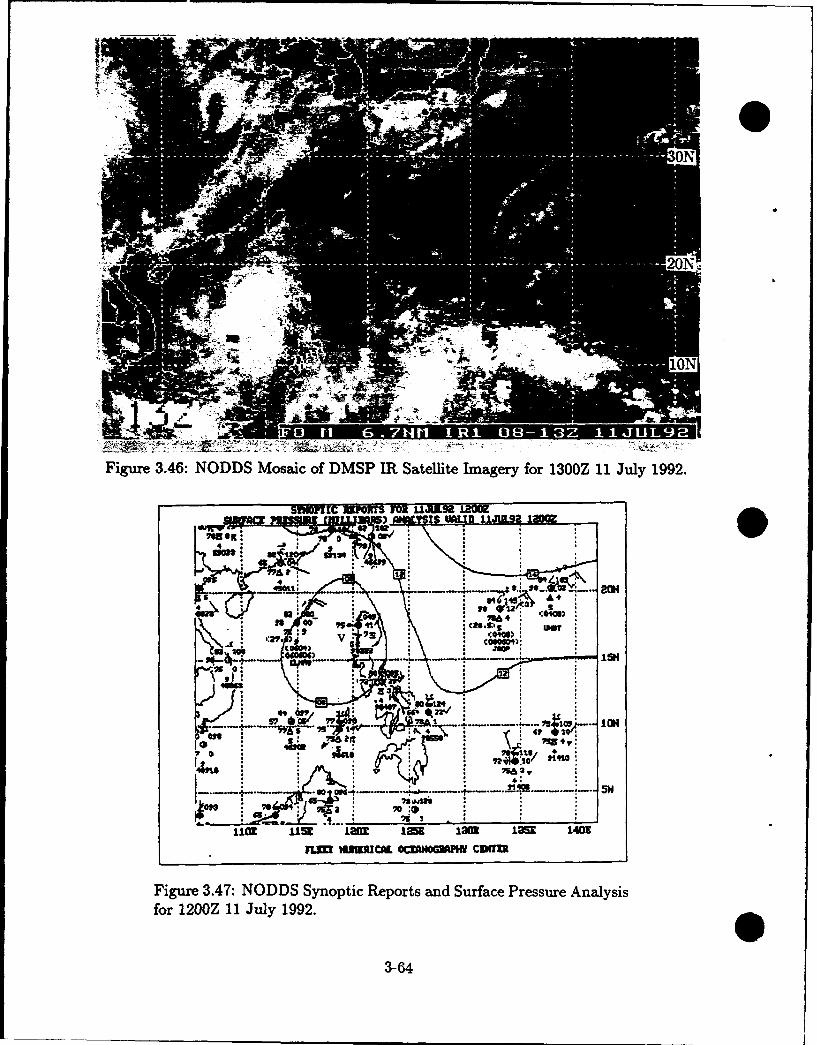
i0
Figure 3.46: NODDS Mosaic of DMSP IR Satellite Imagery for 1300Z 11 July 1992.
ismWWRYIC UpwRs MO LAUZ~ IRUM=4"
,,s:.. _ ;.",• ,
, 4*
Ir.l PHlO[C. • DTI
""aw __f__
Figure 3.47: NODDS Synoptic Reports and Surface Pressure Analysisfor 1200Z 11 July 1992.
3-64

5!NDFZIC 31"n M 1OUU.LU 12M1gram nano 4t.ins D UL
s(a)
4r
n4 umuci o•woo 4. "\
Figure .3.48: DD otc o rn:- ...... -nd_.. ..... P su
2 7%f, a
Analysis for 1200Z 11 July 1992.
3-65
wei
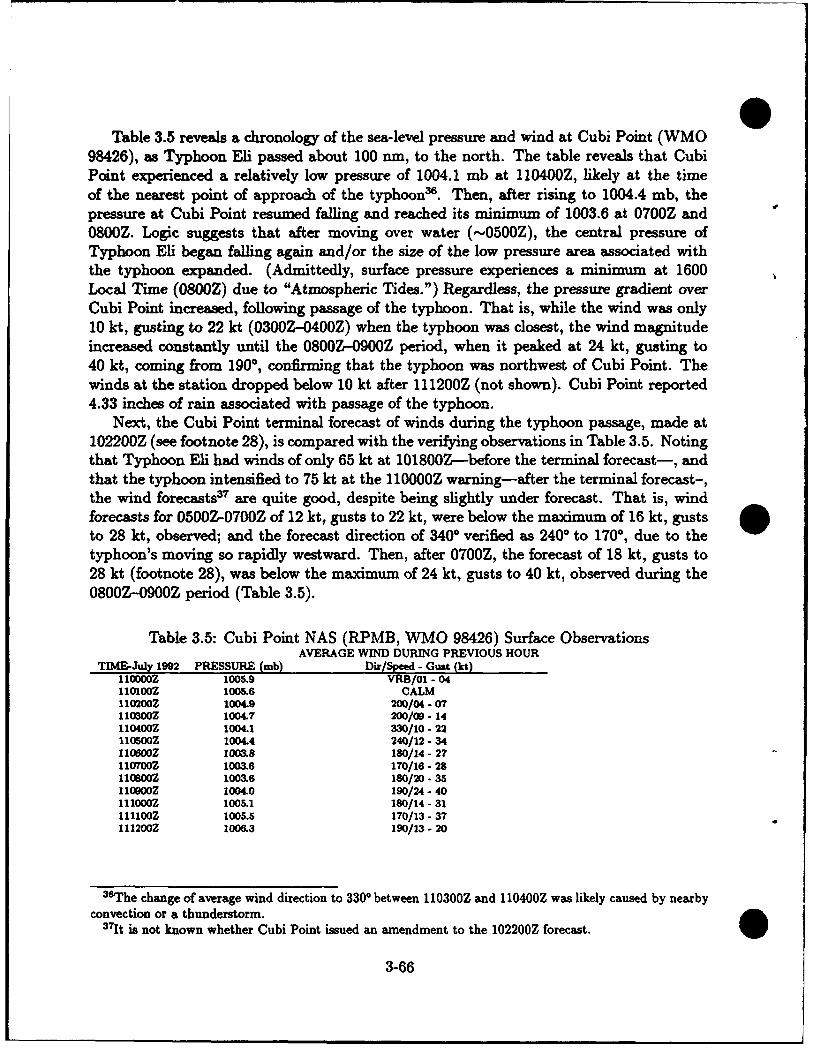
Table 3.5 reveals a chronology of the sea-level pressure and wind at Cubi Point (WMO98426), as Typhoon Eli passed about 100 nm, to the north. The table reveals that CubiPoint experienced a relatively low pressure of 1004.1 mb at 110400Z, likely at the timeof the nearest point of approach of the typhoon3m. Then, after rising to 1004.4 mb, thepressure at Cubi Point resumed falling and reached its minimum of 1003.6 at 0700Z and0800Z. Logic suggests that after moving over water ('-'0500Z), the central pressure ofTyphoon Eli began falling again and/or the size of the low pressure area associated withthe typhoon expanded. (Admittedly, surface pressure experiences a minimum at 1600Local Time (0800Z) due to "Atmospheric Tides.") Regardless, the pressure gradient overCubi Point increased, following passage of the typhoon. That is, while the wind was only10 kt, gusting to 22 kt (0300Z-0400Z) when the typhoon was closest, the wind magnitudeincreased constantly until the 0800Z-0900Z period, when it peaked at 24 kt, gusting to40 kt, coming from 190*, confirming that the typhoon was northwest of Cubi Point. Thewinds at the station dropped below 10 kt after 111200Z (not shown). Cubi Point reported4.33 inches of rain associated with passage of the typhoon.
Next, the Cubi Point terminal forecast of winds during the typhoon passage, made at102200Z (see footnote 28), is compared with the verifying observations in Table 3.5. Notingthat Typhoon Eli had winds of only 65 kt at 101800Z-before the terminal forecast-, andthat the typhoon intensified to 75 kt at the 110000Z warning-after the terminal forecast-,the wind forecasts37 are quite good, despite being slightly under forecast. That is, windforecasts for 0500Z-0700Z of 12 kt, gusts to 22 kt, were below the maximum of 16 kt, guststo 28 kt, observed; and the forecast direction of 3400 verified as 2400 to 170*, due to thetyphoon's moving so rapidly westward. Then, after 0700Z, the forecast of 18 kt, gusts to28 kt (footnote 28), was below the maximum of 24 kt, gusts to 40 kt, observed during the0800Z-0900Z period (Table 3.5).
Table 3.5: Cubi Point NAS (RPMB, WMO 98426) Surface ObservationsAVERAGE WIND DURING PREVIOUS HOUR
TIME-JuIy 1992 PRESSURE (mb) Dir/Speed - Gust (kt)110000Z 1005.9 VRB/01 - 04110100Z 1005.6 CALM110200Z 1004.9 200/04 - 07110300Z 1004.7 200/09- 14110400Z 1004.1 330/10- 22110500Z 1004.4 240/12 - 34110600Z 1003.8 180/14- 27110700Z 1003.6 170/16-28110800Z 1003.6 180/20 - 35110900Z 1004.0 190/24 - 40111000Z 1005.1 180/14 - 31111100Z 1005.5 170/13- 37111200Z 1006.3 190/13-20
3sThe change of average wind direction to 3300 between 110300Z and 110400Z was likely caused by nearbyconvection or a thunderstorm.
371t is not known whether Cubi Point issued an amendment to the 102200Z forecast.
3-66
Figure 3.49, the NODDS graphics plot of the JTWC 111200Z Typhoon Eli warning,plots the warning position, with the radius of 35 kt winds reaching the northern portionof Lingayen Gulf. Now, refer to the original tropical cyclone warning, Fig. 3.26, made24 hours earlier. While the predicted track direction is excellent, note that the original24-h forecast position of Eli (for 111200Z) was over central Luzon-i.e., the forecast wasslow. While the forecast speed of Eli crossing Luzon was 16 kt, Fig. 3.26, the workingbest track, Fig. 3.18, showed Eli moving at 16 kt for the first 6 hours, then at 25 kt, 19 ktand 18 kt, for the succeeding 6-hour periods. Also, while the 24-h maximum wind forecastat 111200Z was 60 kt, Fig. 3.26, and the verifying maximum wind was 65 kt, Fig. 3.49,note that Typhoon Eli had attained maximum winds of 75 kt earlier, while crossing thePhilippine Islands.
Again, while Table 3.5 showed hourly observations at Cubi Point, this station, openon the southwest to the South China Sea, typically experiences much higher winds thanthe more protected Manila International Airport (WMO 98429). That is, Cubi Point hadwind 1900/13 kt, gusts to 20 kt, during the 111100Z-111200Z period (Table 3.5), whileManila LAP had wind of only 180°/5 kt, at 111200Z (Fig. 3.48(b)).
Figure 3.50 is the 925-mb streamline analysis, "gradient level" analysis, in which theposition of Typhoon Eli can be readily visualized west of Lingayen Gulf. Once again itsposition was forced to agree with the JTWC warning position, by the automated insertionof the 13 soundings in the near vicinity of the typhoon.
03-67
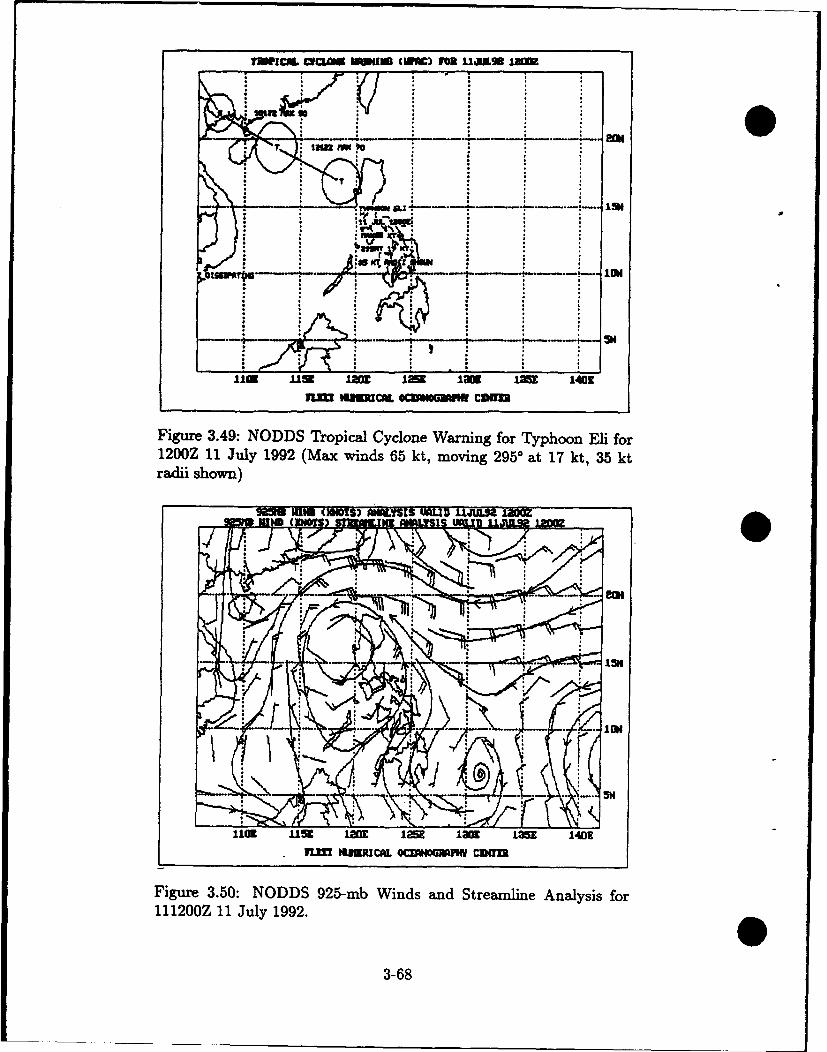
* *
"rJItCRL CKO W;MING CUI•) ran IK9RUL BM
inn- line
IIa lUst I= 1m 1a 12t1 1401
inm tIUNu CU e inii c=
Figure 3.49: NODDS Tropical Cyclone Warning for Typhoon Eli for1200Z 11 July 1992 (Max winds 65 kt, moving 2950 at 17 kt, 35 ktradii shown)
92= RINIEI iALscxn WaiD llamw C
Figure 3.50: NODDS 925-mb Winds and Streamline Analysis forll1200Z 11 July 1992.
3-68
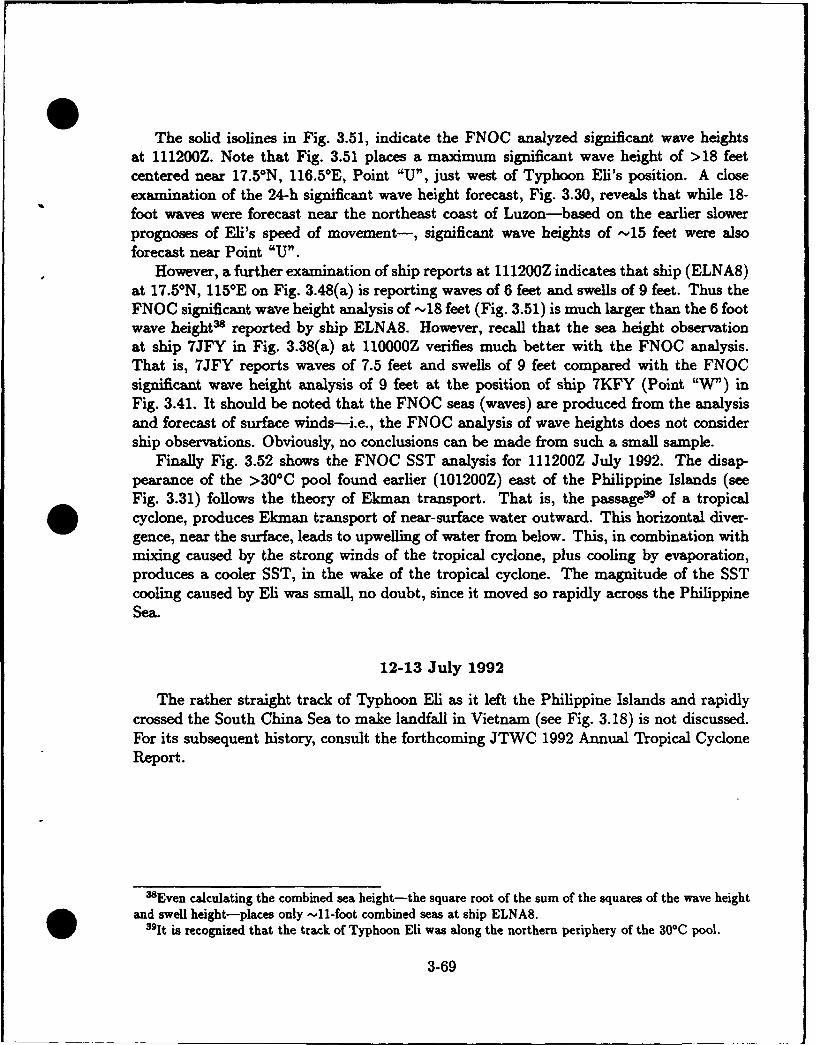
The solid isolines in Fig. 3.51, indicate the FNOC analyzed significant wave heightsat 111200Z. Note that Fig. 3.51 places a maximum significant wave height of >18 feetcentered near 17.5°N, 116.5°E, Point "U", just west of Typhoon Eli's position. A closeexamination of the 24-h significant wave height forecast, Fig. 3.30, reveals that while 18-foot waves were forecast near the northeast coast of Luzon-based on the earlier slowerprognoses of Eli's speed of movement-, significant wave heights of -"15 feet were alsoforecast near Point "U".
However, a further examination of ship reports at 111200Z indicates that ship (ELNA8)at 17.5°N, 115°E on Fig. 3.48(a) is reporting waves of 6 feet and swells of 9 feet. Thus theFNOC significant wave height analysis of -18 feet (Fig. 3.51) is much larger than the 6 footwave height-s reported by ship ELNA8. However, recall that the sea height observationat ship 7JFY in Fig. 3.38(a) at 110000Z verifies much better with the FNOC analysis.That is, 7JFY reports waves of 7.5 feet and swells of 9 feet compared with the FNOCsignificant wave height analysis of 9 feet at the position of ship 7KFY (Point "W") inFig. 3.41. It should be noted that the FNOC seas (waves) are produced from the analysisand forecast of surface winds-i.e., the FNOC analysis of wave heights does not considership observations. Obviously, no conclusions can be made from such a small sample.
Finally Fig. 3.52 shows the FNOC SST analysis for 111200Z July 1992. The disap-pearance of the >300C pool found earlier (101200Z) east of the Philippine Islands (seeFig. 3.31) follows the theory of Ekman transport. That is, the passage39 of a tropicalcyclone, produces Ekman transport of near-surface water outward. This horizontal diver-gence, near the surface, leads to upwelling of water from below. This, in combination withmixing caused by the strong winds of the tropical cyclone, plus cooling by evaporation,produces a cooler SST, in the wake of the tropical cyclone. The magnitude of the SSTcooling caused by Eli was small, no doubt, since it moved so rapidly across the PhilippineSea.
12-13 July 1992
The rather straight track of Typhoon Eli as it left the Philippine Islands and rapidlycrossed the South China Sea to make landfall in Vietnam (see Fig. 3.18) is not discussed.For its subsequent history, consult the forthcoming JTWC 1992 Annual Tropical CycloneReport.
38Even calculating the combined sea height-the square root of the sum of the squares of the wave heightand swell height-places only -Il1-foot combined seas at ship ELNA8.
391It is recognized that the track of Typhoon Eli was along the northern periphery of the 300C pool.
3-69
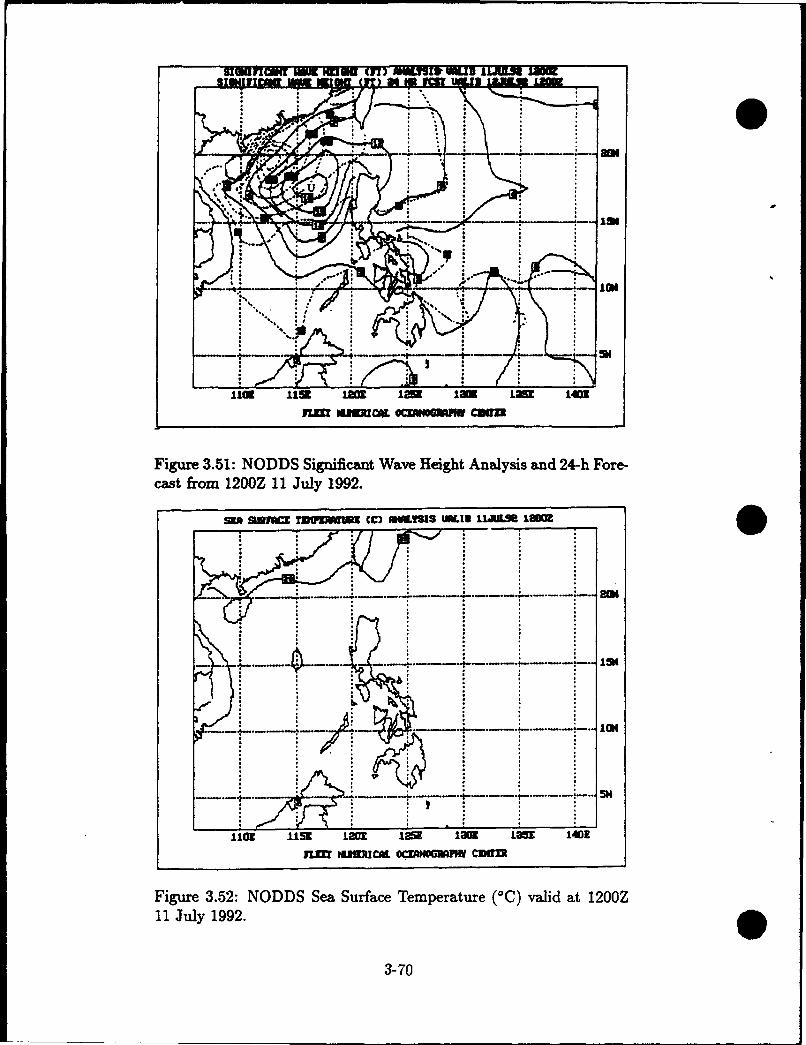
SIwMnIca• =9 HUlMl (77) "iiMi MULD ILKEE L1
oS
- .-- -) I" ---.
111 1159 Lt 1201 M iK 1=5 1403
imL .MCA Oe.moM/w cam
Figure 3.51: NODDS Significant Wave Height Analysis and 24-h Fore-cast from 1200Z 11 July 1992.
up Uslmcr TUwiMIZ cc) wKYIMS UMIN IIAL98 1
-- -I ---- 5
I •
Figure 3.52: NODDS Sea Surface Temperature (*C) valid at 1200Z11 July 1992.
3-70
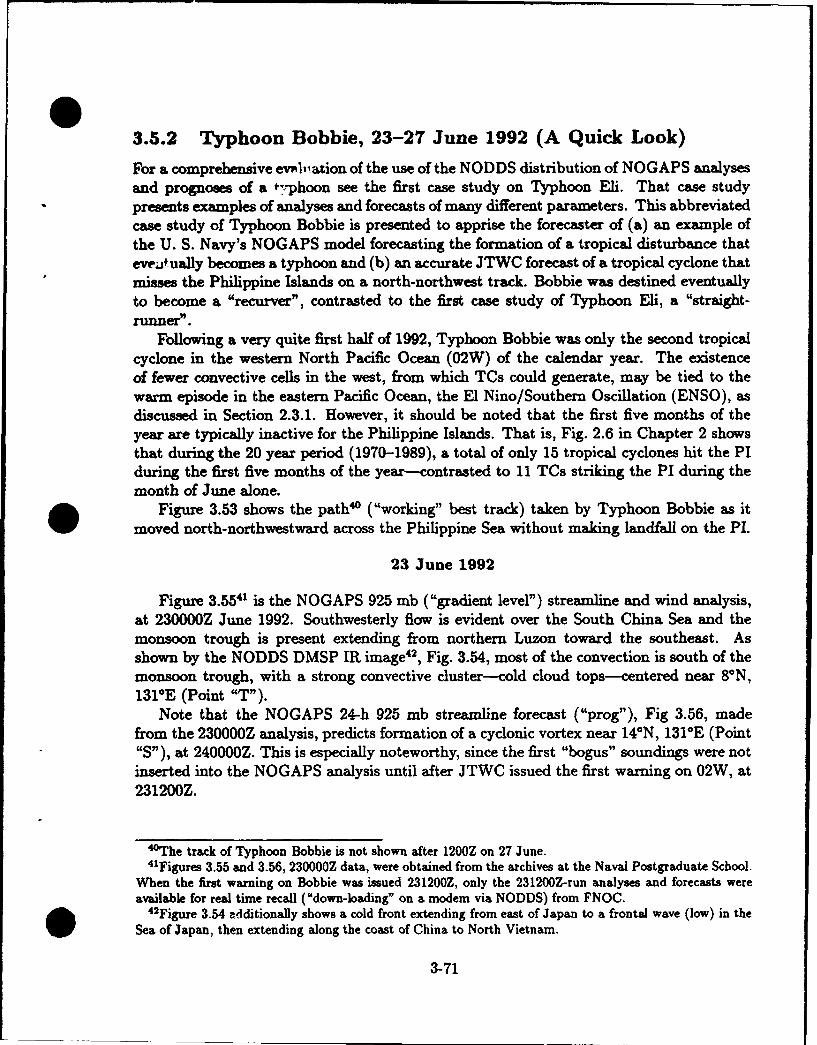
3.5.2 Typhoon Bobbie, 23-27 June 1992 (A Quick Look)
For a comprehensive ev'I,•ation of the use of the NODDS distribution of NOGAPS analysesand prognoses of a t-rphoon see the first case study on Typhoon Eli. That case studypresents examples of analyses and forecasts of many different parameters. This abbreviatedcase study of Typhoon Bobbie is presented to apprise the forecaster of (a) an example ofthe U. S. Navy's NOGAPS model forecasting the formation of a tropical disturbance thateveitually becomes a typhoon and (b) an accurate JTWC forecast of a tropical cyclone thatmisses the Philippine Islands on a north-northwest track. Bobbie was destined eventuallyto become a "recurver", contrasted to the first case study of Typhoon Eli, a "straight-runner".
Following a very quite first half of 1992, Typhoon Bobbie was only the second tropicalcyclone in the western North Pacific Ocean (02W) of the calendar year. The existenceof fewer convective cells in the west, from which TCs could generate, may be tied to thewarm episode in the eastern Pacific Ocean, the El Nino/Southern Oscillation (ENSO), asdiscussed in Section 2.3.1. However, it should be noted that the first five months of theyear are typically inactive for the Philippine Islands. That is, Fig. 2.6 in Chapter 2 showsthat during the 20 year period (1970-1989), a total of only 15 tropical cyclones hit the PIduring the first five months of the year-contrasted to 11 TCs striking the PI during themonth of June alone.
Figure 3.53 shows the path' ("working" best track) taken by Typhoon Bobbie as itmoved north-northwestward across the Philippine Sea without making landfall on the P1.
23 June 1992
Figure 3.5541 is the NOGAPS 925 mb ("gradient level") streamline and wind analysis,at 230000Z June 1992. Southwesterly flow is evident over the South China Sea and themonsoon trough is present extending from northern Luzon toward the southeast. Asshown by the NODDS DMSP IR image42, Fig. 3.54, most of the convection is south of themonsoon trough, with a strong convective cluster-cold cloud tops-centered near 8°N,131-E (Point "T-).
Note that the NOGAPS 24-h 925 mb streamline forecast ("prog"), Fig 3.56, madefrom the 230000Z analysis, predicts formation of a cyclonic vortex near 14°N, 1310E (Point"S"), at 240000Z. This is especially noteworthy, since the first "bogus" soundings were notinserted into the NOGAPS analysis until after JTWC issued the first warning on 02W, at231200Z.
4°The track of Typhoon Bobbie is not shown after 1200Z on 27 June."41Figures 3.55 and 3.56, 230000Z data, were obtained from the archives at the Naval Postgraduate School.
When the first warning on Bobbie was issued 231200Z, only the 231200Z-run analyses and forecasts wereavailable for real time recall ("down-loading" on a modem via NODDS) from FNOC.
4 2Figure 3.54 additionally shows a cold front extending from east of Japan to a frontal wave (low) in theSea of Japan, then extending along the coast of China to North Vietnam.
3-71
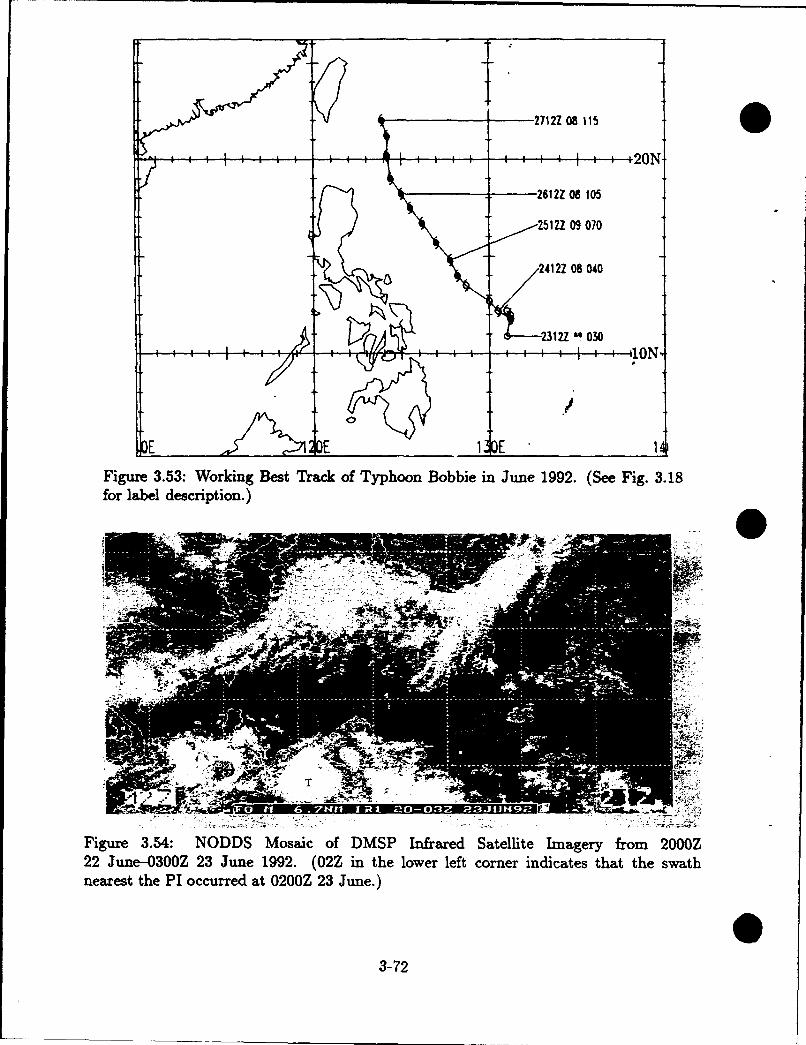
272 08 115
" : : : • I : : ! : : : I : +20N.i12 0810.I2512Z 09 070
2412Z 08 040
IE _ ,. E 1 E
Figure 3.53: Working Best Track of Typhoon Bobbie in June 1992. (See Fig. 3.18for label description.)
Figure 3.54: NODDS Mosaic of DMSP Infrared Satellite Imagery from 2000Z22 June-0300Z 23 June 1992. (02Z in the lower left comer indicates that the swathnearest the PI occurred at 0200Z 23 June.)
03-72
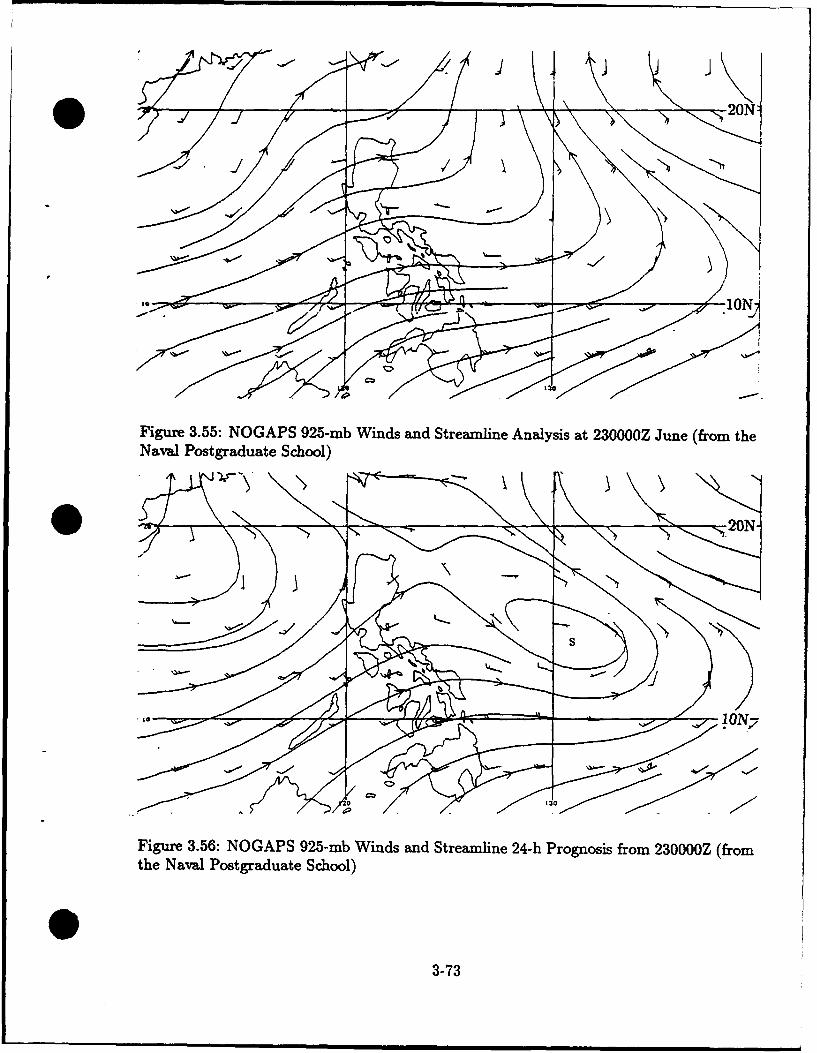
-720N-"
Figure 3.55: NOGAPS 925-mb Winds and Streamline Analysis at 230000Z June (from theNaval Postgraduate School)
Figure 3.56: NOGAPS 925-mb Winds and Streamline 24-h Prognosis from 230000Z (fromthe Naval Postgraduate School)
3-73
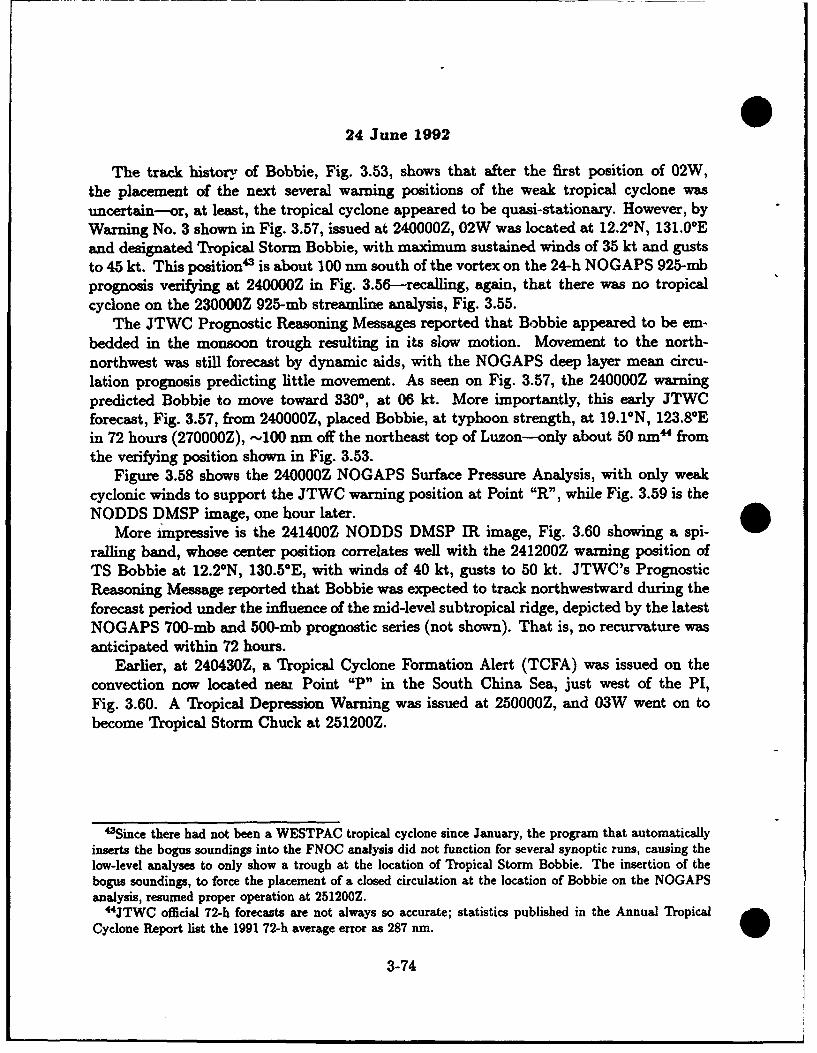
24 June 1992
The track history of Bobbie, Fig. 3.53, shows that after the first position of 02W,the placement of the next several warning positions of the weak tropical cyclone wasuncertain-or, at least, the tropical cyclone appeared to be quasi-stationary. However, byWarning No. 3 shown in Fig. 3.57, issued at 240000Z, 02W was located at 12.2°N, 131.0*Eand designated Tropical Storm Bobbie, with maximum sustained winds of 35 kt and guststo 45 kt. This position' is about 100 nm south of the vortex on the 24-h NOGAPS 925-mbprognosis verifying at 240000Z in Fig. 3.56-recalling, again, that there was no tropicalcyclone on the 230000Z 925-mb streamline analysis, Fig. 3.55.
The JTWC Prognostic Reasoning Messages reported that Bobbie appeared to be em-bedded in the monsoon trough resulting in its slow motion. Movement to the north-northwest was still forecast by dynamic aids, with the NOGAPS deep layer mean circu-lation prognosis predicting little movement. As seen on Fig. 3.57, the 240000Z warningpredicted Bobbie to move toward 3300, at 06 kt. More importantly, this early JTWCforecast, Fig. 3.57, from 240000Z, placed Bobbie, at typhoon strength, at 19.1°N, 123.8°Ein 72 hours (270000Z), ,100 nm off the northeast top of Luzon--only about 50 nm" fromthe verifying position shown in Fig. 3.53.
Figure 3.58 shows the 240000Z NOGAPS Surface Pressure Analysis, with only weakcyclonic winds to support the JTWC warning position at Point "R", while Fig. 3.59 is theNODDS DMSP image, one hour later.
More -mpressive is the 241400Z NODDS DMSP IR image, Fig. 3.60 showing a spi-ralling band, whose center position correlates well with the 241200Z warning position ofTS Bobbie at 12.2-N, 130.5*E, with winds of 40 kt, gusts to 50 kt. JTWC's PrognosticReasoning Message reported that Bobbie was expected to track northwestward during theforecast period under the influence of the mid-level subtropical ridge, depicted by the latestNOGAPS 700-mb and 500-mb prognostic series (not shown). That is, no recurvature wasanticipated within 72 hours.
Earlier, at 240430Z, a Tropical Cyclone Formation Alert (TCFA) was issued on theconvection now located near Point "P" in the South China Sea, just west of the PI,Fig. 3.60. A Tropical Depression Warning was issued at 250000Z, and 03W went on tobecome Tropical Storm Chuck at 251200Z.
'Since there had not been a WESTPAC tropical cyclone since January, the program that automaticallyinserts the bogus soundings into the FNOC analysis did not function for several synoptic runs, causing thelow-level analyses to only show a trough at the location of Tropical Storm Bobbie. The insertion of thebogus soundings, to force the placement of a closed circulation at the location of Bobbie on the NOGAPSanalysis, resumed proper operation at 251200Z.
4 4JTWC official 72-h forecasts are not always so accurate; statistics published in the Annual TropicalCyclone Report list the 1991 72-h average error as 287 nm.
3-74
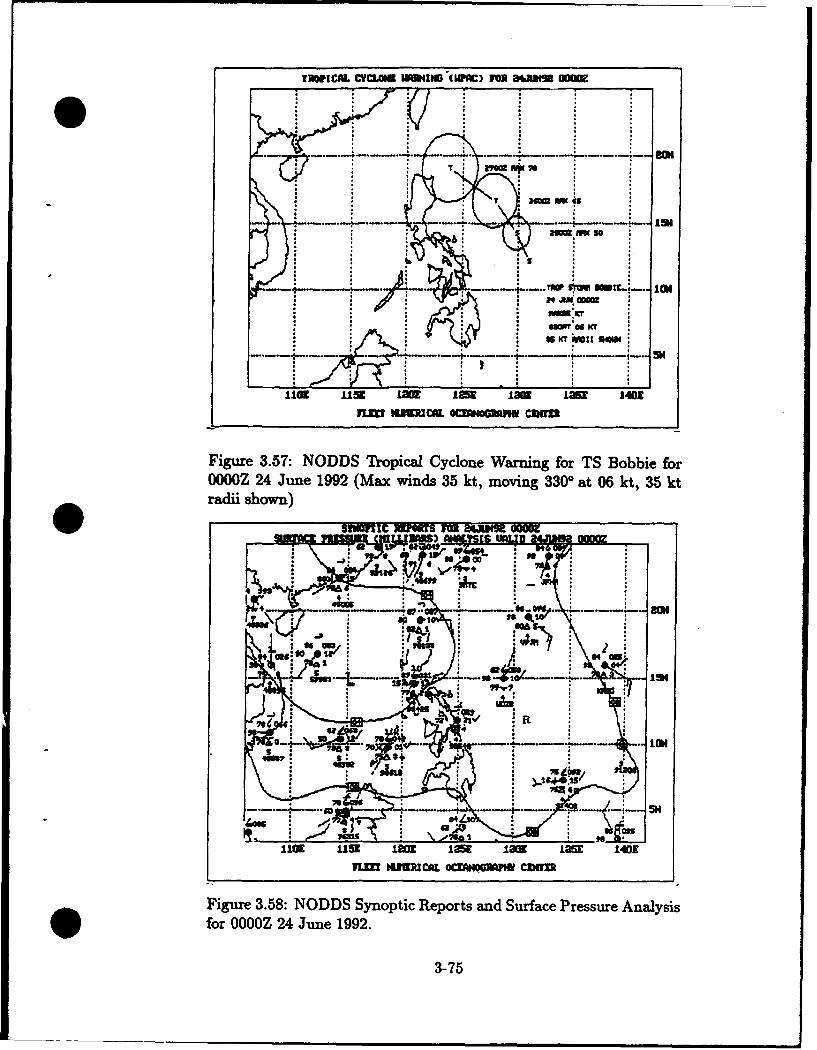
TROPICA. CY•O. ImUII3 "(WAC) FOR MJUltM OE
_ . ... ... .. ...... . ,w
• "-.. . .- -.. ... . . - "na -.. 1011
UICU
IwMI asCTa HO~T int SWAI
lie "at 199m 1a 2la 140M
1L= WLDKCAL OCUMOmM Ccram
Figure 3.57: NODDS Tropical Cyclone Warning for TS Bobbie forOOOOZ 24 June 1992 (Max winds 35 kt, moving 3300 at 06 kt, 35 ktradii shown)
- ' *A- gg, ' in
-- i-nw .. ..0)i "i ,
-.--- -'•1-- . 5H
1109 USE L25E 195 low imm 1,410
71=1 WUKUICOL OCEANOGRAM CMNU
Figure 3.58: NODDS Synoptic Reports and Surface Pressure Analysisfor OOOOZ 24 June 1992.
3-75
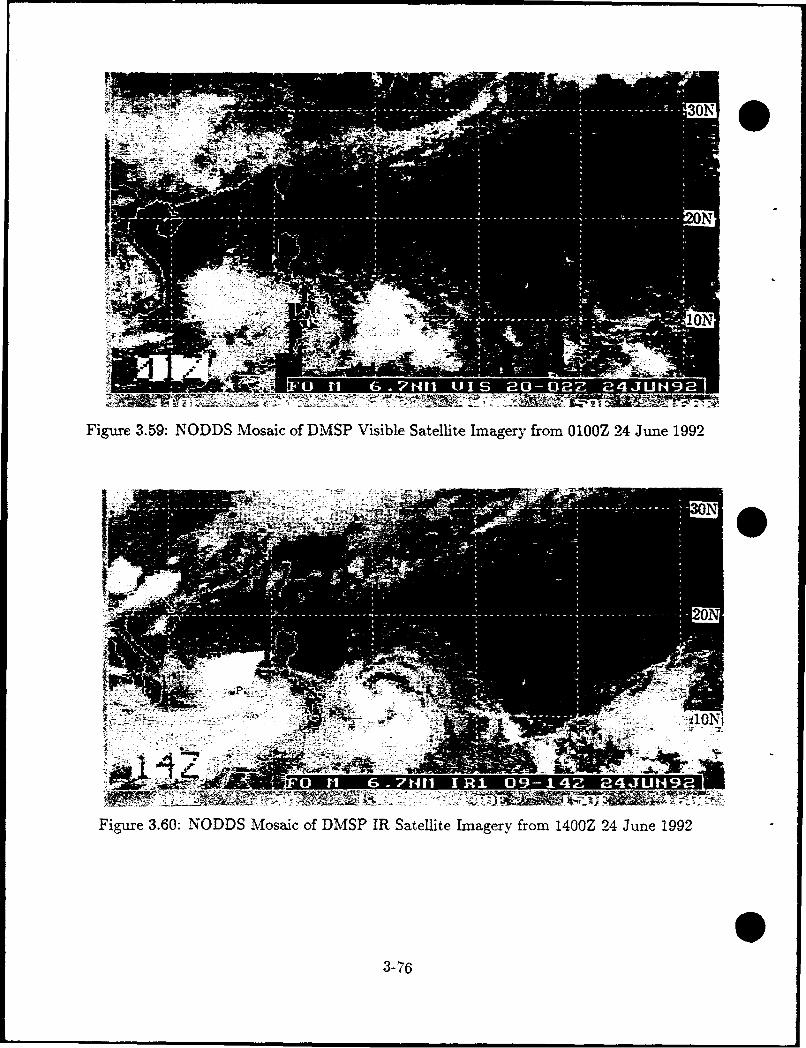
Figure 3.59: NODDS Mosaic of DMSP Visible Satellite Imagery from O10OZ 24 June 1992
Figoure 3.60: NODDS Mosaic of DMSP IR Satellite Imagery from 1400Z 24 June 1992
3-76
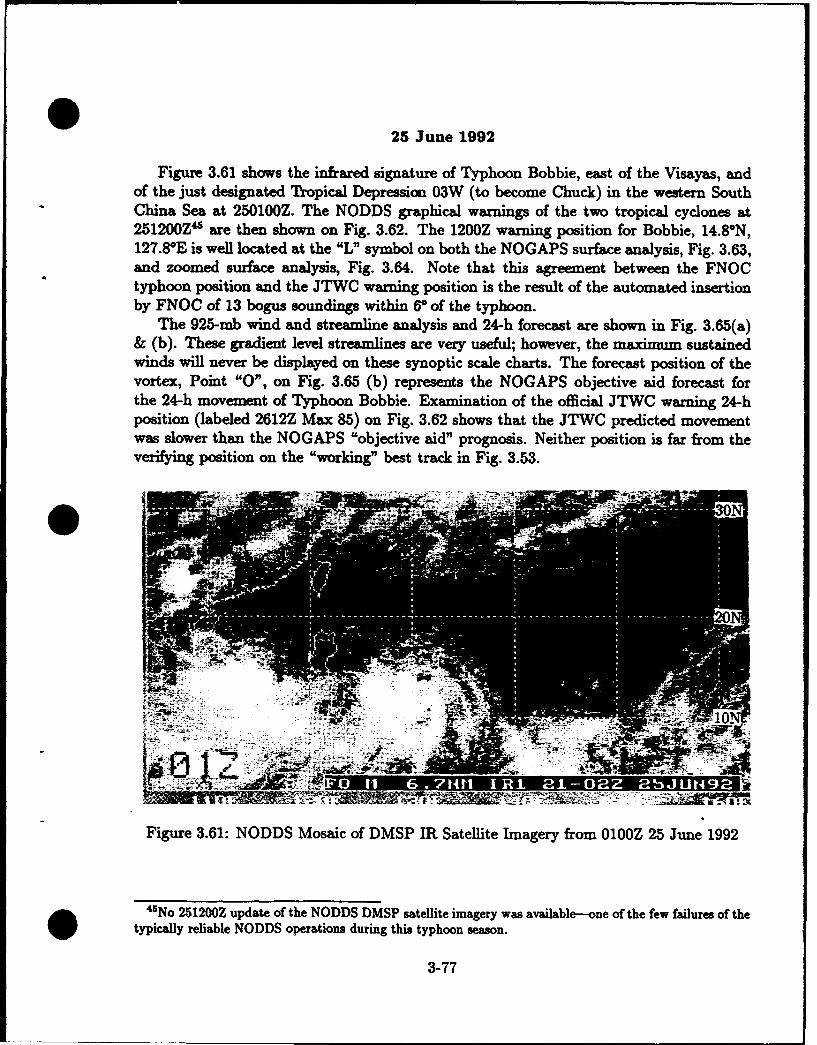
25 June 1992
Figure 3.61 shows the infrared signature of Typhoon Bobbie, east of the Visayas, andof the just designated Tropical Depression 03W (to become Chuck) in the western SouthChina Sea at 250100Z. The NODDS graphical warnings of the two tropical cyclones at251200Z4 ' are then shown on Fig. 3.62. The 1200Z warning position for Bobbie, 14.80N,127.80E is well located at the "L" symbol on both the NOGAPS surface analysis, Fig. 3.63,and zoomed surface analysis, Fig. 3.64. Note that this agreement between the FNOCtyphoon position and the JTWC warning position is the result of the automated insertionby FNOC of 13 bogus soundings within 6° of the typhoon.
The 925-mb wind and streamline analysis and 24-h forecast are shown in Fig. 3.65(a)& (b). These gradient level streamlines are very useful; however, the maximum sustainedwinds will never be displayed on these synoptic scale charts. The forecast position of thevortex, Point "0", on Fig. 3.65 (b) represents the NOGAPS objective aid forecast forthe 24-h movement of Typhoon Bobbie. Examination of the official JTWC warning 24-hposition (labeled 2612Z Max 85) on Fig. 3.62 shows that the JTWC predicted movementwas slower than the NOGAPS "objective aid" prognosis. Neither position is far from theverifying position on the "working" best track in Fig. 3.53.
Figure 3.61: NODDS Mosaic of DMSP IR Satellite Imagery from 0100Z 25 June 1992
"41No 251200Z update of the NODDS DMSP satellite imagery was available-one of the few failures of thetypically reliable NODDS operations during this typhoon season.
3-77
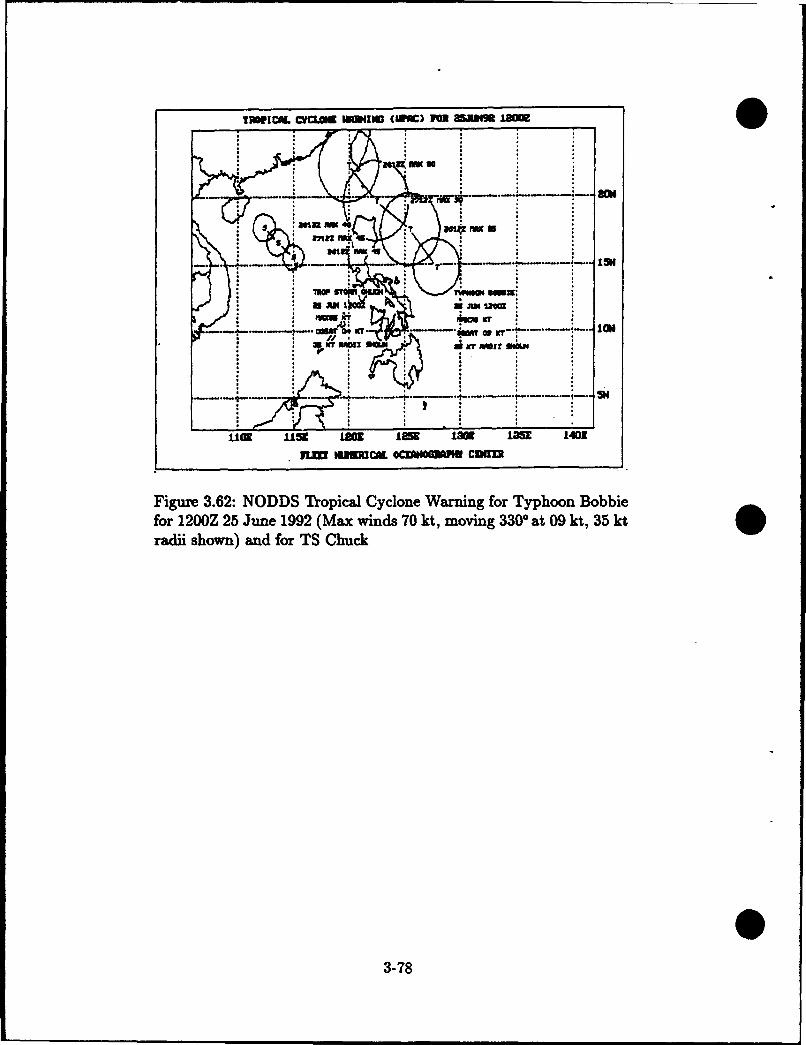
3Iu~IMPIl•L CVC,0W WMf~IN (UMP) F=B 2•J5"M low
S45
34141 litu
-- A ..... --.- - -- .-- t--*-*-, IC
1a ls Lan laaaLn 10
_ _ .. . - -.. -* 4 W.. ... _ ,
lia aS J* 1 I•i) 18Z 1
UI NLNWCAL OCEMOM cra
Figure 3.62: NODDS Tropical Cyclone Warning for Typhoon Bobbiefor 120OZ 25 June 1992 (Max winds 70 kt, moving 330° at 09 kt, 35 kt
radii shown) and for TS Chuck
3-78=
* a ~KT
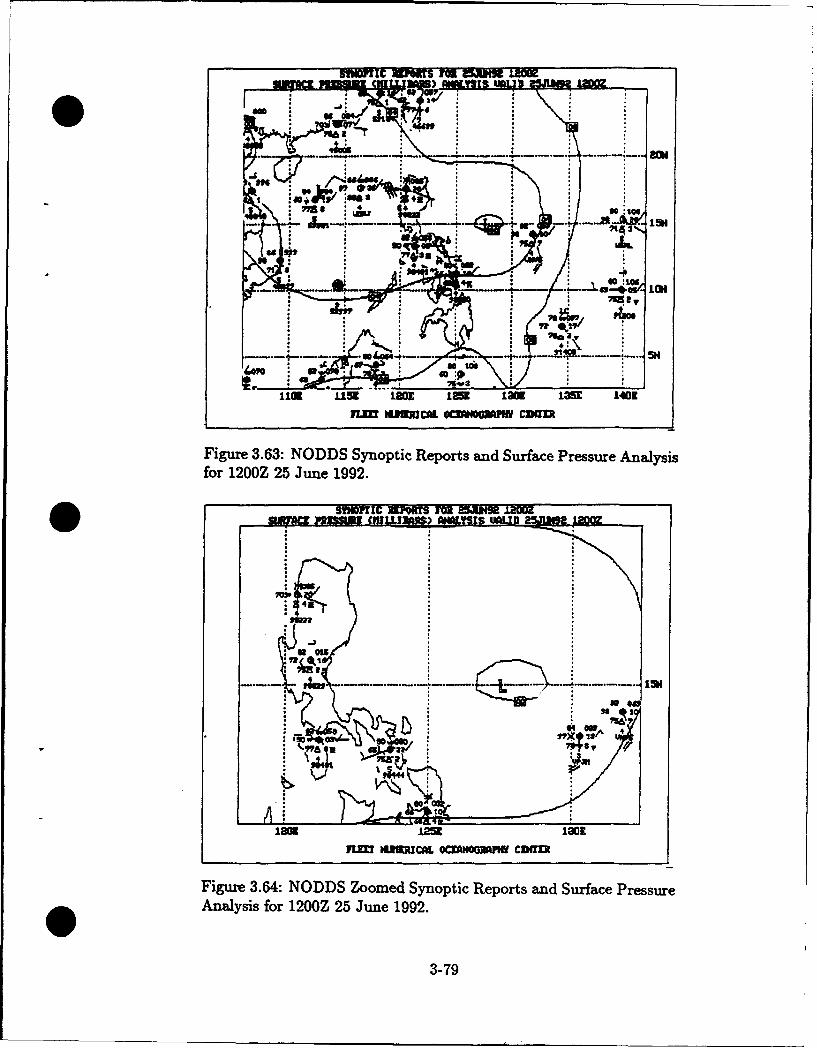
SIMMI[C 7AIU~rs/ M 25uUWA LIM
""17- .- ... • - -- -, _.. ,,,,
-1 , 1i II i I "KLOE 40
Irlln u•RCML C•~ CMl)Rn
Figure 3.63: NODDS Synoptic Reports and Surface Pressure Analysisfor 1200Z 25 June 1992.
2 SSoeiUi
1 U0 N 1259 l IEnL mumIuCaL ocEAnm COG
Figure 3.64: NODDS Zoomed Synoptic Reports and Surface PressureAnalysis for 1200Z 25 June 1992.
3-79
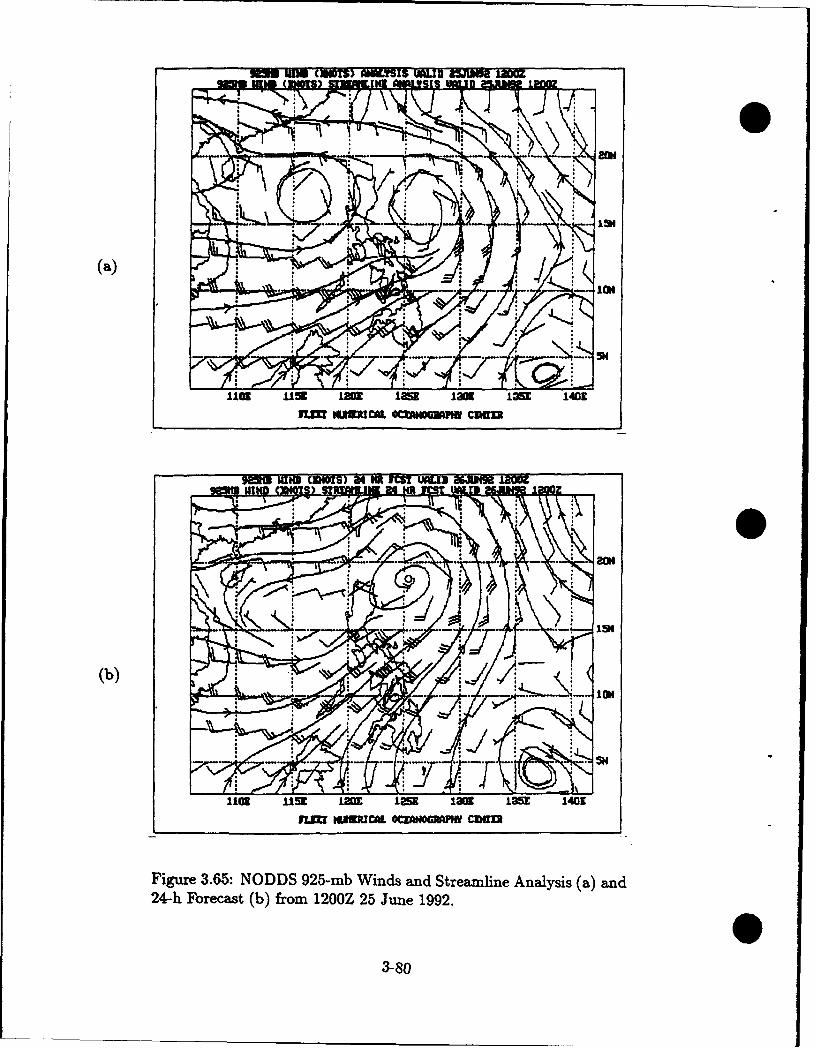
(la EUMS Mf SIS "ALI RMUNN MM
(a)
IlK0 UE5 1am 12M 1= 151 140GE
nw m uumcwt oczmma,, cuan
92MI3 lND awIs) 9 ORI YC5 Mul.1 MMMt amU/9 - ý-1-11, am~~rI
(b)
1102 Li5 120E low 130l 151 1403
lnm IIUMMCOL OCZANOMPtW CroIn
Figure 3.65: NODDS 925-mb Winds and Streamline Analysis (a) and24-h Forecast (b) from 1200Z 25 June 1992.
3-80
26 June 1992
In this abbreviated case study, the last analyses to be examined are on 26 June. Fig-ure 3.66 shows the graphical plots of three tropical cyclones in close proximity to thePhilippines Islands. While TS Chuck is moving northwestward from the South China Seatoward Hainan Island and Tropical Depression 04 is entering the southern Philippine Sea,Typhoon Bobbie• is about 150 nm east of the northeast tip of Luzon, intensifying andmoving northwestward at 10 kt. An three tropical cyclones are easily identifiable on theNODDS DMSP IR satellite imagery in Fig. 3.67, although the IR cold-cloud-top clusterrepresenting Bobbie may be from the 0900Z DMSP swath. That is, the center of the "Bob-bie" duster in Fig. 3.67 appears south of the latitude, 18.2°N, the 1200Z warning positionof Typhoon Bobbie in Fig. 3.66.
The JTWC Prognostic Reasoning Message stated that the track forecast philosophyon Typhoon Bobbie remained unchanged. It was expected that the mid-level ridge, lo-cated near 230 N (not shown), would weaken and allow Bobbie to take a northward track.The JTWC forecast track was a blend of dynamic, statistical and climatological forecastguidance.
Figures 3.68 and 3.69 show the NODDS 261200Z synoptic reports47 and surface pressureanalysis. While the NOGAPS surface analysis in Fig. 3.68 incorrectly labels the center ofBobbie with the computer symbol "L" at 20"N, the NOGAPS 925-mb wind and streamline
* analysis in Fig. 3.70 places the vortex (Bobbie) south of 20°N-more in agreement withthe JTWC warning position in Fig. 3.66.
As discussed in detail in the preceding case study of Typhoon Eli, the NOGAPS 200-mb analysis over a typhoon is normally unsatisfactory to the tropical analyst. Therefore,despite the maximum sustained surface wind (105 kt) in Bobbie at 261200Z, the NOGAPS200-mb winds and streamline analysis in Fig. 3.71 shows no anticyclonic outflow. It doesappear that the FNOC-inserted bogus soundings (to 400 mb) are reflected by cyclonicstreamlines on the 200-mb analysis in Fig. 3.71. It is possible that the anticyclonic outflowoccurs at higher elevations~s, e.g., 100 mb. However, during two years of nearly constantmonitoring of western Pacific typhoons by the author, no anticyclonic flow was observedon a NOGAPS 200-mb analysis above a typhoon. While few 200-mb winds, other thansatellite wind vectors--such as those used by JTWC analysts to draw anticyclonic flow at200 mb-, are received in the near vicinity of typhoons, it is possible that the OptimumInterpolation (01) analysis scheme rejects these satellite wind vectors.
"4'The NODDS "download" of Tropical Warnings in the northwest Pacific Ocean includes the latest warn-ings available. In Fig. 3.66, the TS Chuck and TD 04 warnings are for 1800Z, while the Typhoon Bobbiewarning is for 1200Z.
"4'Note that the Bobbie case study synoptic reports, in contrast to those of the Eli case study, do notinclude wave heights for the surface ships. Bobbie was the first Typhoon to affect the PI during 1992, andwave periods and heights were not included in the NODDS station model menu.
'Flow was found to be cyclonic above Super Typhoon Flo at 200 mb in September 1990. However, theupward flux of cyclonic vorticity is, naturally, expected to extend much higher for super typhoons withsurface winds >130 kt.
3-81
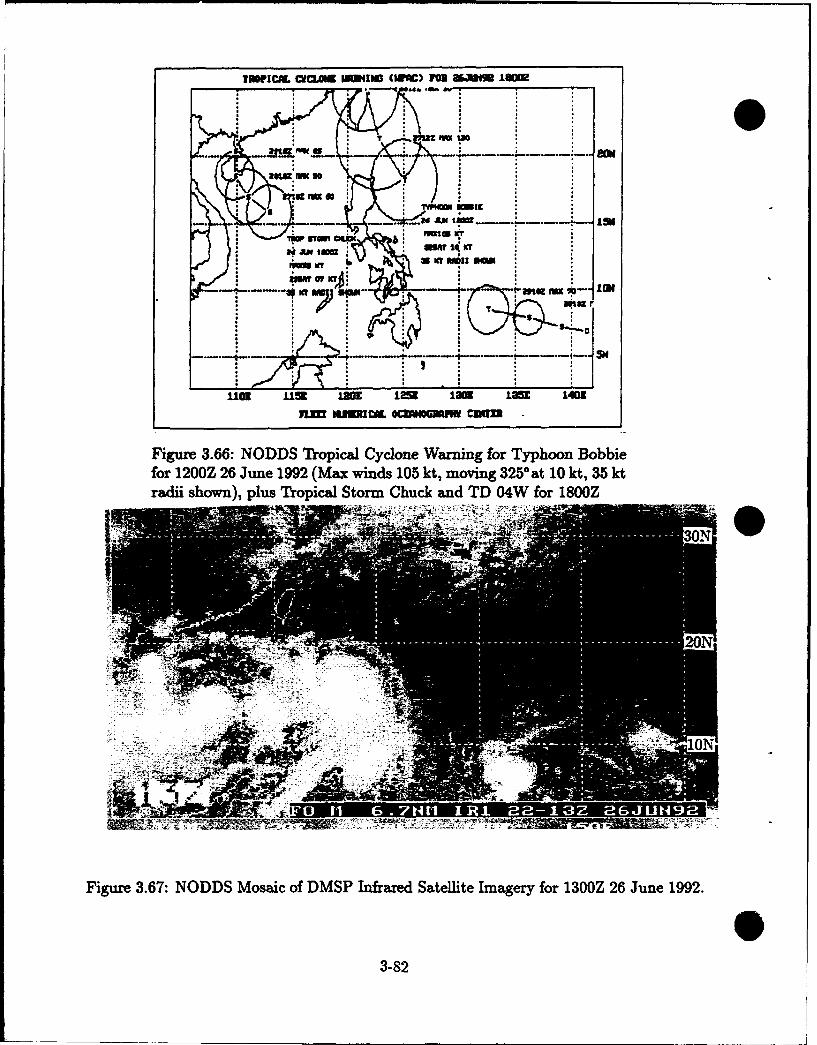
IiSPIC.L cvaOi IWIWG (WQC) 1Iu a•tO•8 Is=
.-....-... ......am
lo fam soe~
113 1 121 15 120 .5 1403
1L IUZ 6~H CUU
itmI=..... ..... . lam;
"M WT •IC •IN~~BCM•
Figure 3.66: NODDS Tropical Cydone Warning for Typhoon Bobbiefor 1200Z 26 June 1992 (Max winds 105 kt, moving 3250 at 10 kt, 35 ktradii shown), plus Tropical Storm Chuck and TD 04W for 1800Z
i"W 00
Figure 3.67: NODDS Mosaic of DMSP Infrared Satellite Imagery for 1300Z 26 June 1992.
3-82
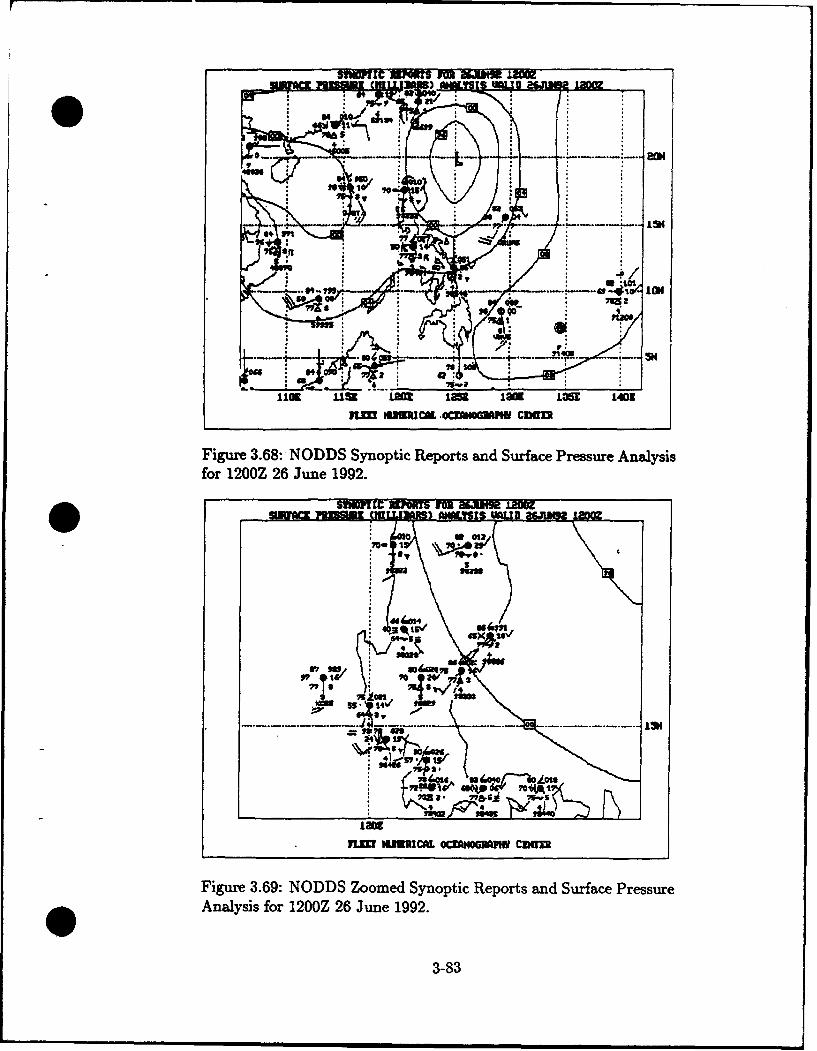
Fr t A" Ss Aly
1101 .11M lia I=S 180 1 2S ,A.IDE10
7n1 ,uMCma. 4OCLIOGnMw CUM1
Figure 3.68: NODDS Synoptic Reports and Surface Pressure Analysisfor 12foZ 26 June 1992.
" 703- 1 8
FLD••Ci. • I~4~
Fiur 36: ODS ome Snotc eprt ndSufaePrssr
O Anlysi for1200 26 une 99'
3 -Sion-Is
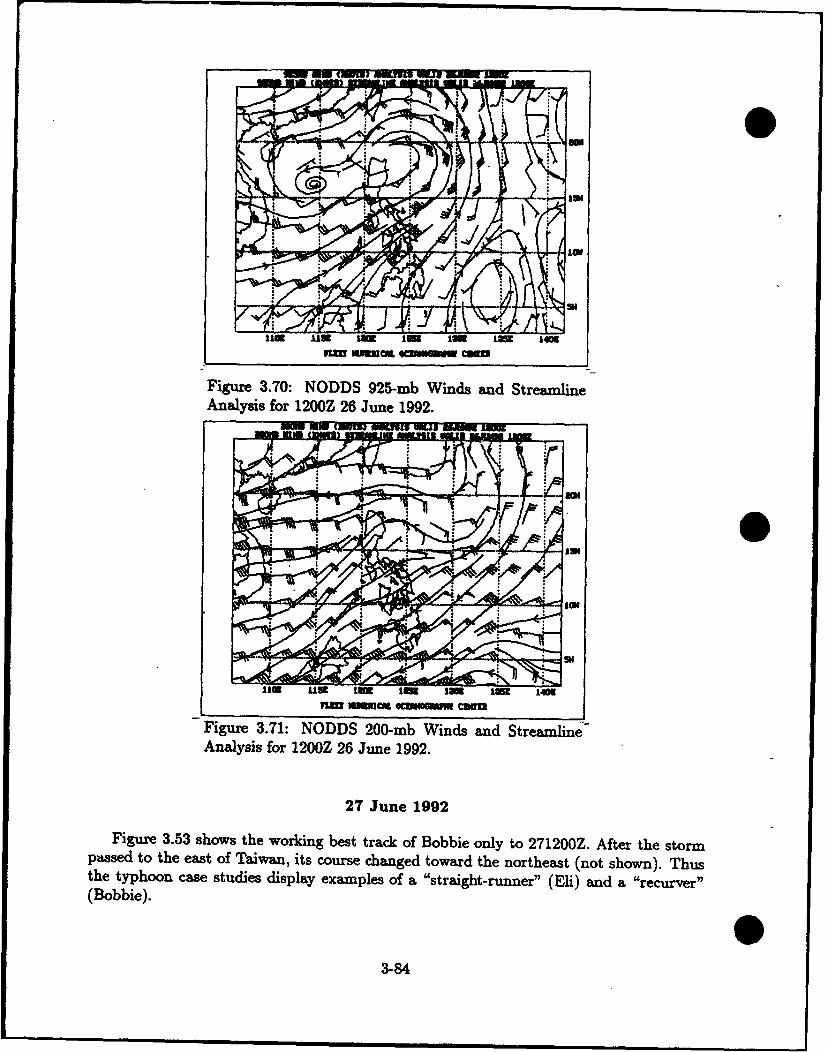
i. 110 n IM I 1151 1403
Figure 3.70: NODDS 925-mb Winds and StreamlineAnalysis for 1200Z 26 June 1992.
Figure 3.71: NODDS 200-mb Winds and Streamlinoe-Analysis for 1200Z 26 June 1992.
27 June 1992
Figure 3.53 shows the working best track of Bobbie only to 271200Z. After the stormpassed to the east of Taiwan, its course changed toward the northeast (not shown). Thusthe typhoon case studies display examples of a "straight-runner" (Eli) and a "recurver"(Bobbie).
33t-84
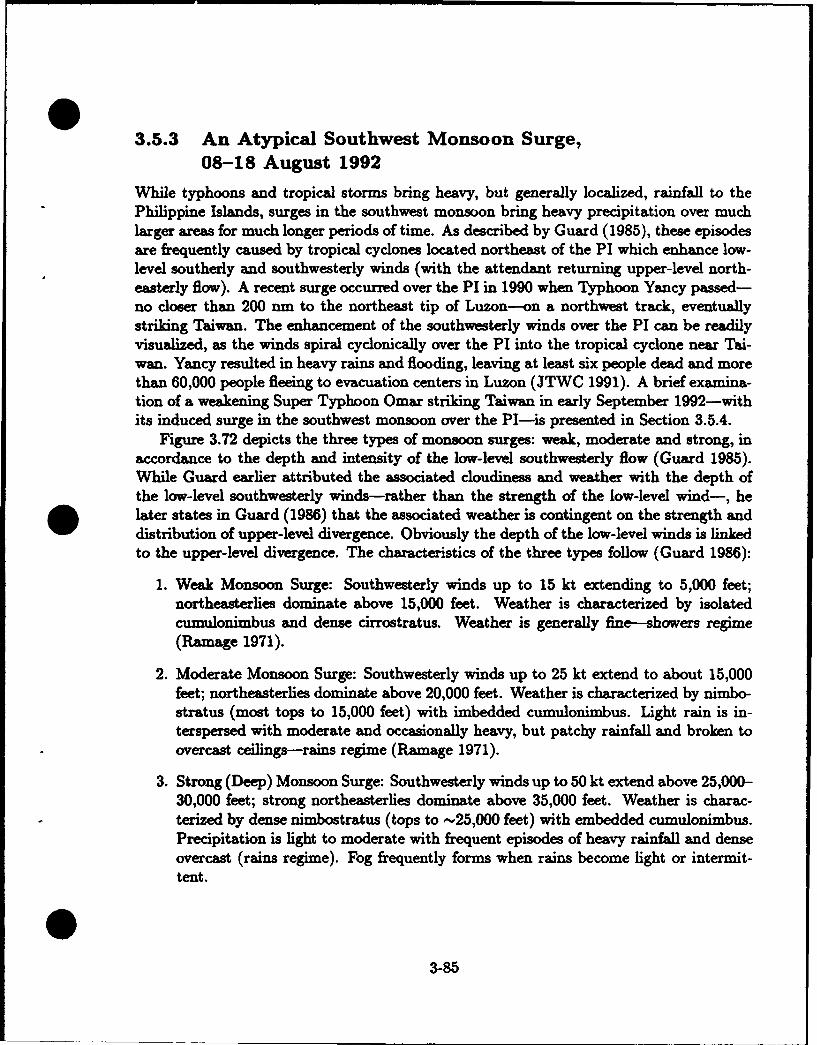
3.5.3 An Atypical Southwest Monsoon Surge,08-18 August 1992
While typhoons and tropical storms bring heavy, but generally localized, rainfall to thePhilippine Islands, surges in the southwest monsoon bring heavy precipitation over muchlarger areas for much longer periods of time. As described by Guard (1985), these episodesare frequently caused by tropical cyclones located northeast of the PI which enhance low-level southerly and southwesterly winds (with the attendant returning upper-level north-easterly flow). A recent surge occurred over the PI in 1990 when Typhoon Yancy passed-no closer than 200 nm to the northeast tip of Luzon--on a northwest track, eventuallystriking Taiwan. The enhancement of the southwesterly winds over the PI can be readilyvisualized, as the winds spiral cyclonically over the PI into the tropical cyclone near Tai-wan. Yancy resulted in heavy rains and flooding, leaving at least six people dead and morethan 60,000 people fleeing to evacuation centers in Luzon (JTWC 1991). A brief examina-tion of a weakening Super Typhoon Omar striking Taiwan in early September 1992-withits induced surge in the southwest monsoon over the PI-is presented in Section 3.5.4.
Figure 3.72 depicts the three types of monsoon surges: weak, moderate and strong, inaccordance to the depth and intensity of the low-level southwesterly flow (Guard 1985).While Guard earlier attributed the associated cloudiness and weather with the depth ofthe low-level southwesterly winds-rather than the strength of the low-level wind-, he
* later states in Guard (1986) that the associated weather is contingent on the strength anddistribution of upper-level divergence. Obviously the depth of the low-level winds is linkedto the upper-level divergence. The characteristics of the three types follow (Guard 1986):
1. Weak Monsoon Surge: Southwesterly winds up to 15 kt extending to 5,000 feet;northeasterlies dominate above 15,000 feet. Weather is characterized by isolatedcumulonimbus and dense cirrostratus. Weather is generally fine-showers regime(Ramage 1971).
2. Moderate Monsoon Surge: Southwesterly winds up to 25 kt extend to about 15,000feet; northeasterlies dominate above 20,000 feet. Weather is characterized by nimbo-stratus (most tops to 15,000 feet) with imbedded cumulonimbus. Light rain is in-terspersed with moderate and occasionally heavy, but patchy rainfall and broken toovercast ceilings-rains regime (Ramage 1971).
3. Strong (Deep) Monsoon Surge: Southwesterly winds up to 50 kt extend above 25,000-30,000 feet; strong northeasterlies dominate above 35,000 feet. Weather is charac-terized by dense nimbostratus (tops to -. 25,000 feet) with embedded cumulonimbus.Precipitation is light to moderate with frequent episodes of heavy rainfall and denseovercast (rains regime). Fog frequently forms when rains become light or intermit-tent.
03-85
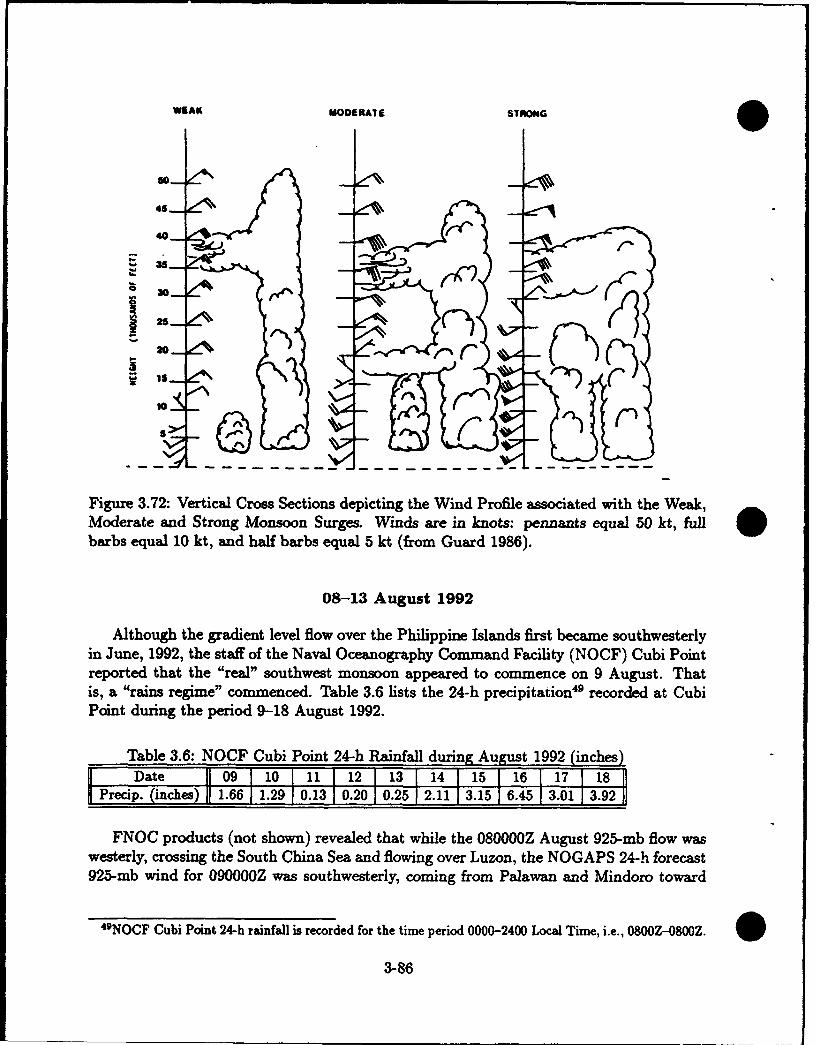
WEAK MODERATE STRONG
50-
40(-
S351
25 % 71
is10n
Figure 3.72: Vertical Cross Sections depicting the Wind Profile associated with the Weak,Moderate and Strong Monsoon Surges. Winds are in knots: pennants equal 50 kt, fullbarbs equal 10 kt, and half barbs equal 5 kt (from Guard 1986).
08-13 August 1992
Although the gradient level flow over the Philippine Islands first became southwesterlyin June, 1992, the staff of the Naval Oceanography Command Facility (NOCF) Cubi Pointreported that the "real" southwest monsoon appeared to commence on 9 August. Thatis, a "rains regime" commenced. Table 3.6 lists the 24-h precipitation49 recorded at CubiPoint during the period 9-18 August 1992.
Table 3.6: NOCF Cubi Point 24-h Rainfall during August 1992 (inches)II Date II 09 I I 11 I 12 I 13 I 14 I 15 I 16 I 17 I18 II
Precip. (inches)1 1.66 1.29 0.13 0.20 0.25 2.11 3.15 6.45 3.01 3.92
FNOC products (not shown) revealed that while the 080000Z August 925-mb flow waswesterly, crossing the South China Sea and flowing over Luzon, the NOGAPS 24-h forecast925-mb wind for 090000Z was southwesterly, coming from Palawan and Mindoro toward
49NOCF Cubi Point 24-h rainfall is recorded for the time period 0000-2400 Local Time, i.e., 0800Z-0800Z.
3-86
Manila. The NOGAPS 24-h southwesterly wind direction verified,' and thus correlateswell with the statement of the NOCF staff that their southwest monsoon actually beganon 9 August.
14 August 1992
Examination of the wind at the grid point nearest to Cubi Point (NOGAPS grid point(15°N, 120°E)) reveals the following:
1. From a 700-mb wind analysis of 225°/15 kt at the grid point at 140000Z, NOGAPSmade an excellent increasing wind forecast of 225°/20 kt for 150000Z. The verifyingwind, at 150000Z was 225/25 kt-the first 700 mb wind above 20 kt, at the grid point,during the case study. (Note that the rainfall increased significantly to 2.11 incheson the 14th (see Table 3.6)).
2. The 700-mb (,,-10,000-foot) wind remained at 25-30 kt magnitude at the grid pointfor the remainder of the case study-however, it was noted that the 24-h prognosisof the 700-mb wind, at the grid point (not shown), was normally the same strengthas that of the starting analysis. Nevertheless, this southwest wind with a magnitudeof >20 kt near 10,000 feet, meets the requirements for the southwesterly 10,000 footwind for the moderate surge in Fig. 3.72.
3. The 925-mb wind (again, not shown) at the grid point increased from 1800/5 kt(at 130000Z) to 225°/15 kt (at 140000Z or 140800 Local). This near-surface windmagnitude also meets the requirements for the moderate surge in Fig. 3.72. The 925-mb wind further increased, at the grid point, to 25-30 kt for the remainder of the casestudy, 15-18 August, as 3-6 inches of rain fell, each day (see Table 3.6). (While thisincreased near-surface wind magnitude meets the requirement for a strong surge, the700-mb (-10,000-foot) wind magnitude was never over 30 kt (below the 40-50 ktrequired), and the 200-mb (35,000-40,000-foot) wind magnitudes ranged between10-25 kt, (far below the 40-60 kt required for a strong surge.)
4. While the 200-mb wind record was incomplete, it was found to be easterly, 10 kton 16 August, 25 kt on 17 August, and then finally decreasing to 20 kt at 180000Zand 10 kt at 181200Z. This magnitude for the 200 mb (35,000 to 40,000-foot) windis marginally acceptable for even a weak surge, and it is not from the northeast asspecified in Fig. 3.72.
"S°While NOGAPS tropical analysis has made substantial improvements in the recent past, the author-pleased when even the numerical tropical analysis is satisfactory and still a skeptic of tropical numericalprognosis-chose to examine wind prognoses only to 24-hours. Also, the analyst is often suspicious evenwhen a 24-h prognosis verifies, since the 01 analysis may have very few observations to change the the firstguess ("background") or the 01 analysis may reject wind observations that differ substantially from thefirst-guess.
3-87
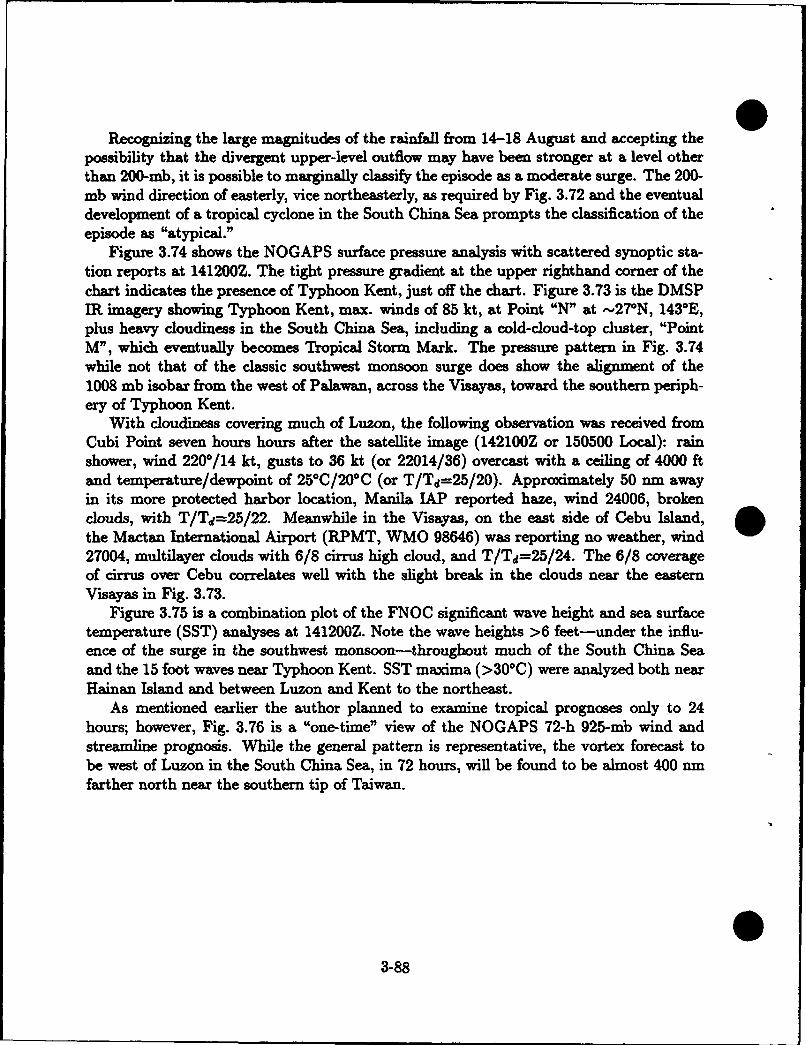
Recognizing the large magnitudes of the rainfall from 14-18 August and accepting thepossibility that the divergent upper-level outflow may have been stronger at a level otherthan 200-mb, it is possible to marginally classify the episode as a moderate surge. The 200-mb wind direction of easterly, vice northeasterly, as required by Fig. 3.72 and the eventualdevelopment of a tropical cyclone in the South China Sea prompts the classification of theepisode as "atypical."
Figure 3.74 shows the NOGAPS surface pressure analysis with scattered synoptic sta-tion reports at 141200Z. The tight pressure gradient at the upper righthand comer of thechart indicates the presence of Typhoon Kent, just off the chart. Figure 3.73 is the DMSPIR imagery showing Typhoon Kent, max. winds of 85 kt, at Point "N" at -27*N, 143°E,plus heavy cloudiness in the South China Sea, including a cold-cloud-top cluster, "PointM", which eventually becomes Tropical Storm Mark. The pressure pattern in Fig. 3.74while not that of the classic southwest monsoon surge does show the alignment of the1008 mb isobar from the west of Palawan, across the Visayas, toward the southern periph-ery of Typhoon Kent.
With cloudiness covering much of Luzon, the following observation was received fromCubi Point seven hours hours after the satellite image (142100Z or 150500 Local): rainshower, wind 2200/14 kt, gusts to 36 kt (or 22014/36) overcast with a ceiling of 4000 ftand temperature/dewpoint of 250C/200C (or T/Td=25/20). Approximately 50 nm awayin its more protected harbor location, Manila IAP reported haze, wind 24006, brokenclouds, with T/Td=25/22. Meanwhile in the Visayas, on the east side of Cebu Island,the Mactan International Airport (RPMT, WMO 98646) was reporting no weather, wind27004, multilayer clouds with 6/8 cirrus high cloud, and T/Td=25/24. The 6/8 coverageof cirrus over Cebu correlates well with the slight break in the clouds near the easternVisayas in Fig. 3.73.
Figure 3.75 is a combination plot of the FNOC significant wave height and sea surfacetemperature (SST) analyses at 141200Z. Note the wave heights >6 feet-under the influ-ence of the surge in the southwest monsoon-throughout much of the South China Seaand the 15 foot waves near Typhoon Kent. SST maxima (>30°C) were analyzed both nearHainan Island and between Luzon and Kent to the northeast.
As mentioned earlier the author planned to examine tropical prognoses only to 24hours; however, Fig. 3.76 is a "one-time" view of the NOGAPS 72-h 925-mb wind andstreamline prognosis. While the general pattern is representative, the vortex forecast tobe west of Luzon in the South China Sea, in 72 hours, will be found to be almost 400 nmfarther north near the southern tip of Taiwan.
03-88
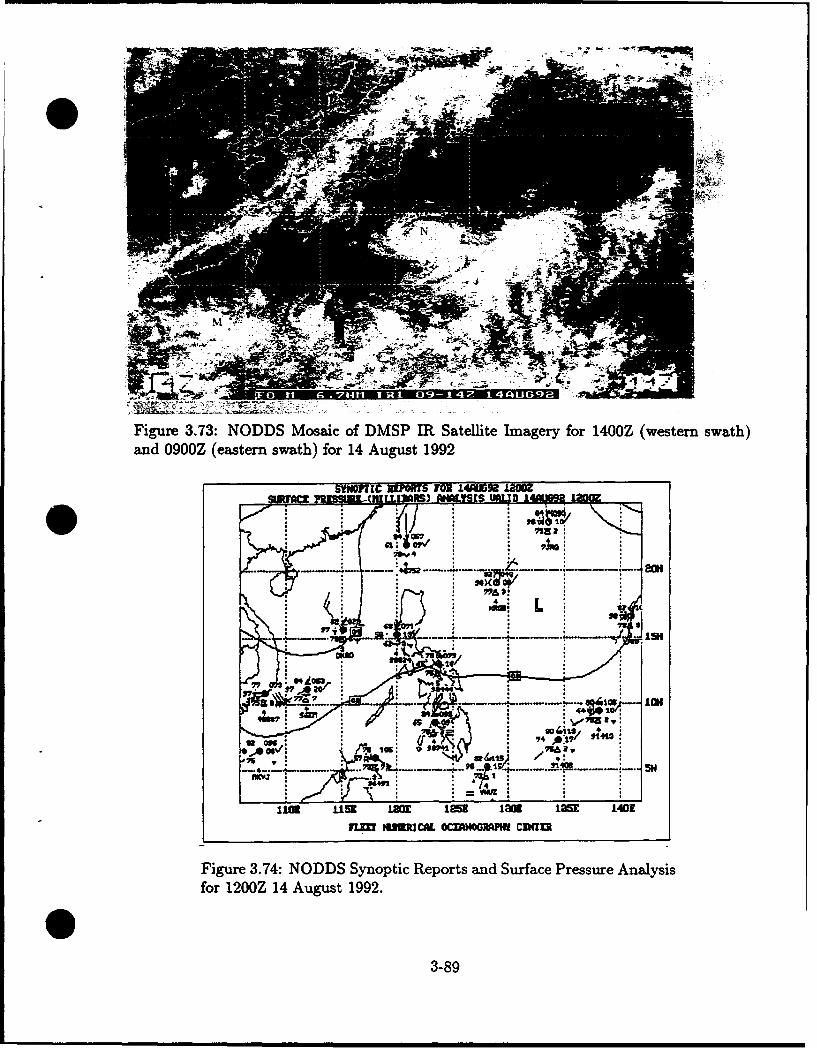
Nh
Figure 3.73: NODDS Mosaic of DMSP IR Satellite Imagery for 1400Z (western swath)and 0900Z (eastern swath) for 14 August 1992
S!~nOPC ]MnT M11 14M~92 12-M
------ .... ....... .
11. 1153-.. 192 1i ia•/ : : 140
Figure 3.74: NODDS Synoptic Reports and Surface Pressure Analysisfor 1200Z 14 August 1992.
03-89
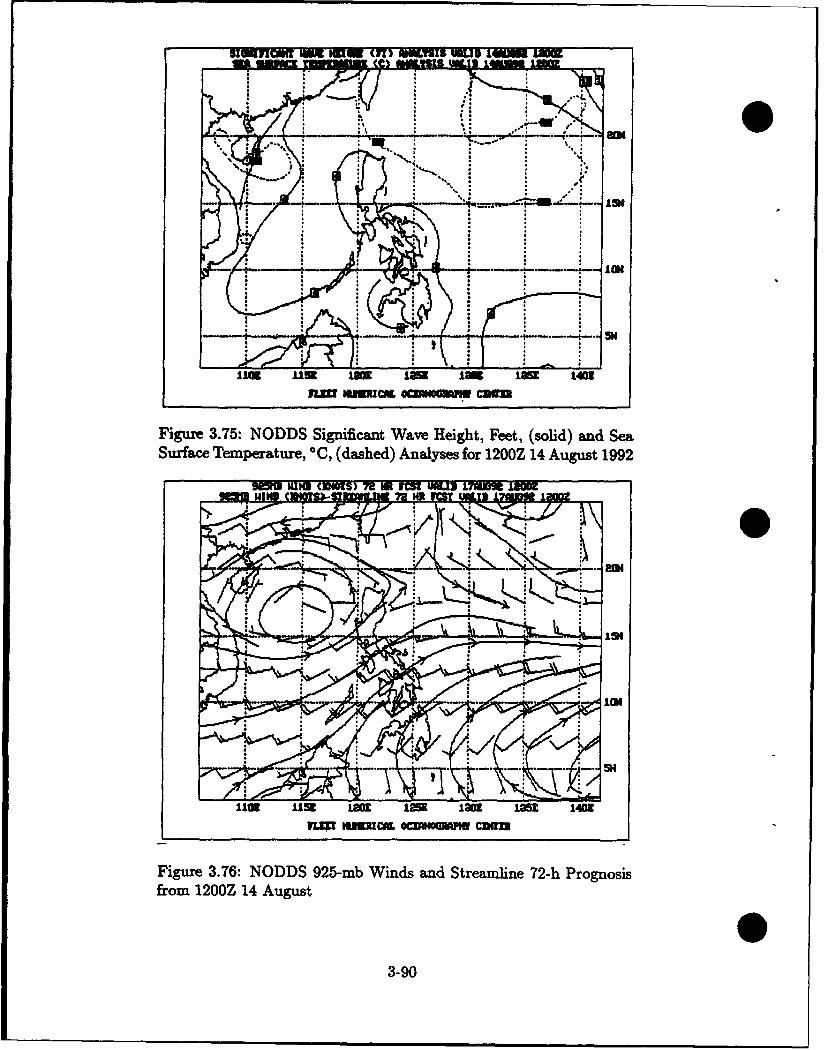
51nWIIII WA MUll (71) MllENIS UAW.D IM IM•
* •
1113 Lin I I Il I 1403
Figure 3.75: NODDS Significant Wave Height, Feet, (solid) and SeaSurface Temperature,* C, (dashed) Analyses for 1200Z 14 August 1992
92" IWN CDWTS) 72 IM Nd? VM I BM3171W 3
from 100 14 L= law lw I 140A
7IM! NU • OANO3-90MM"M •
Figure 3.76: NODDS Sign indscan d Wae Segtr ea tmsline 72hPonosisfrm't• 120O t'e C dh)Aayesfr10Z 14 August 19
SW•¢]•S 7 Ht 'CT A3-90I•J
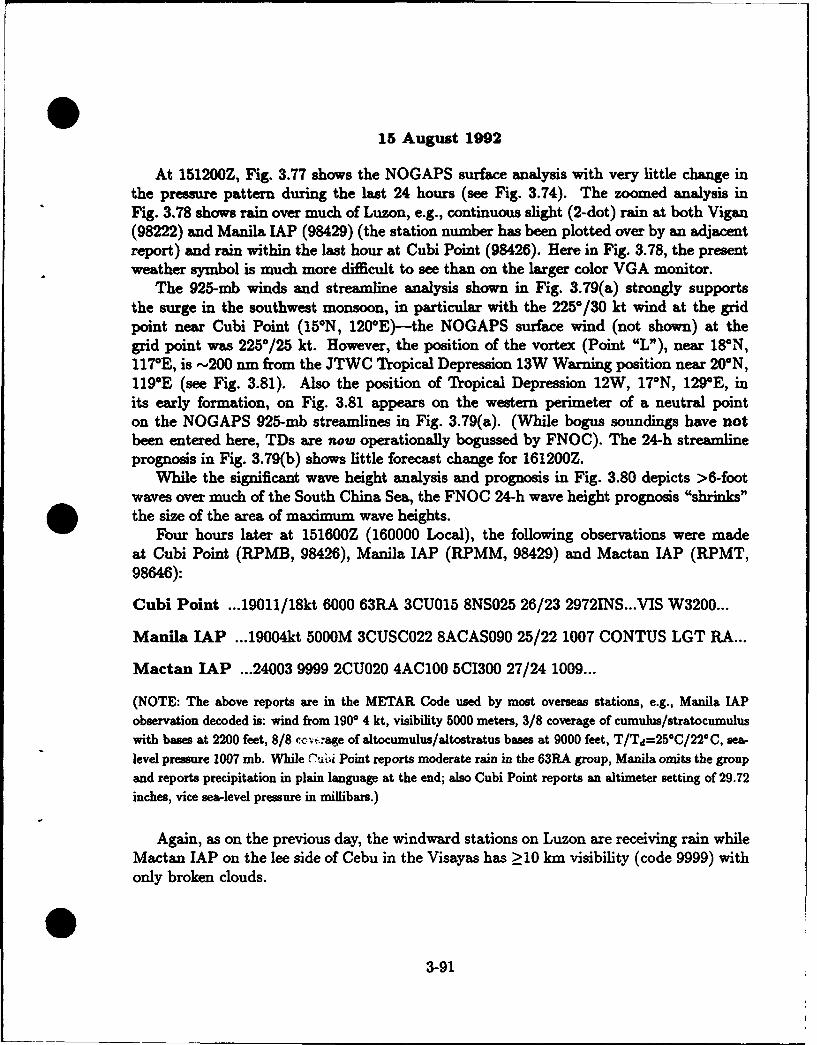
015 August 1992
At 151200Z, Fig. 3.77 shows the NOGAPS surface analysis with very little change inthe pressure pattern during the last 24 hours (see Fig. 3.74). The zoomed analysis inFig. 3.78 shows rain over much of Luzon, e.g., continuous slight (2-dot) rain at both Vigan(98222) and Manila UAP (98429) (the station number has been plotted over by an adjacentreport) and rain within the last hour at Cubi Point (98426). Here in Fig. 3.78, the presentweather symbol is much more difficult to see than on the larger color VGA monitor.
The 925-mb winds and streamline analysis shown in Fig. 3.79(a) strongly supportsthe surge in the southwest monsoon, in particular with the 225°/30 kt wind at the gridpoint near Cubi Point (150 N, 120°E)-the NOGAPS surface wind (not shown) at thegrid point was 2250/25 kt. However, the position of the vortex (Point "L"), near 18°N,117*E, is -.200 nm from the JTWC Tropical Depression 13W Warning position near 20°N,119"E (see Fig. 3.81). Also the position of Tropical Depression 12W, 17°N, 129*E, inits early formation, on Fig. 3.81 appears on the western perimeter of a neutral pointon the NOGAPS 925-mb streamlines in Fig. 3.79(a). (While bogus soundings have notbeen entered here, TDs are now operationally bogussed by FNOC). The 24-h streamlineprognosis in Fig. 3.79(b) shows little forecast change for 161200Z.
While the significant wave height analysis and prognosis in Fig. 3.80 depicts >6-footwaves over much of the South China Sea, the FNOC 24-h wave height prognosis "shrinks"the size of the area of maximum wave heights.
Four hours later at 151600Z (160000 Local), the following observations were madeat Cubi Point (RPMB, 98426), Manila lAP (RPMM, 98429) and Mactan lAP (RPMT,98646):
Cubi Point ...19011/18kt 6000 63RA 3CU015 8NS025 26/23 29721NS...VIS W3200...
Manila LAP ...19004kt 5000M 3CUSC022 8ACAS090 25/22 1007 CONTUS LGT RA...
Mactan LUP ...24003 9999 2CU020 4AC100 5C1300 27/24 1009...
(NOTE: The above reports are in the METAR Code used by most overseas stations, e.g., Manila UAP
observation decoded is: wind from 190° 4 kt, visibility 5000 meters, 3/8 coverage of cumulus/stratocumuluswith bases at 2200 feet, 8/8 nc.,c-age of altocumulus/altostratus bases at 9000 feet, T/Td=25°C/22°C, sea-
level pressure 1007 mb. While Cu--i Point reports moderate rain in the 63RA group, Manila omits the groupand reports precipitation in plain language at the end; also Cubi Point reports an altimeter setting of 29.72
inches, vice sea-level pressure in millibars.)
Again, as on the previous day, the windward stations on Luzon are receiving rain whileMactan lAP on the lee side of Cebu in the Visayas has >10 km visibility (code 9999) withonly broken clouds.
33-91
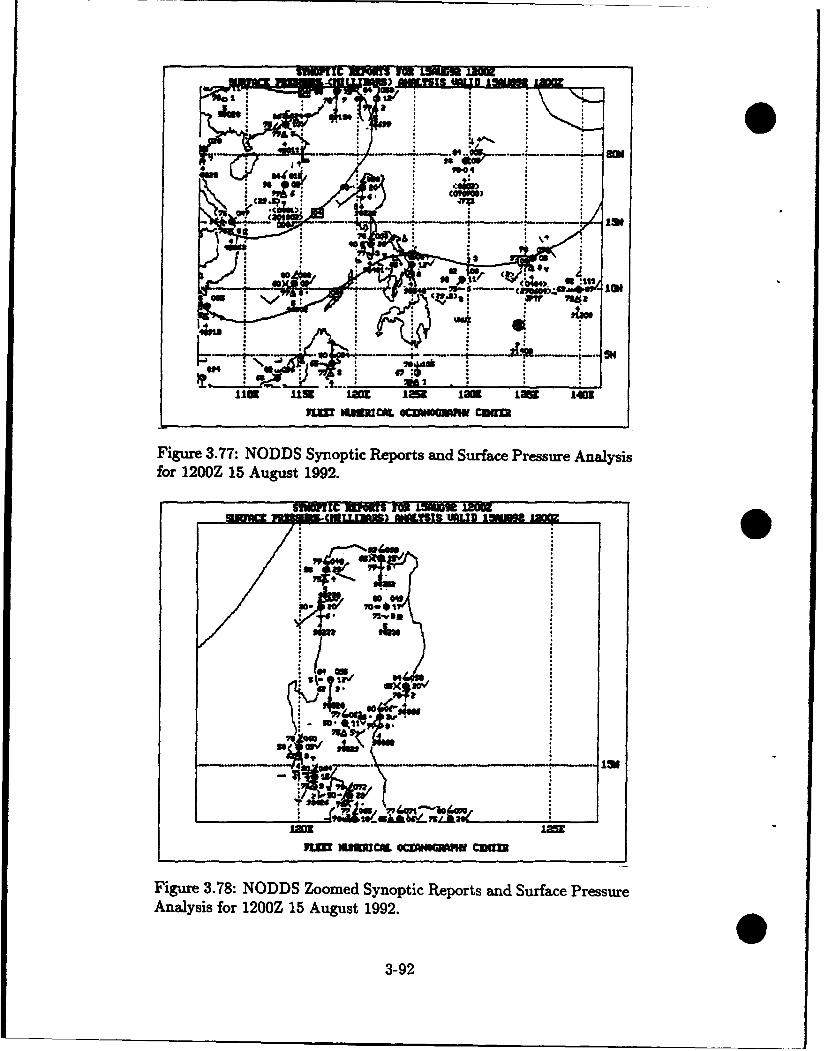
UNWC WW M UýIB
-.Ai
o Auut 19 92 .. --- -- -I.
suuuc BT VO "1IRE .10 Its LUU m15 1m Lam 1401
Figure 3.77: NODDS Synoptic Reports and Surface Pressure Analysisfor 1200Z 15 August 1992.
LIAM
un= wumwur ocznwaaw cuam
Figure 3.78: NODDS Zoomed Synoptic Reports and Surface PressureAnalysis for 1200Z 15 August 1992.
3-92
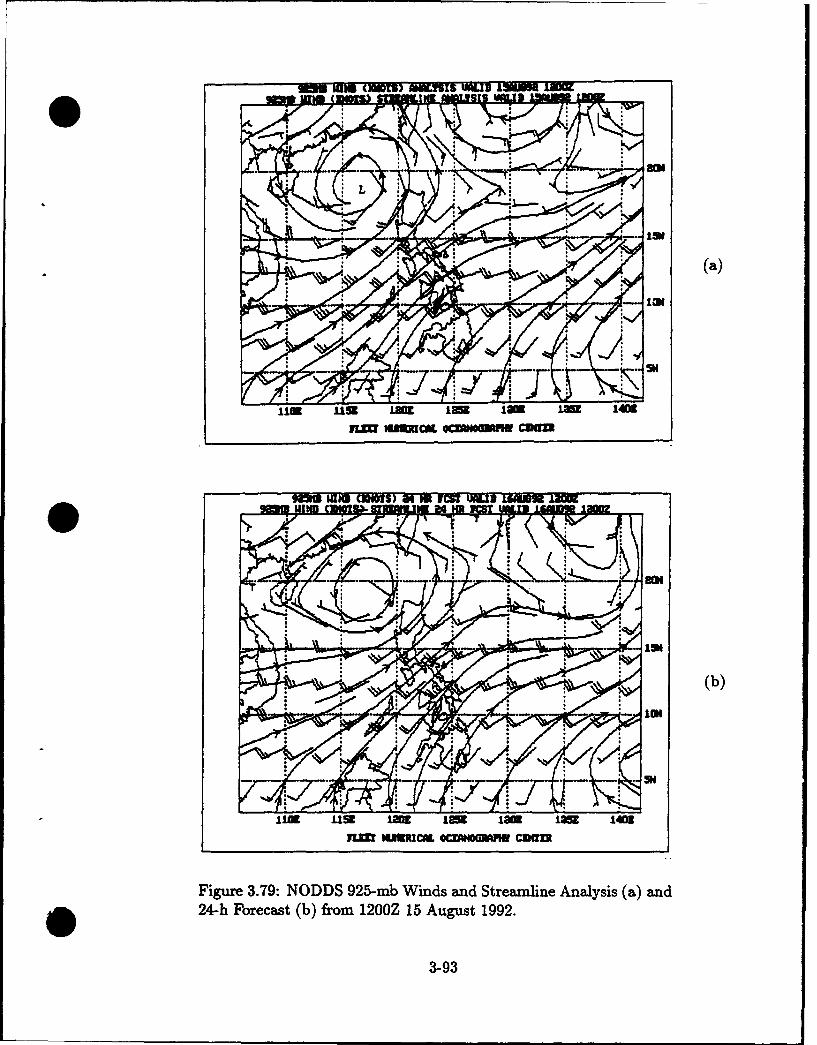
law (MorsT) AU.MYS UA NI•M 1MM0
(a)
1183~-- --- lam 98 U!
1113 USK LM! I= low LOU 140.
nL inumwc owm*amw comr
Figue 39:NODS 925-CNS aMb Wind a40d Sraline Anlssan
olow
11m Litm Lam 1259 I0 LM 14011
n= wImA ocm om c
Figure 3.79: NODDS 925-mb Winds and Streamline Analysis (a) and
24-h Forecast (b) from 1200Z 15 August 1992.
3-93
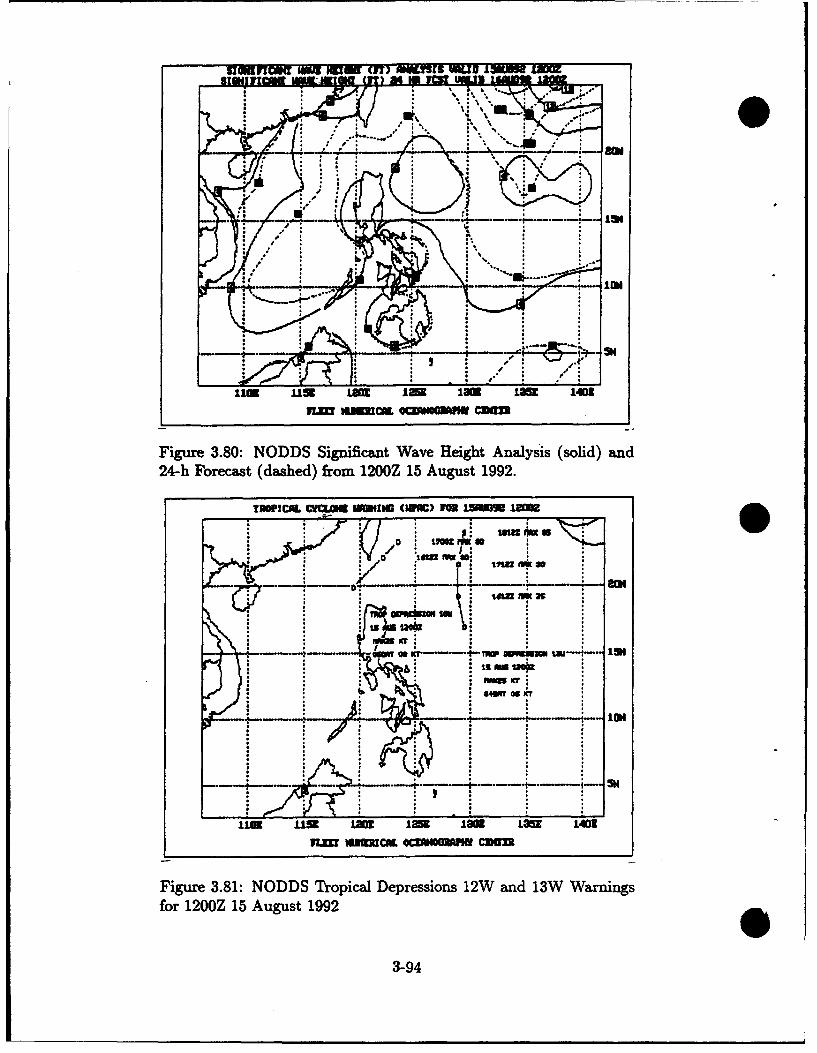
SOiwnFeI ME H•[um anr METi[MS VUD•J l1ili ME~9iuu117 r1511 WUI W Ian=TI ~LD£~h 1
* ij-z.
- -,l.**.t I* ** .**j3
,
u-* ....us i1,11U 11r • • laQ• •411b
Figure 3.80: NODDS Significant Wave Height Analysis (solid) and2--h Forecast (dashed) from 1200Z 15 August 1992.nwccmm mmxucm, mmoo•mwm cmn
Fiue 3.0 NOD SinfiatWaeHigh nayil(oid n
TNAPICU. W~fCS. WO403 (1WW) FOR 15U1 IBMU
-Y Slzi In : so
NAM-. . .w,a IS mula
"ra Krny
: ~ ~ ~ ~ " a"" it ! ' -
ME 15u9 tLam 1M i. law 1401m
7lEIm IlIUM CiL OCIUOU CIUfI
Figure 3.81: NODDS Tropical Depressions 12W and 13W Warningsfor 1200Z 15 August 1992
3-94
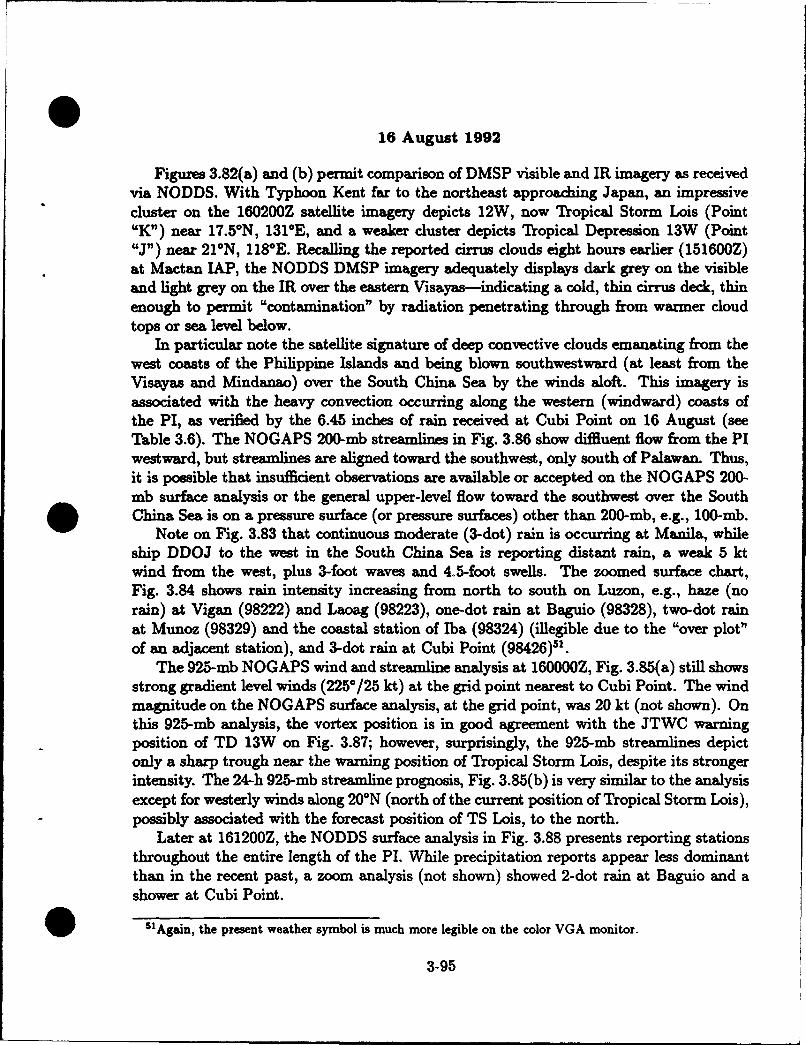
16 August 1992
Figures 3.82(a) and (b) permit comparison of DMSP visible and IR imagery as receivedvia NODDS. With Typhoon Kent far to the northeast approaching Japan, an impressivecluster on the 160200Z satellite imagery depicts 12W, now Tropical Storm Lois (Point"K") near 17.5*N, 131*E, and a weaker cluster depicts Tropical Depression 13W (Point"J") near 21°N, 118°E. Recalling the reported cirrus clouds eight hours earlier (151600Z)at Mactan IAP, the NODDS DMSP imagery adequately displays dark grey on the visibleand light grey on the IR over the eastern Visayas-indicating a cold, thin cirrus deck, thinenough to permit "contamination" by radiation penetrating through from warmer cloudtops or sea level below.
In particular note the satellite signature of deep convective clouds emanating from thewest coasts of the Philippine Islands and being blown southwestward (at least from theVisayas and Mindanao) over the South China Sea by the winds aloft. This imagery isassociated with the heavy convection occurring along the western (windward) coasts ofthe PI, as verified by the 6.45 inches of rain received at Cubi Point on 16 August (seeTable 3.6). The NOGAPS 200-mb streamlines in Fig. 3.86 show diffluent flow from the PIwestward, but streamlines are aligned toward the southwest, only south of Palawan. Thus,it is possible that insufficient observations are available or accepted on the NOGAPS 200-mb surface analysis or the general upper-level flow toward the southwest over the South
*China Sea is on a pressure surface (or pressure surfaces) other than 200-mb, e.g., 100-mb.Note on Fig. 3.83 that continuous moderate (3-dot) rain is occurring at Manila, while
ship DDOJ to the west in the South China Sea is reporting distant rain, a weak 5 ktwind from the west, plus 3-foot waves and 4.5-foot swells. The zoomed surface chart,Fig. 3.84 shows rain intensity increasing from north to south on Luzon, e.g., haze (norain) at Vigan (98222) and Laoag (98223), one-dot rain at Baguio (98328), two-dot rainat Munoz (98329) and the coastal station of Iba (98324) (illegible due to the "over plot"of an adjacent station), and 3-dot rain at Cubi Point (98426)51.
The 925-mb NOGAPS wind and streamline analysis at 160000Z, Fig. 3.85(a) still showsstrong gradient level winds (225°/25 kt) at the grid point nearest to Cubi Point. The windmagnitude on the NOGAPS surface analysis, at the grid point, was 20 kt (not shown). Onthis 925-mb analysis, the vortex position is in good agreement with the JTWC warningposition of TD 13W on Fig. 3.87; however, surprisingly, the 925-mb streamlines depictonly a sharp trough near the warning position of Tropical Storm Lois, despite its strongerintensity. The 24-h 925-mb streamline prognosis, Fig. 3.85(b) is very similar to the analysisexcept for westerly winds along 20°N (north of the current position of Tropical Storm Lois),possibly associated with the forecast position of TS Lois, to the north.
Later at 161200Z, the NODDS surface analysis in Fig. 3.88 presents reporting stationsthroughout the entire length of the P1. While precipitation reports appear less dominantthan in the recent past, a zoom analysis (not shown) showed 2-dot rain at Baguio and ashower at Cubi Point.
""SAgain, the present weather symbol is much more legible on the color VGA monitor.
3-95
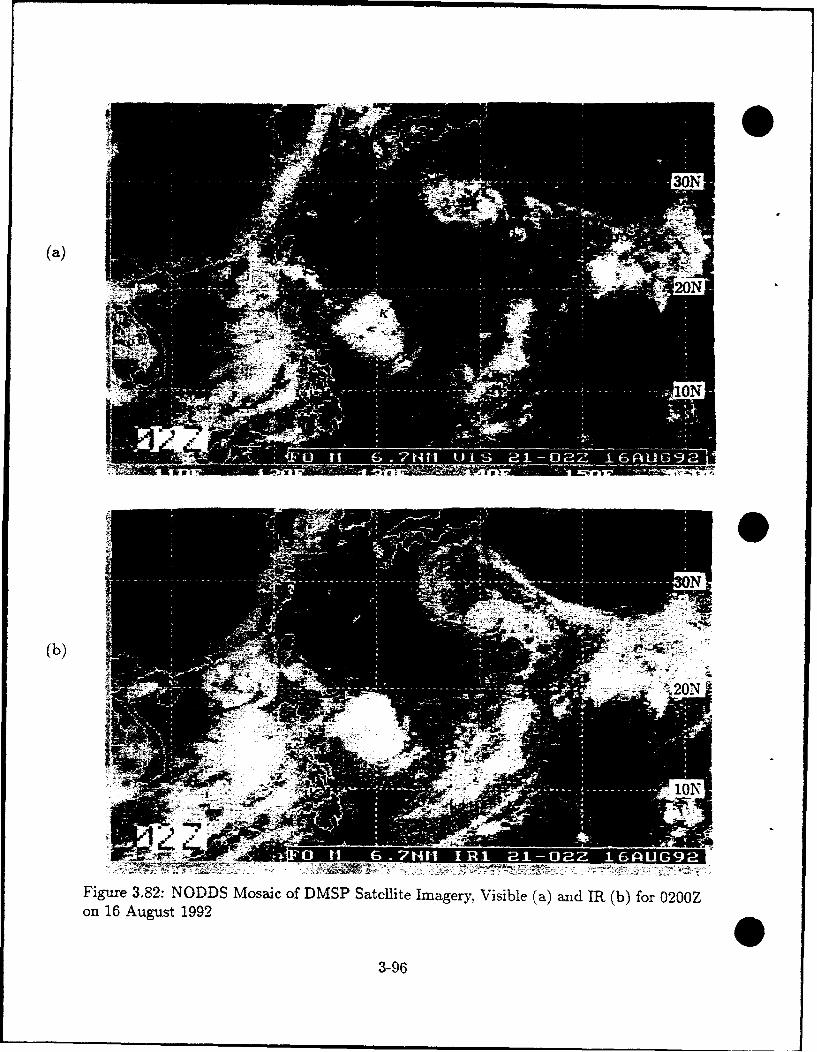
(a)
(b) OO
_ _ i
Figure 3.82: NODDS Mosaic of DMSP Satellite Imagery, Visible (a) and IR (b) for 020OZon 16 August 1992
3-96
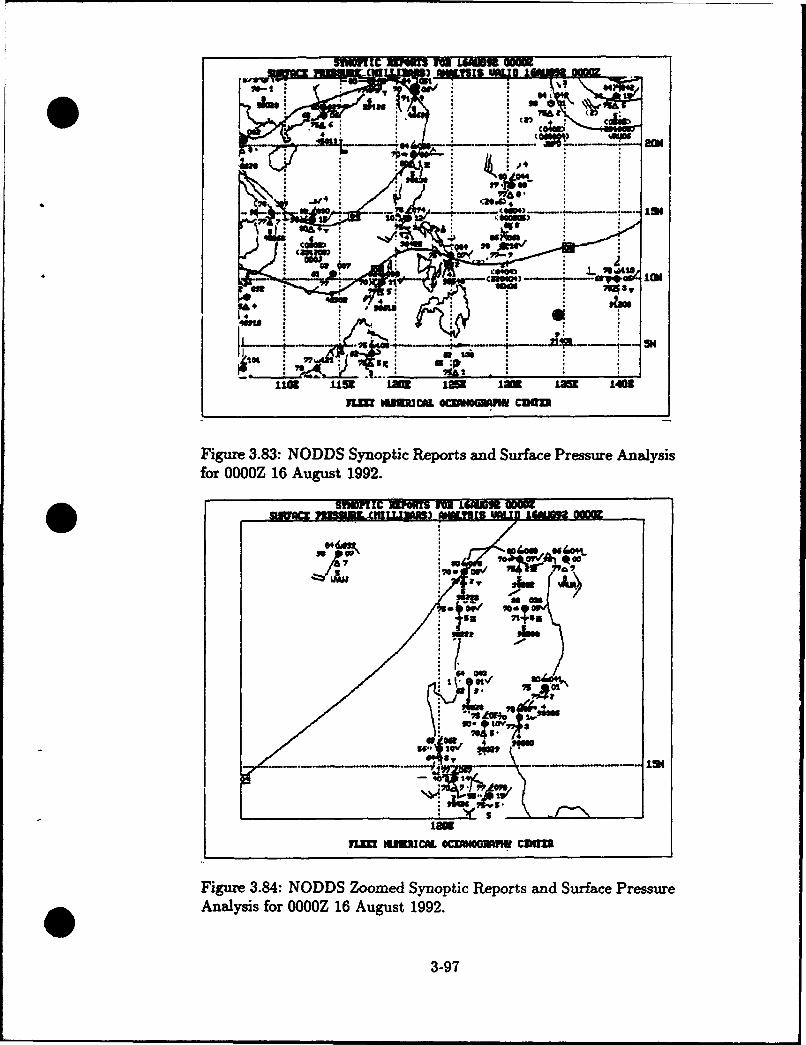
O ° p lt.
IMI -
Figure 3.83: NODDS Synoptic Reports and Sur-face Pressure Analysisfor 0000Z 16 August 1992.
O m~, zc m•n' 7,m z 4, iq,
~(WJiv
~~lowi7a4iV
lLInI 3U3R3CL OMMOMHW Own
Figure 3.84: NODDS Zoomed Synoptic Reports and Surface PressureAnalysis for 0000Z 16 August 1992.
3-97
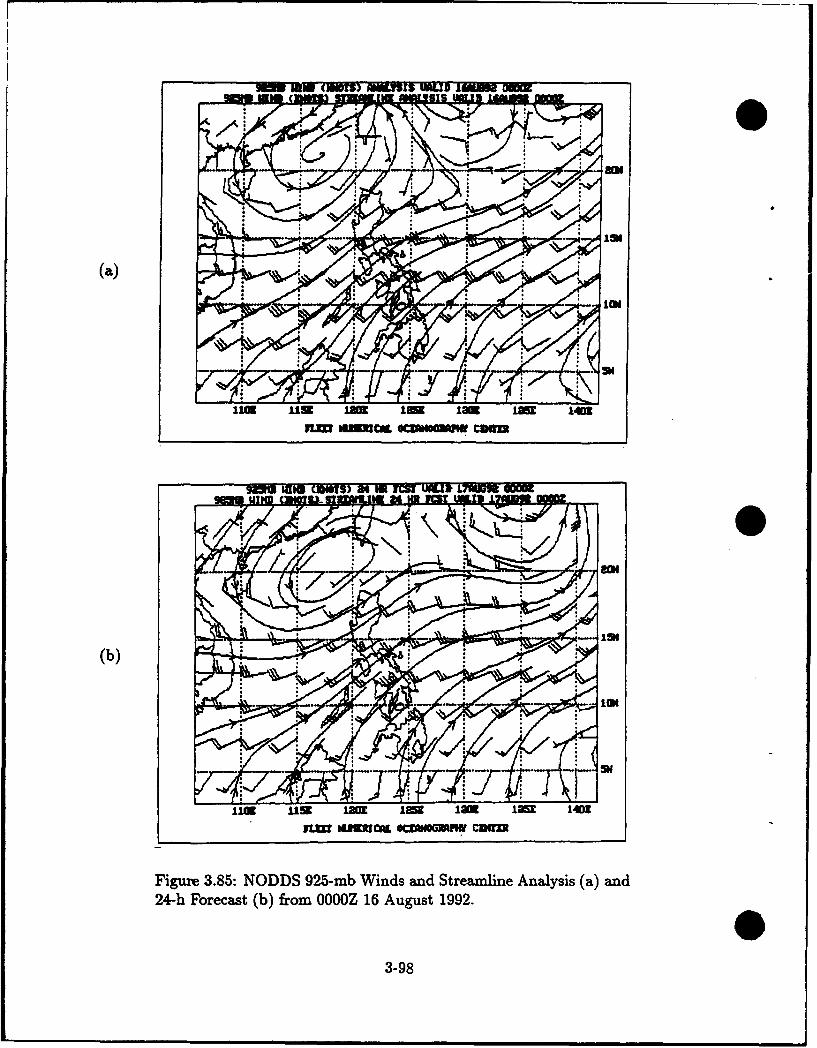
EIM (MIMTS) MIan= U.LD 160M UOZ
(a)
SiLai
n=W IhIwca ounwmw cumu
9a MN1 CUST) alt M ,CS UMI, L7U bu S
(b)
lis us •iia ,sx
Ila US1E La 1I= 1law L25K 140W
flrll h~ID CaL OWIGWOIWI CMU•I
Figure 3.85: NODDS 925-mb Winds and Streamline Analysis (a) and24-h Forecast (b) from OOOOZ 16 August 1992.
3-98
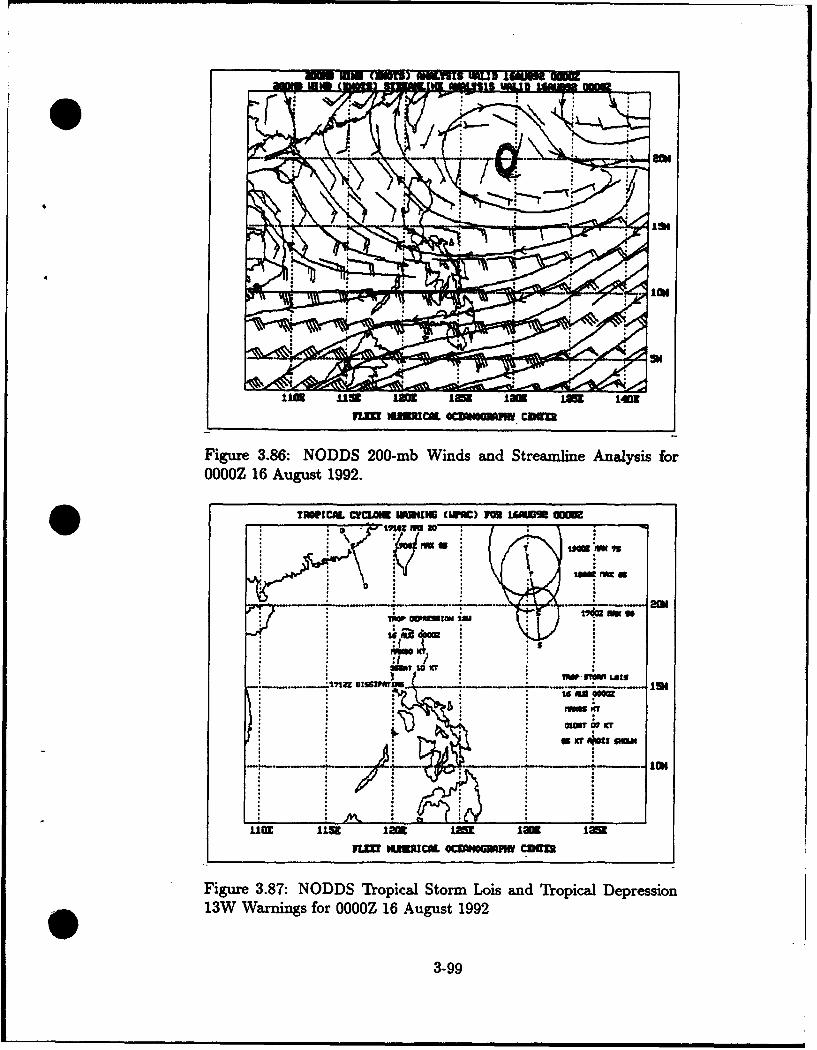
MwE (MMT) UW1I5 'MUD IIWE 5
l12 lit I= I= 1 1251 1401
V= uLMMc. 0=m41sm M UK
Figure 3.86: NODDS 200-mb Winds and Streamline Analysis forOOOOZ 16 August 1992.
TIMPICML CILVCm lMIl. (wA) M LEI38 MM
.• ~w onza : io m w
t IcrImZQ 8
Tw BWI LAMS
a Kr 4Ku MuM
ICU
MlfE Fl1 a.o a I=m InwrLMM i/2CAL QC V*IAIFIcu
Figure 3.87: NODDS Tropical Storm Lois and Tropical Depression13W Warnings for OOOOZ 16 August 1992
3-99
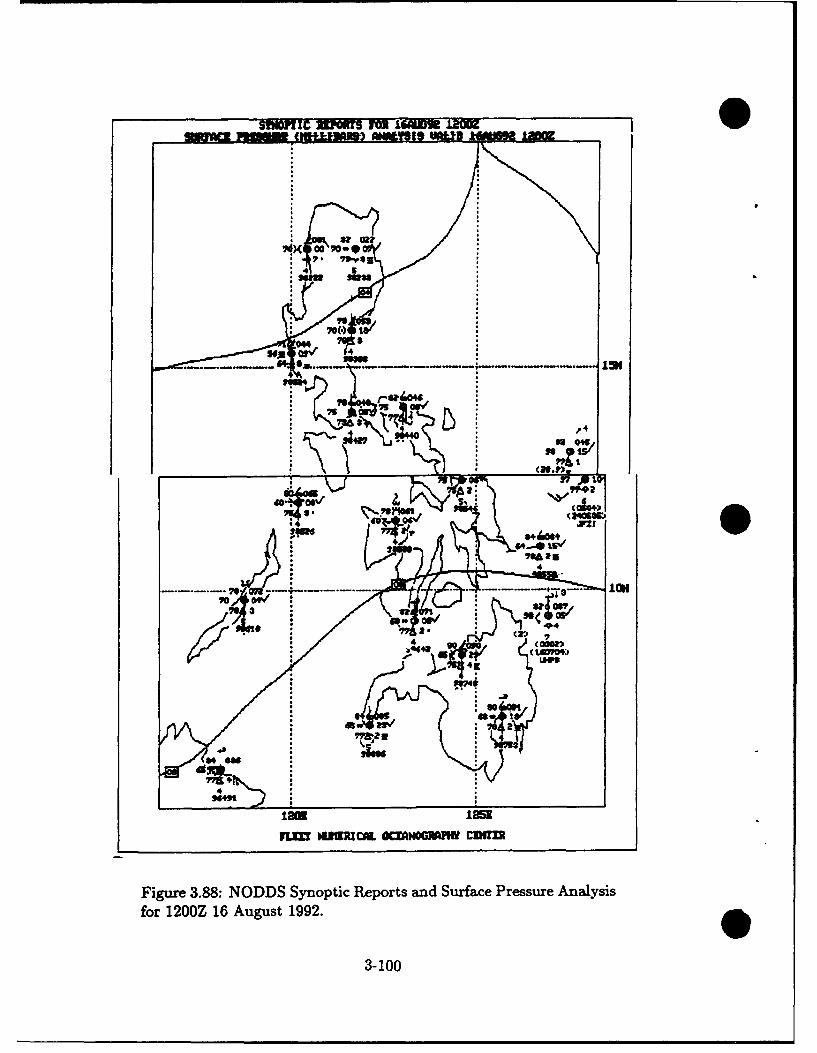
SYMoPrIC W FOR J.6W•hl• l
.-.......- .-,-. .---. .-. os.
44
Figure 3.88: NODDS Synoptic Reports and Surface Pressure Analysisfor 1200Z 16 August 1992.O
3-100
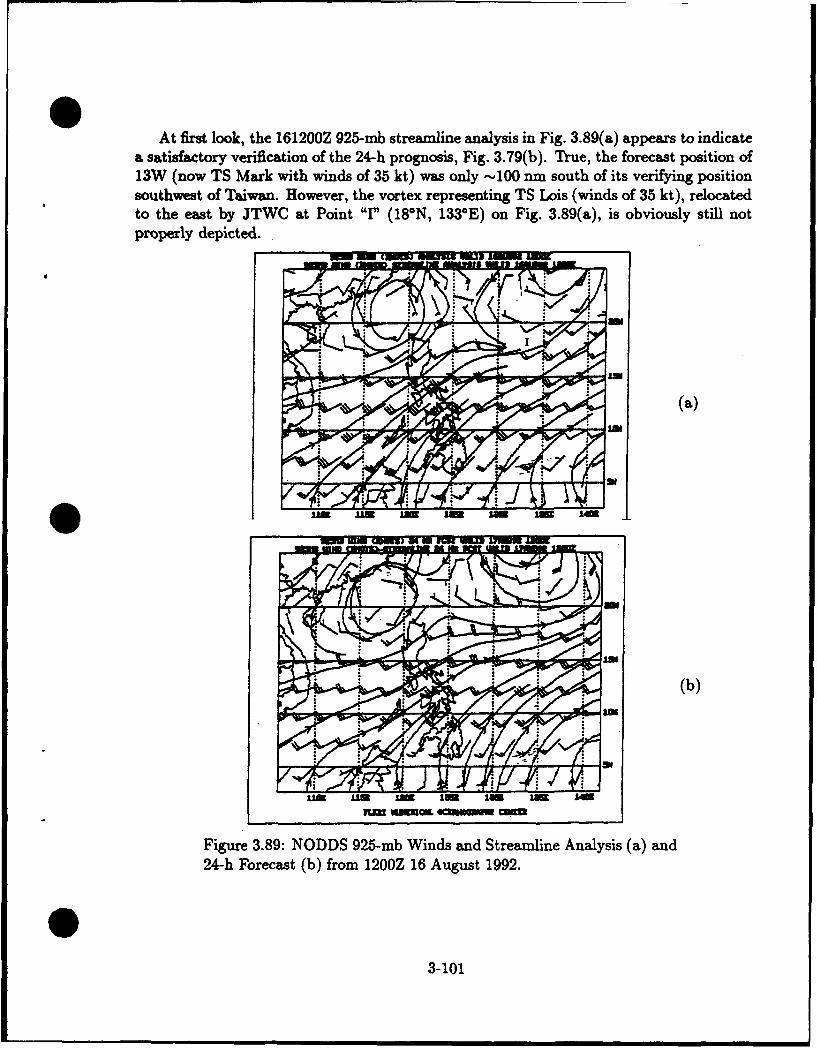
At first look, the 161200Z 925-mb streamline analysis in Fig. 3.89(a) appears to indicatea satisfactory verification of the 24-h prognosis, Fig. 3.79(b). True, the forecast position of13W (now TS Mark with winds of 35 kt) was only -100 nm south of its verifying positionsouthwest of Taiwan. However, the vortex representing TS Lois (winds of 35 kt), relocatedto the east by JTWC at Point "I" (18°N, 133°E) on Fig. 3.89(a), is obviously still notproperly depicted.
44mu
IBM MIZ N N IIU NO am
(b)
Figu~re 3.89: NODDS 925-mb Winds and Streamline Analysis (a) and24-h Forecast (b) from 1200Z 16 August 1992.
3-101
17 August 1992
Again Figs. 3.90(a) & (b) permit an examination of the NODDS transmitted satellitemosaic of the DMSP visible and IR swaths at 17010OZ. Figure 3.90(b) dearly shows the IRclusters associated with Kent (just south of Japan), Lois (east of Luzon), Mark5 2 (west of
Taiwan) and the elongated cold-cloud-tops emanating from near Manila. The continuingsatellite signature over the South China Sea is indicative of the convection along thewest coast of the PI, caused by the low-level southwest monsoon surge. Its persistenceis confirmed by the recorded precipitation at Cubi Point during the period 14-18 August1992, as shown in Table 3.6.
Figure 3.91 shows the pressure trough existing between Tropical Storm Mark and Trop-ical Storm Lois at 170000Z. The concurrent JTWC warning positions of the two tropicalcyclones are found on Fig. 3.92. The Prognostic Reasoning Message for TS Lois attributedthe forecast northeastward track of Lois to interaction with TS Mark-i.e., Mark was nowstronger (45 kt) than Lois (35 kt).
Again, a chart displaying the synoptic reports and surface pressure analysis (170000Z),throughout the entire length of the Philippine Islands, is shown on Fig. 3.93. Precipitationis occurring from central Luzono into the Visayas.
In Fig. 3.94, the NOGAPS 170000Z 925-mb streamline analysis includes a vortex in theTaiwan Strait near the JTWC warning position of TS Mark on Fig. 3.92; unfortunately, asbefore, the tropical analyst is disappointed to find only a trough at the warning position(190N, 134.5-E) of TS Lois.
However, the analyst is encouraged by Fig. 3.95 showing both wave height and seasurface temperature (SST) analyses. Note that the ship JFIr reporting 4.5 foot wavesand 7.5 foot swell, in Fig. 3.93, correlates well with the FNOC wave heights, >6 feet, atPoint "H" (170N, 117°E) on Fig. 3.95. The >9 foot waves analyzed at Point "G" (17.5°N,135°E), in the vicinity of Tropical Storm Lois, is realistic; however, the colocation of SST>300 C would be expected to disappear with the subsequent" upwelling and mixing of thetropical cyclone.
"52The presence of the cloud line extending NNE from TS Mark is associated with upper-level outflow fromMark and southerly flow ahead of a mid-latitude trough approaching from the west.
53A shower was reported at Cubi Point on the NODDS zoom analysis (not shown)."The FNOC SST analysis 12 hours later at 171200Z (see Fig. 3.100) has a slightly smaller >30*C pool.
3-102
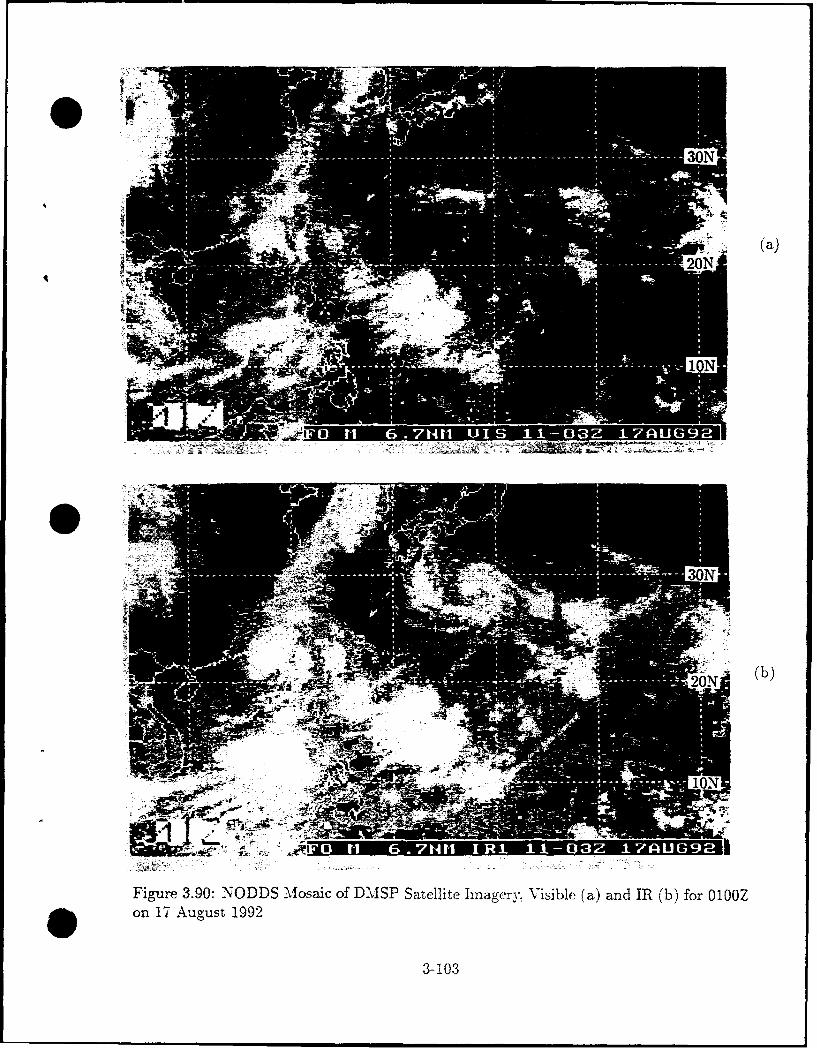
4w of 17 Auus19
3-103
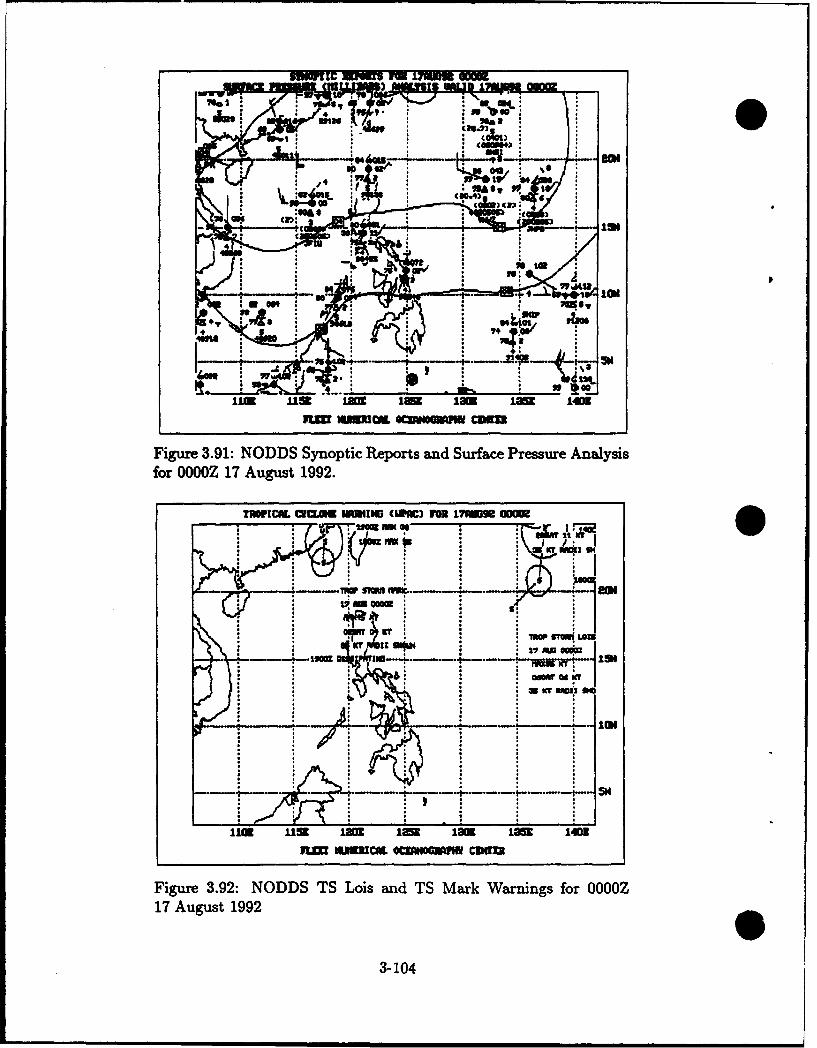
BIM0•ZC w !m L7UD aOm0
IP 04 - 4
n m cmOnca
ma 0atJuv•m
3-O
b. t6o,, ,
oaw arm lwu
lm..X• MU- ML Ci
Figure 3.92: NODDS TSyLopiceprs and TSuMrkacPrninssfore Anysi
17 August 1992
lux m I= ,Lm3
NOiA :CACM cum
Figure 3 .91 N--.... -- Synpti Reprt and--- Sufc rsueA alyi
-T~ , IF :OC w1 .
111•~~19 mte 200m2 28 .E 10
Fi•'e .92 NODS S ors anKr Mr v'~ o 0017 Auus 1992 La
3-1z04 2 n wo
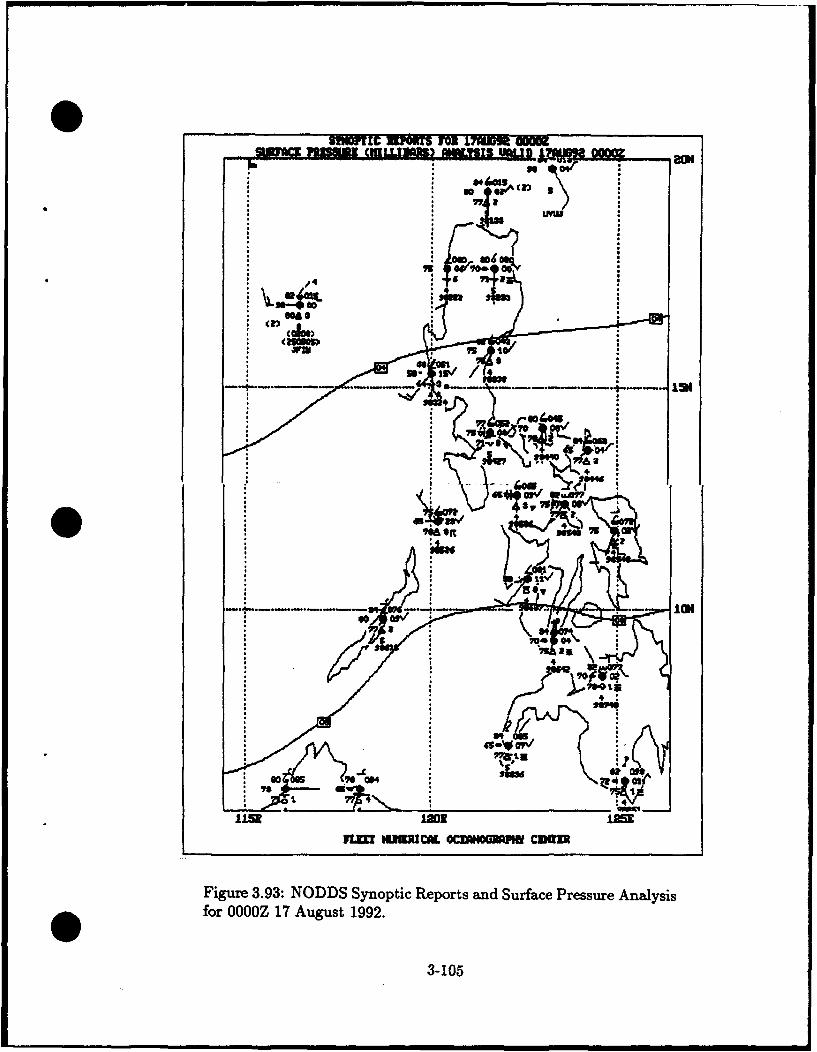
SMWoFC HPO RYU L7MM1 0o=.siuwa limusuiul CRLLI)RARS) J3M.PJISUj.
,, .
S*• '*L . .. t* 3!M! 120 mqý
"U.,
Figure 3.93: NODDS Synoptic Reports and Surface Pressure AnalysisO ~ for 0000Z 17 August 1992.
3-105
I4ý IC
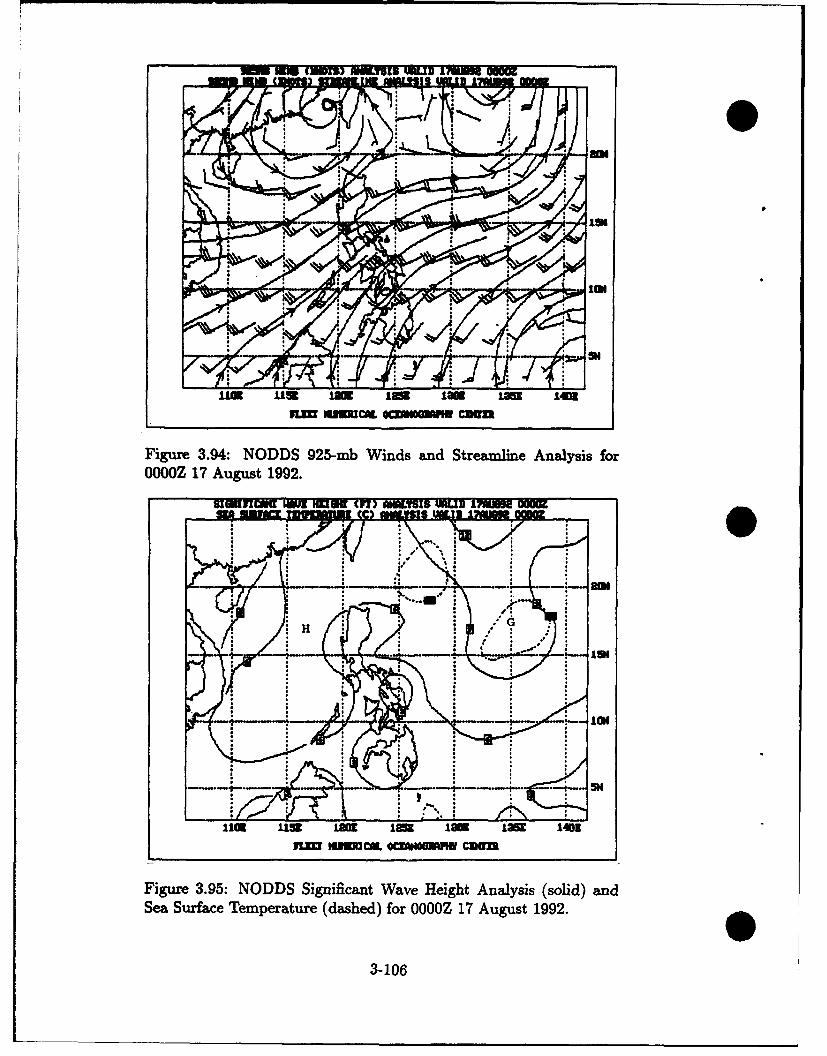
I= Ln minmc IcmuI= Lm cas
Figure 3.94: NODDS 925-mb Winds and Streamline Analysis forOOOOZ 17 August 1992.
UMJIMV3 M3 IM (n) MlAW,,IS uaUD 17ýee MMr
G
1109 1= iL= 1im im 1259 1401
nm iuumca ofGmwoo camn
Figure 3.95: NODDS Significant Wave Height Analysis (solid) andSea Surface Temperature (dashed) for OOOOZ 17 August 1992.
3-106
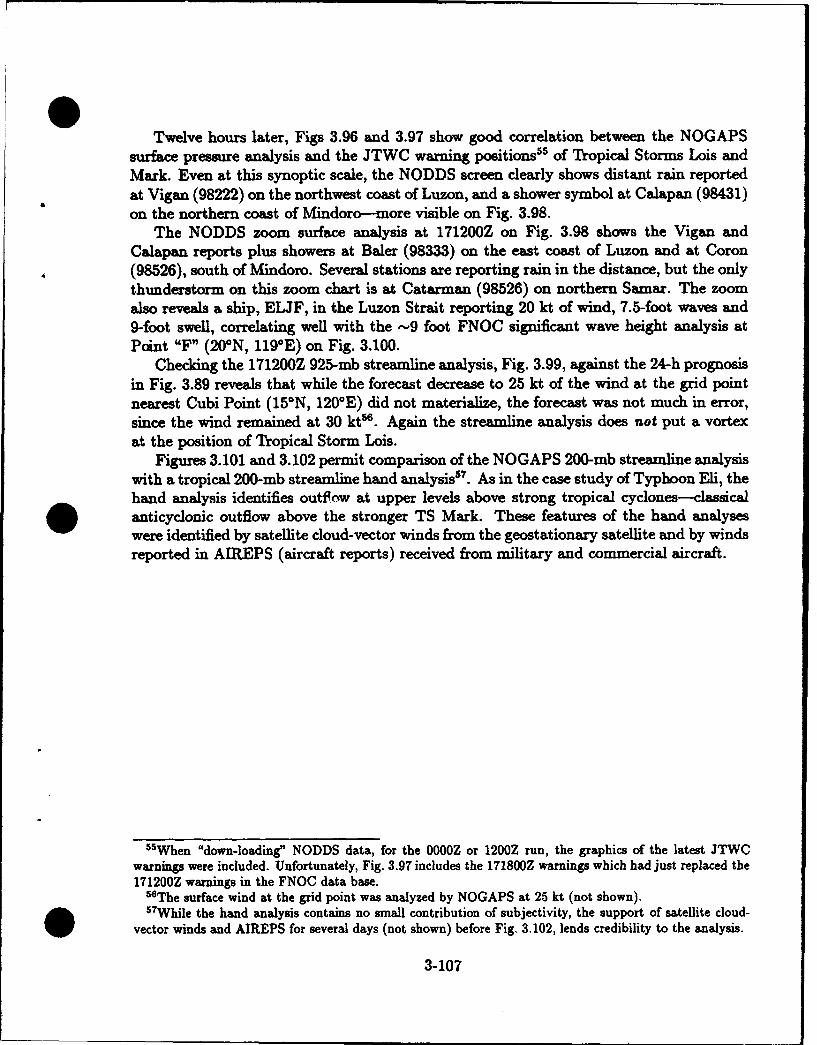
Twelve hours later, Figs 3.96 and 3.97 show good correlation between the NOGAPSsurface pressure analysis and the JTWC warning positions"5 of Tropical Storms Lois andMark. Even at this synoptic scale, the NODDS screen clearly shows distant rain reportedat Vigan (98222) on the northwest coast of Luzon, and a shower symbol at Calapan (98431)on the northern coast of Mindoro-more visible on Fig. 3.98.
The NODDS zoom surface analysis at 171200Z on Fig. 3.98 shows the Vigan andCalapan reports plus showers at Baler (98333) on the east coast of Luzon and at Coron(98526), south of Mindoro. Several stations are reporting rain in the distance, but the onlythunderstorm on this zoom chart is at Catarman (98526) on northern Samar. The zoomalso reveals a ship, ELJF, in the Luzon Strait reporting 20 kt of wind, 7.5-foot waves and9-foot swell, correlating well with the -9 foot FNOC significant wave height analysis atPoint "F" (20-N, 119E) on Fig. 3.100.
Checking the 171200Z 925-mb streamline analysis, Fig. 3.99, against the 24-h prognosisin Fig. 3.89 reveals that while the forecast decrease to 25 kt of the wind at the grid pointnearest Cubi Point (15°N, 120°E) did not materialize, the forecast was not much in error,since the wind remained at 30 kts. Again the streamline analysis does not put a vortexat the position of Tropical Storm Lois.
Figures 3.101 and 3.102 permit comparison of the NOGAPS 200-mb streamline analysiswith a tropical 200-mb streamline hand analysis"'. As in the case study of Typhoon Eli, thehand analysis identifies outfiow at upper levels above strong tropical cyclones-classicalanticyclonic outflow above the stronger TS Mark. These features of the hand analyseswere identified by satellite cloud-vector winds from the geostationary satellite and by windsreported in AIREPS (aircraft reports) received from military and commercial aircraft.
"55When "down-loading" NODDS data, for the OOOOZ or 1200Z run, the graphics of the latest JTWCwarnings were included. Unfortunately, Fig. 3.97 includes the 171800Z warnings which had just replaced the171200Z warnings in the FNOC data base.
"The surface wind at the grid point was analyzed by NOGAPS at 25 kt (not shown).""7While the hand analysis contains no small contribution of subjectivity, the support of satellite cloud-
vector winds and AIREPS for several days (not shown) before Fig. 3.102, lends credibility to the analysis.
3-107
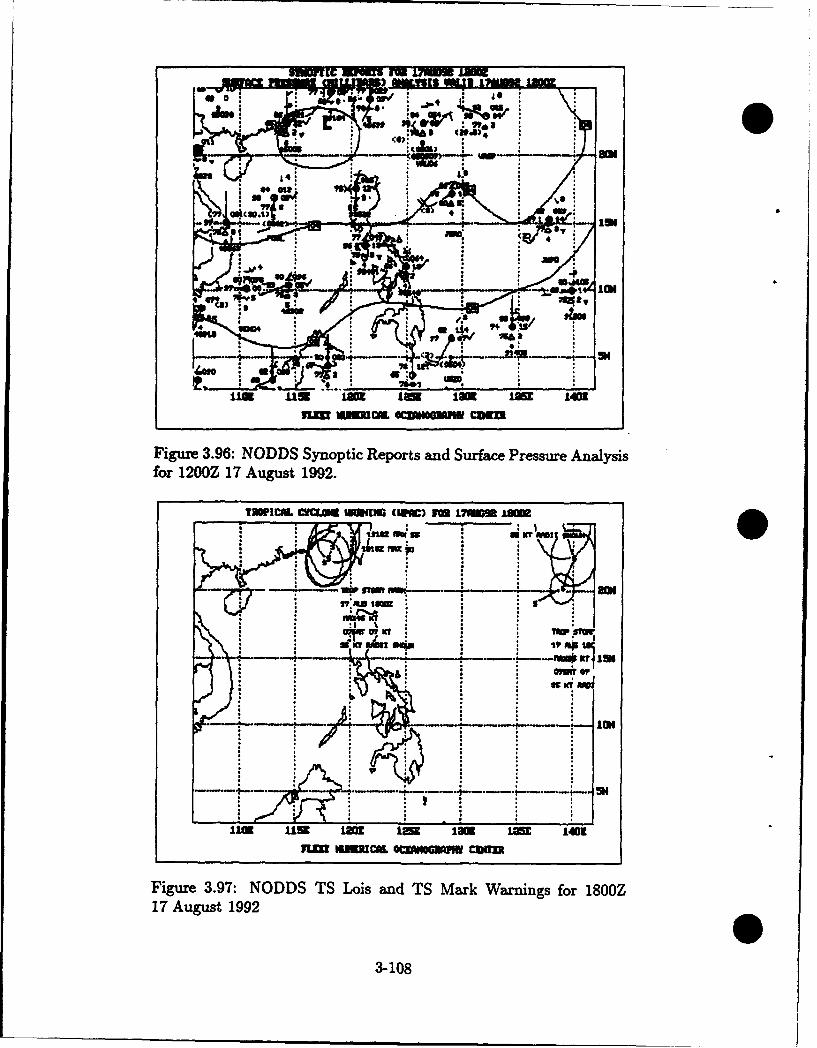
w •
Leo.:. .
•4 a mA
n 4P
IL iini~ O~U W ICU
lin.l~ us I IOM, = Lanr140
Figure 3.96: NODDS Synoptic Reports and Surface Pressure Analysisfor 1200Z 17 August 1992.
TUWICU. CMU MIDM (WM) MrN 1731 ±9M
gainI• IV
*.m nSI
Figure 3.97: NODDS TS Lois and TS Mark Warnings for 1800ZIla Lims IOL3-1
3-108
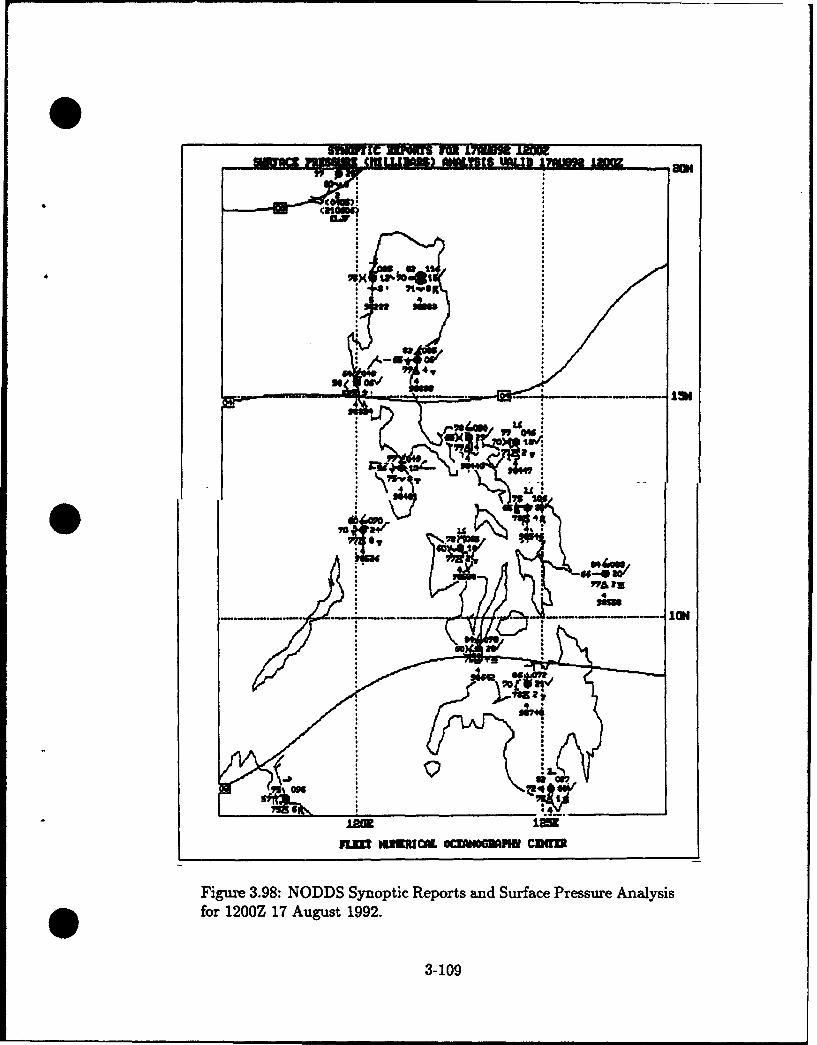
swicC a 1 imml l aOm lam arm
* I
Mir
, io ta31% IFana
for 1,00Z 17.August 1992.
3-109
.'.7v 04,
70 q
Figure 3.98: NODDS Synoptic Reports and Surface Pressure AnalysisO for 1200Z 17 August 1992.
3-109
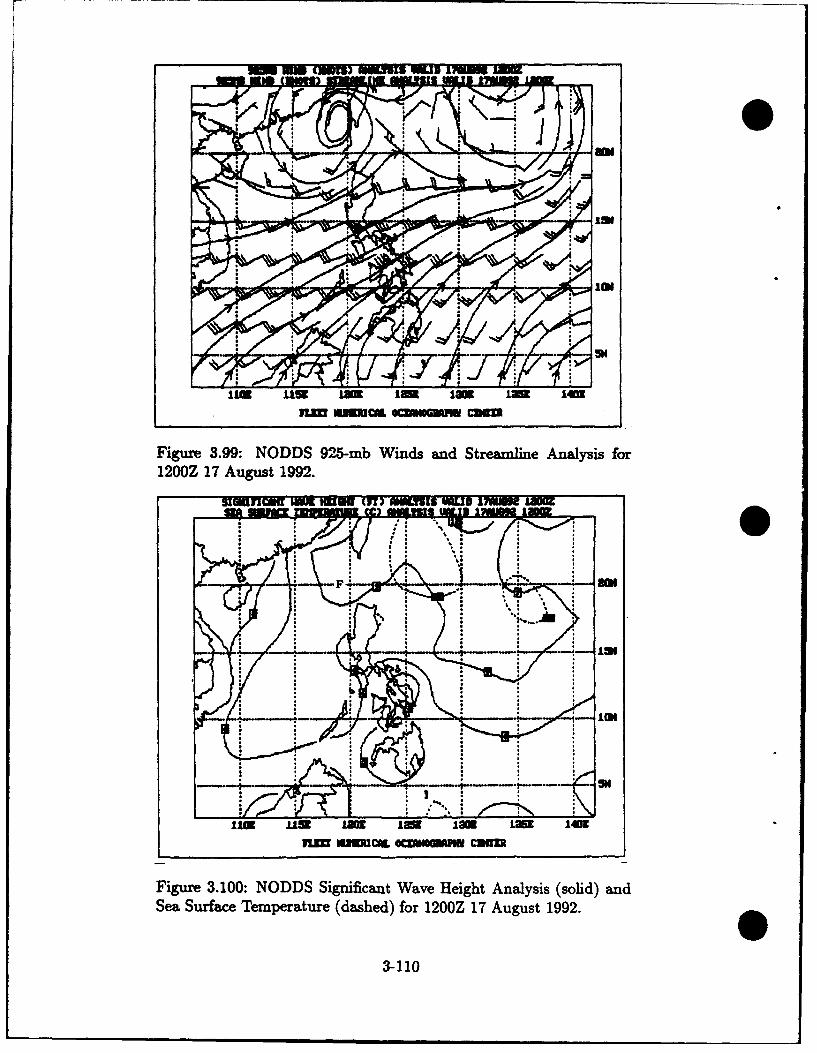
1200Z~ý1 7g Auut 92n~fl4 IJ • lf (]l Ti) Il YIS U LIDI 7LIUN £
zuo/. .
Figure 3.99: NODDS 925-mb Winds and Streamline Analysis for120OZ 17 August 1992.
g•GIMFIC 1• M a Ra w 0ll') WAM(II lS o w n~l 17dMiMJ M R
Figure 3.100: NODDS Significant Wave Height Analysis (solid) and
Sea Surface Temperature (dashed) for 1200Z 17 August 1992.
3-110
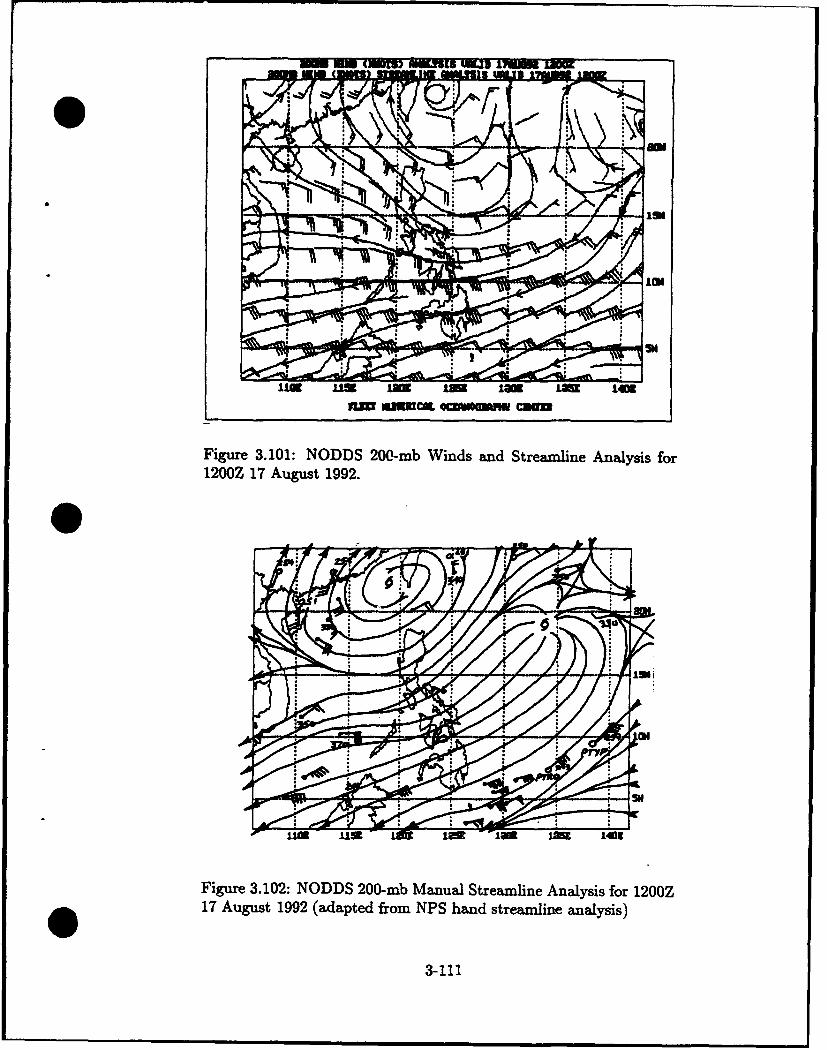
m(UNIO5 SUW5S M3PUD 1 zMW
WE im LM I= vm Luzm 140
Figure 3.101: NODDS 200-mb Winds and Streamline Analysis for1200Z 17 August 1992.
Figure 3.102: NODDS 200-mb Manual Streamline Analysis for 1200Z17 August 1992 (adapted from NPS hand streamline analysis)
3-111
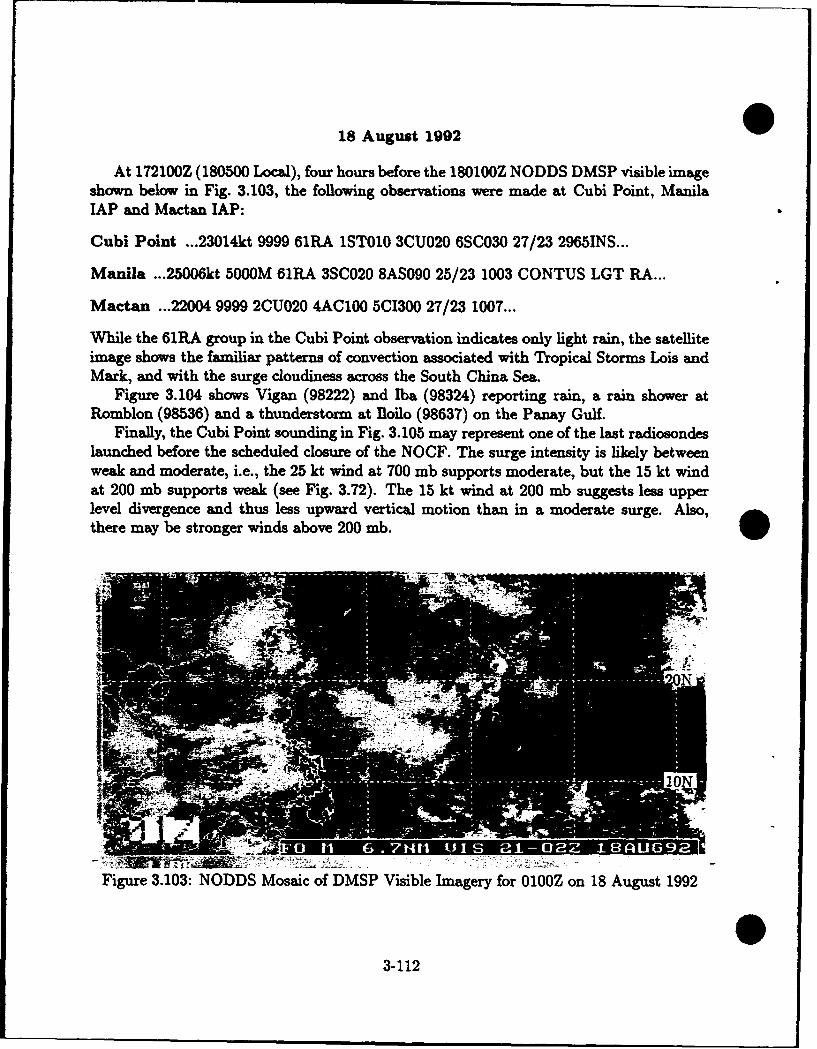
18 August 1992
At 172100Z (180500 Local), four hours before the 180100Z NODDS DMSP visible imageshown below in Fig. 3.103, the following observations were made at Cubi Point, ManilaIAP and Mactan IAP:
Cubi Point ...23014kt 9999 61RA 1ST010 3CU020 6SC030 27/23 2965INS...
Manila .. .25006kt 5000M 61RA 3SC020 8AS090 25/23 1003 CONTUS LGT RA...
Mactan ...22004 9999 2CU020 4AC100 5C1300 27/23 1007...
While the 61RA group in the Cubi Point observation indicates only light rain, the satelliteimage shows the familiar patterns of convection associated with Tropical Storms Lois andMark, and with the surge cloudiness across the South China Sea.
Figure 3.104 shows Vigan (98222) and Iba (98324) reporting rain, a rain shower atRomblon (98536) and a thunderstorm at Iloilo (98637) on the Panay Gulf.
Finally, the Cubi Point sounding in Fig. 3.105 may represent one of the last radiosondeslaunched before the scheduled closure of the NOCF. The surge intensity is likely betweenweak and moderate, i.e., the 25 kt wind at 700 mb supports moderate, but the 15 kt windat 200 mb supports weak (see Fig. 3.72). The 15 kt wind at 200 mb suggests less upperlevel divergence and thus less upward vertical motion than in a moderate surge. Also, •there may be stronger winds above 200 mb. V
Figure 3.103: NODDS Mosaic of DMSP Visible Imagery for 0100Z on 18 August 1992
3-112
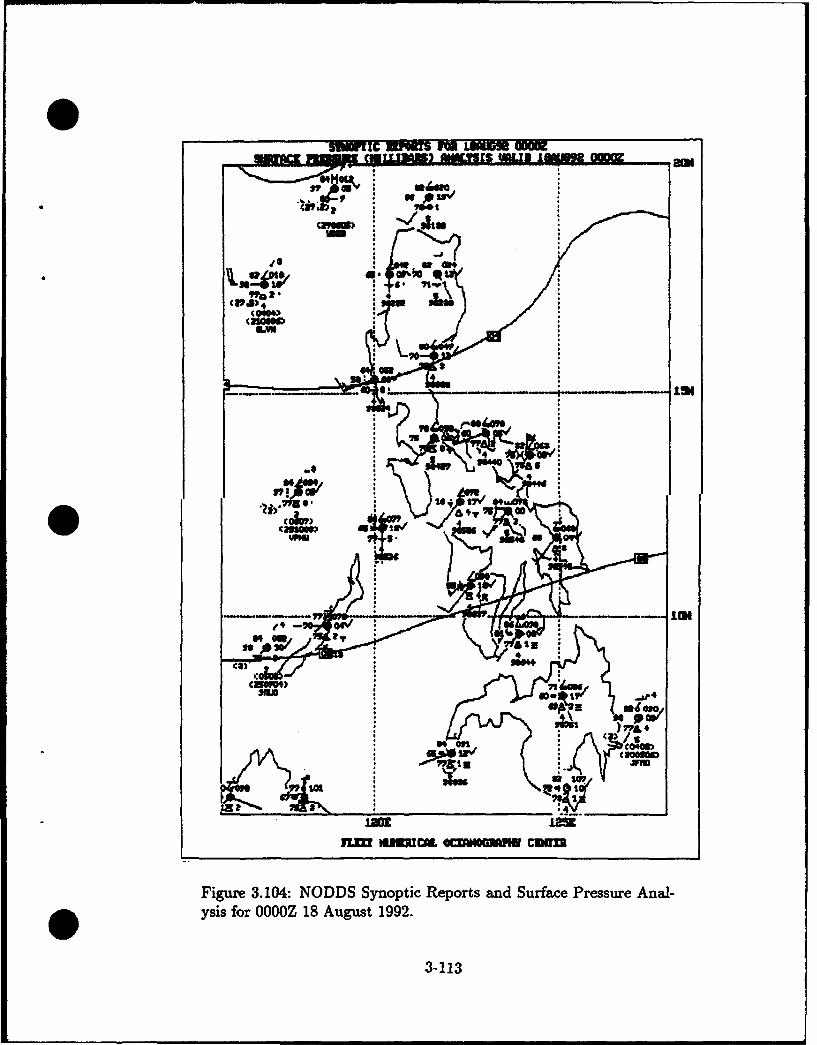
SIIWIIC NOWS UUL UU
OW I
7~0
97.
ca-oe" _.-
IACim i!
Figure 3.104: NODDS Synoptic Reports and Surface Pressure Anal-O ysis for 0000Z 18 August 1992.
3-113
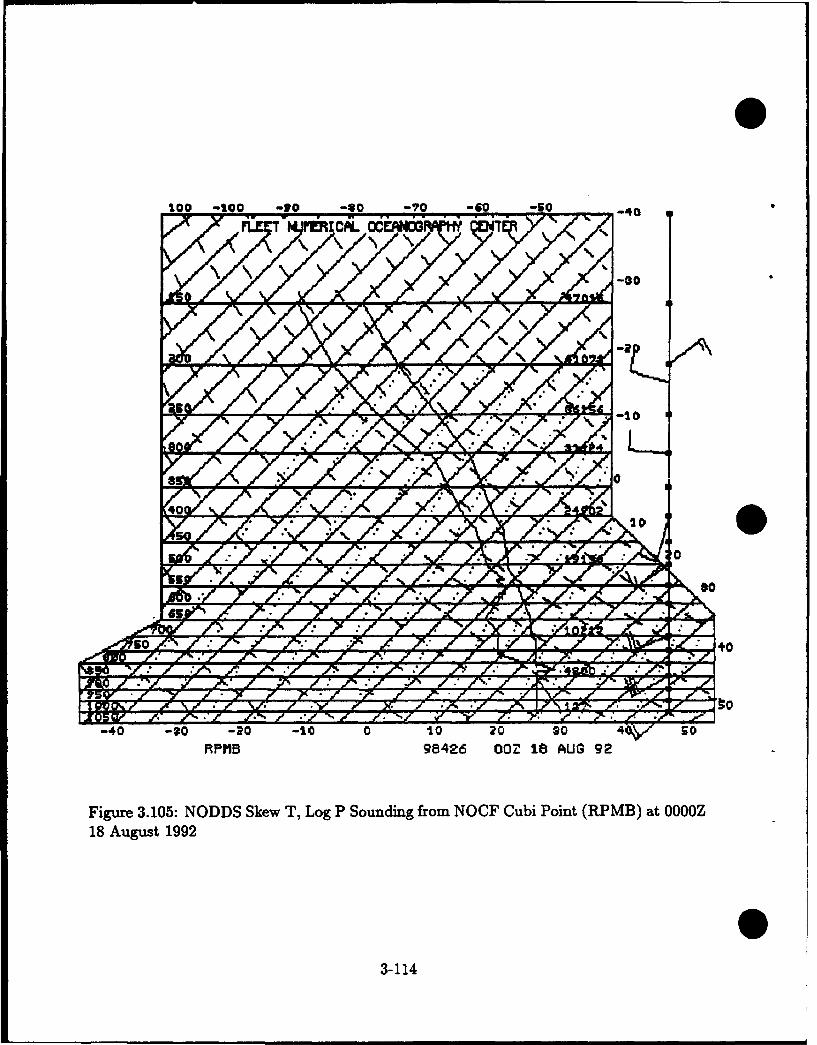
0
100 -00 -90 -90 -- 0 -60 -50 -40
-00
0
"90
XO ' A /. --, .,4 -.-• /' ..'K -..- -.r. -,." rl _ ý3-40 -to -20 -to 0 10 ?o0 so 40,y 50RPMIB 98426 00' IS AUG 92
Figure 3.105: NODDS Skew T, Log P Sounding from NOCF Cubi Point (RPMB) at 0000Z
18 August 1992
3-114
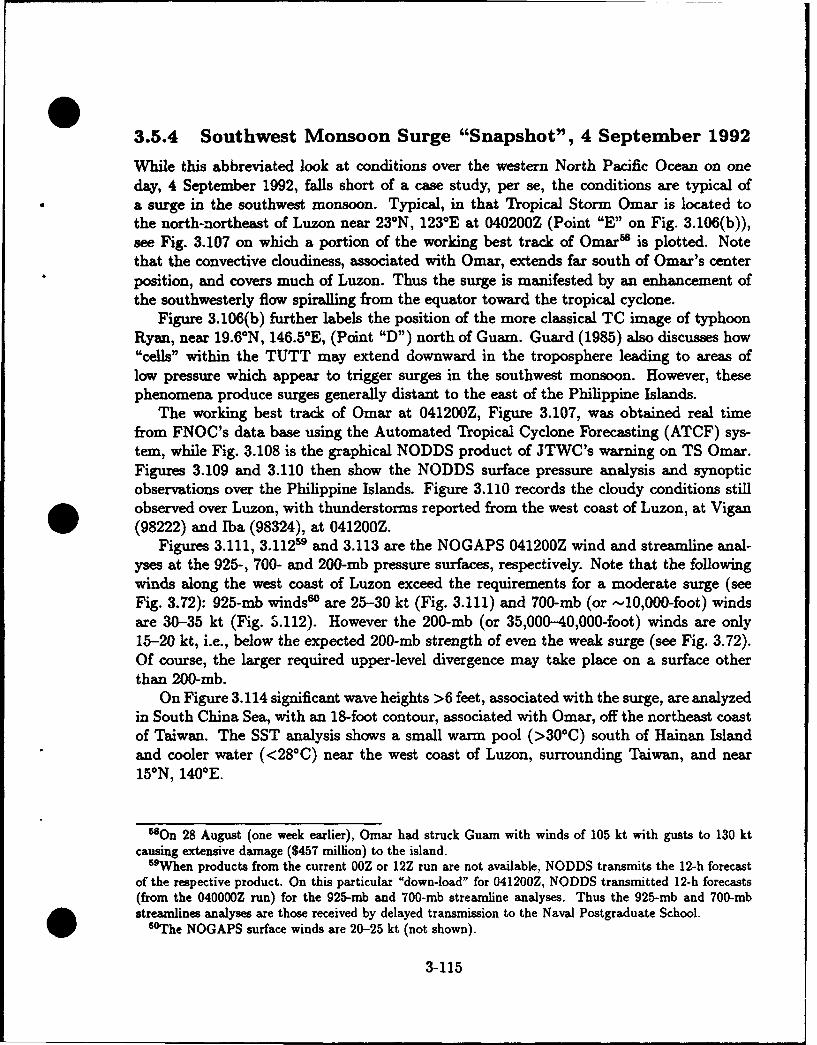
03.5.4 Southwest Monsoon Surge "Snapshot", 4 September 1992
While this abbreviated look at conditions over the western North Pacific Ocean on oneday, 4 September 1992, falls short of a case study, per se, the conditions are typical ofa surge in the southwest monsoon. Typical, in that Tropical Storm Omar is located tothe north-northeast of Luzon near 23°N, 123°E at 040200Z (Point "E" on Fig. 3.106(b)),see Fig. 3.107 on which a portion of the working best track of Omar' is plotted. Notethat the convective cloudiness, associated with Omar, extends far south of Omar's centerposition, and covers much of Luzon. Thus the surge is manifested by an enhancement ofthe southwesterly flow spiralling from the equator toward the tropical cyclone.
Figure 3.106(b) further labels the position of the more classical TC image of typhoonRyan, near 19.6°N, 146.5°E, (Point "D") north of Guam. Guard (1985) also discusses how"cells" within the TUTT may extend downward in the troposphere leading to areas oflow pressure which appear to trigger surges in the southwest monsoon. However, thesephenomena produce surges generally distant to the east of the Philippine Islands.
The working best track of Omar at 041200Z, Figure 3.107, was obtained real timefrom FNOC's data base using the Automated Tropical Cyclone Forecasting (ATCF) sys-tem, while Fig. 3.108 is the graphical NODDS product of JTWC's warning on TS Omar.Figures 3.109 and 3.110 then show the NODDS surface pressure analysis and synopticobservations over the Philippine Islands. Figure 3.110 records the cloudy conditions stillobserved over Luzon, with thunderstorms reported from the west coast of Luzon, at Vigan(98222) and Iba (98324), at 041200Z.
Figures 3.111, 3.1125' and 3.113 are the NOGAPS 041200Z wind and streamline anal-yses at the 925-, 700- and 200-mb pressure surfaces, respectively. Note that the followingwinds along the west coast of Luzon exceed the requirements for a moderate surge (seeFig. 3.72): 925-mb windsw are 25-30 kt (Fig. 3.111) and 700-mb (or -10,000-foot) windsare 30-35 kt (Fig. 5.112). However the 200-mb (or 35,000-40,000-foot) winds are only15-20 kt, i.e., below the expected 200-mb strength of even the weak surge (see Fig. 3.72).Of course, the larger required upper-level divergence may take place on a surface otherthan 200-mb.
On Figure 3.114 significant wave heights >6 feet, associated with the surge, are analyzedin South China Sea, with an 18-foot contour, associated with Omar, off the northeast coastof Taiwan. The SST analysis shows a small warm pool (>30°C) south of Hainan Islandand cooler water (<280C) near the west coast of Luzon, surrounding Taiwan, and near150N, 140*E.
"SOn 28 August (one week earlier), Omar had struck Guam with winds of 105 kt with gusts to 130 ktcausing extensive damage ($457 million) to the island.
"59When products from the current OOZ or 12Z run are not available, NODDS transmits the 12-h forecastof the respective product. On this particular "down-load" for 041200Z, NODDS transmitted 12-h forecasts(from the 040000Z run) for the 925-mb and 700-mb streamline analyses. Thus the 925-mb and 700-mbstreamlines analyses are those received by delayed transmission to the Naval Postgraduate School.
"6°The NOGAPS surface winds are 20-25 kt (not shown).
3-115
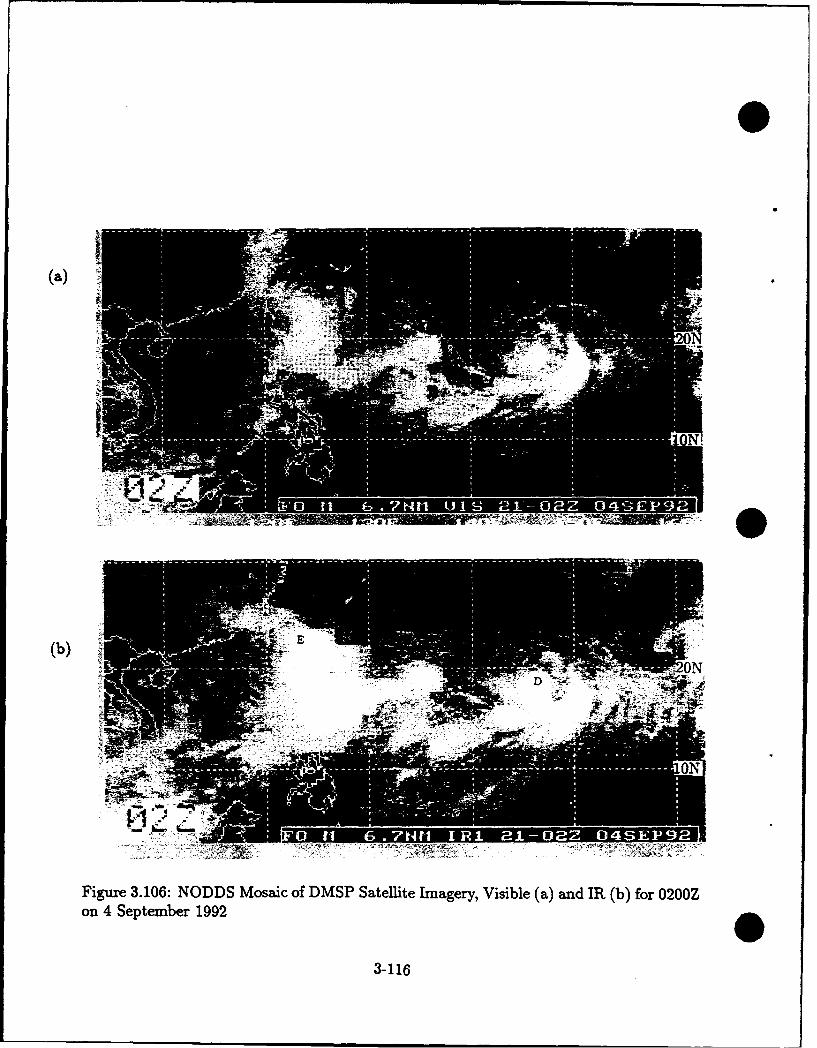
0
(b).. ..
Figure 3.106: NODDS Mosaic of DMSP Satellite Imagery, Visible (a) and IR (b) for 0200Zon 4 September 1992
3-116
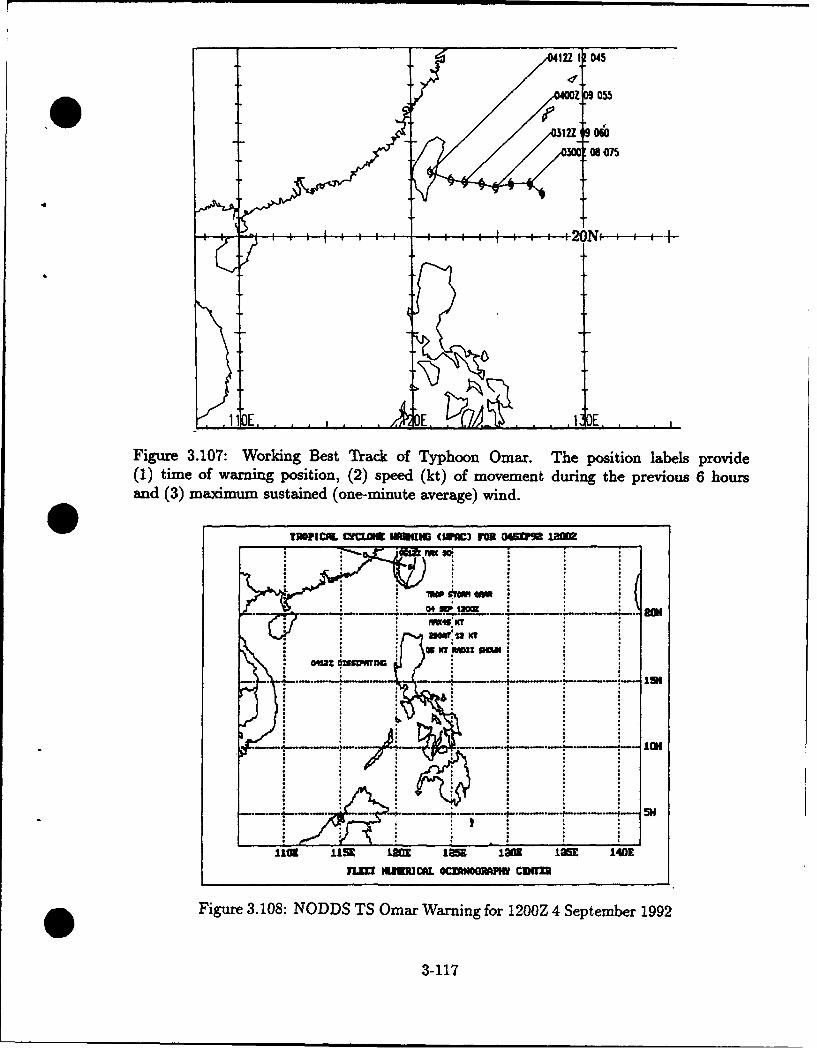
'. . E. ...E ... • E.
Figure 3.107: Working Best Track of Typhoon Omar. The position labels provide(1) time of warning position, (2) speed (kt) of movement during the previous 6 hoursand (3) maximum sustained (one-minute average) wind.
TiOIPICIcL ICCLO 11II3 CNICW) FUO 0459W1 I•fO
-. : •sww.-- + , , ,,
W4'K
imn
1101 1151 1is 1= 11w m 1951 1401
IL IUUCAL OCEPWOGUH• CInTE
Figure 3.108: NODDS TS Omar Warning for 1200Z 4 September 1992
3-117
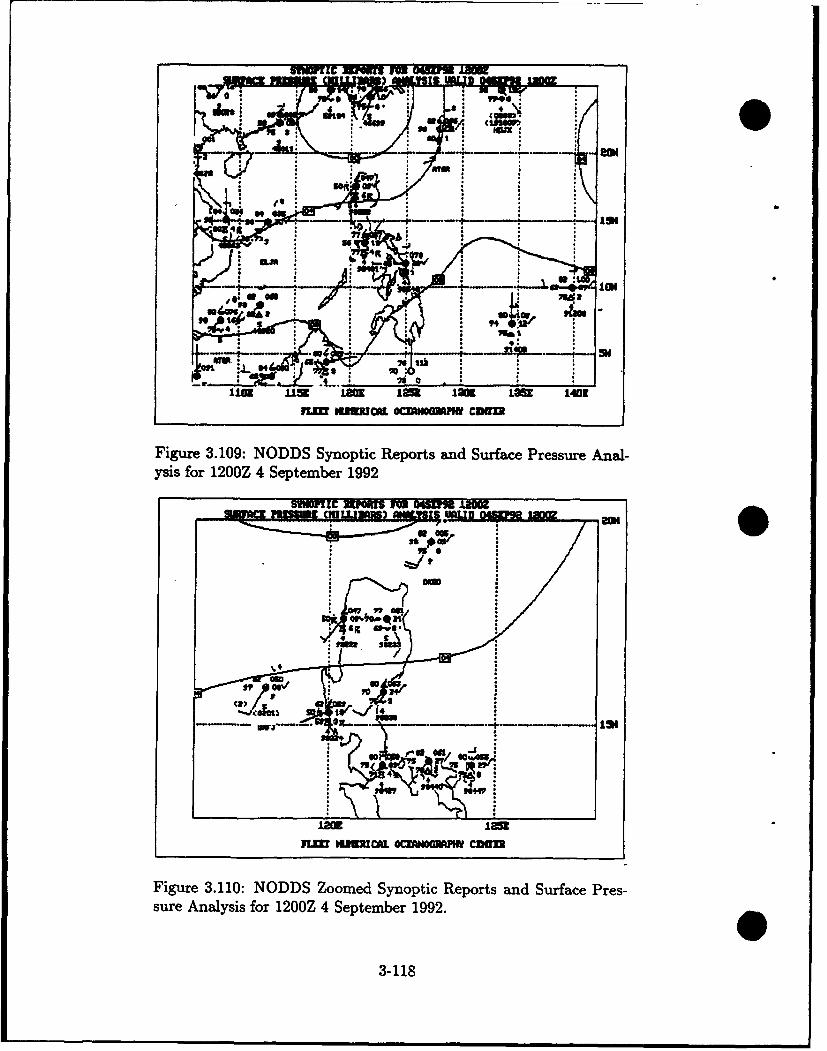
. " I Em M 50 IM
aam
Fgr3.0: N"D yoti eot an Sufc Prsuenlilo
* m46
'-.3 .- 4-. -- *. -..-- 13
II.I IUU rU efi ClS
110 im Lu 12Mj l~omiw Lou 140
Figure 3.109: NODDS Synoptic Reports and Surface Pressure Anal-ysis for 1200Z 4 September 1992
SOIC slawn To 3 -11
79<ILEA 75, 7c9 soGmq CH'•
Figure 3.110: NO:DDS Z.o:omed Synopti•c :Reports and Surface Pres-sure Analysis for 1200Z 4 September 1992.O
3-118

44 O
Figure 3.111: NOGAPS 925-mb Winds and Streamline Analysis for1200Z 4 September 1992 (from the Naval Postgraduate School)
ý;;20N4
Figure 3.112: NOGAPS 700-mb Winds and Streamline Analysis for1200Z 4 September 1992 (from the Naval Postgraduate School)
3-119
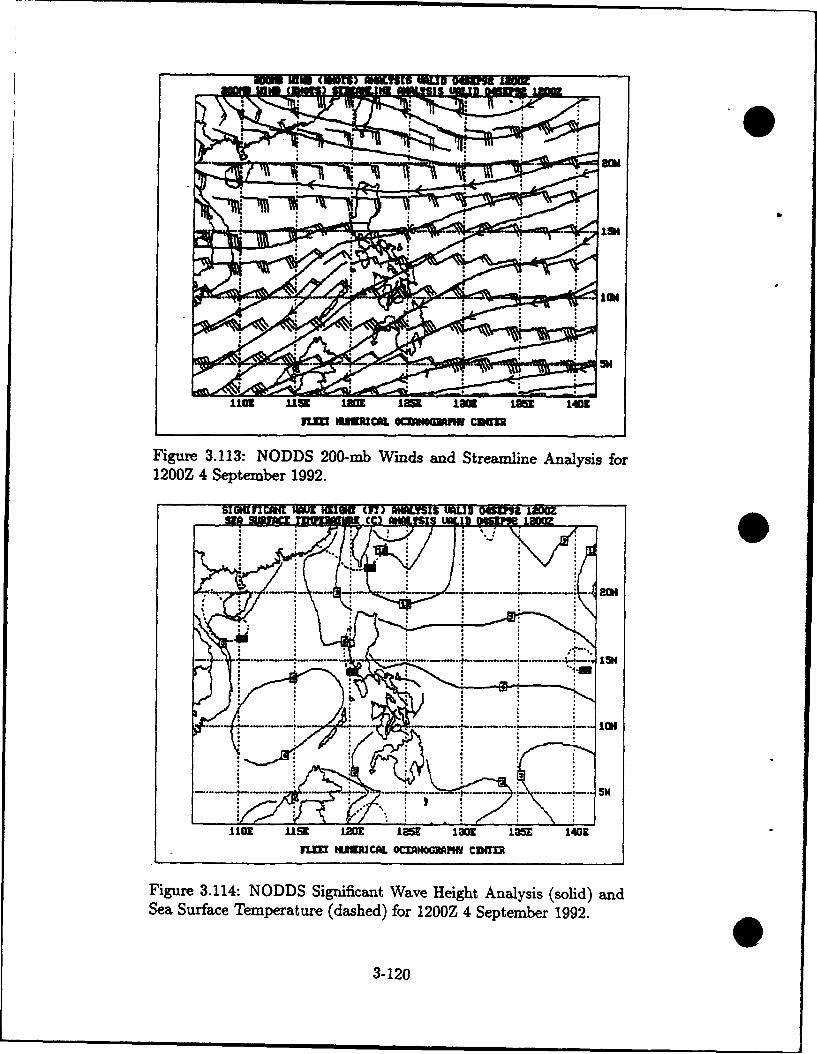
ON MUST NAMES mug OVOR "M
IlU list 1 8IM 1 law LM 1401
MM .I1RCL OM. MMM CMUU
Figure 3.113: NODDS 200-mb Winds and Streamline Analysis for1200Z 4 September 1992.
SeMaSur MaR Tat a (d ) fors u10Za 4o• S Im 1992.
.-.. ............ .. -------- ----3
1101 list 120E 125E lam LOSE 1409
nm NUMMCAL OCIOWMPM CMUTI
Figure 3.114: NODDS Significant Wave Height Analysis (solid) andSea Surface Temperature (dashed) for 1200Z 4 September 1992.
3-120
AT 041600Z (050000 Local), four hours after the previous analyses, the following ob-servations were made at Cubi Point, Manila LAP and Mactan LAP:
Cubi Point ...21014/20KT 9999 25RESH ICB015 3CU020 3SC030 8AC080 28/242969INS/CIG030 OCNL LTGIC CB N STNR CB SE DSIPTD...
Manila ...22004KT 6000 3CU020 8AC090 26/23 1005 INTMT LGT RA...
Mactan ... 24002 9999 2CU020 28/24 1008...
i.e., rain showers and wind 14 kt gusting to 20 kt at Cubi Point; light rain at Manila LAP;but only scattered clouds at Mactan LAP in the Visayas.
The 24-h terminal forecast for Cubi Point for the period 041500Z-051500Z called forwind 21010/16kt, overcast, ceilings 2000-3000 feet, with thunderstorms and rain showersin the vicinity; temporary periods of thunderstorms and moderate or heavy rainshowers,wind 21016/25kt, visibility 4000 meters, ceiling lowering to 1000 feet; and then gradually,between 050300Z-050500Z, ceilings and visibility improving, except for temporary lightrain or thunderstorms.
To support this episode as a bonafide surge, the following is quoted from an AssociatedPress news release on 6 September 1992.
... Avalanches of volcanic debris caused by heavy rains roared down the slopesof Mount Pinatubo yesterday, causing thousands to abandon their villages.Monsoon rains have inundated a wide area around Pinatubo, 60 miles northwestof Manila, and more than 50 people have died during the past few weeks. Theflooded area includes Clark Air Base, abandoned by the U. S. Air Force whenthe volcano erupted in June 1991. The rains have caused debris from thateruption to plunge down Pinatubo's slopes and swell rivers.. .at least three riversare filled with up to 20 feet of volcanic muck.. .Scientists say heavy rains couldtrigger massive avalanches, called lahars, for years around Pinatubo... Pinatubocame to life again in July (1992), when lava began oozing from the cratercreated by the 1991 eruption. Scientists say the renewed activity indicatesanother violent eruption may be near.
As noted above, avalanches must have occurred "during the past few weeks." Sincethe surge case, in Section 3.5.3, ended on 18 August, much of the surge precipitation wascaused by Tropical Storm Polly that moved on a track to the northeast of Luzon (notshown) during the last week of August.
3-121
3.5.5 Northeast Monsoon Cold Surge 6-8 February 1992
During the 1990-1992 time period, the most significant rainfall events occurred duringthe southwest monsoon. However, the forecaster must be aware of the strong winds oftenassociated with cold surges and shear lines occurring during the northeast monsoon. Whilenortheasterly surges and shear lines may reach Luzon and Visayas near the end of theirlife span-often manifested by only a dissipating, unimpressive cloud line over Luzon-,these phenomena are responsible for strong winds primarily in the northern South ChinaSea, the Luzon Strait and the northern Philippine Sea.
Many studies define differently the East Asian cold surges by observations (on andadjacent to the coast of China) of: surface pressure gradients, drops in surface temperature,increases in the northerly wind component, etc. However, Boyle and Chen (1987) examinethe evolution of contour patterns6 l on constant pressure surfaces over Asia to identifyprecursors of the cold surge event. They examined the strongest surge"2 in terms of coolingrate and minimum temperature, to affect Hong Kong during the winter of 1978-1979.Similarities of this case study of a cold surge to that of Boyle and Chen will be identified.
6 February 1992
The 060200Z February 1992 infrared imagery of Fig. 3.115 shows the typical warm and dryconditions so often prevalent over the Philippine Islands during the northeast monsoon.Note, in particular, the clear conditions over the northern South China Sea and the LuzonStrait. Of course, imagery of such gross resolution, 6.7 nm will not identify many of the 'smaller mesoscale features.
Following the example of Boyle and Chen (1987), the 061200Z 300 mb contour analysisis examined in Fig. 3.116. With the trough existing over Mongolia and extending throughPoint "B", it is easy to visualize the ridge existing just north of the figure, i.e., to thenorthwest of Lake Baikal (spelled Baykal, on some atlases), which is seen on the northernedge of the figure at Point "Z"'. The development of this ridge-attributed in the Boyleand Chen (1987) study, to warm advection to the west-is a key event of the sequencefor the surges. The developing ridge initiates a northwesterly flow over Lake Baikal (seethe 300-mb contour 24-h forecast in Fig. 3.117). Figure 3.117 also shows the upper-leveltrough having moved eastward, and now extending through Point "Y"' north of Korea.It is this feature, the trough, that will be the key force in initiating the surge-however,it is noted that this trough does not have so great an amplitude (is not as deep) as theone in the Boyle and Chen study. Forecasters at the Royal Observatory of Hong Kong usenorthwesterly flow in the region of Lake Baikal at 500 mb as one indication that a surgeis imminent. By 48 hours, the 300-mb forecast in Fig 3.118 predicts the trough to havemoved over the Sea of Japan, extending through Point "X"'.
61Boyle and Chen (1987) also examine thickness layers and thermal advection in their discussion.62Their study was of the second (8-11 December 1978) of 11 surges occurring in that season.
3-122
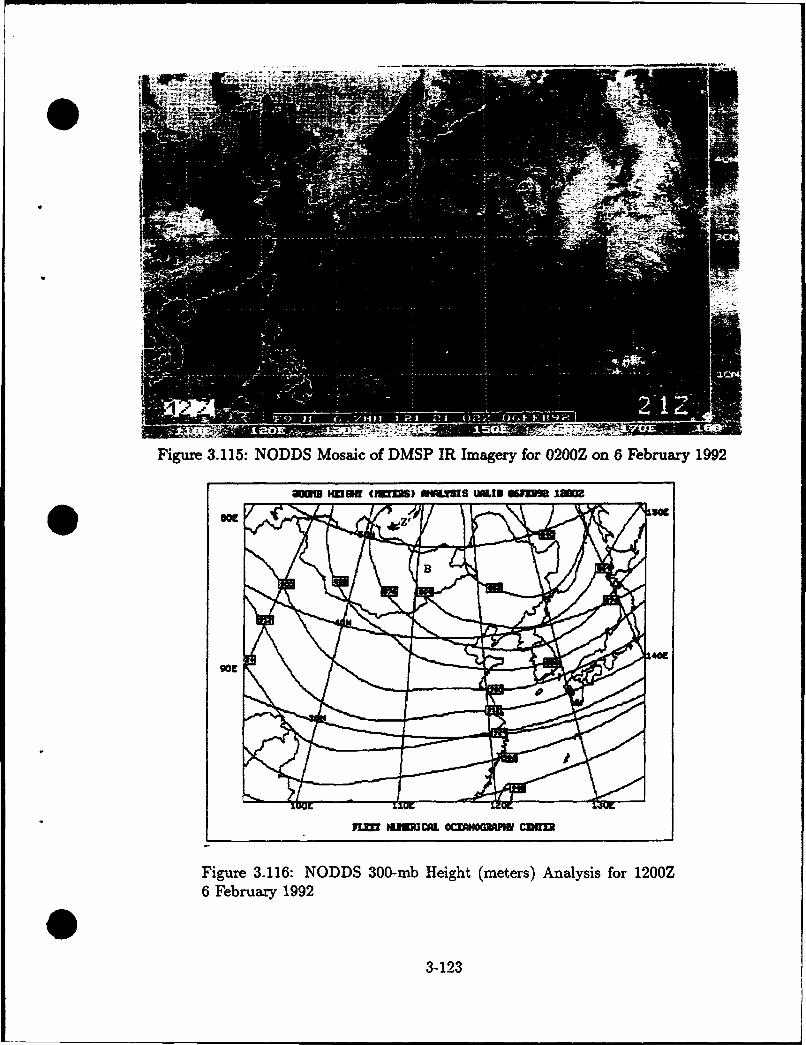
O
Figure 3.115: NODDS Mosaic of DMSP IR Imagery for 0200Z on 6 February 1992
aMM HNU (HU ls) MIAUSS MID OIMU 1=1Z
90C
Jw m IIEa3t ociomm m Cinan
Figure 3.116: NODDS 300-mb Height (meters) Analysis for 1200Z6 February 1992
3-123

ain iIinU (cNunl'a ml 84 No nw awn Ow] MM
Mc400
'LIM
n------- ,.. ca
Figure 3.117: NODDS 300-mb Height (meters) 24-h Forecast from1200 6 February 1992
m Ii~wi (MMUB) uaE w o awnD OGM "M
'a,at low-
Figure 3.118: NODDS 300-mb Height (meters) 48-h Forecast from1200 6 February 1992
3-124
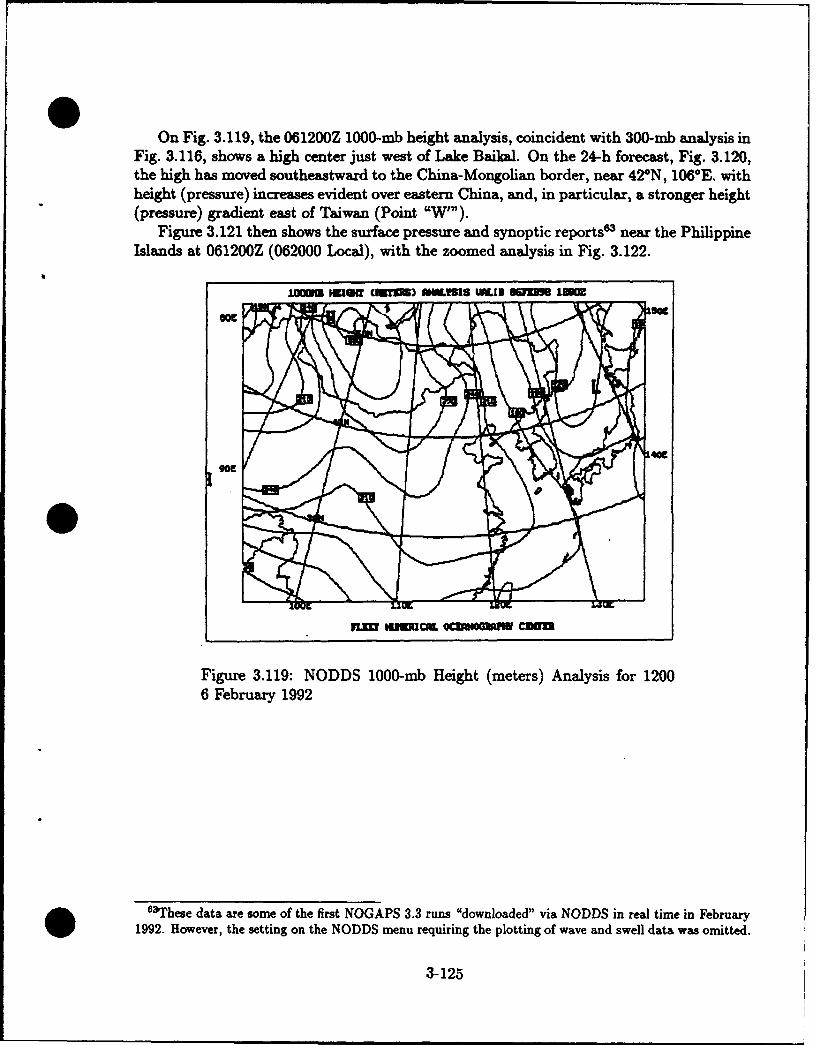
0On Fig. 3.119, the 061200Z 1000-mb height analysis, coincident with 300-mb analysis in
Fig. 3.116, shows a high center just west of Lake Baikal. On the 24-h forecast, Fig. 3.120,the high has moved southeastward to the China-Mongolian border, near 420N, 106°E. withheight (pressure) increases evident over eastern China, and, in particular, a stronger height(pressure) gradient east of Taiwan (Point "W'").
Figure 3.121 then shows the surface pressure and synoptic reports' near the PhilippineIslands at 061200Z (062000 Local), with the zoomed analysis in Fig. 3.122.
10MHW 3OIE AWOM o
040
Figure 3.119: NODDS 1000-mb Height (meters) Analysis for 12006 February 1992
""eThese data are some of the first NOGAPS 3.3 runs "downloaded" via NODDS in real time in February1992. However, the setting on the NODDS menu requiring the plotting of wave and swell data was omitted.
3-125
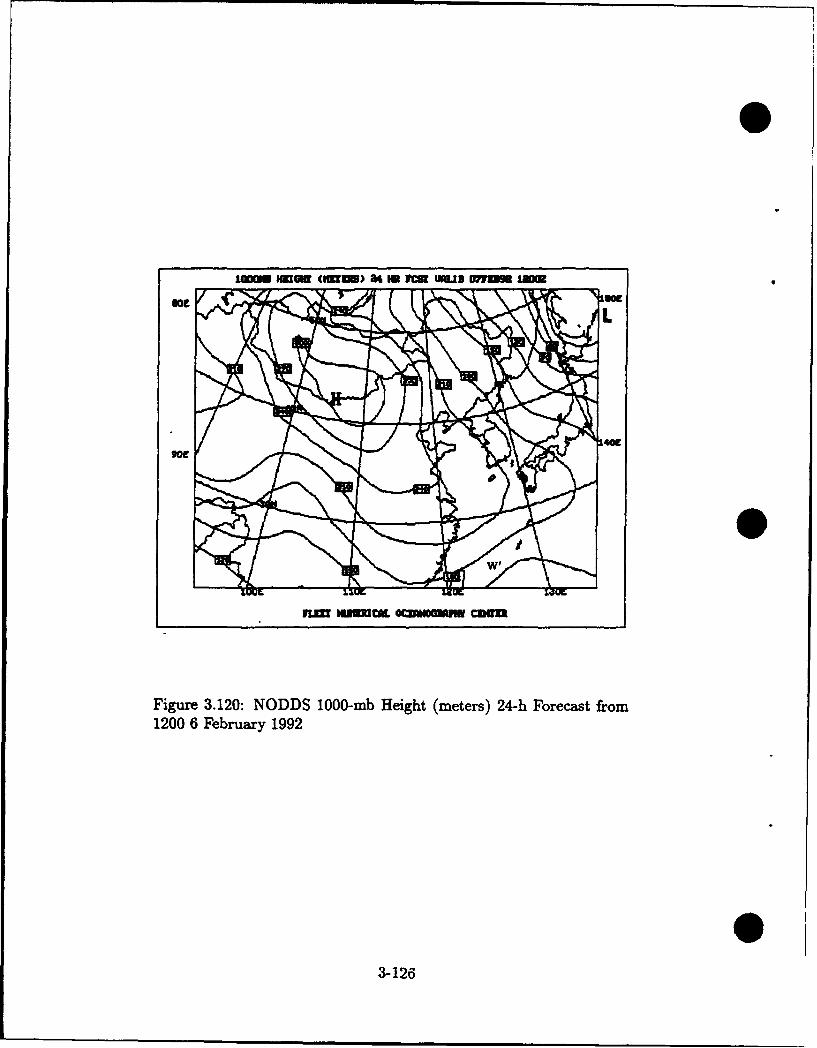
0
=nofU MKgu (1WV) 3G M P U~ MLI am= im
Figure 3.120: NODDS 1000-mb Height (meters) 24-h Forecast from1200 6 February 1992
03-126
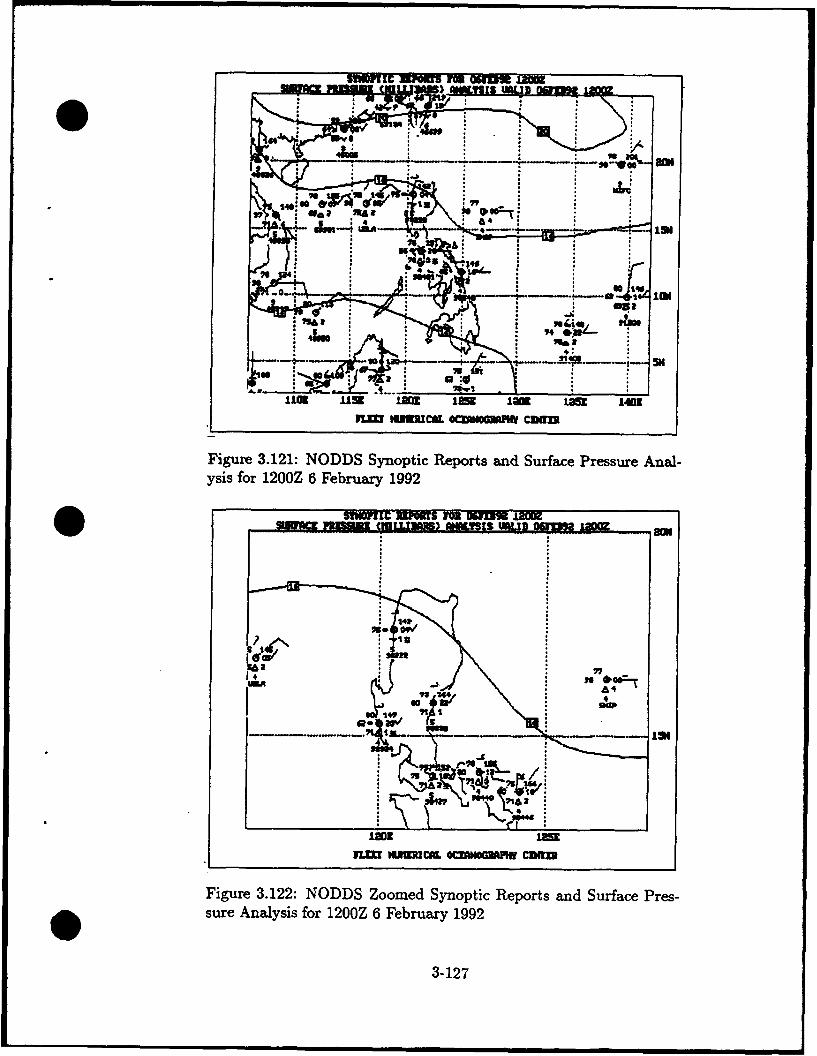
14O46
! .. ...... . .
41 1 M U 1 1 E E 1 U 5 1 44
1LM JLU59 CL O1UM CR I=
Figure 3.121: NODDS Synoptic Reports and Surface Pressure Anal-ysis for 1200Z 6 February 1992
SST11PTItC Raa M Ougea
Baa'49;
son'
lugo
-. 5 "• -- - z
71 LZ lMhC*L OCEMDU"M cREum
Figure 3.122: NODDS Zoomed Synoptic Reports and Surface Pres-sure Analysis for 1200Z 6 February 1992
3-127

Next, Fig. 3.123 shows the 925-mb (near the gradient level used by tropical analysts)wind and streamline analysis at 061200Z. Note the small magnitude winds ("-10 kt) fromeast of Taiwan over the northern Philippine Sea to northeastern Luzon. The forecastsdepict a shear line, running from east of Taiwan to northern Luzon at 071200Z, Fig. 3.124,followed by stronger northeasterly winds (15-20 kt) over the Luzon Strait at 081200Z, asthe shear line is "progged" to reach the southeastern portion of Luzon, Fig. 3.125.
In Fig. 3.126, the polar front jet is manifested by the 95 kt winds on the 200-mb surfacenear Hong Kong at 061200Z. In particular note that the wind at the grid point near CubiPoint, 15*N, 120*E, is forecast to increase to 35 kt in 24 hours on Fig. 3.127, indicatingthe closer approach of the polar front jet.
Figure 3.128 shows >6-foot waves in the Luzon Strait and lower seas on the lee side(west) of northern Luzon, at 061200. The SST analysis, Fig. 3.129, shows >260C waternear the Visayas and Mindanao, 20"C water in the Taiwan Strait, and a SST gradient inthe Luzon Strait.
um wo (WIOT) ORIVIS NMun OU9m "M0
In 1153 120 125I law lam 1401
Figure 3.123: NODDS 925-mb Winds and Streamline Analysis for1200Z 6 February 1992
3-128
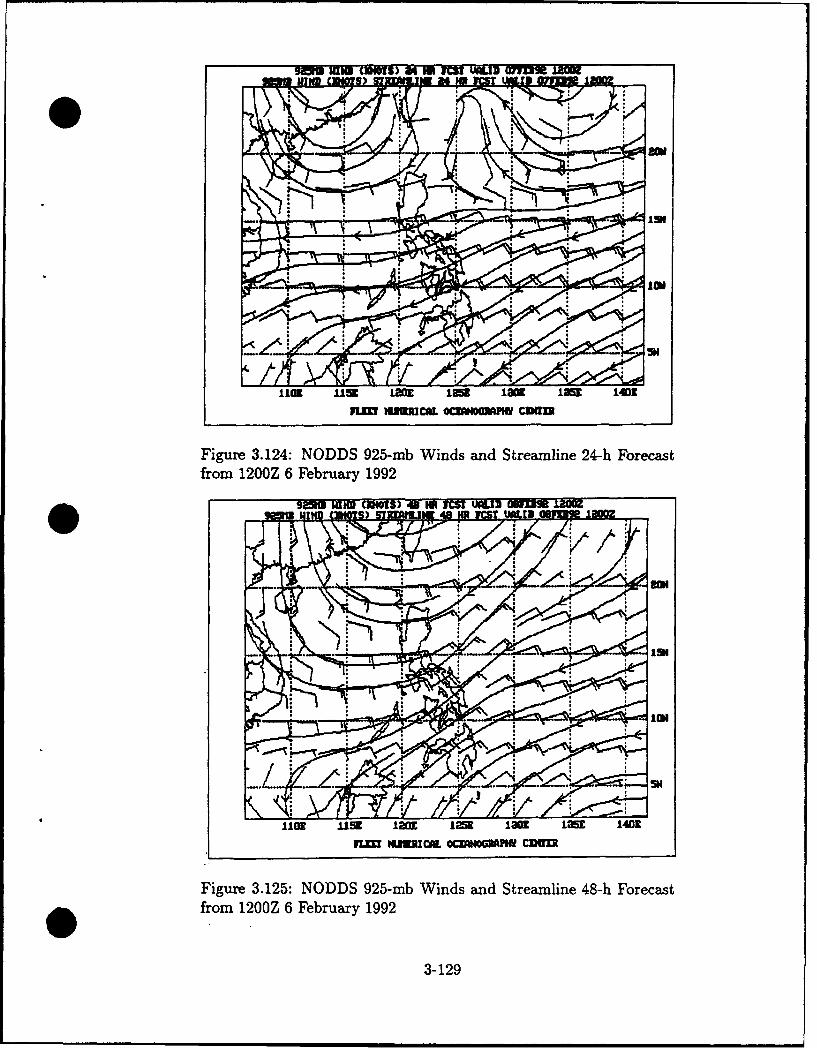
iii RZIM CURWS) aG M TMU UOLI 07M31 IRM1
1 tLm 11M 3C IM law C a 14
Figure 3.124: NODDS 925-mb Winds and Streamline 24-h Forecastfrom 1200Z 6 February 1992
92 MIu CXMS) 43 HR IEMS UW1 0 O It=
..z-;IBM
1101 U 1 20 M 1251 2 1 la 1Z 14011L U1133CA. QC~t4OGMPhf CR513
Figure 3.125: NODDS 925-mb Winds and Streamline 48-h Forecastfrom 1200Z 6 February 1992
3-129
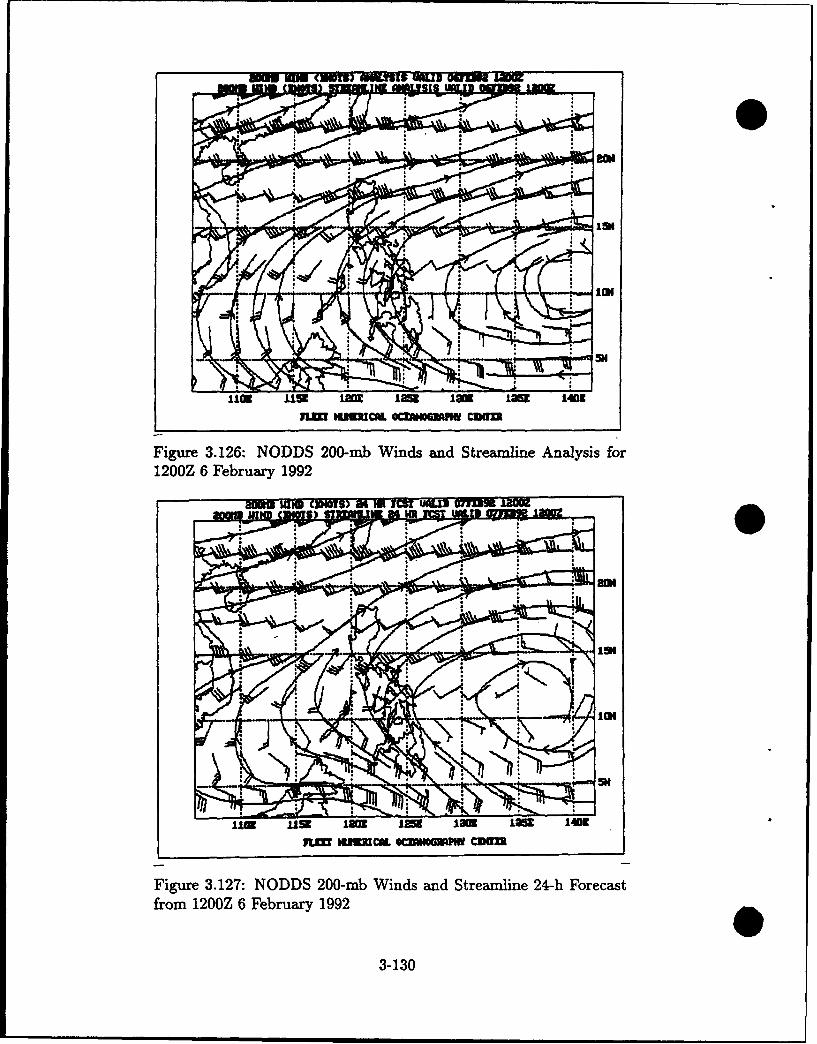
lIEU hME (NEMS) aiLT[I$ WULi 001M EM
lIi, Ilse I= 129 xI i 1401n= tummoz, C*mvemm Cum
Figure 3.126: NODDS 200-mb Winds and Streamline Analysis for1200Z 6 February 1992
aSUw €CE cows) 54 h N? UILIM OWN u JIa
ur un i i :ai :r 1403
Tw elwl S. IM2M Mp a
iism
! lam
llin "aI Lam 128 18= Lou 14012
IL][! IUEEtMCQL OC:TANOGUME. CDI11l
Figure 3.127: NODDS 200-mb Winds and Streamline 24-h Forecastfrom 1200Z 6 February 1992
3-130
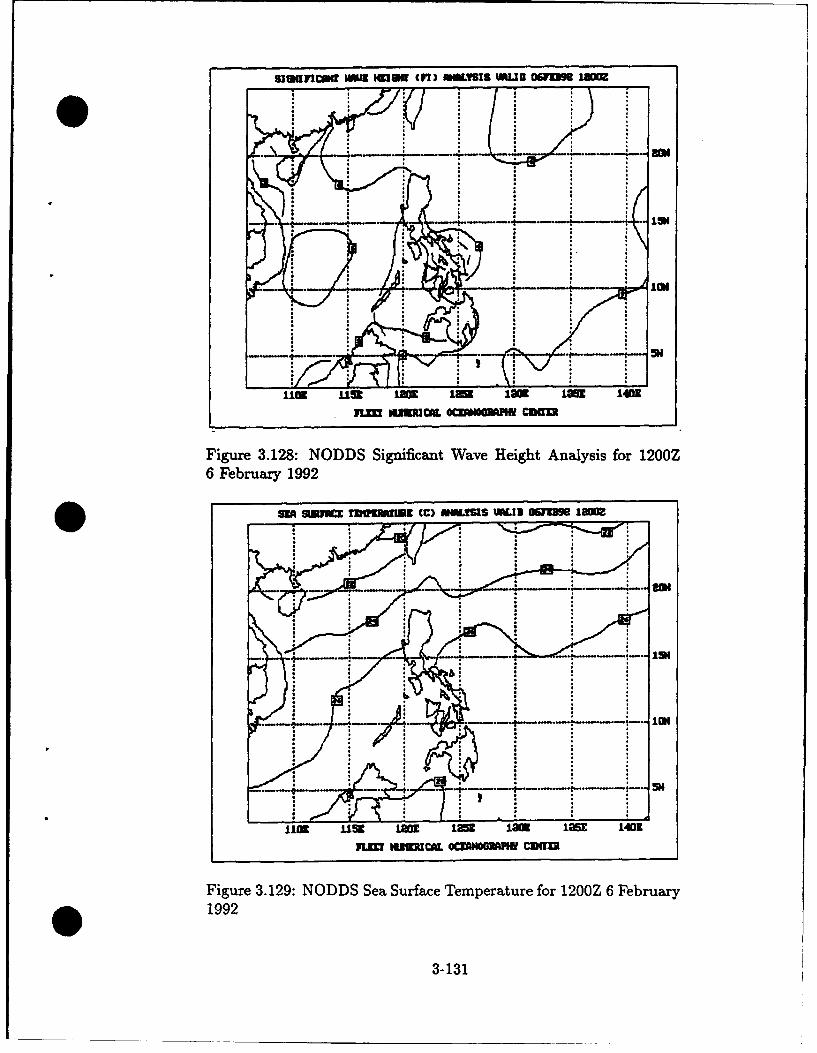
SIGflhIV1lff •in i IUU (1M) MW fYStI UIMUD 06MO98 U
-1i-n '- •= i• I= L 1
n= wmwcm oczanomM fera
Figure 3.128: NODDS Significant Wave Height Analysis for 1200Z6 February 1992
soR suffu MUWWMU CC) •MUMS IS xMD 180
9 •
.. ... ..•_ .......
1n Ilse ia I= la i2 1403
P& L? UMNCAL OCTANOMM CUUM
Figure 3.129: NODDS Sea Surface Temperature for 1200Z 6 February1992
3-131
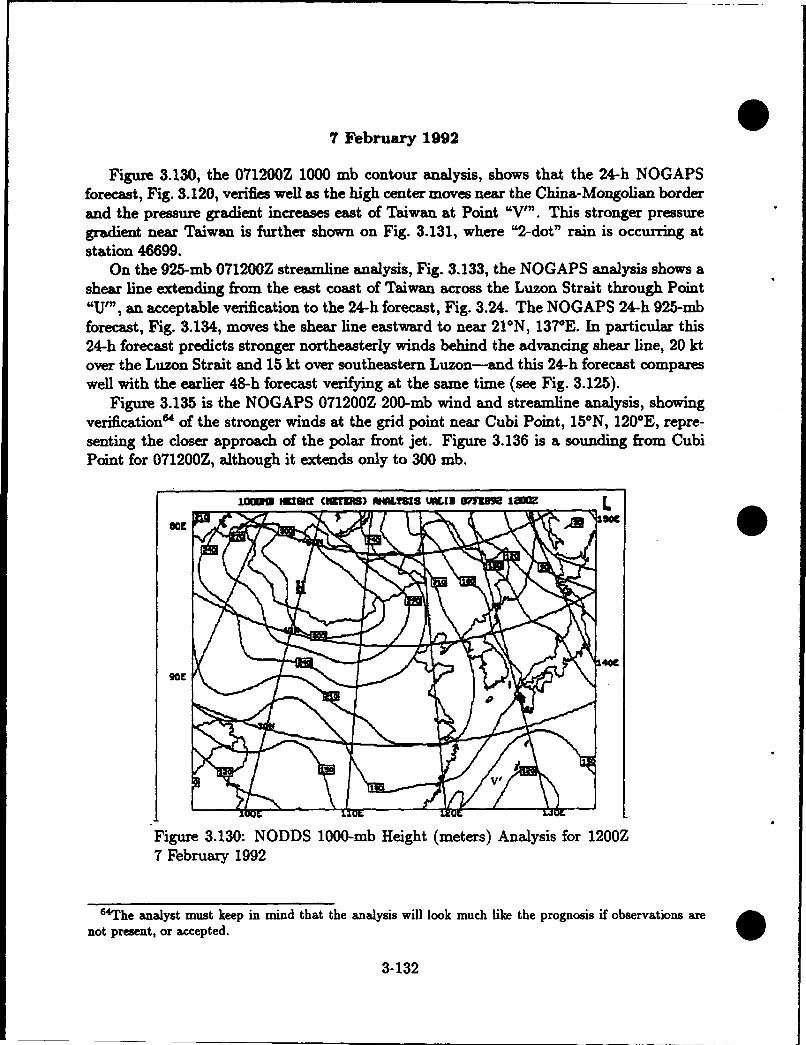
7 February 1992
Figure 3.130, the 071200Z 1000 mb contour analysis, shows that the 24-h NOGAPSforecast, Fig. 3.120, verifies well as the high center moves near the China-Mongolian borderand the pressure gradient increases east of Taiwan at Point "Vr'. This stronger pressuregradient near Taiwan is further shown on Fig. 3.131, where "2-dot" rain is occurring atstation 46699.
On the 925-mb 071200Z streamline analysis, Fig. 3.133, the NOGAPS analysis shows ashear line extending from the east coast of Taiwan across the Luzon Strait through Point"Ut'", an acceptable verification to the 24-h forecast, Fig. 3.24. The NOGAPS 24-h 925-mbforecast, Fig. 3.134, moves the shear line eastward to near 21°N, 137°E. In particular this24-h forecast predicts stronger northeasterly winds behind the advancing shear line, 20 ktover the Luzon Strait and 15 kt over southeastern Luzon-and this 24-h forecast compareswell with the earlier 48-h forecast verifying at the same time (see Fig. 3.125).
Figure 3.135 is the NOGAPS 071200Z 200-mb wind and streamline analysis, showingverification" of the stronger winds at the grid point near Cubi Point, 15°N, 120°E, repre-senting the closer approach of the polar front jet. Figure 3.136 is a sounding from CubiPoint for 071200Z, although it extends only to 300 mb.
10" MEac ClIUmT) --MIS UIN Wflm, low L
90e
Figure 3.130: NODDS 1000-mb Height (meters) Analysis for 1200Z7 February 1992
"The analyst must keep in mind that the analysis will look much like the prognosis if observations arenot present, or accepted.
3-132
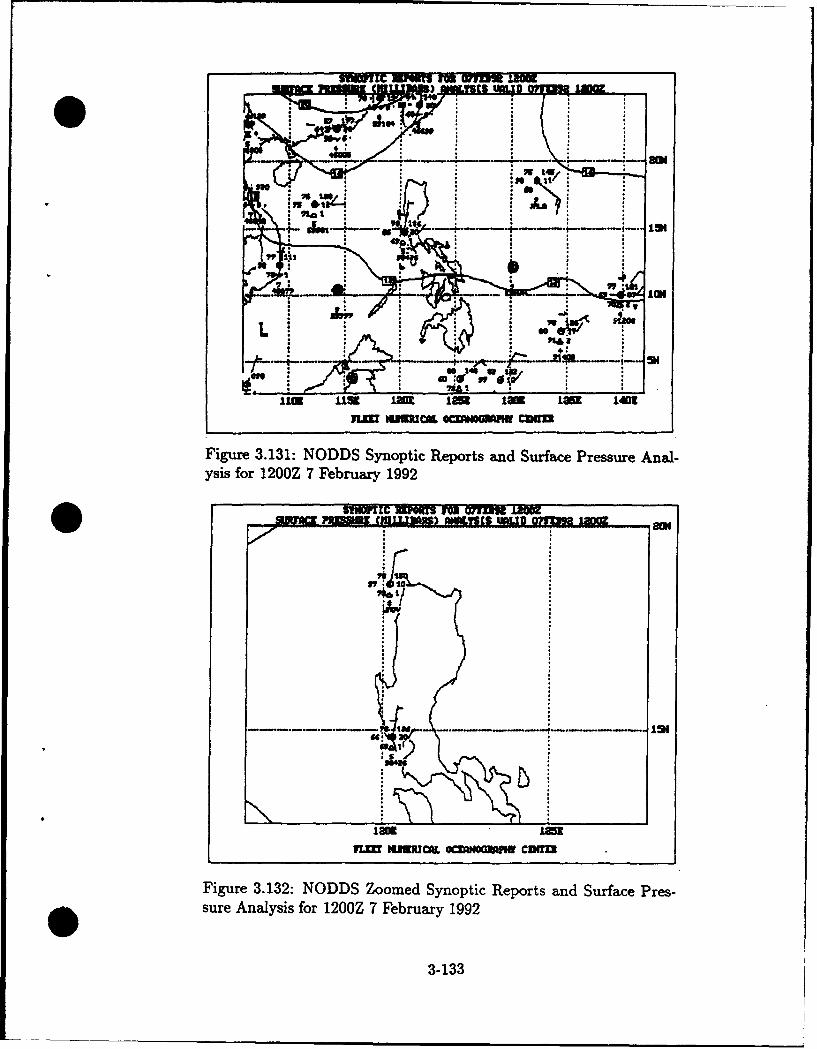
S-SnotIC Repo rt anurfM a
ysis fois=Z7Fbuay19
I It
*lo-
9.. .134•-- ••4----- • - -.-- -- •.:
1100 US1M = i L 4
7L: QUlW 0 H G M D
Figure 3.131: NODDS Synoptic Reports and Surface Pressure Anal-ysis for 1200Z 7 February 1992
3-133
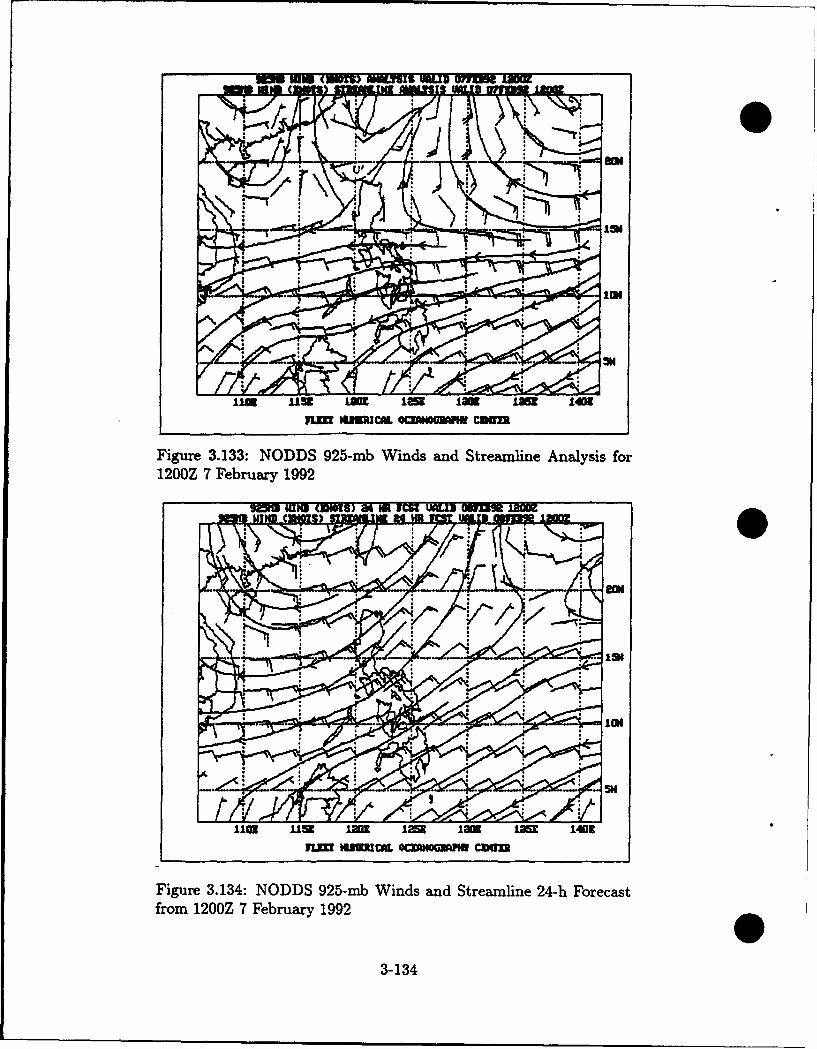
- Elm (DUS) UYIRM MULD MM51 11M
ll1 11s Lou1 im im Law 1408n= sImmzLc. .omvimw cain
Figure 3.133: NODDS 925-mb Winds and Streamline Analysis for1200Z 7 February 1992
VOIN PIR cORs) 34 N IMr? uONI U 1
S• 1.
1102 11 11M la 190 L51 1401SnllllmP 1u3R r. c•ow caurJu
Figure 3.134: NODDS 925-mb Winds and Streamline 24-h Forecastfrom 1200Z 7 February 1992
3-134
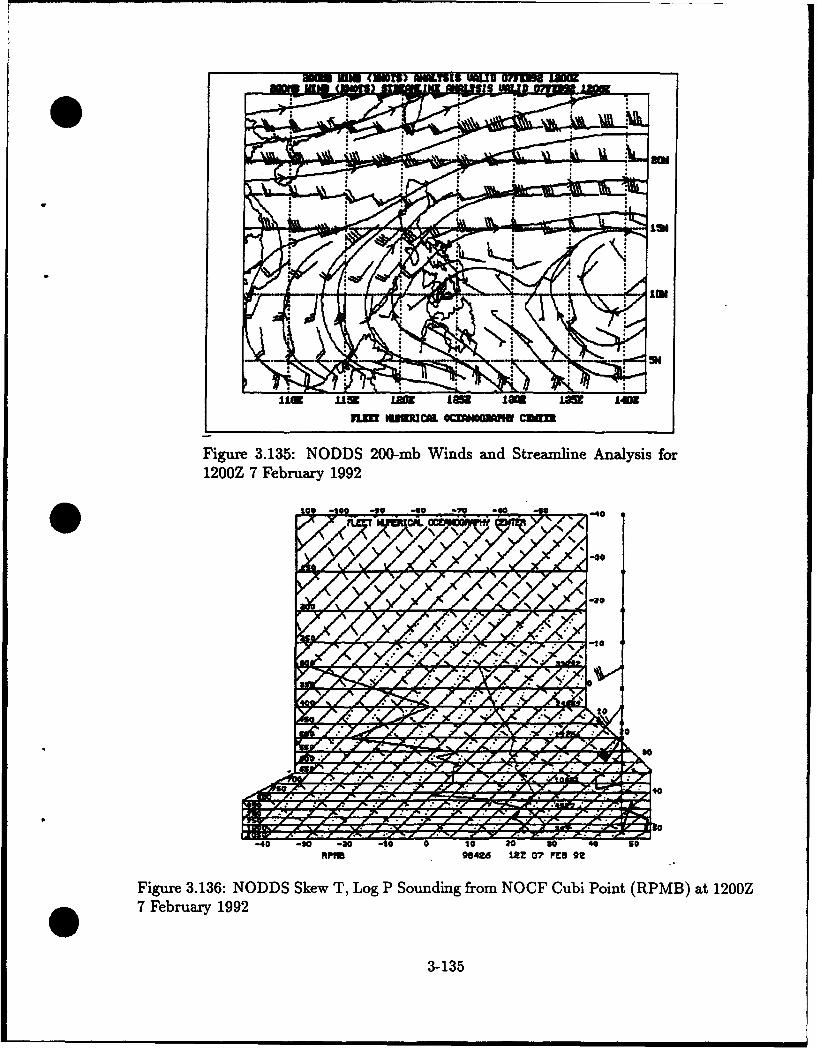
nUoKI (3mT) UN3IS 'MUD MM 12 M~
-4 10 0 1 -1M 0a I 0 law M 140 85
~~Figure 3.136 : NODDS Skewm WiLg ondin from NStFeCubin Poyint forPM)a 2
0 7 February 1992
100 100 to .3-135-4
,~~ X. yx •
Y" Z. 'VJ1I ,J en:0.- X Z e t -1. .7 -!,'ý1
4C -. ; -11
IQI.IU~ ~~I AUI al• CR'3
~~Figure 3.136 : NODDS Skewm TLgPWoninds from Streamlin Pontlsi forP)a 210Z7 February 1992
..-135

Figure 3.137 shows the 071400Z NODDS DMSP IR imagery. Compare the cloud topsnow covering Taiwan with those in Fig. 3.115. That is, the current IR imagery over Taiwan(Fig. 3.137) is much lighter, indicating colder, higher cloud tops than on 6 February. Theimagery therefore supports the premise that Taiwan lies on the cold side of the shear line(front), and this is supported with the rain reported over eastern Taiwan on the surfacechart in Fig. 3.131. The 071200Z sounding" from Taipei (RCTP, 58968), Fig. 3.138, givesfurther support showing the classic saturated stable frontal inversion from 850-700 mb.
Figure 3.137: NODDS Mosaic of DMSP IR Imagery for 1400Z on 7 February 1992
651t appears that da~ only for the rnandatory levels was received on the Taipei sounding.
3-136
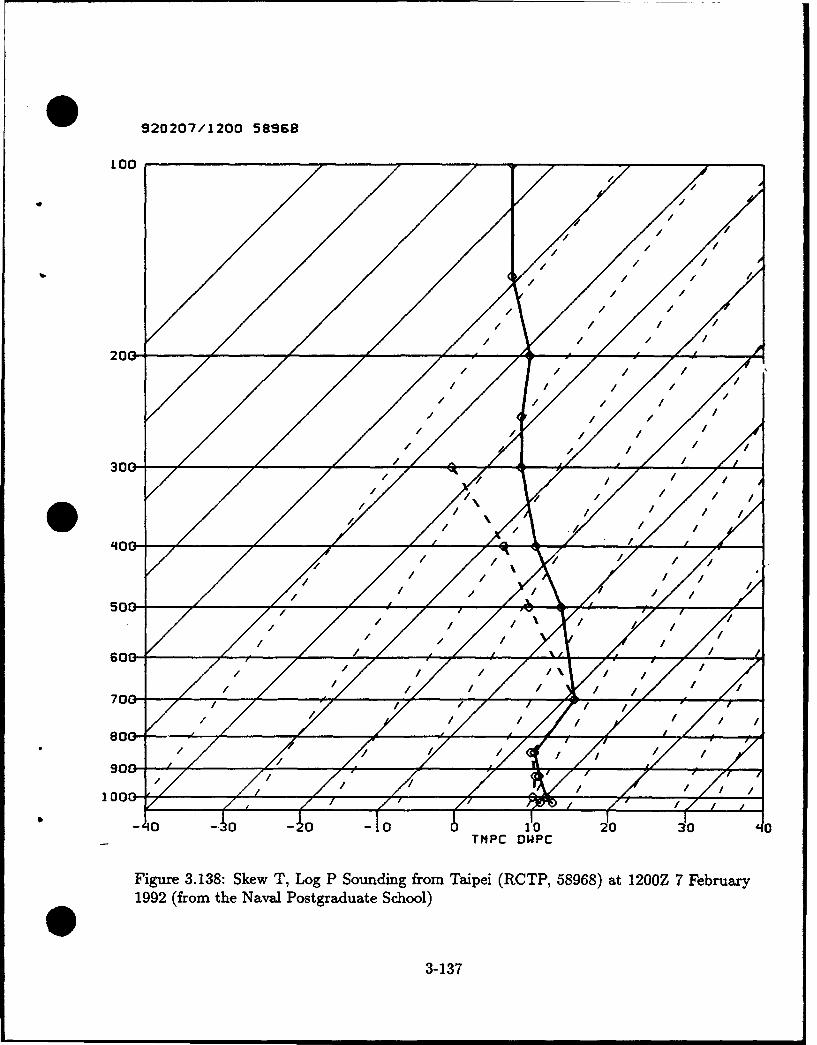
0 920207/1200 58968
100
// ,//
//
/
200-/
/ /
/
/ i // /
300- •//
700- /
/ / / // /500- -
I / \ , /
900-/// / //
-0 -o-0 -10 1o 20 30J4TIIPC D&JPC
Figure 3.138: Skew T, Log P Sounding from Taipei (RCTP, 58968) at 1200Z 7 February1992 (from the Naval Postgraduate School)
03O--
fi//3-137
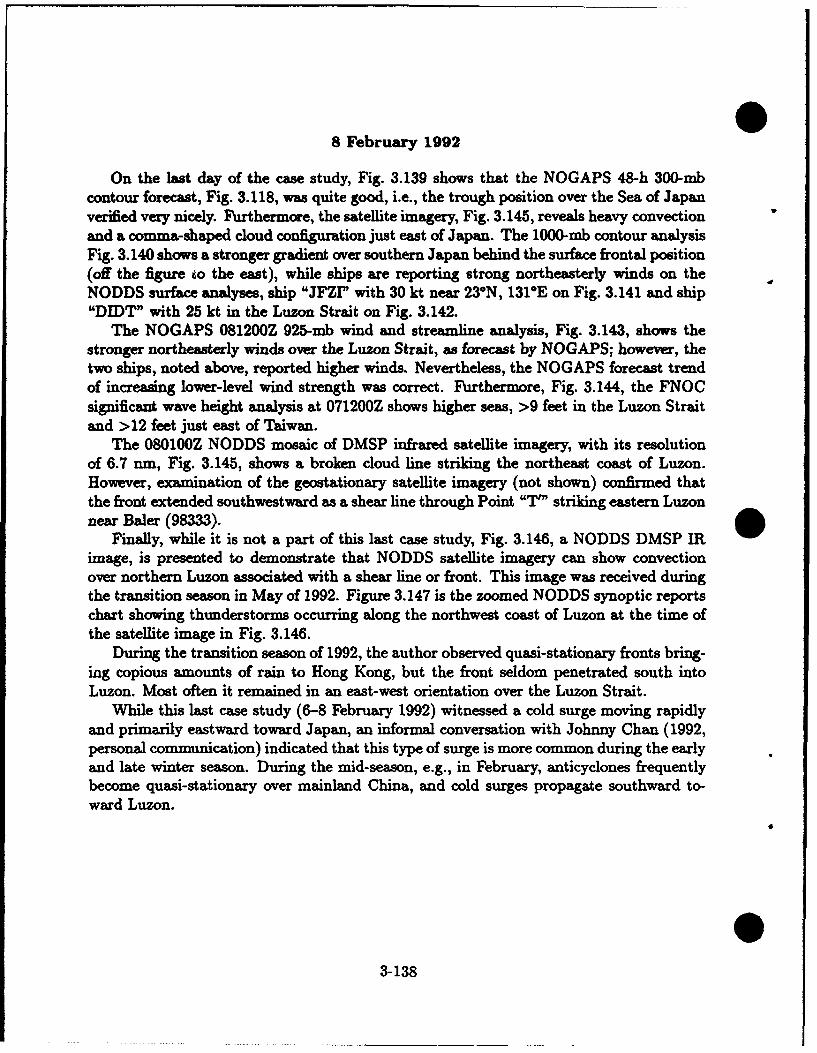
8 February 1992
On the last day of the case study, Fig. 3.139 shows that the NOGAPS 48-h 300-mbcontour forecast, Fig. 3.118, was quite good, i.e., the trough position over the Sea of Japanverified very nicely. Furthermore, the satellite imagery, Fig. 3.145, reveals heavy convectionand a comma-shaped cloud configuration just east of Japan. The 1000-mb contour analysisFig. 3.140 shows a stronger gradient over southern Japan behind the surface frontal position(off the figure 6o the east), while ships are reporting strong northeasterly winds on theNODDS surface analyses, ship "JFZI" with 30 kt near 23°N, 131°E on Fig. 3.141 and ship"DIDT" with 25 kt in the Luzon Strait on Fig. 3.142.
The NOGAPS 081200Z 925-mb wind and streamline analysis, Fig. 3.143, shows thestronger northeasterly winds over the Luzon Strait, as forecast by NOGAPS; however, thetwo ships, noted above, reported higher winds. Nevertheless, the NOGAPS forecast trendof increasing lower-level wind strength was correct. Furthermore, Fig. 3.144, the FNOCsignificant wave height analysis at 071200Z shows higher seas, >9 feet in the Luzon Straitand >12 feet just east of Taiwan.
The 080100Z NODDS mosaic of DMSP infrared satellite imagery, with its resolutionof 6.7 nm, Fig. 3.145, shows a broken cloud line striking the northeast coast of Luzon.However, examination of the geostationary satellite imagery (not shown) confirmed thatthe front extended southwestward as a shear line through Point "T'" striking eastern Luzonnear Baler (98333).
Finally, while it is not a part of this last case study, Fig. 3.146, a NODDS DMSP IRimage, is presented to demonstrate that NODDS satellite imagery can show convectionover northern Luzon associated with a shear line or front. This image was received duringthe transition season in May of 1992. Figure 3.147 is the zoomed NODDS synoptic reportschart showing thunderstorms occurring along the northwest coast of Luzon at the time ofthe satellite image in Fig. 3.146.
During the transition season of 1992, the author observed quasi-stationary fronts bring-ing copious amounts of rain to Hong Kong, but the front seldom penetrated south intoLuzon. Most often it remained in an east-west orientation over the Luzon Strait.
While this last case study (6-8 February 1992) witnessed a cold surge moving rapidlyand primarily eastward toward Japan, an informal conversation with Johnny Chan (1992,personal communication) indicated that this type of surge is more common during the earlyand late winter season. During the mid-season, e.g., in February, anticyclones frequentlybecome quasi-stationary over mainland China, and cold surges propagate southward to-ward Luzon.
31
3-138
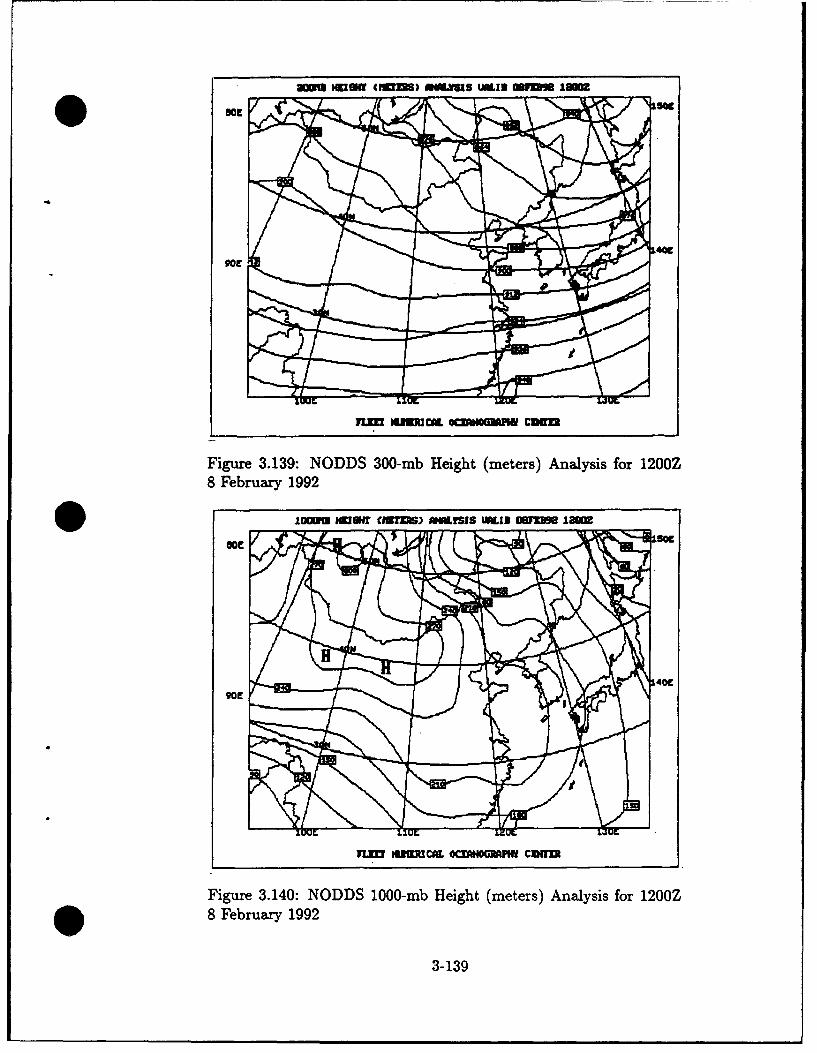
Fig urWe (3MUM) Hvigs Lme ters 1A yso 0
'44
= M111C•. OCMOM Clretn
Figure 3.139: NODDS 300-mb Height (meters) Analysis for 1200Z8 February 1992
ME MNaga CIRUM) MISJS MLIB O M 1-001
Irn MUiiMICAi OCLhIOGYMFI CMUU
Figure 3.140: NODDS 1000-mb Height (meters) Analysis for 1200Z8 February 1992
3-139
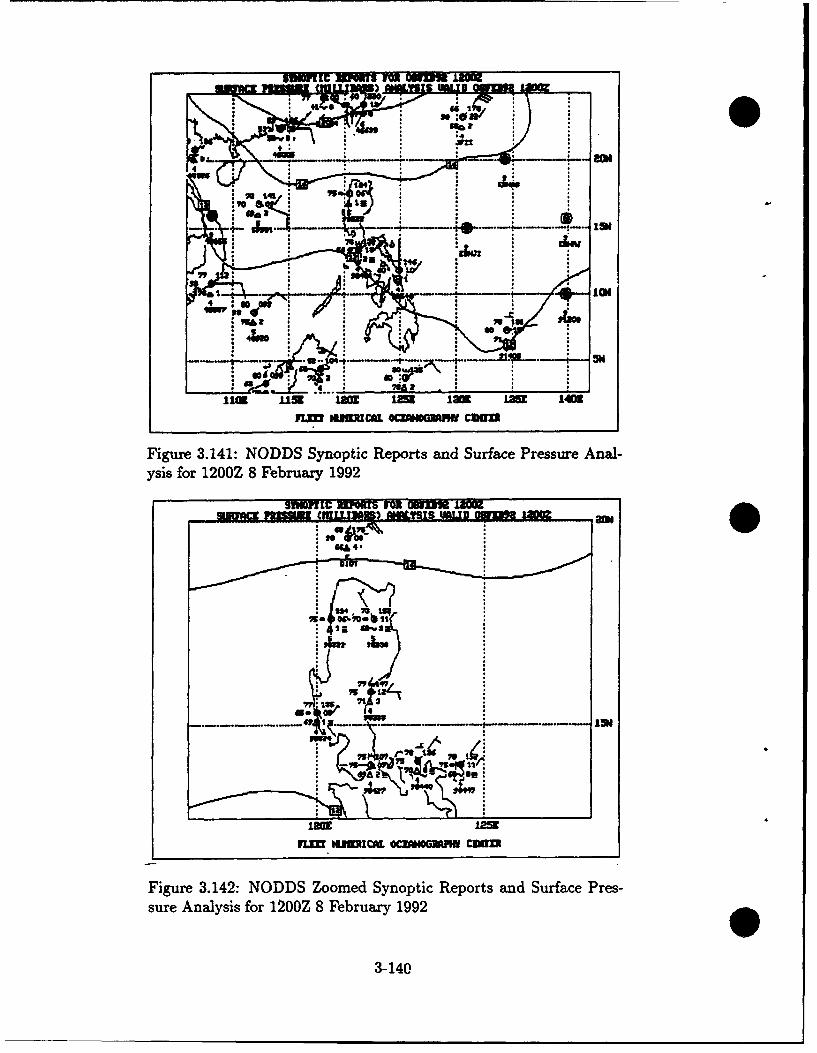
: a°a••
.- a
llU IIUL tU Ia 12511 1401rIW NIII C*L •UOU~ff CDUr
Figure 3.141: NODDS Synaptic Reports and Surface Pressure Anal-ysis for 1200Z 8 February 1992
U.r 4,P
4201
n= LWIMK!CAL OCZAMNONW cumf
Figure 3.142: NODDS Zoomed Synoptic Reports and Surface Pres-sure Analysis for 1200Z 8 February 1992
3-140
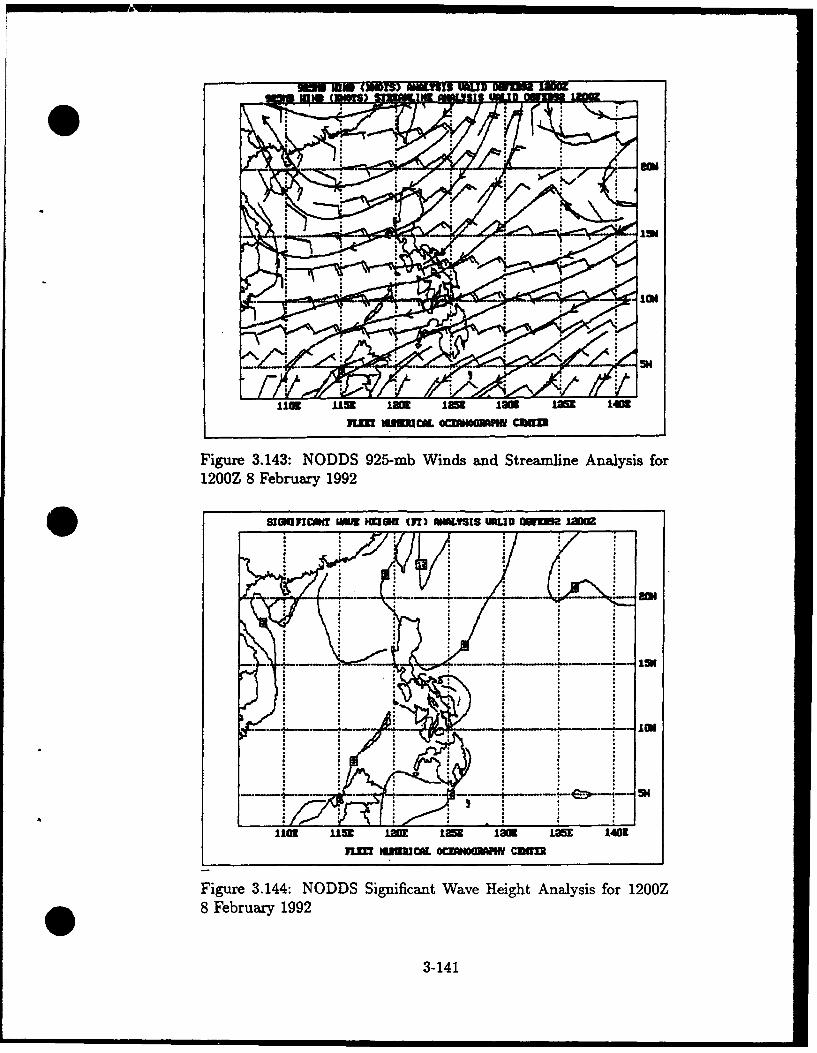
DE(MUSM NWIsI MUD laf m in
rim Us I= I= lam I= I
Figure 3.143: NODDS 925-mb Winds and Streamline Analysis for1200Z 8 February 1992
......I T wigU -- = ff (FI) *""YSIS -- LID oUS' U Mw-=-
- - : II
111m use Lam 125 1M LOSE 14019
vim muomcA oczvompm cairn
Figure 3.144: NODDS Significant Wave Height Analysis for 120oZ8 February 1992
3-141
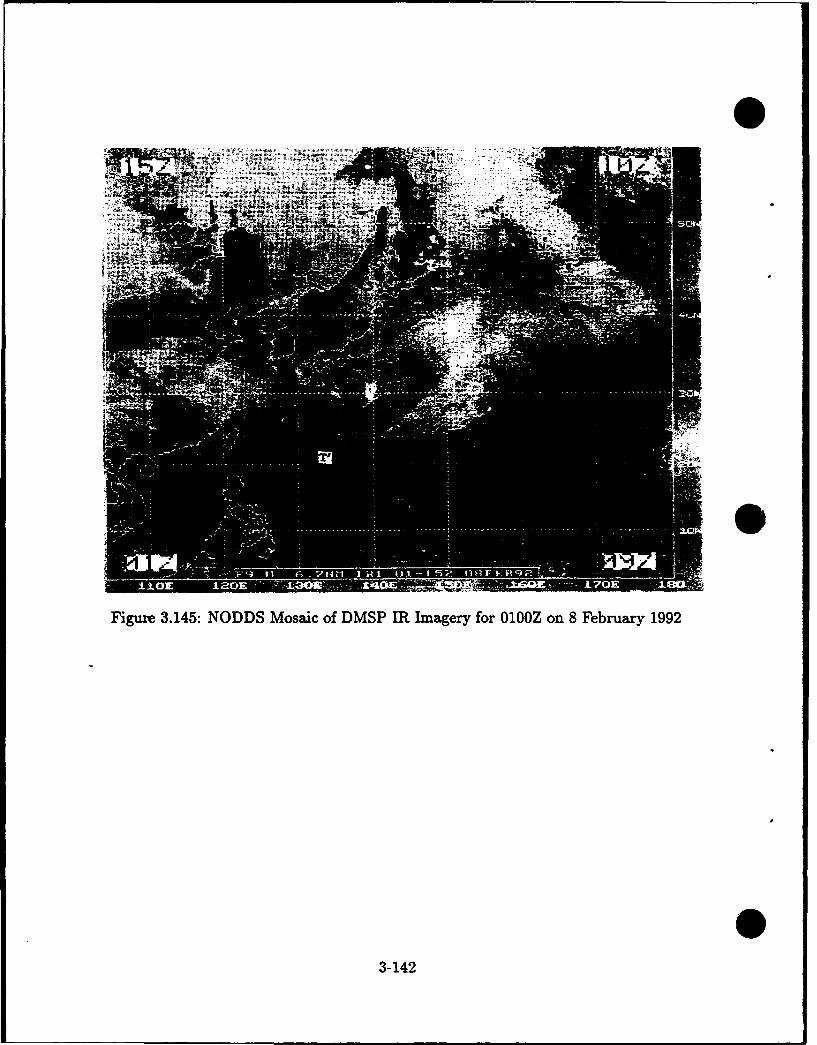
0
Figure 3.145: NODDS Mosaic of DMSP IR Imagery for 0100Z on 8 February 1992
03-142

Figure 3.146: NODDS Mosaic of DMSP I, Imagery for 1200Z on 19 May 1992
SY!NIOZC RIPOATS OR ItM92 ±iEMs=WcE PIESSRM Cf ¢I•s. ) ANALYSIS uLID IimMa 12-o
JFzu
n]muu iJltcaL. Oc~u4o6umw cnun3
Figure 3.147: NODDS Zoomed Synoptic Reports and Surface Pres-sure Analysis for 1200Z 19 May 1992
3-143
3.5.6 Lessons Learned while preparing Case Studies
The following impressions were noted by the author during 2 years of nearly continuousmonitoring of the tropical analyses and prognoses in the vicinity of the Philippine Islandsby FNOC's NOGAPS model. Comments are also made concerning the use of NODDS asa means of receiving the products of the Navy's NOGAPS 3.3 model.
"* The Navy's atmospheric analysis and prediction model in the tropics (FNOC's NOGAPS3.3 operational since January 1992) has continued to improve, since the introductionof the first NOGAPS model in 1982, and its "upgrading" to a spectral model in 1988.
"* The NODDS delivery system offers a wide variety of atmospheric, oceanographic,and acoustic products, including the transmission of mosaic DMSP visible and IRimagery since activation of NODDS 3.0 in October 1991.
"* Of particular interest to tropical analysts:
1. The surface pressure analysis and synoptic reports, with the zoom capability,provide excellent graphics for apprising synoptic-scale tropical sea-level pressurein the vicinity of the Philippine Islands.
2. The 925-mb wind barb and streamline analyses and prognoses provide accept-able gradient level coverage. (The NOGAPS model is not expected to ade-quately describe mesoscale features such as the wind magnitudes at the radiusof maximum winds-accomplished by no operational model as yet, to the knowl-edge of the author.)
3. While the automated insertion of bogus soundings (from sea level to 400 mb)in the vicinity of tropical cyclones generally locates the 925-mb vortex center atthe JTWC warning position, there are instances when only a trough-vice a lowcenter-is analyzed by NOGAPS, at the position of the TC warning. Obviously,in these instances, the bogus soundings did not "get into" the analyses.
4. Unlike the 925-mb streamlines, the NOGAPS 200-mb analysis in the vicinityof tropical cyclones and typhoons is unsatisfactory to the tropical analysis-necessitating that hand analysis be accomplished, such as that performed twicedaily at JTWC. That is, upper-level (200-mb) anticyclonic outflow above atyphoon was never observed by the author during the two-year study. Evenassuming that an intense typhoon might dictate cyclonic rotation still existingat 200 mb, that circulation was missing. Additionally, cells in the TUTT wereoften missing. The NOGAPS analysis typically placed only one large (low-height) cell within the TUTT, while hand analysis, using the geostationarycloud-vector winds and AIREPS, often identified multiple low cells in the sameTUTT.
5. While one case study confirmed the ability of the NOGAPS model to forecastthe formation of a tropical cyclone circulation-where only a trough existed
3-144
at the time of the analysis-, there are instances when the initial (or early)NOGAPS forecast of movement of a tropical cyclone is very erratic. Thereare also many cases in which NOGAPS predicts the development of tropicalcyclones that in fact do not develop.
6. The case studies of Typhoons Eli and Bobbie demonstrated the capability ofJTWC to accurately forecast tropical cyclone movement, for both a "straight-mover" and a "recurver." However, as presented in the most current AnnualTropical Cyclone Report, and should be known by tropical forecasters, the un-predictable movement of "loopers", etc. produced the following mean tropicalcyclone forecast errors in the Northwest Pacific during 1991: 96 nm (24-h),185 nm (48-h), and 287 nm (72-h) (JTWC 1992).
7. Forecasters should anticipate erratic movement of tropical cyclones toward thenortheast when (1) the monsoon trough becomes oriented on a NE-SW anoma-lous axis (Lander 1990, personal communication) or (2) when mid-troposphericsteering is dominated by a surge in the southwest monsoon (Guard 1985).
9 In the last presented case study, the NOGAPS model was shown to have the capabil-ity of forecasting a northeastern monsoon cold surge. That is, the NOGAPS modelforecasted a surge emanating from near Lake Baikal in the Russian Republic, result-ing in shear lines with stronger northeasterly surface winds over the Luzon Straitand the island of Luzon, 48 hours later. However, a more complete study of a largesample should be performed.
* Regarding the use of NODDS 3.0:
1. NODDS users must take care to specify wave and swell heights in the NODDSstation model menu. Otherwise, the observations of sea height, sea surfacetemperature, etc., although received in the "down-loaded" message, will not beplotted.
2. Until subsequent NODDS upgrade3 are activated, users can only down-load thecurrent OOOOZ or 1200Z run, i.e., the NODDS delivery system is designed toprovide operational analysis and prognosis to DoD users. It is not designed asan archival source, unless the user is prepared to down-load runs during thenight-such as performed by the author.
3. The NODDS graphics of the JTWC tropical cyclone warnings were both infor-mative for real time use and provided excellent "no effort" plots for use in thetyphoon case studies.
4. While the NODDS DMSP visible and IR imagery is available-although delayedand in a resolution of only 6.7 nm-, the study showed that NODDS satelliteimagery was useful in depicting areas of convection associated with tropicalcyclones and shear lines near the Philippine Islands.
3-145

4. GEOLOGICAL STRUCTURE &PHYSICAL OCEANOGRAPHY
4.1 Geological Structure
Introduction. The Philippine Islands are situated along the western margin of the tropicalNorth Pacific Ocean, between 60 and 18* North Latitude (see Fig. 4.1). This island chain isone of several island arcs within the western North Pacific Ocean and around its perimeter.
L)UZON
PHILIPPINE SEA
SOUTH CHINA SEA MN 0
MINDORO >ALA
VISAMAPAN~AY~
toPALAWAN V
SULU SEA MINDANAO
CELEBES SEA __
Figure 4.1: Map of the Philippines.
04-1
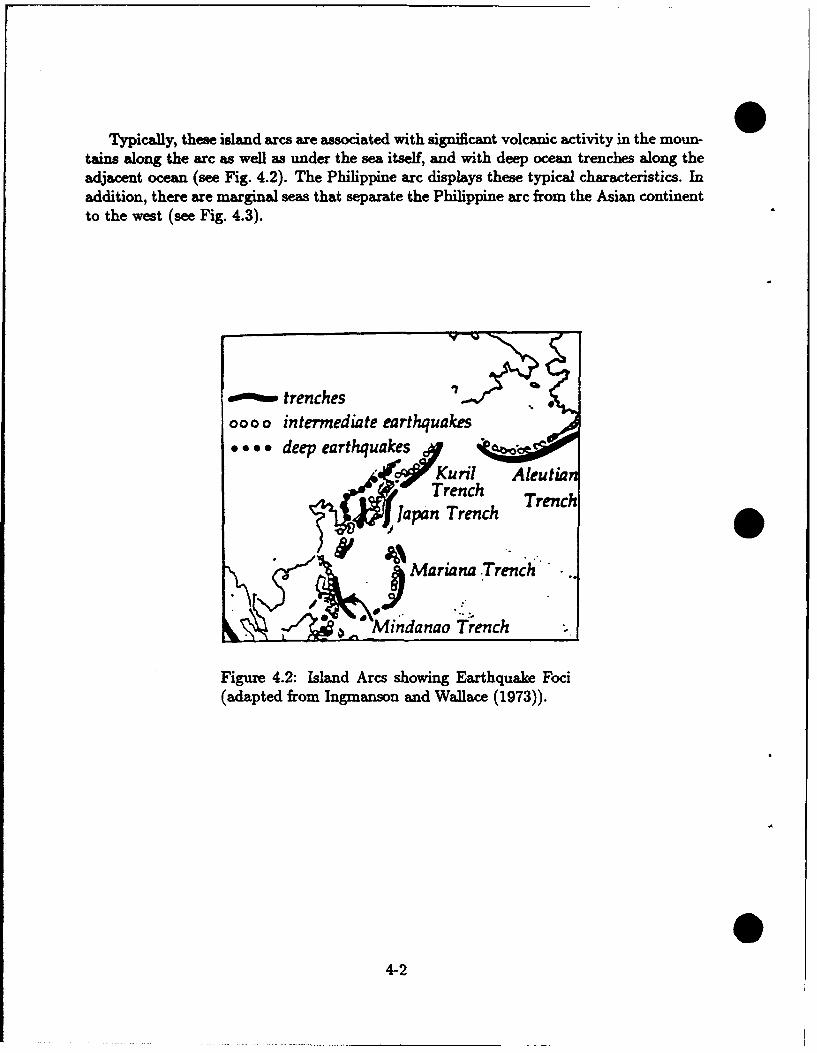
0Typically, these island arcs are associated with significant volcanic activity in the moun-
tains along the arc as well as under the sea itself, and with deep ocean trenches along theadjacent ocean (see Fig. 4.2). The Philippine arc displays these typical characteristics. Inaddition, there are marginal seas that separate the Philippine arc from the Asian continentto the west (see Fig. 4.3).
m trenchesoooo intermediate earthquakes
deep earthquakes
Kuril, AleutiaTrench Trench
Japan Trench T
Mariana .Trench
'1 Wz\*ndanao Trench
Figure 4.2: Island Arcs showing Earthquake Foci(adapted from Ingmanson and Wallace (1973)).
44-2

Japan Basin .
'I
Ryukyu Bonin ZoneTrough y
South China ASea Parece Vela Basin
.- West TuPhilippine' Mariana Trough
Sulu Basin 4
Basin ~
y
' " Celebes
D Basin Bismarck Basin
'Ch
-'---. Trench \Coral
"Active marginal basin Basin
Inactive marginal basin with high heat flow
'-J Inactive marginal basin with normal heat flow
Figure 4.3: Distribution of Marginal Basins in the WesternPacific (adapted from Eicher and McAlester (1980)).
This arc/trench/marginal sea structure has developed in response to geological forcesoperating within the earth's crust and upper mantle underneath this region; those forcesappear to have influenced this region throughout its geological history, continuing into thepresent. Geologists believe this region has been subject to an unusually large number ofsuch forces.
4-3
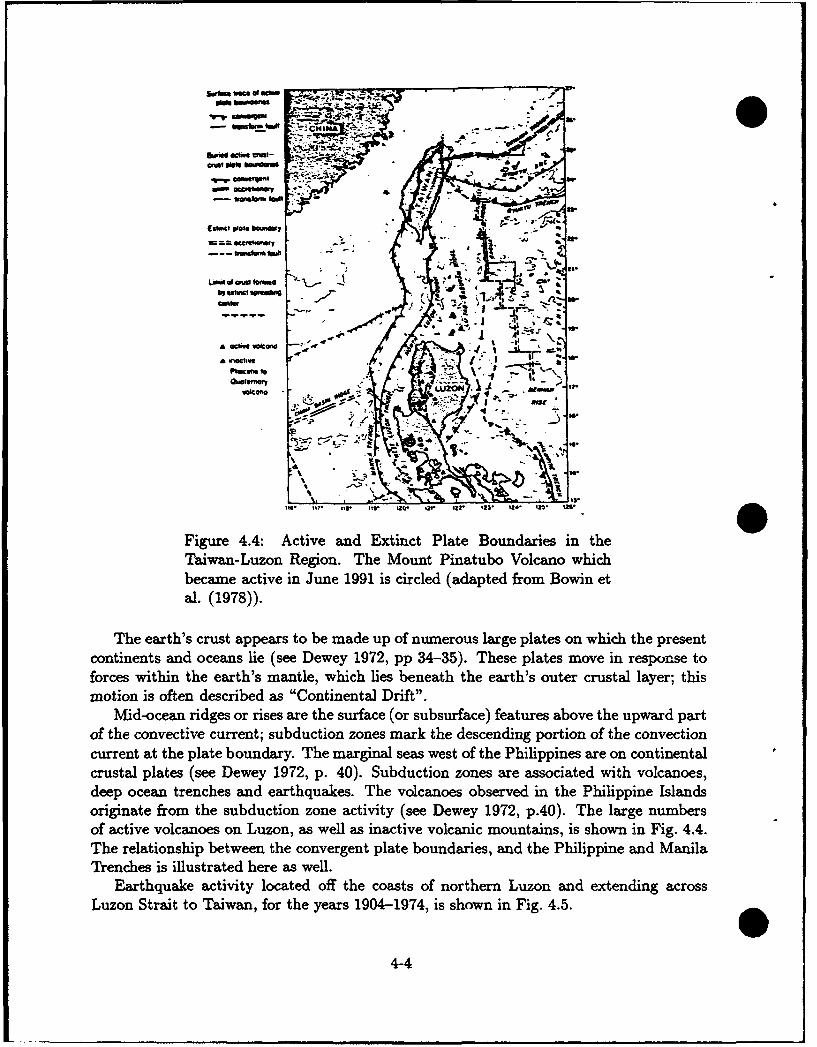
N. e4. -4 -,
-~al Si m Ibil d .-
.0-u.ata'.,- . ,. - .. ._.
I ".. 1-", -. -.b whuidaftdmi *W
:.z 7 .-I -"F Zigue44: Active an xtnt lteBunaie n h
£6eciame acieinJn 19 s.ice (aape fro:Bwi
==Oucolsrory -
as
Figurie 4.4:" AcieadEtntPat4onaisi h
al. (1978)).
The earth's crust appears to be made up of numerous large plates on which the present
continents and oceans Lie (see Dewey 1972, pp 34-35). These plates move in response toforces within the earth's mantle, which lies beneath the earth's outer crustal layer; thismotion is often described as "Continental Drift".
Mid-ocean ridges or rises are the surface (or subsurface) features above the upward partof the convective current; subduction zones mark the descending portion of the convectioncurrent at the plate boundary. The marginal seas west of the Philippines are on continentalcrustal plates (see Dewey 1972, p. 40). Subduction zones are associated with volcanoes,deep ocean trenches and earthquakes. The volcanoes observed in the Philippine Islandsoriginate from the subduction zone activity (see Dewey 1972, p.40). The large numbersof active volcanoes on Luzon, as well as inactive volcanic mountains, is shown in Fig. 4.4.The relationship between the convergent plate boundaries, and the Philippine and Manila
Trenches is illustrated here as well.Earthquake activity located off the coasts of northern Luzon and extending across
Luzon Strait to Taiwan, for the years 1904-1974, is shown in Fig. 4.5.
4-4
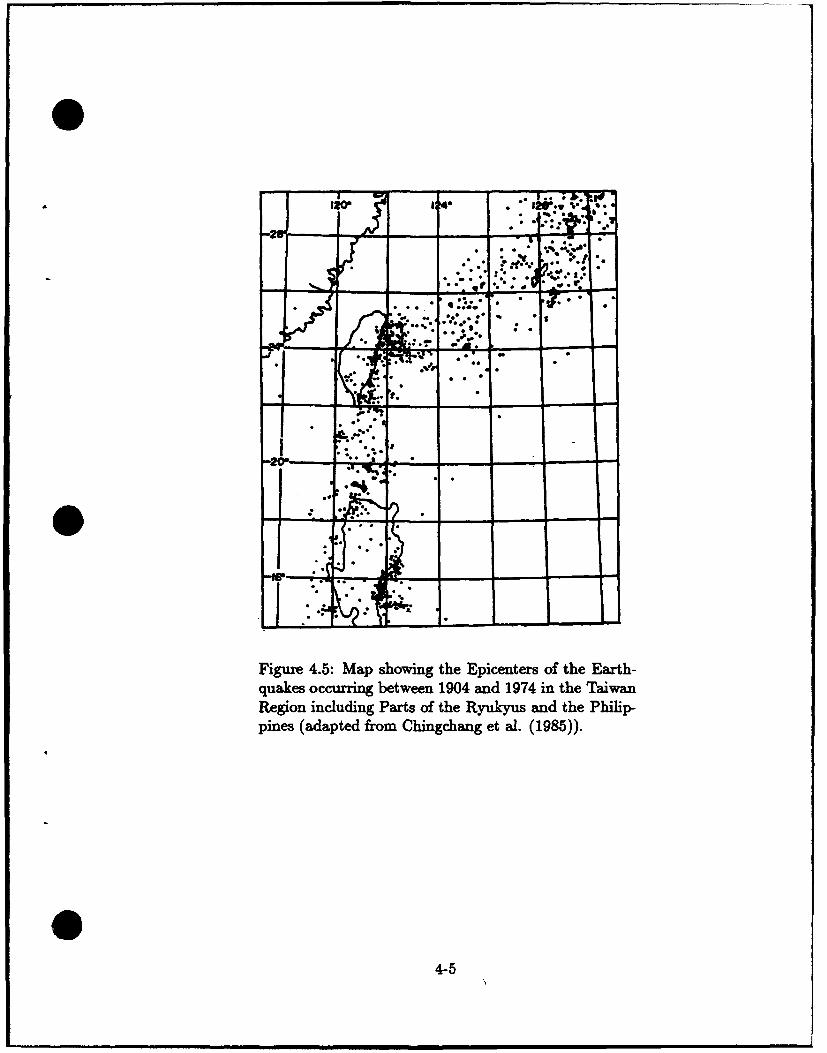
~ ~~, ! °,;t
Fiur 4.5 Map shoin th pcetr oh.Erh
I * * a '9 m* . S
2"- - - -'-V
,, ~.-. -*. . . ~...- ... ;. -. - VJ "
qae ocurin bewe 94 n 94inteTia
Regio icungParts of thle Ryku an h•Pii>
m~t; ,* e S... .. 0% .; • * *
f . . (1-5-4-5- .
-20".- n"- -,
I.
- -
Figure 4.5: Map showing the Epicenters of the Earth-quakes occurring between 1904 and 1974 in the TaiwanRegion including Parts of the Ryuyu and the Philip-pines (adapted from Chingchang et al. (1985)).
04-5
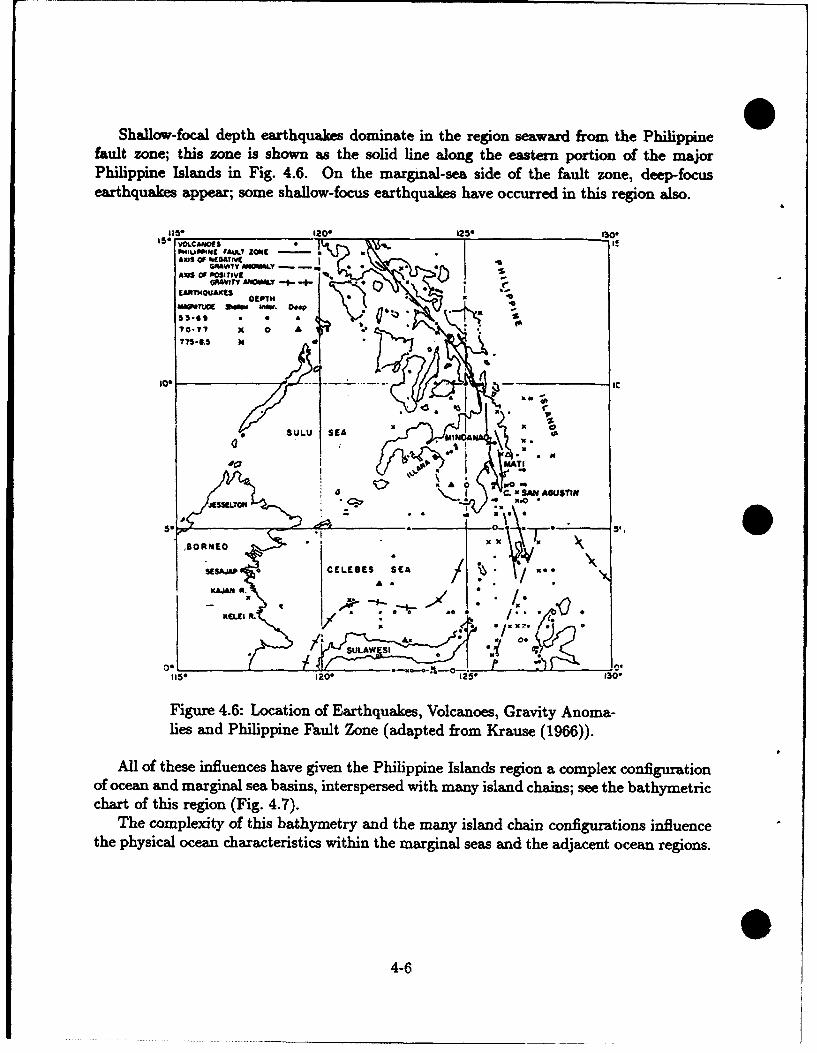
0Shallow-focal depth earthquakes dominate in the region seaward from the Philippine
fault zone; this zone is shown as the solid line along the eastern portion of the majorPhilippine Islands in Fig. 4.6. On the marginal-sea side of the fault zone, deep-focusearthquakes appear; some shallow-focus earthquakes have occurred in this region also.
115° i*_Oe 1200 125 0*VOCAWS Oi1S!wuPHIU glO a. 141 -M ZON I
AXIS V11AT1V &NItGRAVITIy ANGMiI.Y - -• *• 3
AXiS 0 PosrlIVE0AVIT" A -IM - -I- *
EAATNOUAICIsu EPT"1)-el .
70-?7 X 0 .
Ice ~IC
/. SULU SEA MI ftd
a C. X StA AGUSTIN
BO0RN EO
X
A.
0It,5" 120. "0 130,
Figure 4.6: Location of Earthquakes, Volcanoes, Gravity Anoma-lies and Philippine Fault Zone (adapted from Krause (1966)).
All of these influences have given the Philippine Islands region a complex configurationof ocean and marginal sea basins, interspersed with many island chains; see the bathymetricchart of this region (Fig. 4.7).
The complexity of this bathymetry and the many island chain configurations influencethe physical ocean characteristics within the marginal seas and the adjacent ocean regions.
04-6
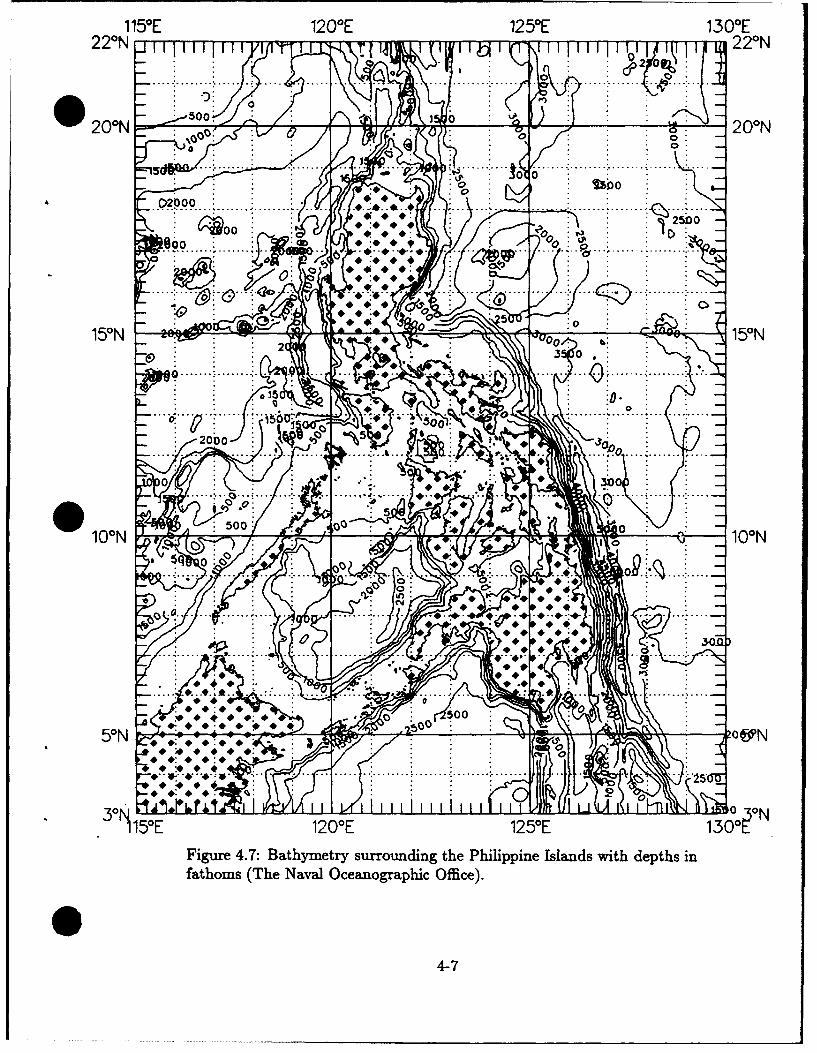
115 0E 120 0E 125 0E 1300E
Y TI2 14 N6 220N
..... .. .. ....o ........ ..... ..,.. .... ..: ... ... . . ... ........ ....... : ..o.. •
~. ...... ..... ...... ....
.. .. .. . .. .. .. .. . .. .. 1 ý .. .. .... ....! ..... . .i . .. -
00
.... . ...... .... .. .. ... ..•.. . ...., .. ..... ......
500
.........
0 5
2 000
3 0
0 ........... •... ............ /
1005
......... ... .. .. . .... ... .....,.
50N •':**.'"'- • •0'[N
05 0E 120%E 125°E 13 0 E
Figure 4.7: Bathymetry surrounding the Philippine Islands with depths infathoms (The Naval Oceanographic Office).
4
A
34-7
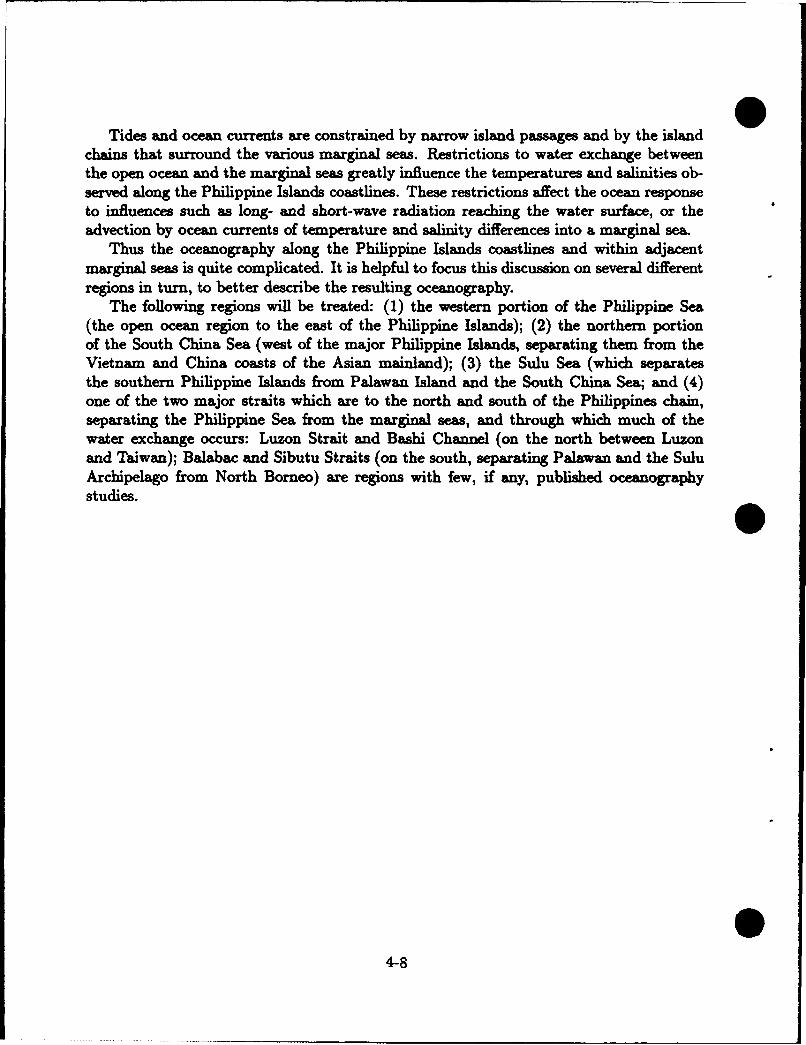
Tides and ocean currents are constrained by narrow island passages and by the islandchains that surround the various marginal seas. Restrictions to water exchange betweenthe open ocean and the marginal seas greatly influence the temperatures and salinities ob-served along the Philippine Islands coastlines. These restrictions affect the ocean responseto influences such as long- and short-wave radiation reaching the water surface, or theadvection by ocean currents of temperature and salinity differences into a marginal sea.
Thus the oceanography along the Philippine Islands coastlines and within adjacentmarginal seas is quite complicated. It is helpful to focus this discussion on several differentregions in turn, to better describe the resulting oceanography.
The following regions will be treated: (1) the western portion of the Philippine Sea(the open ocean region to the east of the Philippine Islands); (2) the northern portionof the South China Sea (west of the major Philippine Islands, separating them from theVietnam and China coasts of the Asian mainland); (3) the Sulu Sea (which separatesthe southern Philippine Islands from Palawan Island and the South China Sea; and (4)one of the two major straits which are to the north and south of the Philippines chain,separating the Philippine Sea from the marginal seas, and through which much of thewater exchange occurs: Luzon Strait and Bashi Channel (on the north between Luzonand Taiwan); Balabac and Sibutu Straits (on the south, separating Palawan and the SuluArchipelago from North Borneo) are regions with few, if any, published oceanographystudies.
4-8

04.2 Ocean Parameters
4.2.1 Introduction
The following is a description of ocean factors which can affect weather occurring in thePhilippines and the adjacent ocean areas.
1. Some ocean factors directly affect the overlying atmosphere:
(a) Sea surface temperature provides a modifying influence on the atmosphere above,so that air temperatures that differ initially from those on the ocean surface be-neath are quickly modified, through radiative and sensible heat exchange acrossthe air/sea boundary, toward the more slowly-changing temperatures of theocean water surface. In the tropical latitudes of the Philippines, the sea surfaceremains warm, varying relatively little throughout the year.
(b) Moisture is also provided to the air by the sea surface, so the warm air canbecome saturated with substantial amounts of water vapor in layers adjacentto the surface.
2. Ocean factors that contribute indirectly to the atmospheric weather above include:
(a) Ocean Currents which act to advect ocean water into a region; this advectedwater tends to retain the temperature and salinity of the source region, althoughthese may be modified somewhat as the water moves along into another region.
(b) The Vertical Distribution of Temperature and Salinity in the near-surface oceanlayers affect the exchange of heat across the ocean surface; that heat exchange,in turn, helps determine the convective characteL and vertical stability of theoverlying atmosphere.
3. Several ocean factors may influence naval operations in an area:
(a) Nearshore Bathymetry affects tides, tidal currents, acoustic propagation (reflec-tion, absorption and scattering of underwater sound), and determines shorelineaccessibility.
(b) Coastal Type and Configuration can also limit access for particular types ofnaval vessels and operations.
(c) Wvs
(d) Tide.(e) Internal Waves may affect both surface and subsurface operations.
(f) Bottom Sediment Type and Character influence the performance of submarinedetection systems.
(g) Underwater Visibility affects nearshore diving and photography operations.
4-9
4.2.2 Ocean Parameters by Region 0A. Western Philippine Sea (open ocean to the east of the Philippine Islands)
This region is more subject to influences from remote ocean areas than the other regionsto be discussed later.
1. Ocean Circulation Patterns here are determined by forces acting on tht ")road NorthPacific Ocean. As the North Pacific Equatorial Current moves westward, it encounters theland barrier of the Philippine Islands. Part of the water carried by this current is directedsouthward past Mindanao Island to make up the Mindanao Current; this Current carriesa significant portion of the North Pacific Equatorial Current water along the PhilippineIslands between 100 and 5* North Latitude before it turns eastward; there, it merges withother water to form the narrow North Equatorial Counter-Current that returns eastward,centered at about 5*N (see Fig. 4.8; & Fig. 4.9).
ft a",,.if 1K '--- 5ujbropeoI
I~ Intfk+. PHILIPPINE SEA'
N orth Equ a norid, current SAoO-- ,rt Equ _ • q:SAIPAV
---SULU SEA -Io"~~~~~i I, -f- +"tre!s
+t• I 0500 KM
\ Equatorial Counter Current ?".-4. .... •. PALAU-- -- "
o Isloands . 30
"130" 140 tauli.l MilesIL
I
Figure 4.8: Major Currents in the Philippine Sea and Waters South of Japan(adapted from Uda (1966)).
4-10
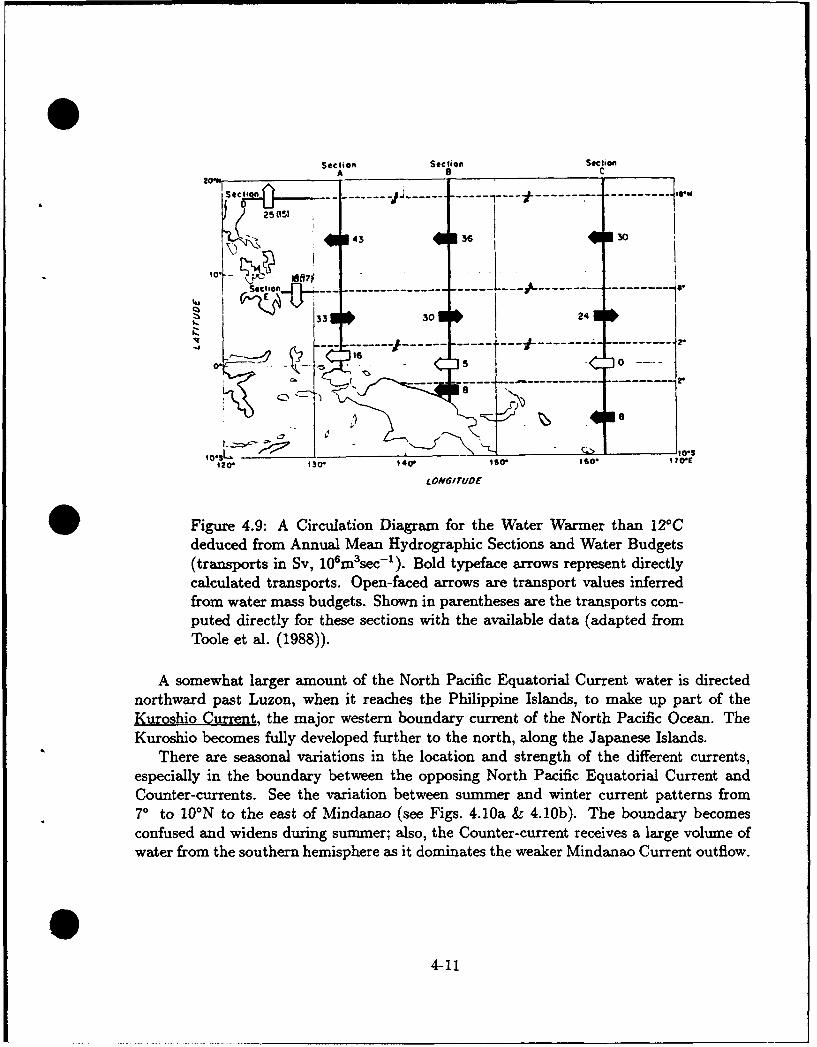
Section Section SectionA S C
Seca2l ......... J---------------------------------------
(1. 41536 30
So-.
-o -- -e4•o -•l~ -
33§ 30 24
If ------ --I-_
IO,,o . ,,- ,.,o,120. ISO* 140- ISO, o W
LONGITUDE
Figure 4.9: A Circulation Diagram for the Water Warmer than 120Cdeduced from Annual Mean Hydrographic Sections and Water Budgets(transports in Sv, 106m3sec- 1 ). Bold typeface arrows represent directlycalculated transports. Open-faced arrows are transport values inferredfrom water mass budgets. Shown in parentheses are the transports com-puted directly for these sections with the available data (adapted fromToole et al. (1988)).
A somewhat larger amount of the North Pacific Equatorial Current water is directednorthward past Luzon, when it reaches the Philippine Islands, to make up part of theKuroshio Current, the major western boundary current of the North Pacific Ocean. TheKuroshio becomes fully developed further to the north, along the Japanese Islands.
There are seasonal variations in the location and strength of the different currents,especially in the boundary between the opposing North Pacific Equatorial Current andCounter-currents. See the variation between summer and winter current patterns from70 to 10"N to the east of Mindanao (see Figs. 4.10a & 4.10b). The boundary becomesconfused and widens during summer; also, the Counter-current receives a large volume ofwater from the southern hemisphere as it dominates the weaker Mindanao Current outflow.
4-11
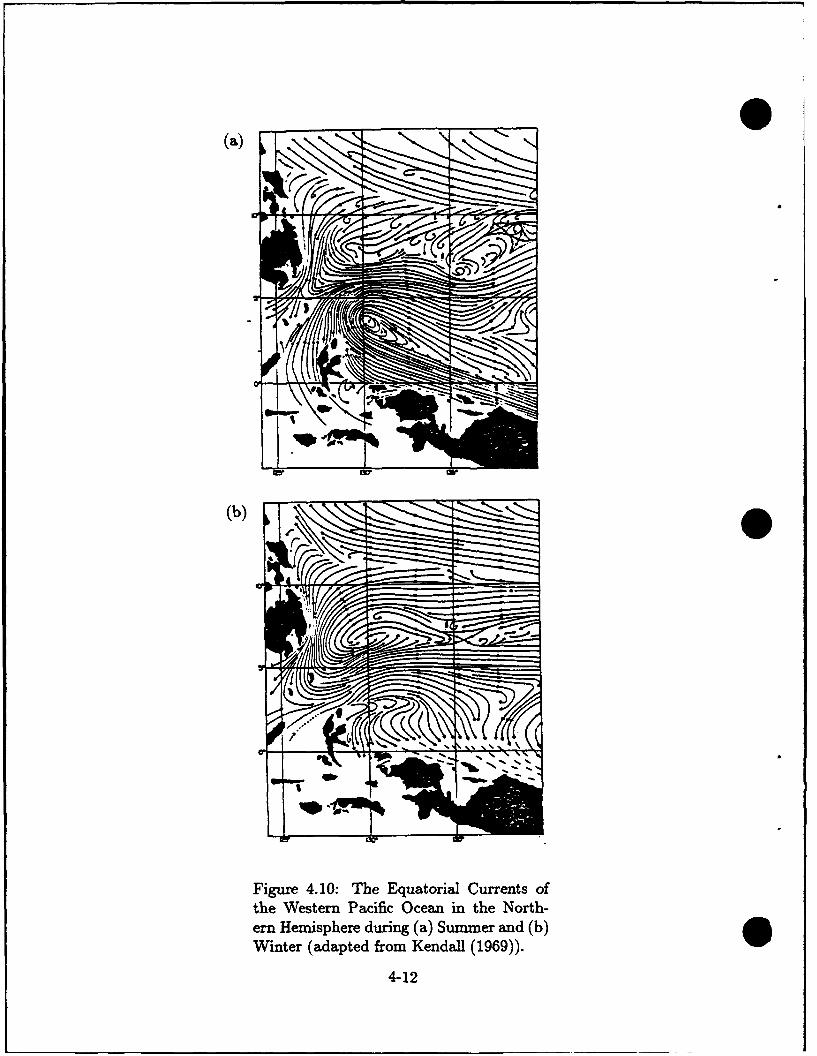
(a)
(b)g#
Figure 4.10: The Equatorial Currents ofthe Western Pacific Ocean in the North-ern Hemisphere during (a) Summer and (b)Winter (adapted from Kendall (1969)).
4-12
In July, three Lagrangian drifters were launched in the Mindanao Current; the launchpoint and date, the length of record and failure mode for Buoys 52, 53 and 55 are indicatedin Table 4.1 below, taken from Carpenter (1989).
Table 4.1:BUOYI Date of ILocation of Record Failure
launch launch length Mode
Buoy 52 16 July 88 6.944°N 53 days Lost126.619 0E drogue
Buoy 53 22 July 88 7.983°N 220 days Grounded127.9580E
Buoy 55 16 July 88 6.861°N 63 days GroundedI__ I_ _ 126.8610E __
Trajectories of these buoys are plotted in three figures (see Carpenter (1989), Figs. 4.11(a),4.11(b) & 4.12); squares are placed as markers for buoy locations at 12Z each second day,and the beginning and ending Julian dates axe indicated on each trajectory. AlthoughBuoys 52 and 55 were launched on the same date (16 July 88, Julian day 198), and veryclose together, the paths traced after the third square (sixth day) are entirely different.
* Buoy 52 is caught in the North Pacific Equatorial Counter-current and is carried rapidlyeastward; it describes one counter-clockwise loop in a 2-week period during its trajectory.Buoy 55 moves to the southwest, describes a counter-clockwise loop of almost 3 weeks du-ration, and continues northwestward through the Celoes (Sulawesi) Sea toward Borneo;there the coastline directed the buoy trajectory southward into the Southern Hemisphere.
Buoy 53 was launched 6 days later and at about one degree further to the north andto the east from the launch point for Buoys 52 and 55. After a very slow start for the first53 days, Buoy 53 moved eastward in the Equatorial counter-current; it then describes halfa loop (counter-clockwise) northward, where it was caught in the westward and relativelyslow drift of the North Pacific Equatorial Current. It finally grounded along the southeastcoast of Luzon.
4-13
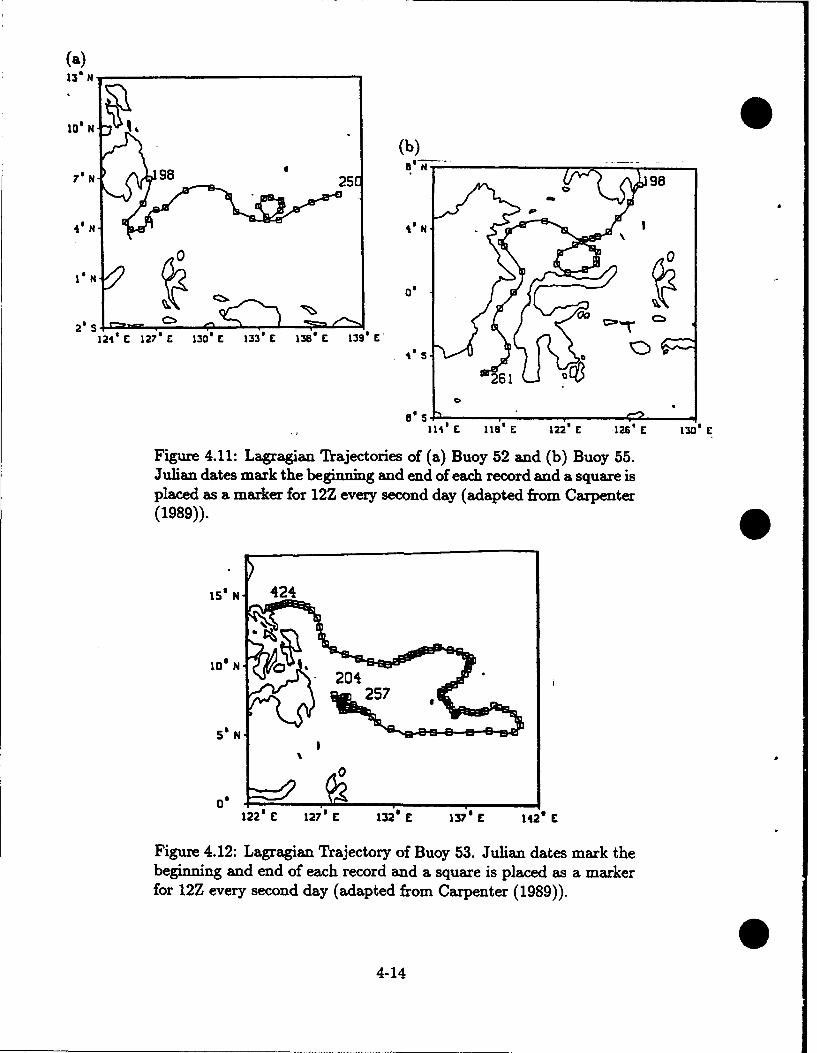
(a)13* N
(b)
'98 25C 98
SN Ai N -
iN 0
S~0'
2' S1 130 E 133' C 13' C 139 C
261
ofSIli' C 118, C 122" C 126" E 130* E
Figure 4.11: Lagragian Trajectories of (a) Buoy 52 and (b) Buoy 55.Julian dates mark the beginning and end of each record and a square isplaced as a marker for 12Z every second day (adapted from Carpenter(1989)).
Is N 424
10 N- Q
5 N
0
122 C 127' 132 E 137 E 142 E
Figure 4.12: Lagragian Trajectory of Buoy 53. Julian dates mark thebeginning and end of each record and a square is placed as a markerfor 12Z every second day (adapted from Carpenter (1989)).
4-14
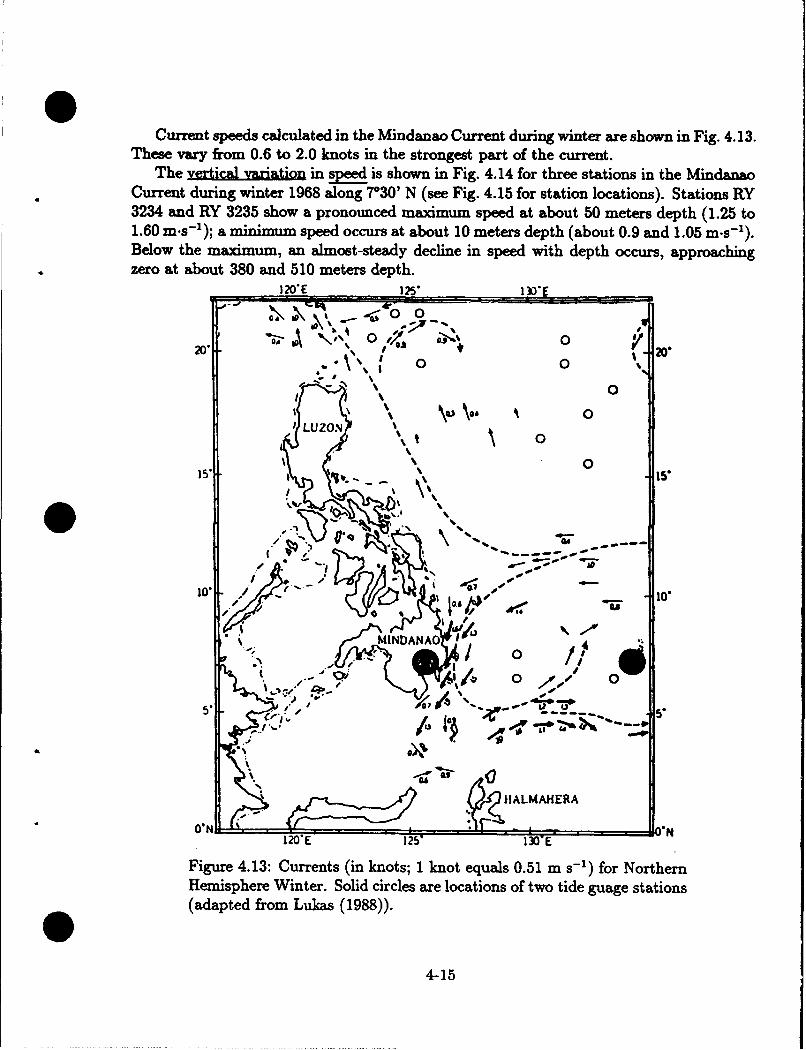
Current speeds calculated in the Mindanao Current during winter are shown in Fig. 4.13.These vary from 0.6 to 2.0 knots in the strongest part of the current.
The vertical variation in speed is shown in Fig. 4.14 for three stations in the MindanaoCurrent during winter 1968 along 7*30' N (see Fig. 4.15 for station locations). Stations RY3234 and RY 3235 show a pronounced maximum speed at about 50 meters depth (1.25 to1.60 m-s-'); a minimum speed occurs at about 10 meters depth (about 0.9 and 1.05 m-s-1 ).Below the maximum, an almost-steady decline in speed with depth occurs, approachingzero at about 380 and 510 meters depth.
120"E 125 IIOE
"go0
zpz 020" %0
- 0
& N
LUZON %
000
'.• l• \•
0 0
"0" ..
O'N 0. XN120"E' 125" 130'E'
Figure 4.13: Currents (in knots; 1 knot equals 0.51 m s-') for NorthernHemisphere Winter. Solid circles are locations of two tide guage stations(adapted from Lukas (1988)).
4-15
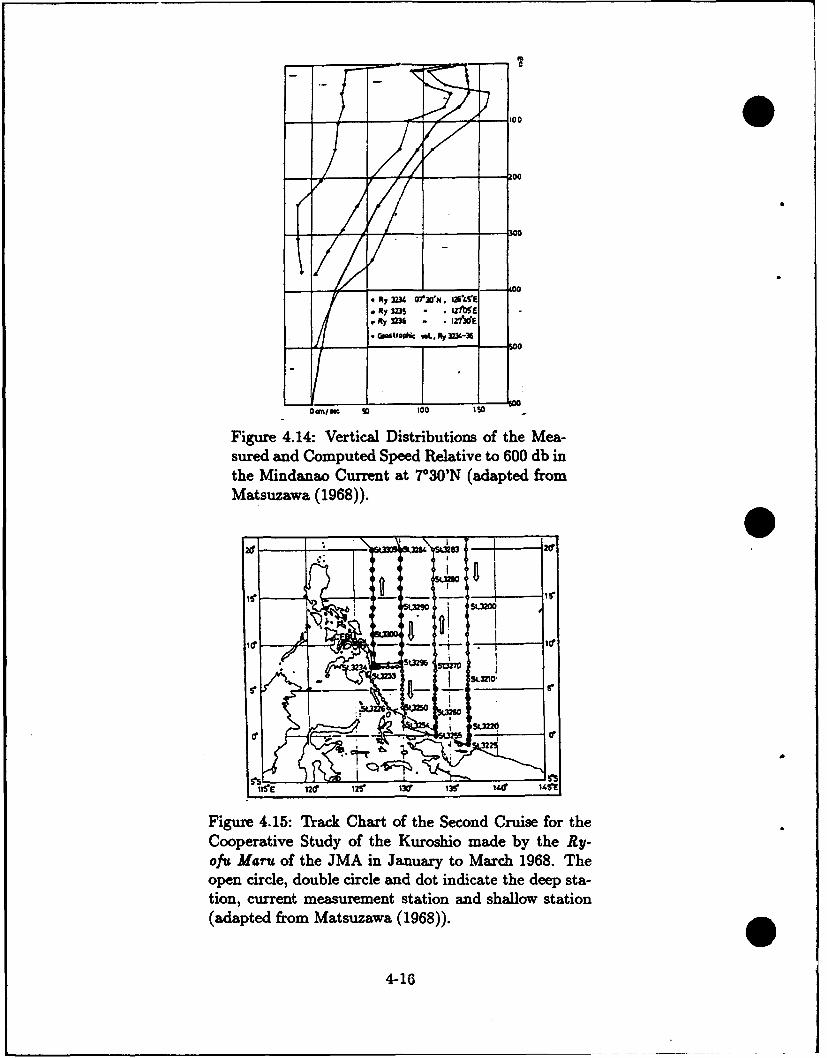
S• ty UM O'f3O'. 96151E-y 323- I0E
- S oo"
OrnlsC so 100 5_ 0
Figure 4.14: Vertica Distributions of the Mea-sured and Computed Speed Relative to 600 db inthe Mindanao Current at 7°30'N (adapted fromMatsuzawa (1968)).
2t N ,3 . I03 -2n
.R732,, ,o .• I ib~
S,,M
0a~ils50210'0
Figure 4.15: Track Chart of the Second Cruise for the
Cooperative Study of the Kuroshio made by the Ry/-ofu Mar of the JMA in January to March 1968. Theopen circle, double circle and dot indicate the deep sta-tion, current measurement station and shallow station(adapted from Matsuzawa (1968)).
4-16
2. Sea Surface Temperature. During August, the western North Pacific Ocean showsmaximum values between about 50S and 30°N along its western boundaries. The Philippinecoastlines experience these high temperatures, with a value of 290C along the western coastof Luzon; Fig. 4.16(a). By February, the region of temperature maximum has moved intothe southern hemisphere, from the equator to about 200S; see Fig. 4.16(b). Then thereis a weak temperature gradient along both east and west coasts of the Philippines; thetemperature ranges from 270C off Mindanao to 250C in Luzon Strait.
Monthly charts prepared from Comprehensive Ocean-Atmosphere Data Set (Sadler etal. 1987) are included as part of Appendix A. These charts represent averages of 80 yearsof data for 2-degree latitude/longitude areas from 50 to 26°N and from 110° to 140°E; thePhilippine Islands are centered in this region. Charts for August, November, Februaryand May are reproduced here in Figs. 4.17 & 4.18. Details of the seasonal changes intemperature are provided in Figs. 4.17 & 4.18 as they change between the extreme valuesshown earlier. Sea surface temperatures reach maximum value (>290C) in the South ChinaSea in May, while coldest temperatures in the area (<15°C) occur adjacent to China inTaiwan Strait in February. Thus the marginal seas experience a greater annual range insurface temperature than do regions in the open ocean to the east of the Philippine Islands.
Somewhat north of the Philippines, off Taiwan, sea surface temperatures measured inwinter (December '62 - January '63) and summer (June '63) are shown in Figs. 4.19(a) &4.19(b). About 40C seasonal variation occurs nearshore and in Luzon Strait, but it lessensto 2.5 to 30C further offshore, south of 22*N in the Philippine Sea. Figure 4.19(a) showsthe location of two coastal stations on the eastern coast of Taiwan from which verticalsections are made of temperature that are shown later: Ho Peng (Ho stations) and ShiTi (ST stations); those sections of temperature versus depth extend offshore from theselocations about 4 and 5 km.
4
4-17
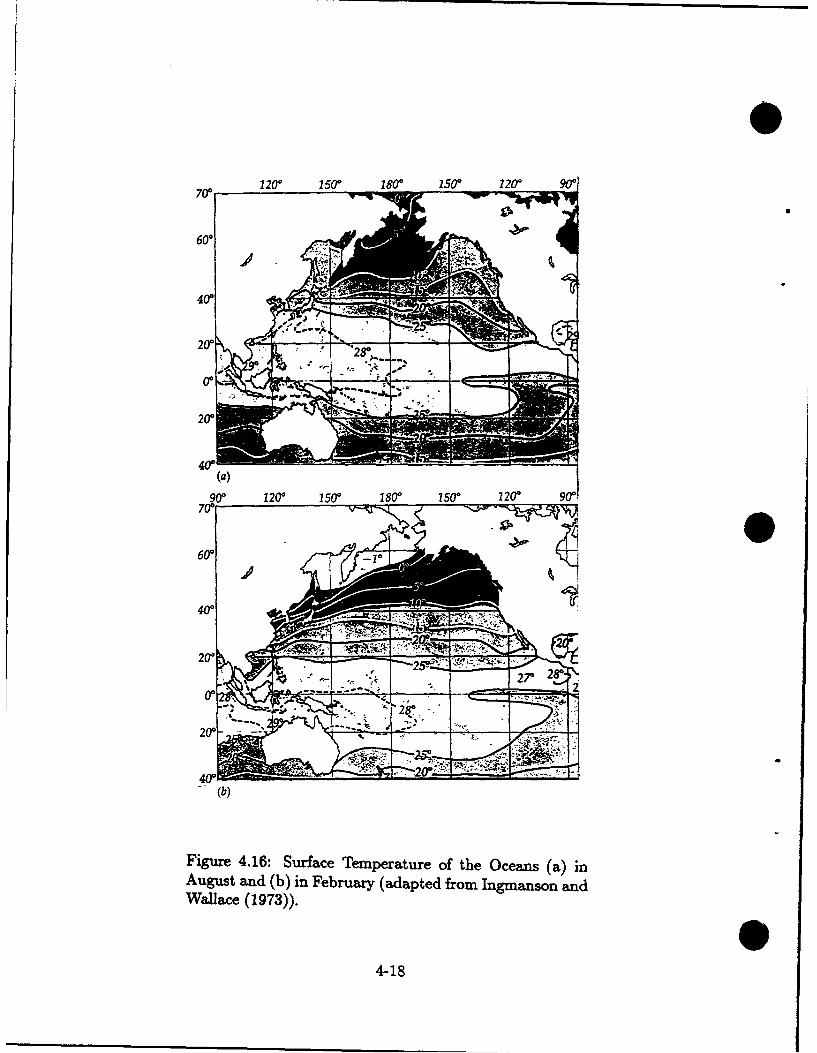
12T0 1500 1800 l50o 220o 900
700 20 50 10 50 70 0
4-18
60=jo a..:',•
6T-" 14Ar._
(a)900 12(r 15Lr 180T 15 7 20 9
600
200 v "" -:=" 2•": "
2- 2;;
-(b)
Figure 4.16: Surface Temperature of the Oceans (a) inAugust and (b) in February (adapted from Ingmanson and
Wallace (1973)).
4-18
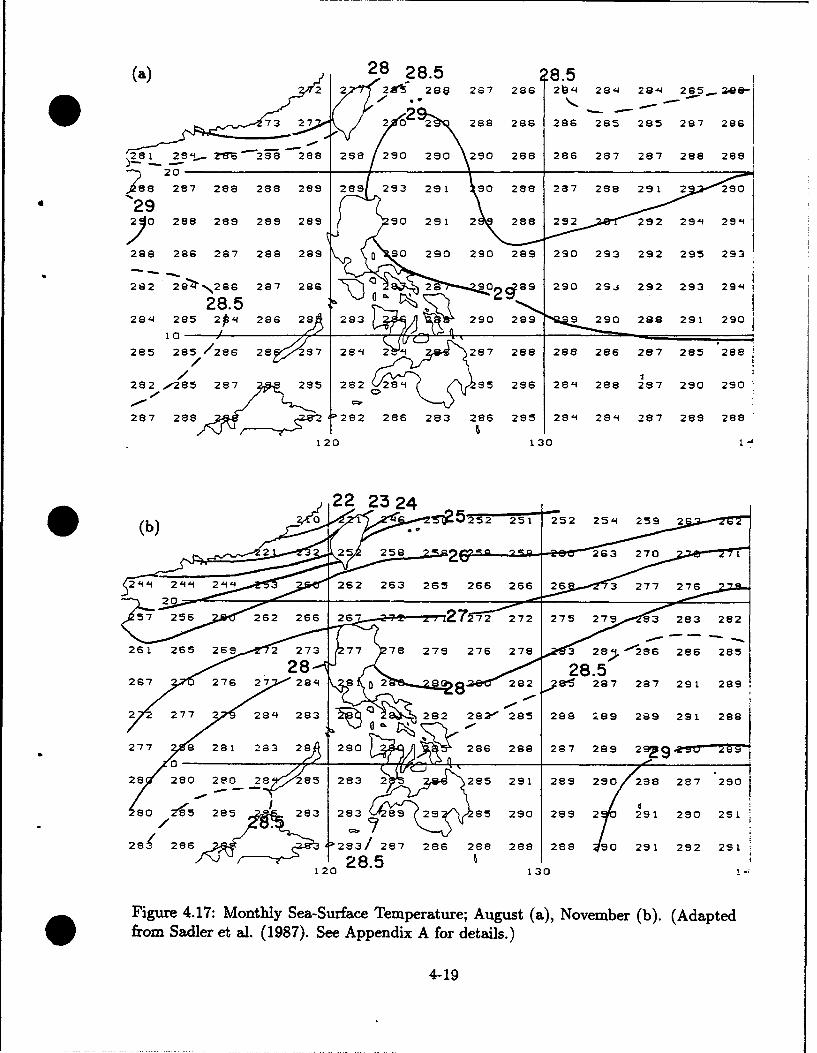
(a) 28 28.58.52 2 29f 28e 267 266 21a 28q 2 a 4 285- 2,8&-
723 0 228 28S 286 285 285 287 286
1281 28-1.?..- ?• -8 2 288 28 290 280 290 288 286 287 287 288 2888 20- -
28 28 287 288 288 2 28 29 0 29 0 288 297 288 291 2 290
2• 8 8 89299 9 29 29 292 293I 29'4
2884 285 287 266 289 2 • 290 289 929 288 291 290
282 285 287 28 282 289 29 289 289 288 298 298 290
282 / 88 282 286 2 83 2 8 8 289 287 288 288
1, G27 20 13 9 q 0 2j222321285 285 280628 285 281 2 285 288 288 280 287 287 280
28 252725282 28M2 85 280 2 88 2e 291 280 291/
2872 286 2283 287 28 6 288 288 288 90 287 289 288
120 130 1A
22 25324(b) V=
"• ,211 ,4 2 AiA ,'..I H 26 2 26 3 2 65 266 266 2 7 7
2526 -37 -76
*7 26 2Fu 4T A s (, N7ovebe (b7 2( t 2 e 282
26125 277 28 273 772827 276" 2785 3 28> -2S6 286 285
••2 8 28.5
228 277 20 294 28322 282'25 291 289 2a98 291 288
so 2 18' 2 8528 28 3 8 2 3 85 290 28 9 2 '31 2 30 2 51
2 8.5120 130 1-
O Figure 4.17: Monthly Sea-Surface Temperature; August (a), November (b). (Adapted
from Sadler et al. (1987). See Appendix A for details.)
4-19
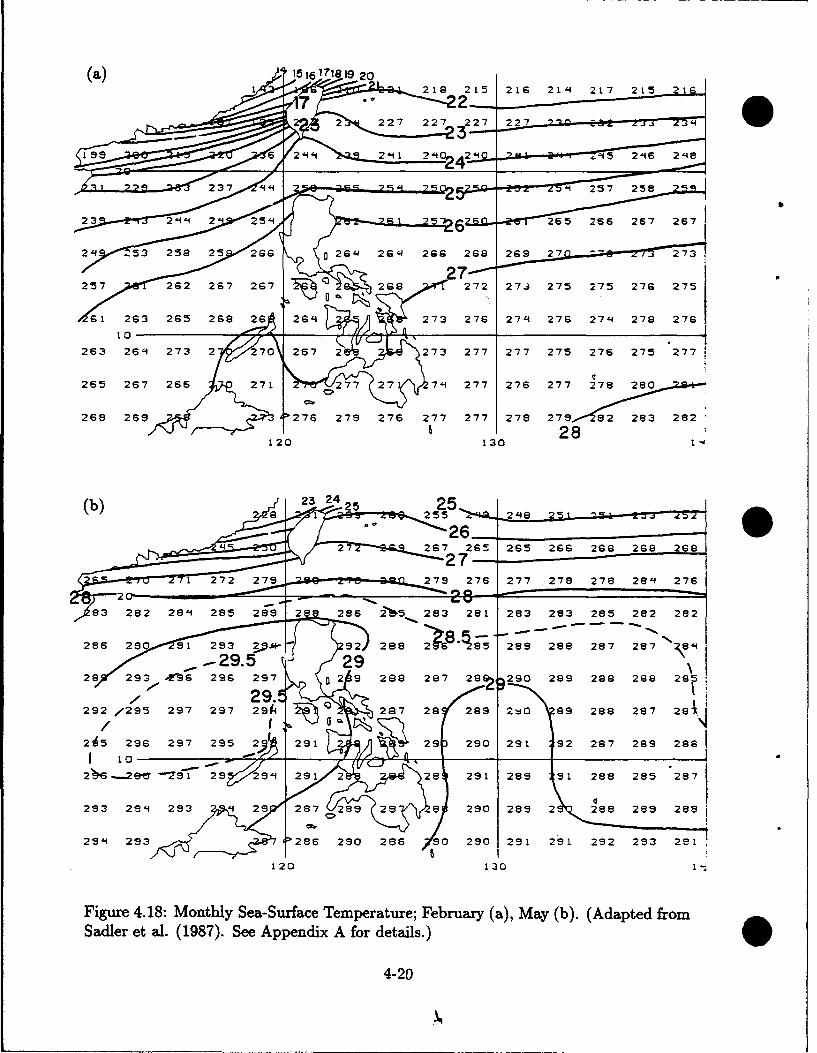
(a) 15117819 20
"26 21 277 27 1 a2 15 277 276 2 217 2
276 279 227 6 277 277 278 277 2"82 283 282
Ise 6 2 112 '1 2 7"- 2 77 :r4 .272 2i
S~28120 130 -
27 267aý 7 - 26 54 25 26 268 258 26
82'4 28 2 2 283 28 2 268 268 268 268
28 2 6 297 297 287 276 279 275 278 288 275
29281 26 297 297 2" 26 28 7 28 289 27q 289 28 287 287
263 2-.H279 3 2 297 291 2 287 29 289 21 288 285 28•
2965 2 '7 2 96 297 287 289 27 787 2 90 289 2 288 287 28 8
228 292 9 286 27 270 29 29 272 293 211
120 130 1
Figure 4.18: Monthly Sea-Surface Temperature; February (a), May (b). (Adapted from
Salret al. (1987). See Appendix A for details.)
4-2O

0
* ~(a) 211|e I)0" 121e21'• • e 14
4o' 25,
o./pe
24 / Hualien: 24'TAI WAN Shi
Cheng \Jang SSi.Kung Yua
22* 22"28*
JUNE 2-22.1963
21 21*liV 120* 121* 122e 123* 124' -
(b) 29* 24,
24. 24*
7 TAIWAN
,.: . N- .
b f 22o
DEC. 25. 1962 TO JAN. 15.1961
21* 21
119, 120' 121. 122' 123* 124'
Figure 4.19: Sea Surface Temperature (0C) aroundTaiwan in Summer (a) and Winter (b) (adapted from
* Yin (1988)).
4-21
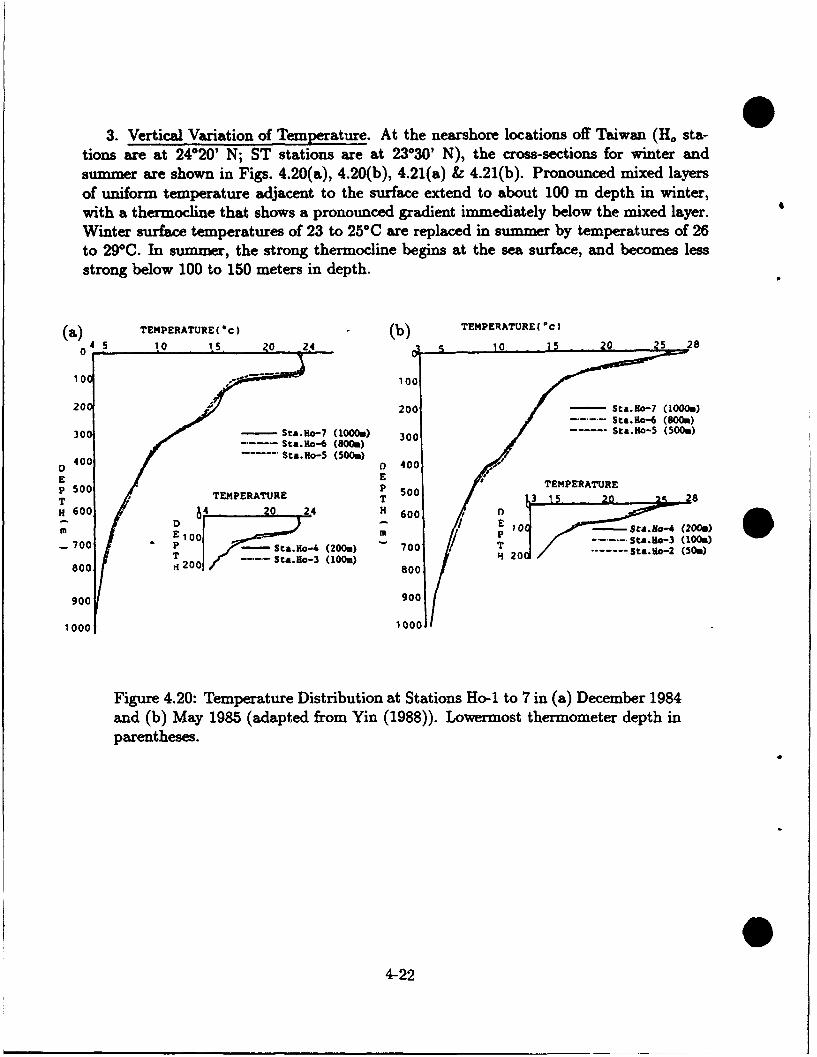
3. Vertical Variation of Temperature. At the nearshore locations off Taiwan (H. sta-tions are at 24*20' N; ST stations are at 23*30' N), the cross-sections for winter andsummer are shown in Figs. 4.20(a), 4.20(b), 4.21(a) & 4.21(b). Pronounced mixed layersof uniform temperature adjacent to the surface extend to about 100 m depth in winter,with a thermocline that shows a pronounced gradient immediately below the mixed layer.Winter surface temperatures of 23 to 250C are replaced in summer by temperatures of 26to 29°C. In summer, the strong thermocline begins at the sea surface, and becomes lessstrong below 100 to 150 meters in depth.
(a) TEMPERATURE(' (b) TE'PERATURE(Oc)
S 10 15 0 24 5 20 _25 28
0 - g
100 100
200 200 - St.Ho-7 (1000m)Sta.Ho-6 (800m)
300 Sta.Ho-7 (1000.) 300 --.... Sta.Ho-5 (500m)Sta.Ho-6 (800,)
D400 - -- St&.ilo-5 (500.) ' 40E E 0 TEMPERATURET 500 TEMPERATURE 5 2oo"T 4 20 24,.'ua T ) 1,3 .15 20 iq 28
H 60 0 & ~ , 4H 600 I100 70C - (200m)
70 E 1 0P ~ = T -- t~~- (100.).7oo -° 1 i' s -St..BH°- (200.) 700 so. .. o-2 (50.)
T I' Sta.Ho3 (100.) H 200800 ti 200. 8o0
900 900
1000 1000
Figure 4.20: Temperature Distribution at Stations Ho-1 to 7 in (a) December 1984and (b) May 1985 (adapted from Yin (1988)). Lowermost thermometer depth inparentheses.
04-22
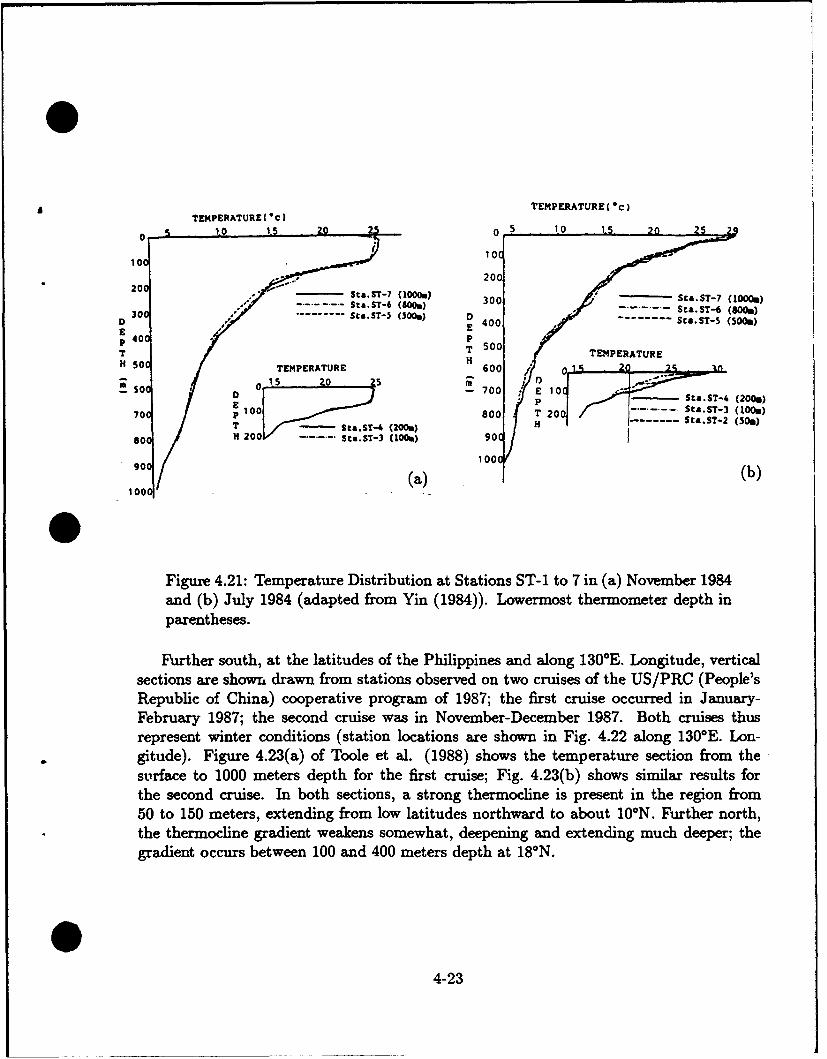
TEMPERATURE( c)TEMPERATURE0 (€)
0 1.0 . 1.5 20 , 0 10 15 20 25
/0 10C
20020St.ST-7 (1000.)
st.sT-6 (600.) 300 Sce.ST-7 (1000.)D 30..... s----t.ST-5 (500.) 400-Sca.ST-6 (800.)
-------- Sta.ST-S (S00.)E 0
T4 PT 500 TEMPERATURE
H 50C TEMPERATURE 600 / 0 _ 2f 25
"soo i1s 0 5 rn 70 las oI ) .
- Sta.ST-4 (200.)E I -- -- Sta.ST-3 (100.)
70o ,o 800 T -- -Sta.S-- (1o.)T Sta.S--4 (200.)
80C H 200 Sta.ST-3 (100.) 90C
10090 (a) (b)
Figure 4.21: Temperature Distribution at Stations ST-1 to 7 in (a) November 1984and (b) July 1984 (adapted from Yin (1984)). Lowermost thermometer depth inparentheses.
Further south, at the latitudes of the Philippines and along 130*E. Longitude, verticalsections are shown drawn from stations observed on two cruises of the US/PRC (People'sRepublic of China) cooperative program of 1987; the first cruise occurred in January-February 1987; the second cruise was in November-December 1987. Both cruises thusrepresent winter conditions (station locations are shown in Fig. 4.22 along 130*E. Lon-gitude). Figure 4.23(a) of Toole et al. (1988) shows the temperature section from thesurface to 1000 meters depth for the first cruise; Fig. 4.23(b) shows similar results forthe second cruise. In both sections, a strong thermocline is present in the region from50 to 150 meters, extending from low latitudes northward to about 10 0N. Further north,the thermocline gradient weakens somewhat, deepening and extending much deeper; thegradient occurs between 100 and 400 meters depth at 18*N.
04-23
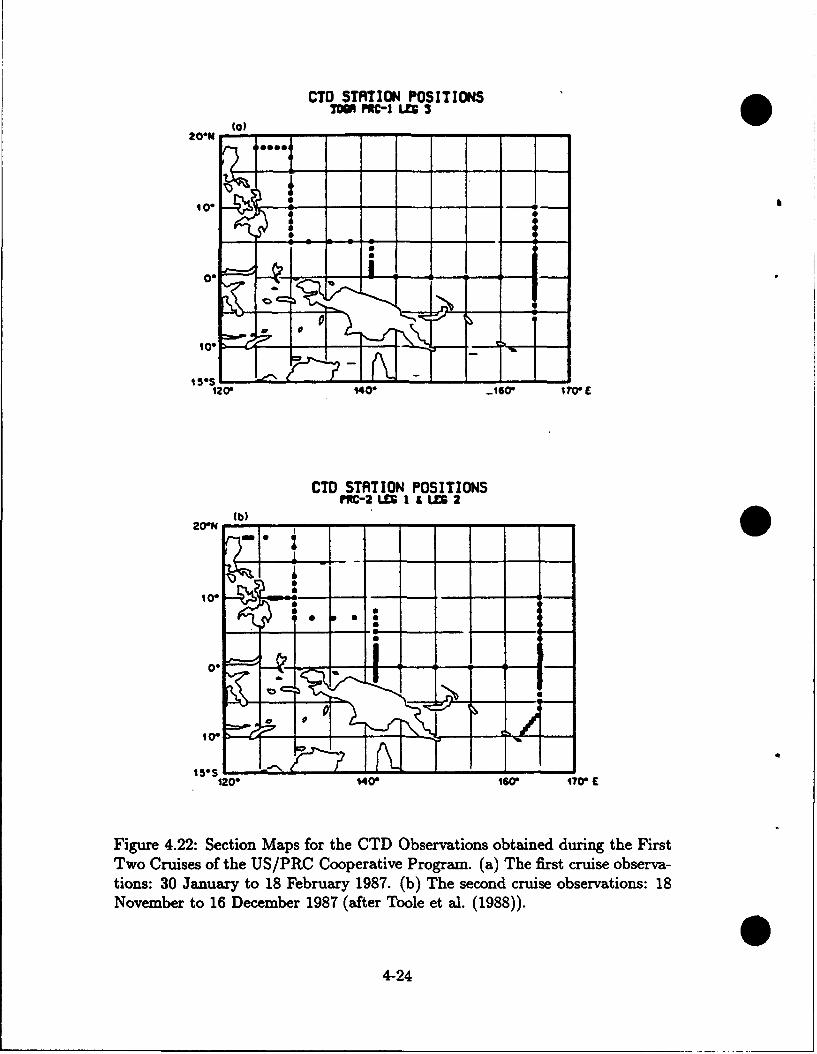
CTD STATION POSITIONSIUPF RtC-) LEG3
Co)
I ,
100
'0*-
I0SI L"401 Nt0I IT}
CTD STATION POSITIONSPRC-2 LEG I LED 2
(b) __ _ __ _
1 O*t - " - '"---" - -
00
150S
120 140' 1w I E
ab
Figure 4.22: Section Maps for the CTD Observations obtained during the FirstTwo Cruises of the US/PRC Cooperative Program. (a) The first cruise observa-tions: 30 January to 18 February 1987. (b) The second cruise observations: 18
November to 16 December 1987 (after Toole et al. (1988)).42
* -2
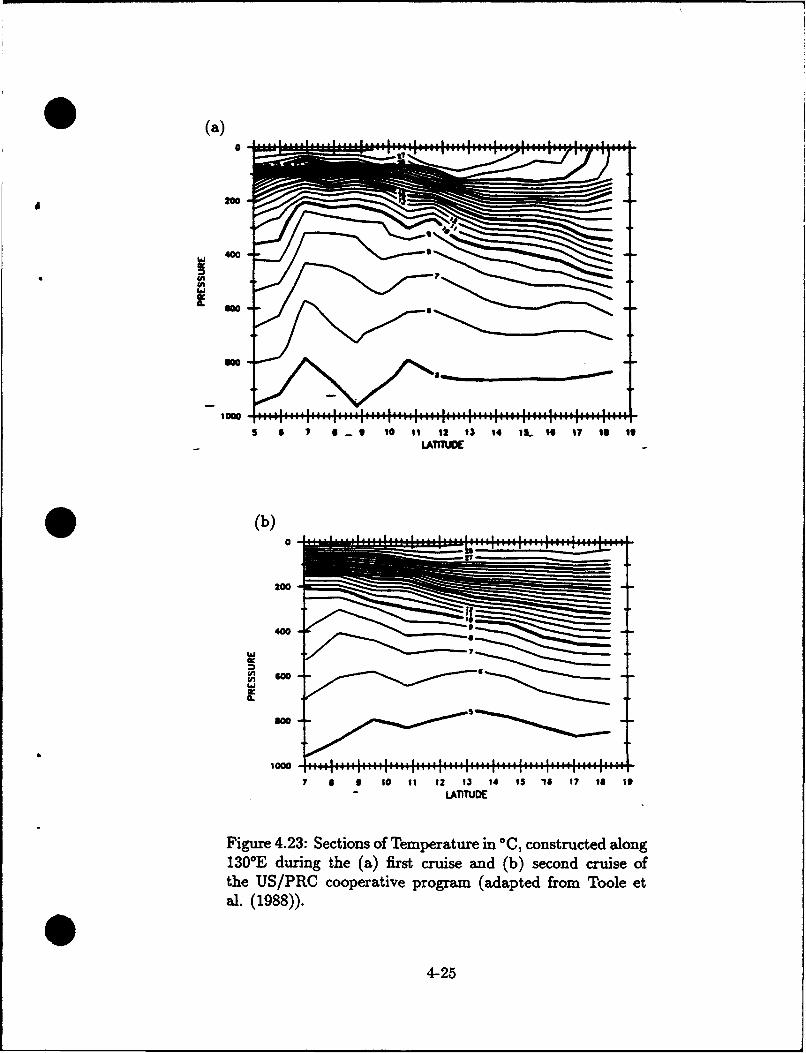
* (a)
10 0 .. ! ., I .. i.. . . .. I .. I.. . . .. I. .. I.... I .... t . .I . .I . .
00
* ~4M
lgow
s 6 7 6 1 lol$ 12 13 14 I.. s1 17 Is 11
LATTT"
*.(b) I.
200
4W2
swIL
1000
7 a 1 101t 12 13 14 13 If 17 11 I
LOlTUDE
Figure 4.23: Sections of Temperature in *C, constructed along130*E during the (a) first cruise and (b) second cruise ofthe US/PRO cooperative program (adapted from Toole etal. (1988)).
4-25
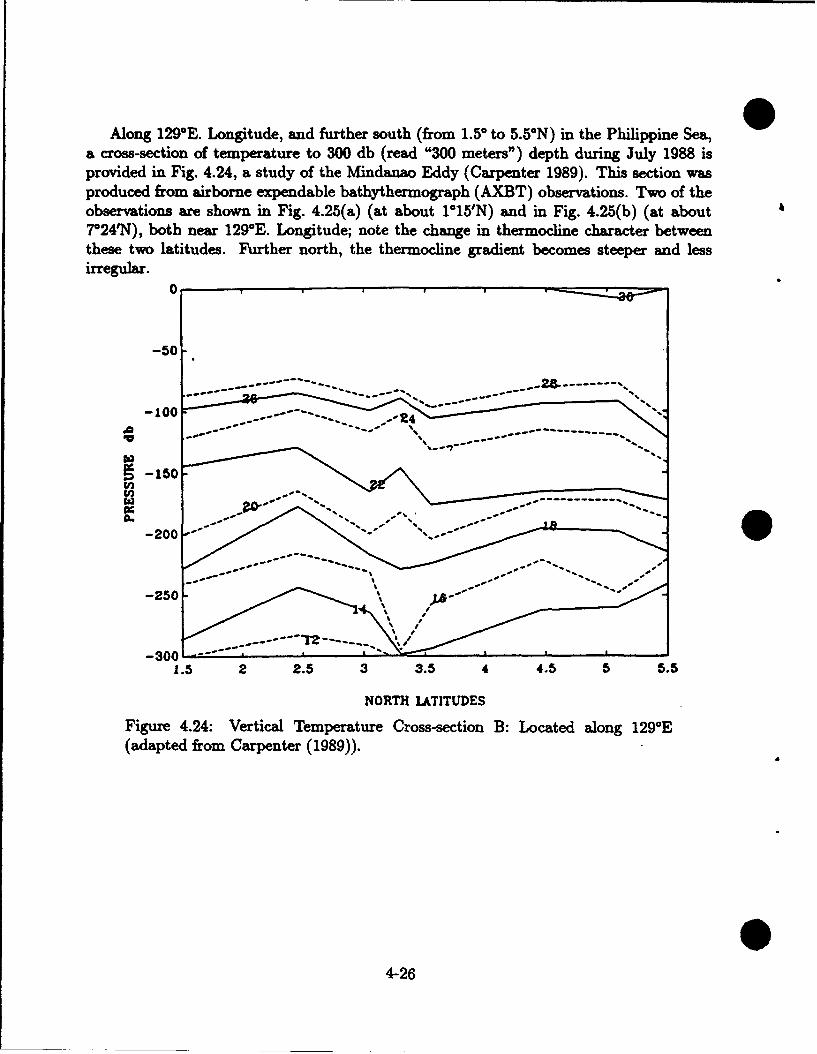
Along 129*E. Longitude, and further south (from 1.50 to 5.5°N) in the Philippine Sea,a cross-section of temperature to 300 db (read "300 meters") depth during July 1988 isprovided in Fig. 4.24, a study of the Mindanao Eddy (Carpenter 1989). This section wasproduced from airborne expendable bathythermograph (AXBT) observations. Two of theobservations are shown in Fig. 4.25(a) (at about 115'N) and in Fig. 4.25(b) (at about7°24'N), both near 129*E. Longitude; note the change in thermocline character betweenthese two latitudes. Further north, the thermocline gradient becomes steeper and lessirregular.
-50
--------------------------------
-100.
% --- -- -- -- --
_200
-250 -' ""
-3001.5 2 2.5 3 3.5 4 4.5 5 5.5
NORTH LATITUDES
Figure 4.24: Vertical Temperature Cross-section B: Located along 129 0E(adapted from Carpenter (1989)).
42
4-26
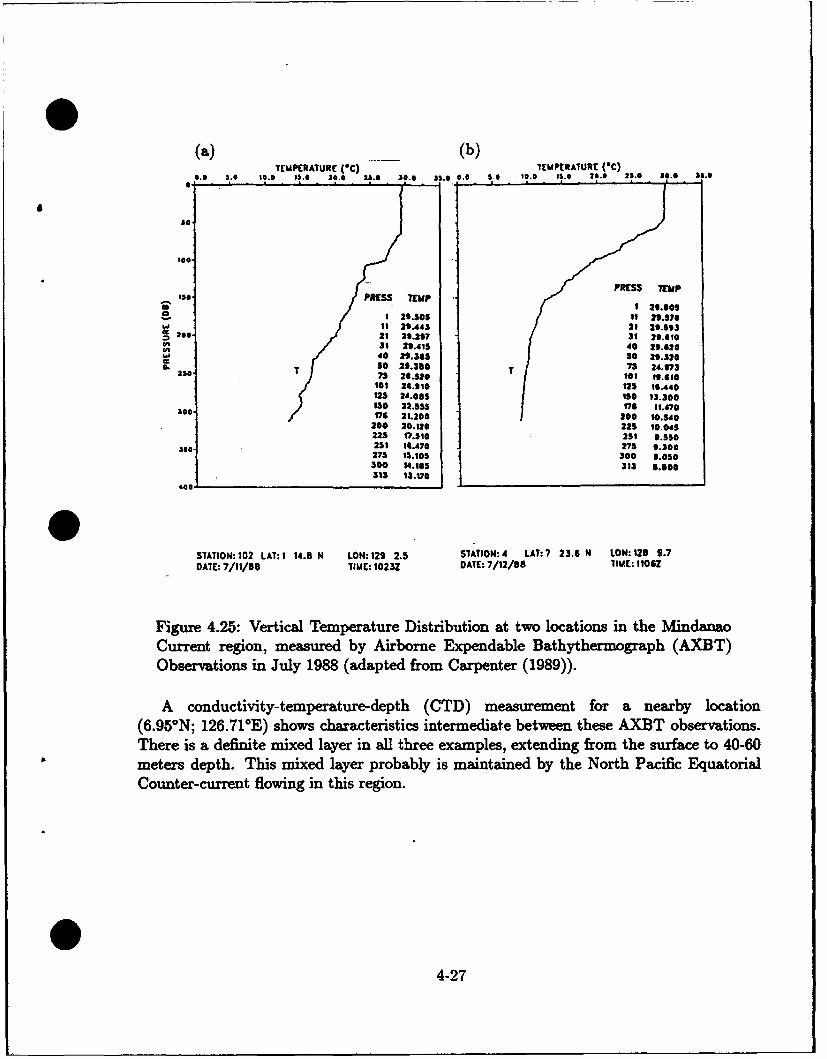
(a) (b)TMUPERATURE (OC) IEUPERATURE (*C)
0.0 S.0 10.0 11.0 20.0 2$.0 .0.0 s$.0 0.0 5.0 10.0 61.0 20.0 1 5$.0 30 .0
see
0p
T ePRS TEMP.
a • 9I i o .3 70S I 20.sos5 II 29.5TOa It 29.443 21 29.193300 21 26.297 31 29.o10
31 20.415 40 29.02040 ".345 50 29.32050 29.340 T 73 24y973.250, 75 28.520 'so #$.GIG
101 25.10 125 16.440125 24.085 170 13.300130 22.553 576 11.470
""0 170 21.200 200 10.540200 20.120 225 10.04522 0..510 251 9.550251 14.470 275 9.300275 14.105 300 3.OSO300 14.185 313 6.500313 1w.170
'00
STATION: 102 LAT: I 14.8 N LON: 129 2.5 SIATION: 4 LAT: 7 23.6 N LON: 128 9.7DATE: 7/11/88 TIME: 1023Z DATM: 7/12/88 IME: 1106IZ
Figure 4.25: Vertical Temperature Distribution at two locations in the Minda"aoCurrent region, measured by Airborne Expendable Bathythermograph (AXBT)Observations in July 1988 (adapted from Carpenter (1989)).
A conductivity-temperature-depth (CTD) measurement for a nearby location(6.95°N; 126.71°E) shows characteristics intermediate between these AXBT observations.There is a definite mixed layer in all three examples, extending from the surface to 40-60meters depth. This mixed layer probably is maintained by the North Pacific EquatorialCounter-current flowing in this region.
4-27
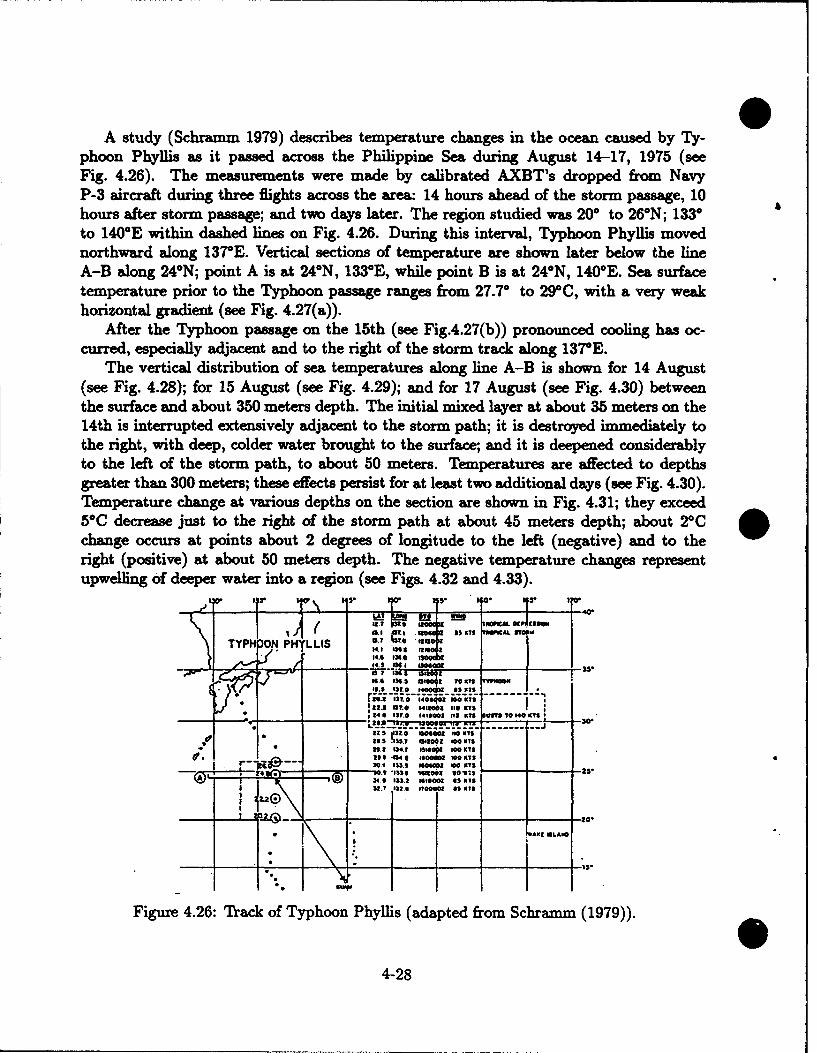
A study (Schramm 1979) describes temperature changes in the ocean caused by Ty-phoon Phyllis as it passed across the Philippine Sea during August 14-17, 1975 (seeFig. 4.26). The measurements were made by calibrated AXBT's dropped from NavyP-3 aircraft during three flights across the area: 14 hours ahead of the storm passage, 10hours after storm passage; and two days later. The region studied was 20* to 26*N; 133"to 140*E within dashed lines on Fig. 4.26. During this interval, Typhoon Phyllis movednorthward along 137"E. Vertical sections of temperature are shown later below the lineA-B along 24*N; point A is at 24"N, 133°E, while point B is at 24°N, 140"E. Sea surfacetemperature prior to the Typhoon passage ranges from 27.70 to 29°C, with a very weakhorizontal gradient (see Fig. 4.27(a)).
After the Typhoon passage on the 15th (see Fig.4.27(b)) pronounced cooling has oc-curred, especially adjacent and to the right of the storm track along 137"E.
The vertical distribution of sea temperatures along line A-B is shown for 14 August(see Fig. 4.28); for 15 August (see Fig. 4.29); and for 17 August (see Fig. 4.30) betweenthe surface and about 350 meters depth. The initial mixed layer at about 35 meters on the14th is interrupted extensively adjacent to the storm path; it is destroyed immediately tothe right, with deep, colder water brought to the surface; and it is deepened considerablyto the left of the storm path, to about 50 meters. Temperatures are affected to depthsgreater than 300 meters; these effects persist for at least two additional days (see Fig. 4.30).Temperature change at various depths on the section are shown in Fig. 4.31; they exceed5*C decrease just to the right of the storm path at about 45 meters depth; about 2?Cchange occurs at points about 2 degrees of longitude to the left (negative) and to theright (positive) at about 50 meters depth. The negative temperature changes representupwelling of deeper water into a region (see Figs. 4.32 and 4.33).
I:a :i s*. IV 1*
Q.? . IZOSOp UpoprA CI1SIWI0.1;;F1 04* 35 NI1 O ALSTOP
TYPH PHYLLIS 0T14.6 IN O W
64O 04 . 634 00 13: 1 T IS ____
661 131.0 . 406"Z IIO Nisroa128.2 a * 410601 110 X1'24 6 o37.0 141001 113 1CT S BI oI 00 IN is
2$ jISlO 00�4•qQ02 NI0 S?23S * . 6011 00? 2 I Ts
7?! 34? #000001 O1 h3LA30.1 $310.11 0140 2 00• Trs
eS. I21 SOD" 0
• IL.KC ISLAND
Figure 4.26: Track of Typhoon Phyllis (adapted from Schramm (1979)).
4-28
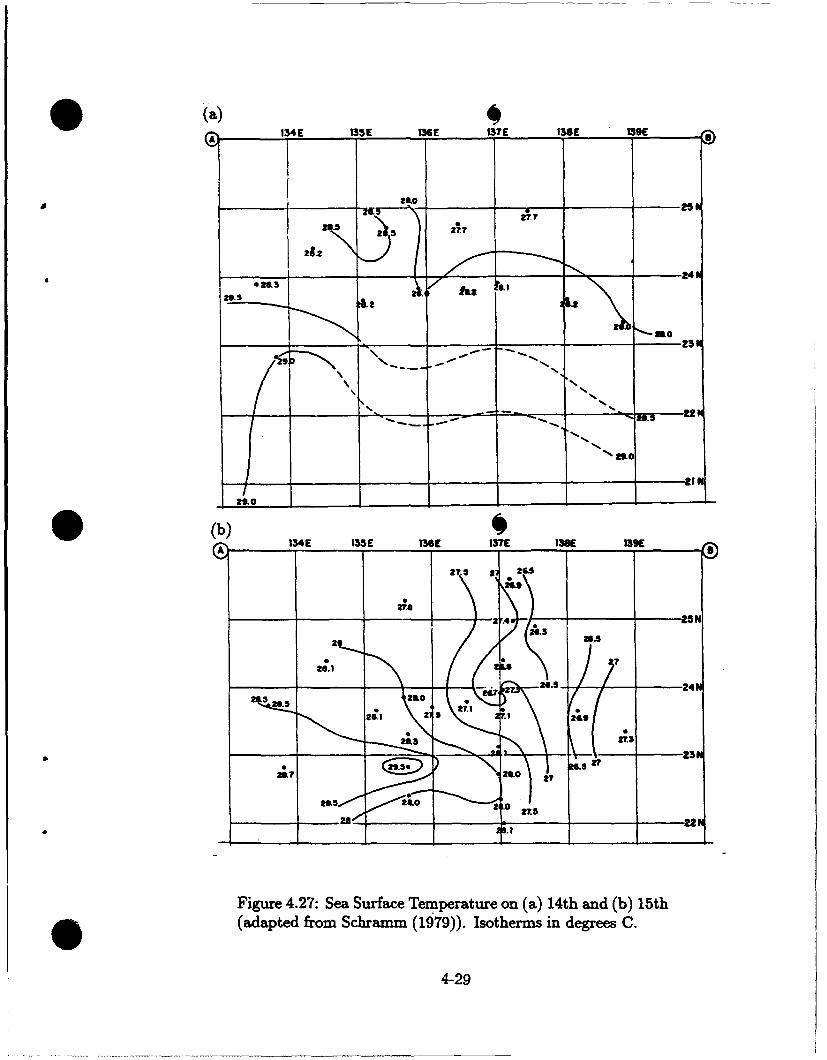
O (a) __
£134E WE5 136E 137E 136! 139
a -, a~oAm.227
20.5
24N
,__ _ _23t
j 21"
-- 24N
I23N04. 277
24
Figure 4.27: Sea Surface 'Temperature on (a) 14th and (b) 15thS~(adapted from Schramm (1979)). Isotherms in degrees C.
4-29
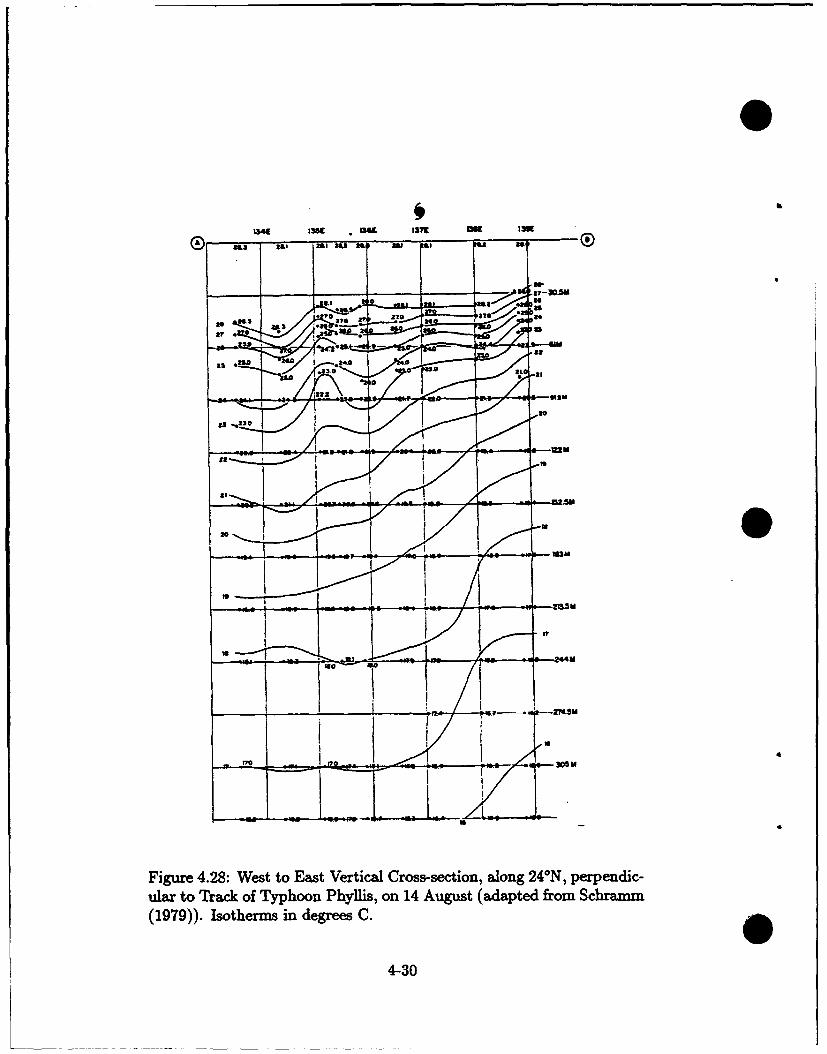
b
1349 3M 3 " 137 13K 13Kf
(D 21 3 X& 211.'a 2 1141 2 41. Was Ol
w*
.a
SA I . .. a 2
II
Figure 4.28: West to East Vertical Cross-section, along 24°N, perpendic-ular to Track of Typhoon Phyllis, on 14 August (adapted from Schram~m(1979)). Isotherms in degrees C.
4-30
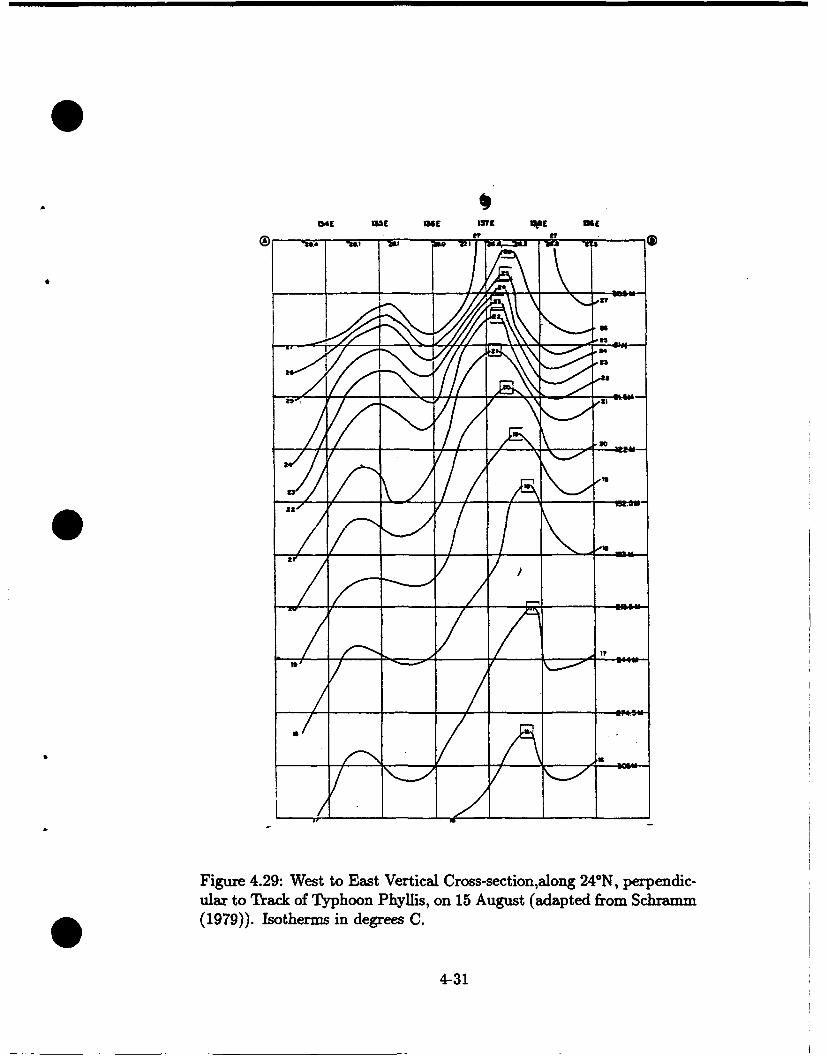
1541 5Sf use owe %PC Ott
(179).Isthrns n1egee+C
4-31/ ,Oo
Figure 4.29: West to East Vertical Cross-section,along 24°N, perpendic-ular to Track of Typhoon Phyllis, on 15 August (adapted from Schramm
O (1979)). Isotherms in degrees C.
4-31

I4 1 OK 1M ITM =9f N
(199)) iotrmAs in dere s C. i4 & u ii
4-32
its.'r
Figure 4.30: West to East Vertical Cross-section along 24"N, perpendic-ular to Track of Typhoon Phyllis, on 17 August (adapted from Schramm(1979)). Isotherms in degrees C.O
4-32
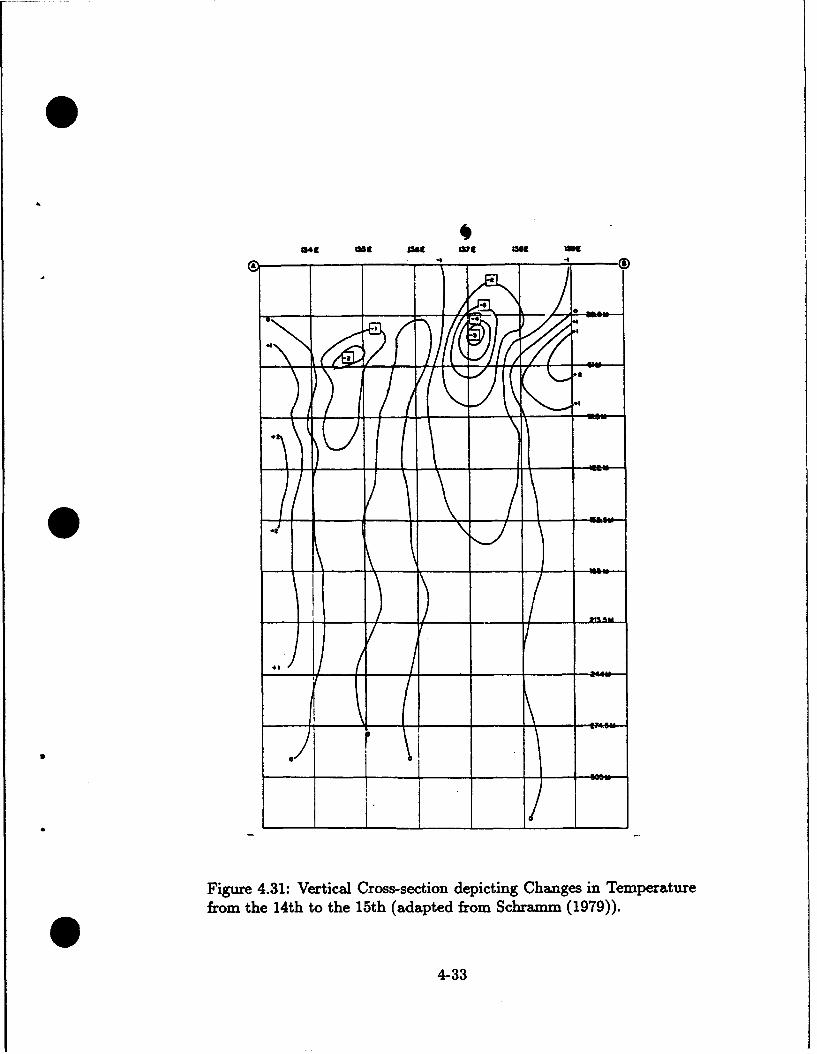
341[ 361 IMl 3M 36[
.4 0
Figure 4.31: Vertical Cross-section depicting Changes in Temperaturefrom the 14th to the 15th (adapted from Schra~mm (1979)).
4-33
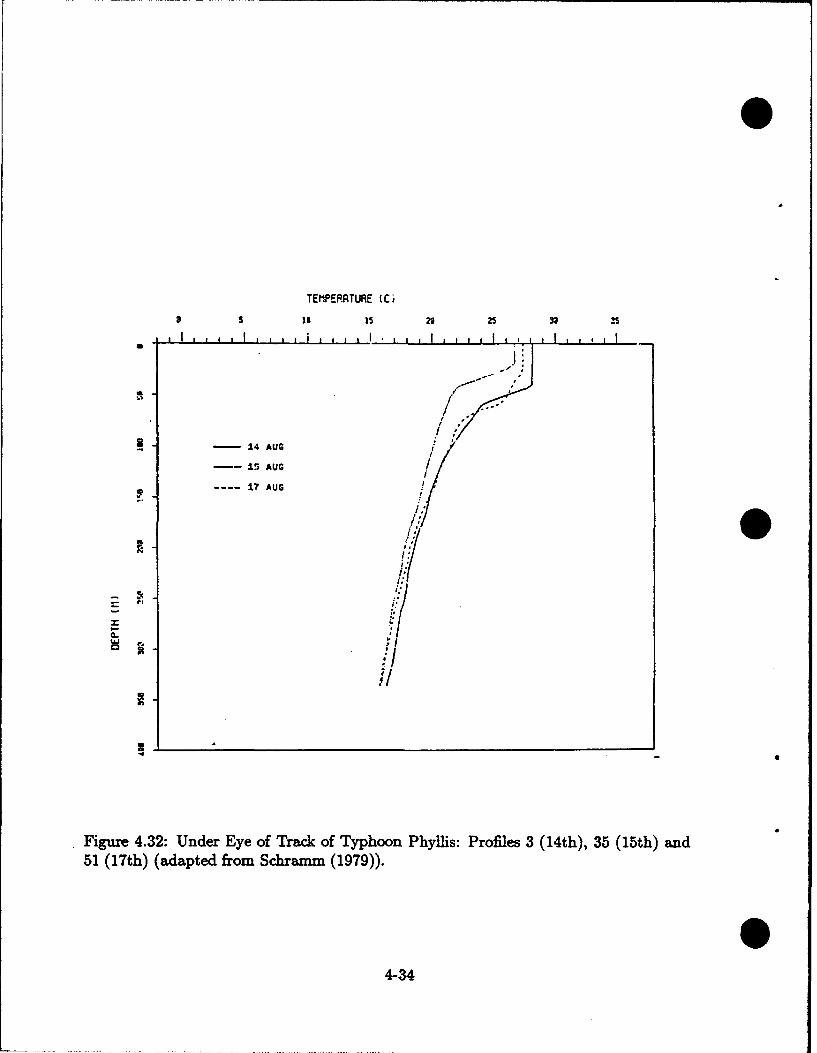
TEMPERRTURE (C'
is 15 20 25 33
S I I I I I,'Ii I 1
/"
-1 AUG
---- 15 AUG
---- 17 AUG
C1:./
N1//
14
Figure 4.32: Under Eye of Track of Typhoon Phyllis: Profiles 3 (14th), 35 (15th) and51 (17th) (adapted from Schramm (1979)).
4-34
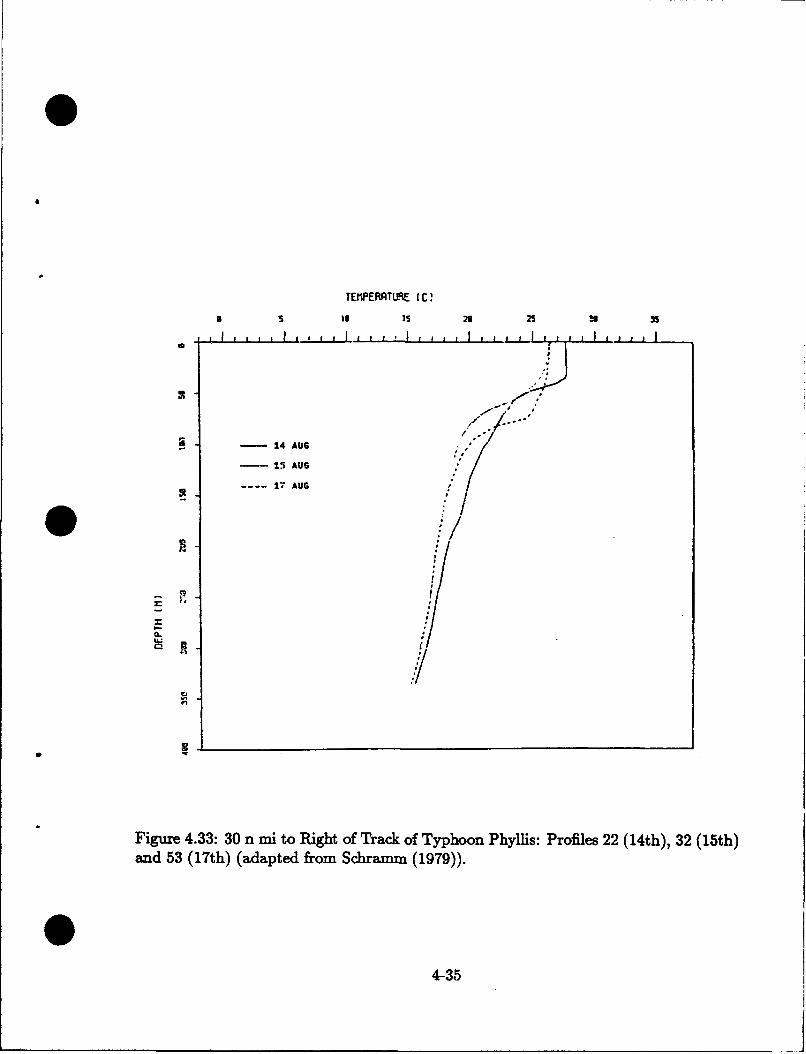
4
TEMPERRTUPE (C!
U S Is 1s 21 25 N5 35
I I f I I II t II I I I I I I f i
14 AUG
--- 15 AUG
----. 17 AUG
Figure 4.33: 30 n mi to Right of Track of Typhoon Phyllis: Profiles 22 (14th), 32 (15th)and 53 (17th) (adapted from Schrammn (1979)).
4-35
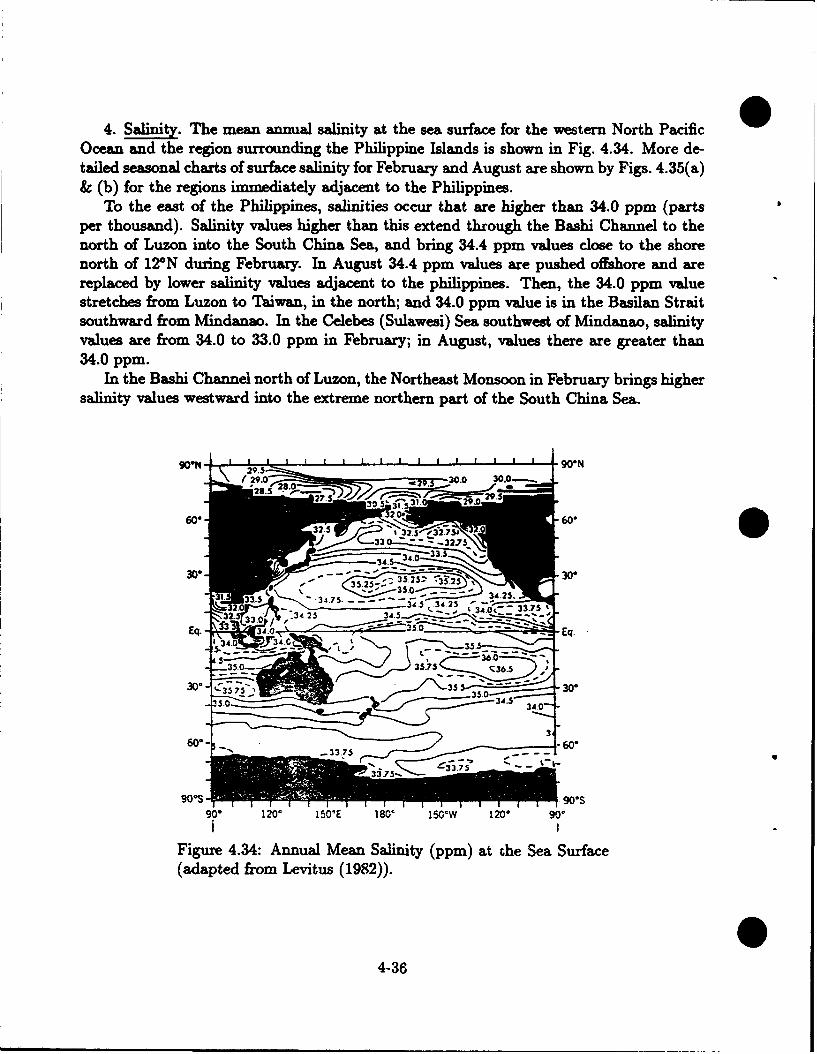
4. Salinity. The mean annual salinity at the sea surface for the western North PacificOcean and the region surrounding the Philippine Islands is shown in Fig. 4.34. More de-tailed seasonal charts of surface salinity for February and August are shown by Figs. 4.35(a)& (b) for the regions immediately adjacent to the Philippines.
To the east of the Philippines, salinities occur that are higher than 34.0 ppm (partsper thousand). Salinity values higher than this extend through the Bashi Channel to thenorth of Luzon into the South China Sea, and bring 34.4 ppm values close to the shorenorth of 12°N during February. In August 34.4 ppm values are pushed offshore and arereplaced by lower salinity values adjacent to the philippines. Then, the 34.0 ppm valuestretches from Luzon to Taiwan, in the north; and 34.0 ppm value is in the Basilan Straitsouthward from Mindanao. In the Celebes (Sulawesi) Sea southwest of Mindanao, salinityvalues are from 34.0 to 33.0 ppm in February; in August, values there are greater than34.0 ppm.
In the Bashi Channel north of Luzon, the Northeast Monsoon in February brings highersalinity values westward into the extreme northern part of the South China Sea.
90IN 1 1 1 1 a I ! I I I I L0I J 90-N
"--330.0 30.06
60. -- 3260
32. IJ2, 11-- r -25 - 0• _•"~33 -•5;"1 _ ,-32JS
Figure~~~~~~~~3. 34.4 AnulManS3nty.p5 at•eSa uf
(adpte frmLviu0192)
35257-::352' 3-21- 356
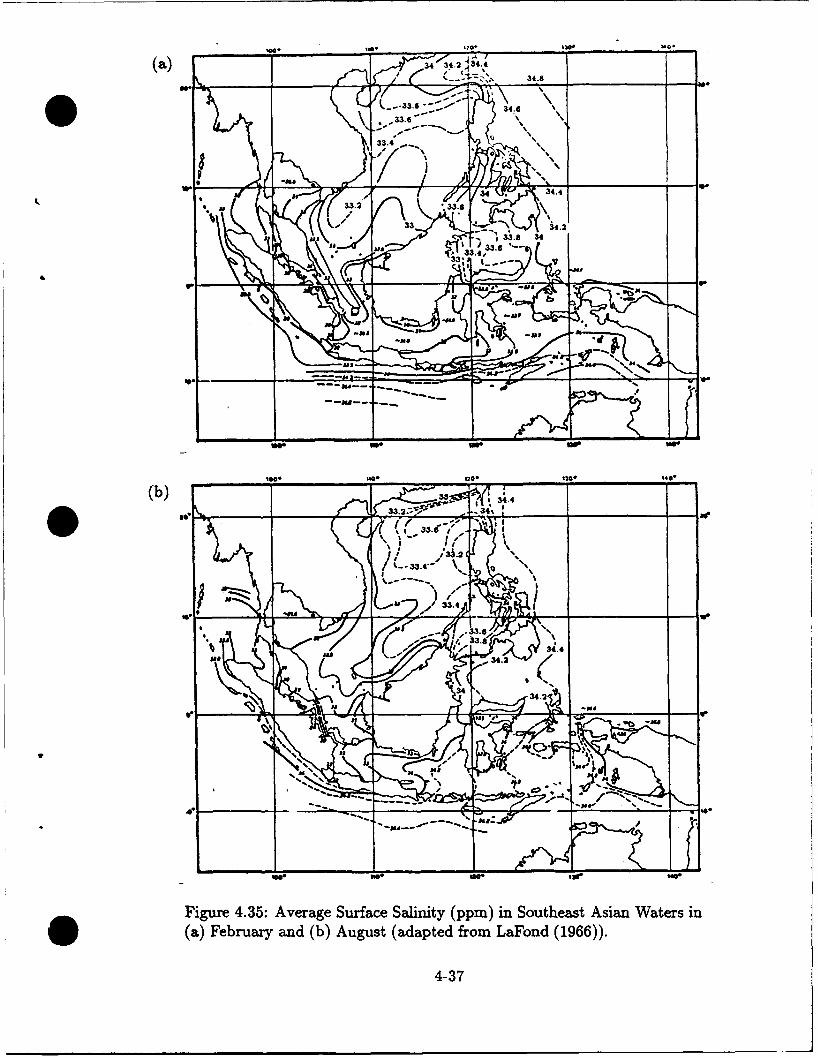
(a)34o3423
•4• 14b* •'0e )Oe 0*
34.8.
33_ 34 , • ...
" "33.6---- -
Figure 4.35: Average Surface Salinity (ppm) in Southeast Asian Waters ine (a) February and (b) August (adapted from LaFond (1966)).
4-37
5. Salinity Variation with Depth. A schematic cross-section in the Philippine Sea fromthe equator to Taiwan (Formosa) shows the different salinity features in the upper 1200 me-ters of ocean (see Fig. 4.36). The uppermost layer features a salinity maximum that variesfrom 80 to 200 meters depth. Sections prepared from observations show the complexity ofsalinity distribution in these upper layers; the vertical section across the Mindanao Currentat 7*30'N (eastward from Station 3234 through Station 3240, as shown by Fig. 4.37(a))shows this maximum (>34.8 ppm) occurring at about 100 meters depth. Further south,in a section extending to the northwest from Halmahera toward Mindanao (stations 3226through 3233 in Fig. 4.37(b)), this maximum appears also at about 100 meters. In bothcases, there is a pronounced salinity gradient, with values increasing with depth, north-ward from 50N; this gradient region starts at about 50 meters, associated with the strongthermocline also present. This maximum salinity feature also is displayed along 130°Etaken by US/PRC Cruises 1 and 2 (see Fig. 4.22 for station locations and time).
A salinity minimum occurs below the maximum region; it is centered at about 400 me-ters depth at 5*N, and then deepens toward the north to 650 meters at 20°N (see Fig. 4.36).This feature is especially pronounced in the US/PRC sections along 1300E, reaching valuesat the core below 34.3 ppm north of about 15*N (see Figs. 4.38(a) and 4.38(b)).
These salinity features are illustrated also on a section made across the northern Philip-pine Sea region by Cruise CHIPS-1 of the Institute of Oceanography, National TaiwanUniversity in May-June 1985, eastward from Taiwan along about 21°45'N (Fig. 4.39). Thelarge section extends from the surface to 5000 db (read "5000 meters depth"); the upper1000 db (1000 meters) is shown with an enlarged vertical scale in the upper part of thefigure. A salinity maximum of about 34.9 ppm occurs centered at about 200 meters, whilethe salinity minimum, at or below 34.3 ppm, appears at 600-700 meters.
44-38
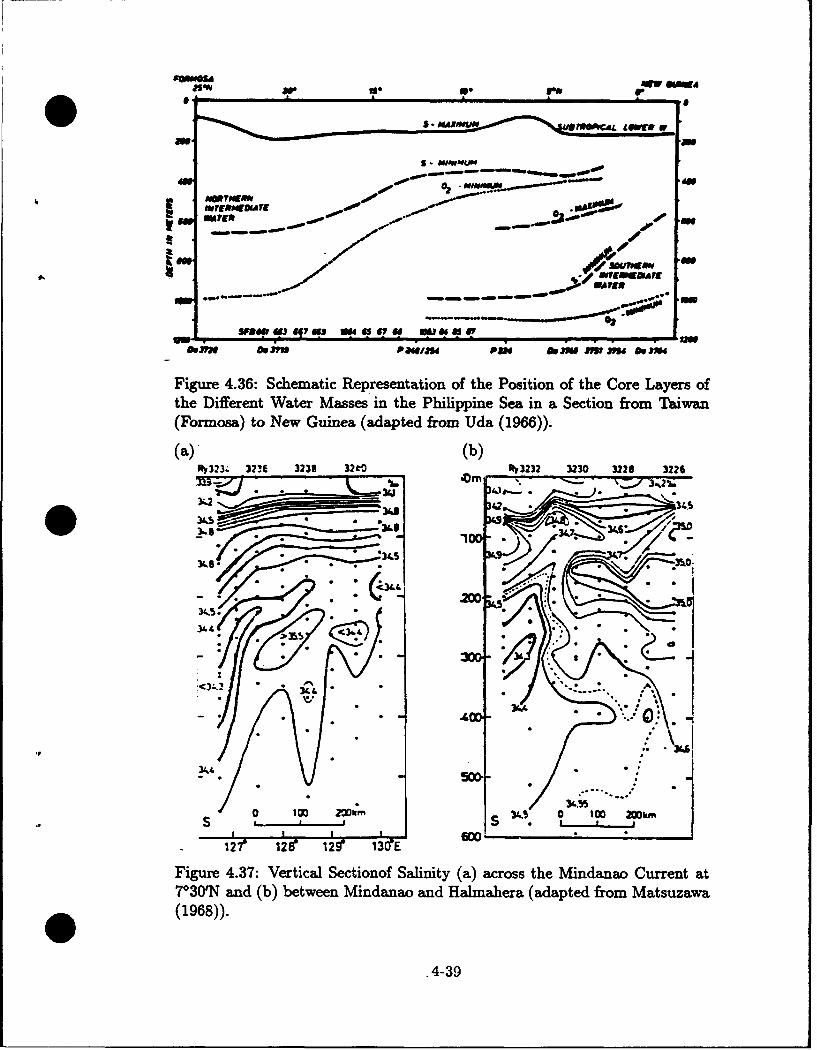
". *~A
dowie~ 60,V 4SJUI . --. IMEDI - 51 "1" .35
Figure 4.36: Schematic Representation of the Position of the Core Layers ofthe Different Water Masses in the Philippine Sea in a Section from Taiwan(Formosa) to New Guinea (adapted from Uda (1966)).
(a) (b)
4Lm SK W
- . •* ,OO • "
Wr " I Irlm*
3.,/ " .
- .. 'A"
on 2 0m8! I0 65 ) a
- 127 12 129" 13€ --
Figure 4.37: Vertical Sectionof Salinity (a) across the Mindanao Current at7°30oN and (b) between Mindanao and Haemahera (adapted from Matsuzawa(1968)).
.4-39
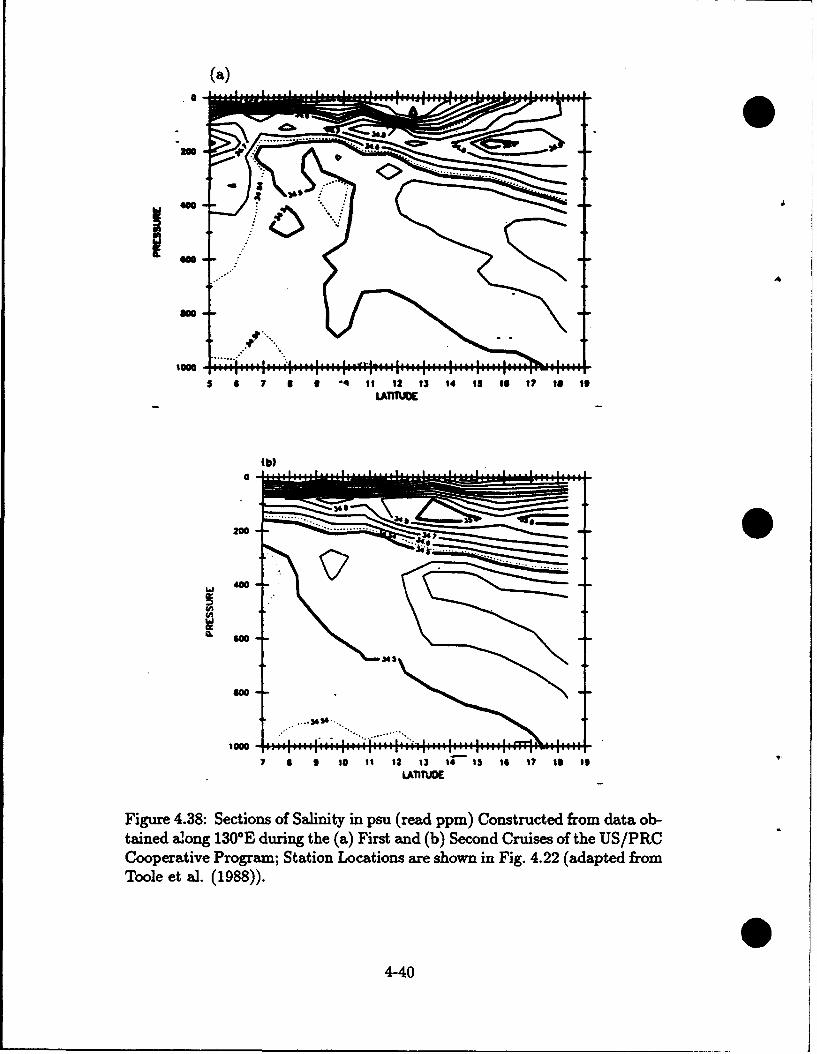
(a)
.... ............
(b)
hJS
300
400
S7 11 I0 14 it 12 13 14 13 if 17 14 It
.... .... , '.
.......... .................
LA1TITUDE
Figure 4.38: Sections of Salinity in psu (read ppm) Constructed from data ob-tained along 130°E during the (a) First and (b) Second Cruises of the US/PROCooperative Program; Station Locations are shown in Fig. 4.22 (adapted fromToole et al. (1988)).
4-40
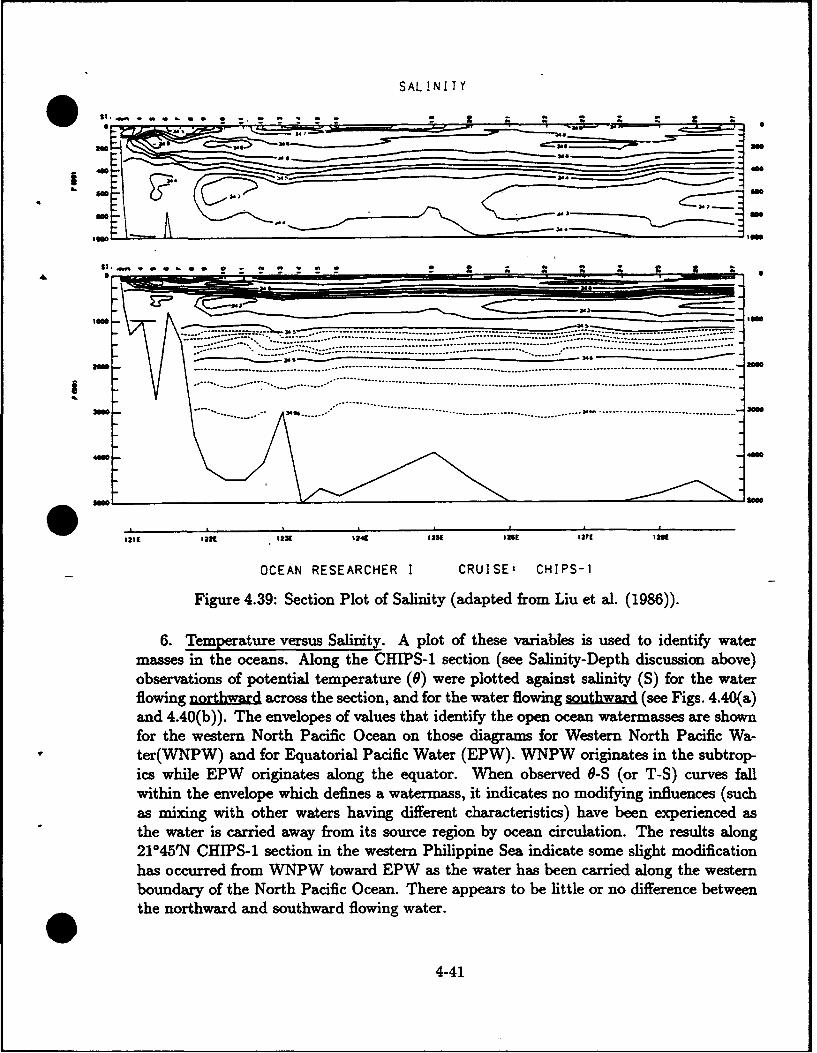
SALINITY
$ I . ,,,.• .• , ,...........,,, , .. ........ ...........
*300
3.0.
.............. .. . . . . . . . . . . . . ......... ... ... . ........... . . . . . .. .. . .1
a 0-
-----------------------------------------. . ... .......... . . . .....
2416°--------- --. ... -.... ....................................................................................................................................
380-------- . . . . .... ......................................................................... .. ......................... 3
12,1 I221 13l s24t 125t2 127E Il6l
OCEAN RESEARCHER I CRUISE: CHIPS-i
Figure 4.39: Section Plot of Salinity (adapted from Liu et al. (1986)).
6. Temperature versus Salinity. A plot of these variables is used to identify watermasses in the oceans. Along the CHIPS-1 section (see Salinity-Depth discussion above)observations of potential temperature (0) were plotted against salinity (S) for the waterflowing northward across the section, and for the water flowing southward (see Figs. 4.40(a)and 4.40(b)). The envelopes of values that identify the open ocean watermasses are shownfor the western North Pacific Ocean on those diagrams for Western North Pacific Wa-ter(WNPW) and for Equatorial Pacific Water (EPW). WNPW originates in the subtrop-ics while EPW originates along the equator. When observed 8-S (or T-S) curves fallwithin the envelope which defines a watermass, it indicates no modifying influences (suchas mixing with other waters having different characteristics) have been experienced asthe water is carried away from its source region by ocean circulation. The results along2145'N CHIPS-1 section in the western Philippine Sea indicate some slight modificationhas occurred from WNPW toward EPW as the water has been carried along the westernboundary of the North Pacific Ocean. There appears to be little or no difference betweenthe northward and southward flowing water.
4-41
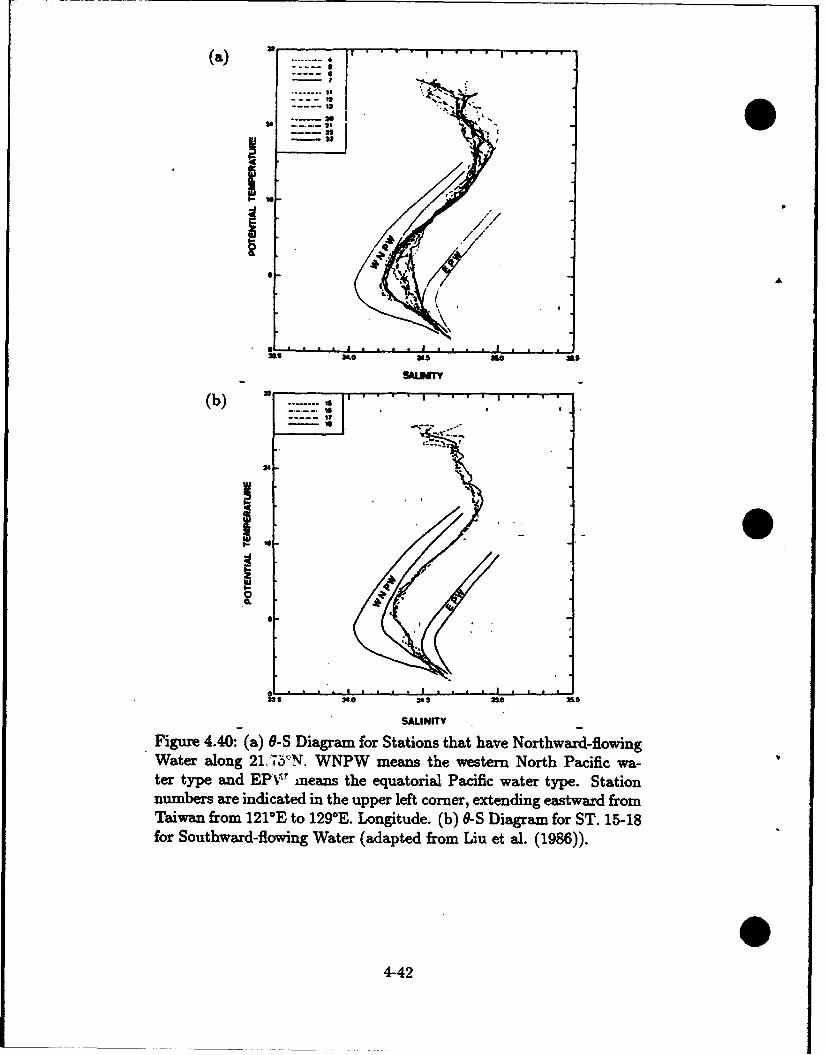
(a) .... .
l-1 .53
24 -. -- . 9
----- 32
-23
is
q4
A S I0 33 as As
SAUNNY
(b)
SAlINIfy
Figure 4.40: (a) O-S Diagram for Stations that have Northward-flowingWater along 21.75'N. WNPW means the western North Pacific wa-ter type and EPV17 means the equatorial Pacific water type. Stationnutmbers are indicated in the upper left comner, extending eastward fromTaiwan from 121°E to 129°E. Longitude. (b) O-S Diagram for ST. 15-18for Southward-flowing Water (adapted from Liu et al. (1986)).
4-4it.4.,t
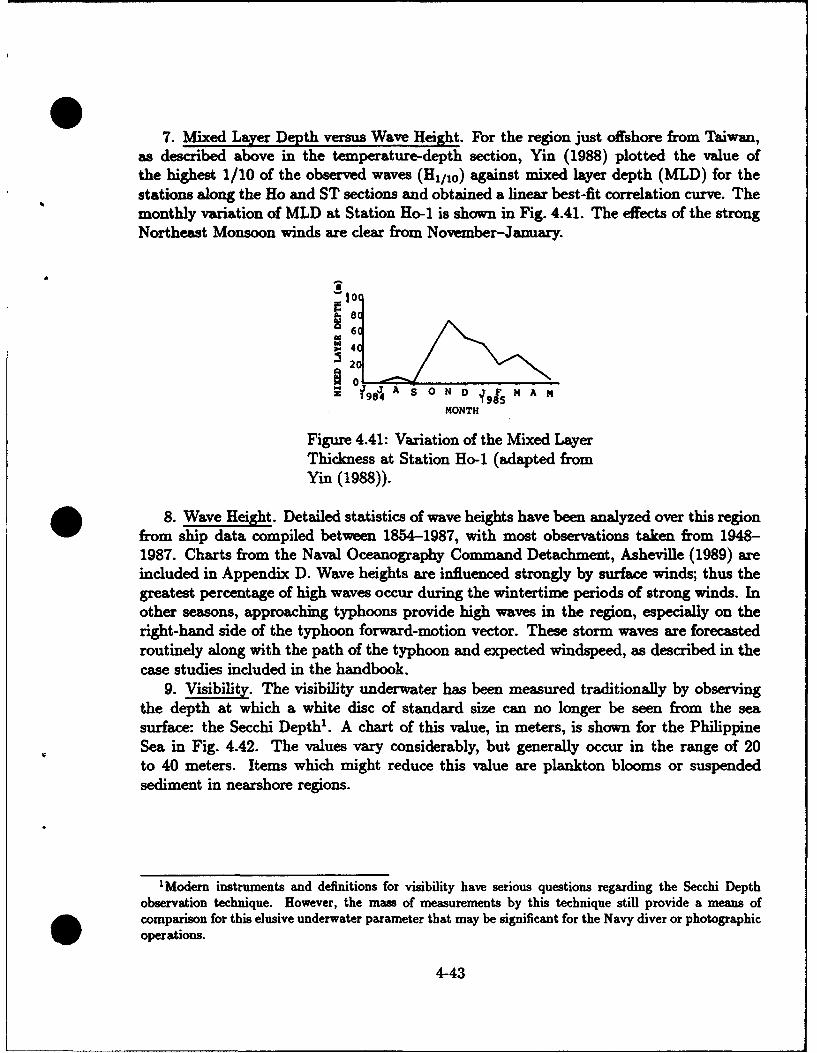
7. Mixed Layer Depth versus Wave Height. For the region just offshore from Taiwan,as described above in the temperature-depth section, Yin (1988) plotted the value ofthe highest 1/10 of the observed waves (H1 /10) against mixed layer depth (MLD) for thestations along the Ho and ST sections and obtained a linear best-fit correlation curve. Themonthly variation of MLD at Station Ho-1 is shown in Fig. 4.41. The effects of the strongNortheast Monsoon winds are clear from November-January.
6€
• 2 C
SS9OA oN M A NMONTH
Figure 4.41: Variation of the Mixed LayerThickness at Station Ho-1 (adapted fromYin (1988)).
8. Wave Height. Detailed statistics of wave heights have been analyzed over this regionfrom ship data compiled between 1854-1987, with most observations taken from 1948-1987. Charts from the Naval Oceanography Command Detachment, Asheville (1989) areincluded in Appendix D. Wave heights are influenced strongly by surface winds; thus thegreatest percentage of high waves occur during the wintertime periods of strong winds. Inother seasons, approaching typhoons provide high waves in the region, especially on theright-hand side of the typhoon forward-motion vector. These storm waves are forecastedroutinely along with the path of the typhoon and expected windspeed, as described in thecase studies included in the handbook.
9. Visibility. The visibility underwater has been measured traditionally by observingthe depth at which a white disc of standard size can no longer be seen from the seasurface: the Secchi Depth1 . A chart of this value, in meters, is shown for the PhilippineSea in Fig. 4.42. The values vary considerably, but generally occur in the range of 20to 40 meters. Items which might reduce this value are plankton blooms or suspendedsediment in nearshore regions.
'Modern instruments and definitions for visibility have serious questions regarding the Secchi Depthobservation technique. However, the mass of measurements by this technique still provide a means ofcomparison for this elusive underwater parameter that may be significant for the Navy diver or photographicoperations.
4-43
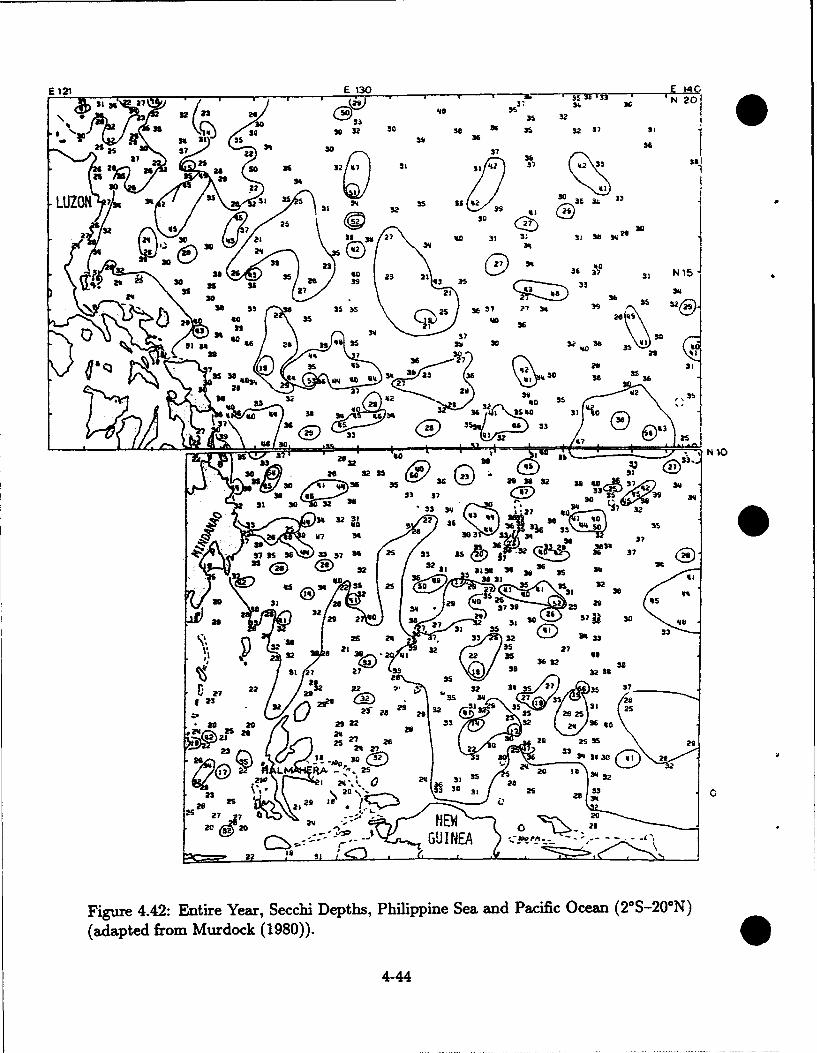
E 121 E 130 - E431 •' /7 2 (23 '6 SO 3o,3+ 34 'N 20
302 30 30 32 '$
42 36
302 s so 9 23 37 ý 1S
31 35 536 3 1 3.
L 31 3 4 32 as so+1 S
21 3WO91 5 27 go 31 3 1 31 $x
so 2 35 33 3
0D0 2035 go 3 2a 31 N3o '33 35
5. 5 35 2720 2 C3 -24 55 WZ(36
-34 33 3355 2 36 37 ?7 34 " 51
2s Is, 36
to 4 3O1 25 3
'5 so W 27 SO_ j 3
SO I $ N ? • , .!
2 239. 36 3b+.. , , : 30 - .:0
331 4 98 1 4
30 38 3 6 !0% 36 meo3 31 40
37\~5 36(0 S37413
30
4-6/
I85 36 3S
2 1-
20 32 3036?5
25 2 7 26 38320
12 13 2 9 3
Fiue44: nieYax e iDets hlipn e an Pacfi Ocea (20 S-20N
(aape fro MSrim (1980)). S
4-44 2
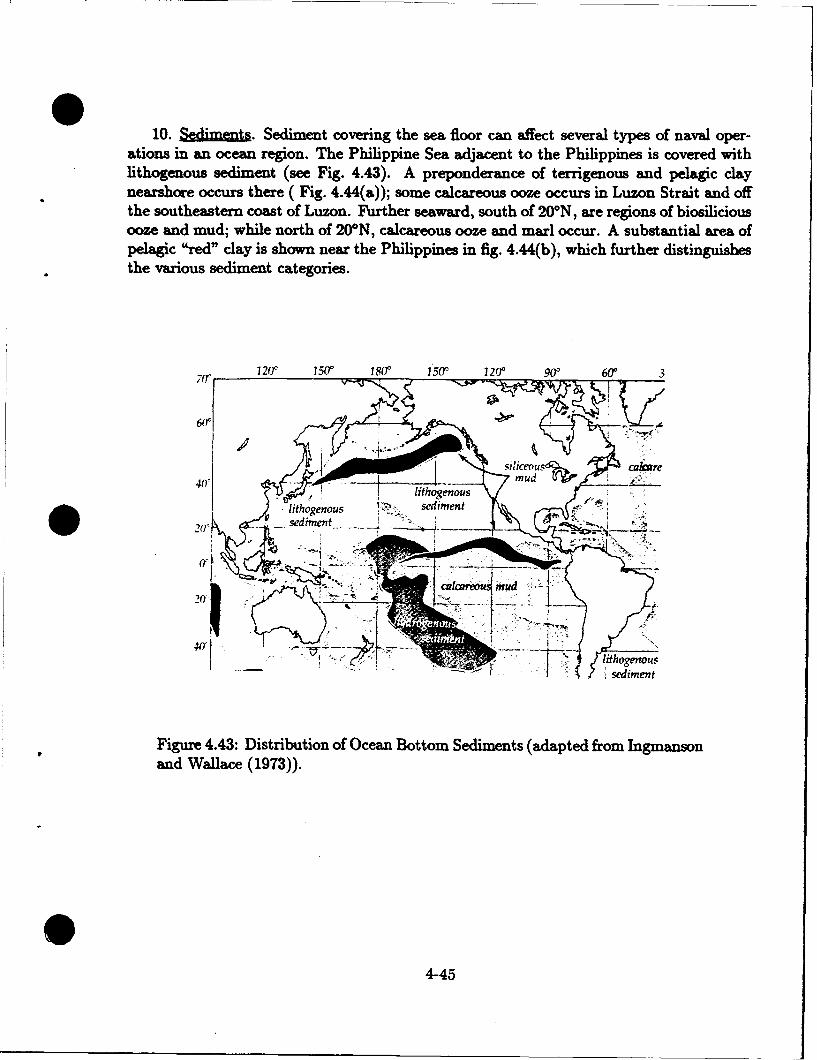
10. Sdiment. Sediment covering the sea floor can affect several types of naval oper-ations in an ocean region. The Philippine Sea adjacent to the Philippines is covered withlithogenous sediment (see Fig. 4.43). A preponderance of terrigenous and pelagic claynearshore occurs there ( Fig. 4.44(a)); some calcareous ooze occurs in Luzon Strait and offthe southeastern coast of Luzon. Further seaward, south of 20*N, are regions of biosiliciousooze and mud; while north of 20*N, calcareous ooze and marl occur. A substantial area ofpelagic "red" clay is shown near the Philippines in fig. 4.44(b), which further distinguishesthe various sediment categories.
12W" 150P 180r 150r 12(" 90" 60" 3
4(r"lithogenous r;•- sediment
S..ssediment
261
Figure 4.43: Distribution of Ocean Bottom Sediments (adapted from Ingmansonand Wallace (1973)).
4-45
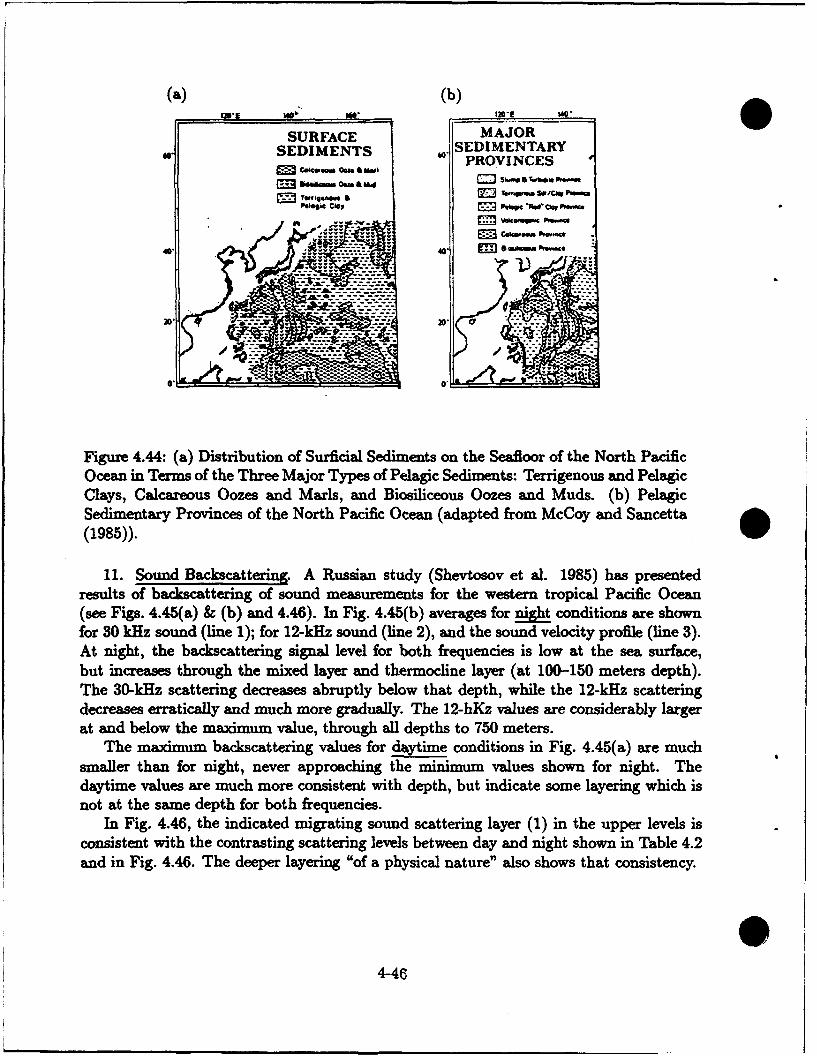
(a) (b)
SURFACE MAJORSEDIMENTS . SEDIMENTARY
PROVINCES
M-1 Su&rw Cae6M a Mh Se aio Aothe N POe M eajtWo a TewrrA nounCea PWi
PCC uin Clay al1 -nee aft 0uds.(
n~ ~~ Calm.. -c tem
0.0
Figure 4.44: (a) Distribution of Surficial Sediments on the Seafloor of the North PacificOcean in Terms of the Three Major Types of Pelagic Sedime~nts: Terrigenous and PelagicClays, Calcareous Oozes and Marls, and Biosiliceous Oozes and Muds. (b) PelagicSedimentary Provinces of the North Pacific Ocean (adapted from McCoy and Sancetta(1985)).
11. Sound Backscattering. A Russian study (Shevtosov et al. 1985) has presentedresults of backscattering of sound measurements for the western tropical Pacific Ocean(see Figs. 4.45(a) & (b) and 4.46). In Fig. 4.45(b) averages for night conditions are shownfor 30 kHz sound (line 1); for 12-kHz sound (line 2), and the sound velocity profile (line 3).At night, the backscattering signal level for both frequencies is low at the sea surface,but increases through the mixed layer and thermocline layer (at 100-150 meters depth).The 30-kHz scattering decreases abruptly below that depth, while the 12-kHz scatteringdecreases erratically and much more gradually. The 12-hKz values are considerably largerat and below the maximum value, through all depths to 750 meters.
The maximum backscattering values for daytime conditions in Fig. 4.45(a) are muchsmaller than for night, never approaching the minimum values shown for night. Thedaytime values are much more consistent with depth, but indicate some layering which isnot at the same depth for both frequencies.
In Fig. 4.46, the indicated migrating sound scattering layer (1) in the upper levels isconsistent with the contrasting scattering levels between day and night shown in Table 4.2and in Fig. 4.46. The deeper layering "of a physical nature" also shows that consistency.
4-46
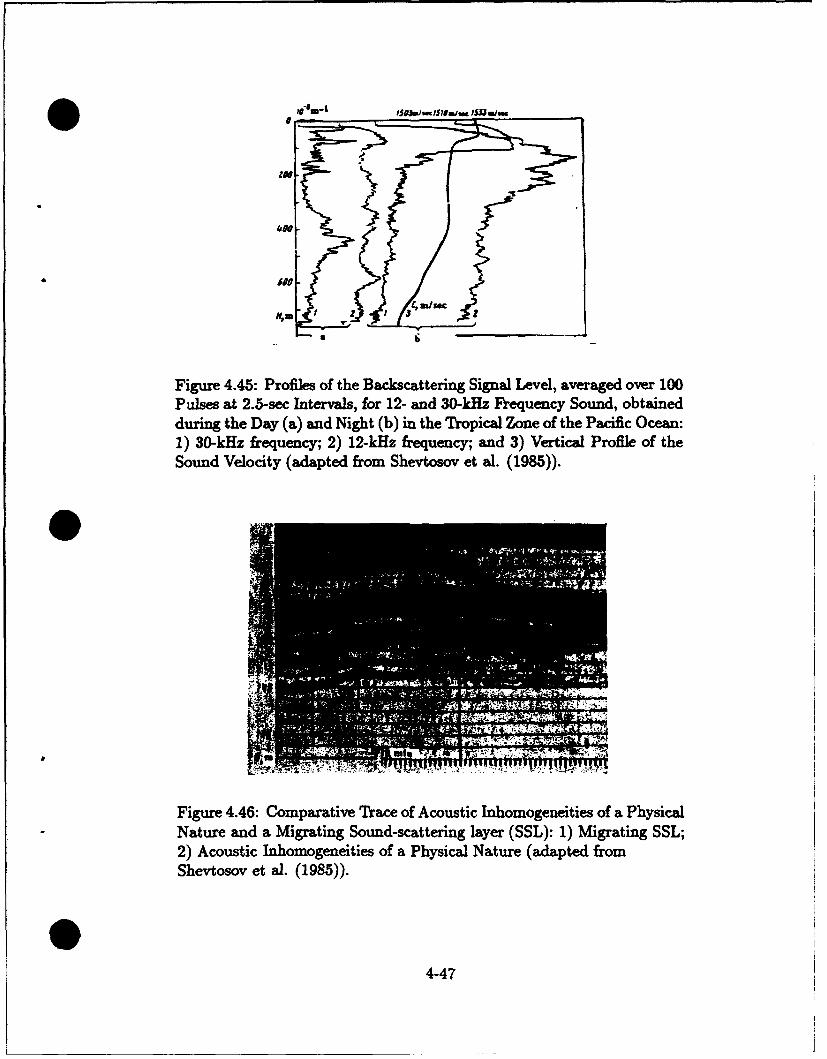
M -
Figure 4.45: Profiles of the Backscattering Signal Level, averaged over 100Pulses at 2.5-sec Intervals, for 12- and 30-kHz Frequency Sound, obtainedduring the Day (a) and Night (b) in the Tropical Zone of the Pacific Ocean:1) 30-kHz frequency; 2) 12-kHz frequency; and 3) Vertical Profile of theSound Velocity (adapted from Shevtosov et al. (1985)).
Figure 4.46: Comparative Trace of Acoustic Inhomogeneities of a PhysicalNature and a Migrating Sound-scattering layer (SSL): 1) Migrating SSL;2) Acoustic Inhomogeneities of a Physical Nature (adapted fromShevtosov et al. (1985)).
4-47
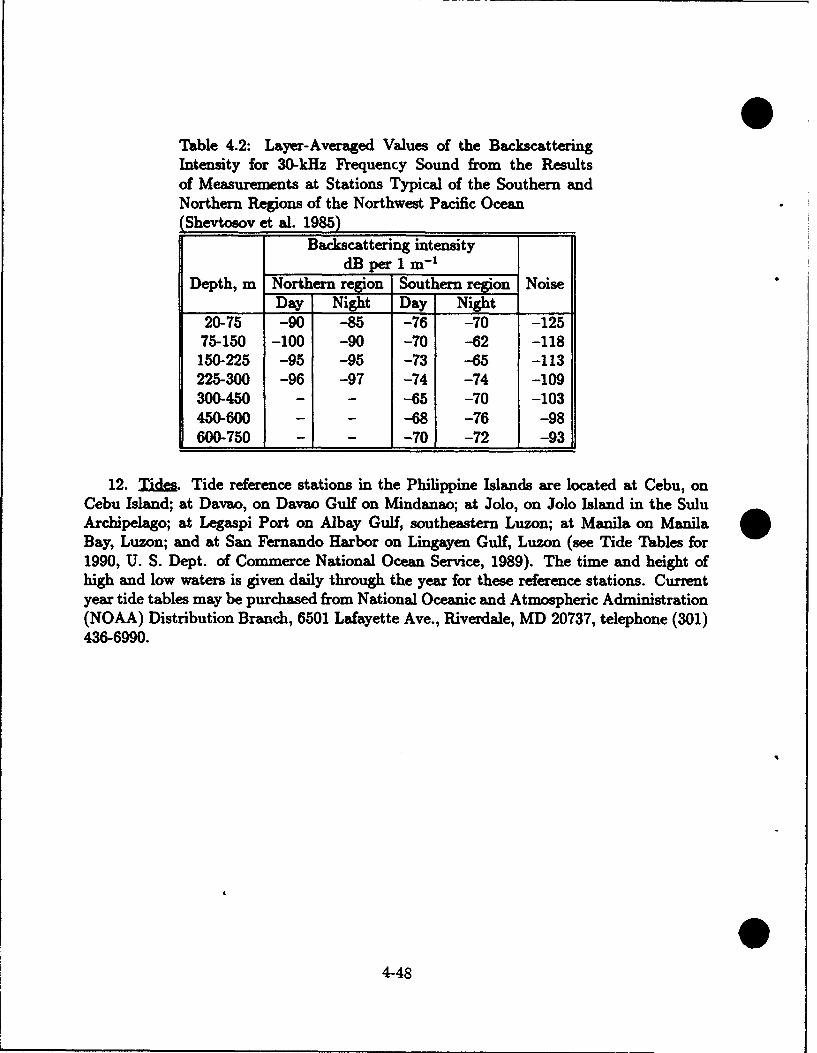
Table 4.2: Layer-Averaged Values of the BackscatteringIntensity for 30-kHz Frequency Sound from the Resultsof Measurements at Stations Typical of the Southern andNorthern Regions of the Northwest Pacific Ocean(Shevtosov et al. 1985)
Backscattering intensitydB per 1 m-1
Depth, m Northern region Southern region NoiseDay Night Day Night
20-75 -90 -85 -76 -70 -12575-150 -100 -90 -70 -62 -118150-225 -95 -95 -73 -65 -113225-300 -96 -97 -74 -74 -109300-450 - - -65 -70 -103450-600 - - -68 -76 -98600-750 - - -70 -72 -93
12. Tides. Tide reference stations in the Philippine Islands are located at Cebu, onCebu Island; at Davao, on Davao Gulf on Mindanao; at Jolo, on Jolo Island in the SuluArchipelago; at Legaspi Port on Albay Gulf, southeastern Luzon; at Manila on ManilaBay, Luzon; and at San Fernando Harbor on Lingayen Gulf, Luzon (see Tide Tables for1990, U. S. Dept. of Commerce National Ocean Service, 1989). The time and height ofhigh and low waters is given daily through the year for these reference stations. Currentyear tide tables may be purchased from National Oceanic and Atmospheric Administration(NOAA) Distribution Branch, 6501 Lafayette Ave., Riverdale, MD 20737, telephone (301)436-6990.
4-48
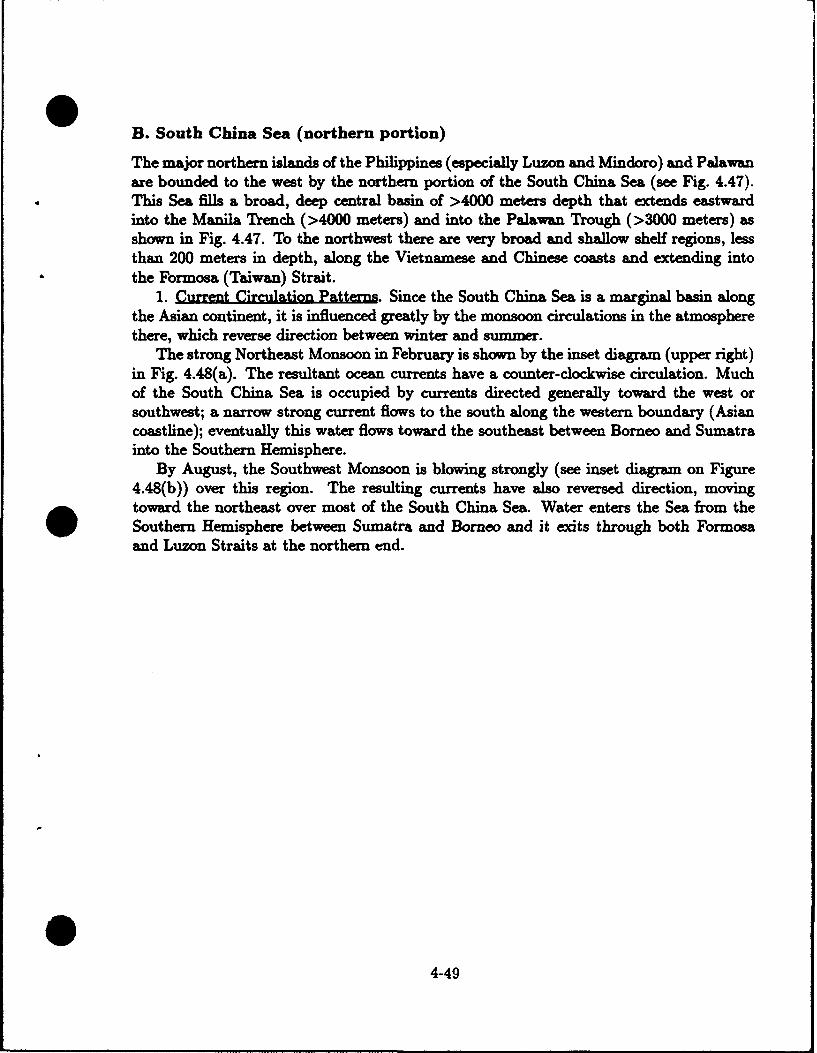
@1
B. South China Sea (northern portion)
The major northern islands of the Philippines (especially Luzon and Mindoro) and Palawanare bounded to the west by the northern portion of the South China Sea (see Fig. 4.47).This Sea fills a broad, deep central basin of >4000 meters depth that extends eastwardinto the Manila Trench (>4000 meters) and into the Palawan Trough (>3000 meters) asshown in Fig. 4.47. To the northwest there are very broad and shallow shelf regions, lessthan 200 meters in depth, along the Vietnamese and Chinese coasts and extending intothe Formosa (Taiwan) Strait.
1. Current Ciruagtion Patterns. Since the South China Sea is a marginal basin alongthe Asian continent, it is influenced greatly by the monsoon circulations in the atmospherethere, which reverse direction between winter and summer.
The strong Northeast Monsoon in February is shown by the inset diagram (upper right)in Fig. 4.48(a). The resultant ocean currents have a counter-clockwise circulation. Muchof the South China Sea is occupied by currents directed generally toward the west orsouthwest; a narrow strong current flows to the south along the western boundary (Asiancoastline); eventually this water flows toward the southeast between Borneo and Sumatrainto the Southern Hemisphere.
By August, the Southwest Monsoon is blowing strongly (see inset diagram on Figure4.48(b)) over this region. The resulting currents have also reversed direction, moving
* toward the northeast over most of the South China Sea. Water enters the Sea from theSouthern Hemisphere between Sumatra and Borneo and it exits through both Formosaand Luzon Straits at the northern end.
04-49
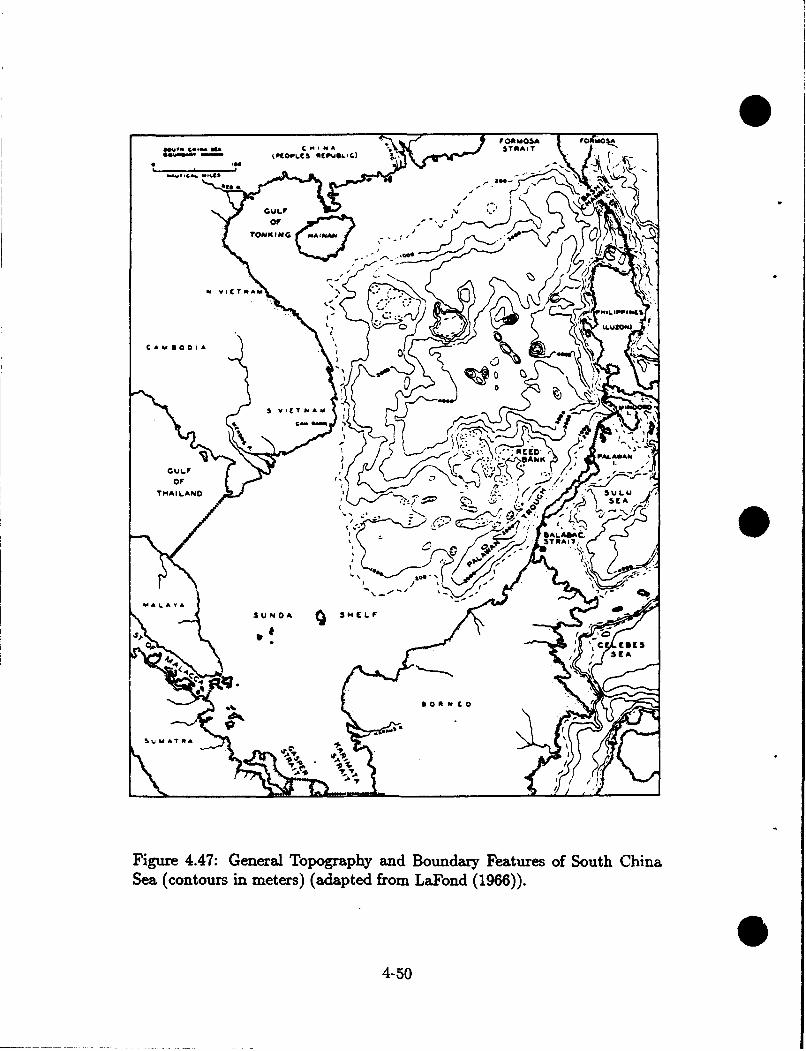
CHMA FORMOSA f oAMo5AliiemflillIll C iI A STRAIT
lllA m~•L'ClOPWLCS aclPuglc).* .X
. -. ,a..-uJ*•ii
ago JL
GULF
TONK ING
0-e
C HA mCIL A S
I A%
3 U-,, , 0 A 5 Ht EL
Figure. 4.4: Ge" "" a
SeGcnousiULtr)(datdfomLFn (1966)).AN
4- 50 r/1 STRAI.AlA
O• *. - "' " - -,
4, / Oi m[O. • E
Figure 4.47: General Topography and Boundary Features of South ChinaSea (contours in meters) (adapted from LaFond (1966)).
4-50
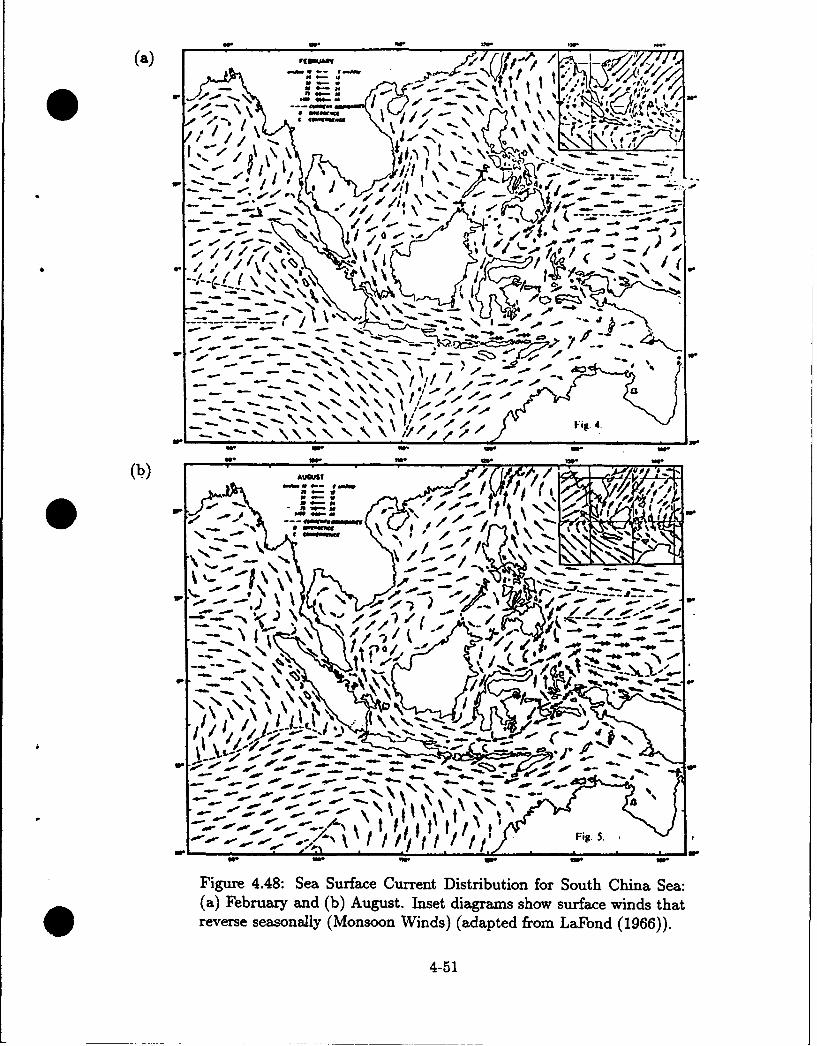
wi .9. U. ,l.-
(a) ,,*
*' ,. :. - *& , 'p'\\. 'F ,
rt.c 1 / -\-
".. .- a.-, t , - " -_-= I----- • ". a, < ,• •,-- _ - --*- - i - -.
Fig 4. -
.- vs-
".- " .-.- i. • .. ". -- ,, " -. .~~
- ._V .
',-",l, .-.--. -- - - - -
--- "-_, _ -l.. ,
- . -,a- a-, ,-.. -.. -•. -2 .. .- '..,- . a..- •-- ,
a -a
-," 9 , 1-,.., / '91 Fie. S
4-16
.9. u.P
(1.?)al AUJI/ /,-A,- t t
-e: -- / I Fig 5
I ..
Va-~ tv t
(a) Ferur and (b) Auut Ine digasso uraewnstarevrs sesnal (Mnso Winds (aape fro L n (166)
~... -~4-51
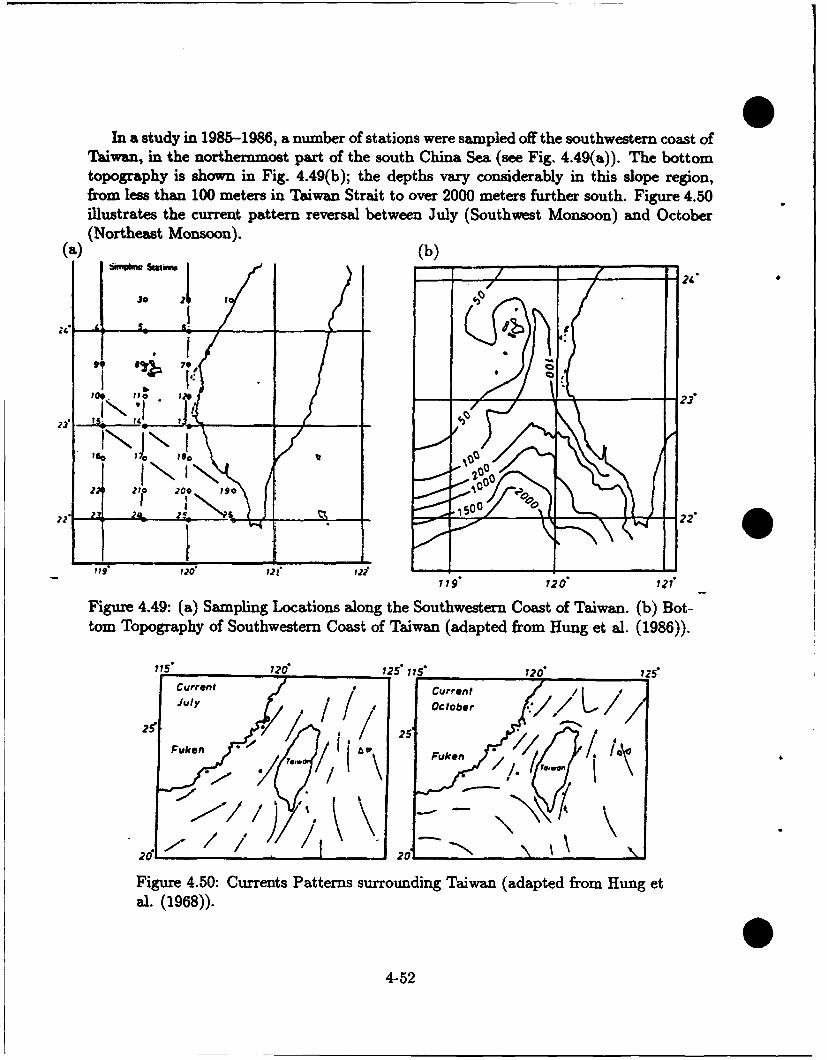
In a study in 1985-1986, a number of stations were sampled off the southwestern coast ofTaiwan, in the northernmost part of the south China Sea (see Fig. 4.49(a)). The bottomtopography is shown in Fig. 4.49(b); the depths vary considerably in this slope region,from less than 100 meters in Taiwan Strait to over 2000 meters further south. Figure 4.50illustrates the current pattern reversal between July (Southwest Monsoon) and October(Northeast Monsoon).(a) (b)
"S o .- f Ic 24
30 2ii'
2Y is It•NI " I,+0 Of1 r ,++
119 120
Figure 4.49: (a) Sampling Locations along the Southwestern Coast of Taiwan. (b) Bot-tom Topography of Southwestern Coast of Taiwan (adapted from Hung et al. (1986)).
115" 12o" 125" 15" 120" 125"CurrentCuen
ii +' . :) " i /
Fuken Fuken/ /
1?* 121 ?2 EL* ~
,o/ l i ]III-~ -- \
209 120 201
Figure 4.50: Currents Patterns surrounding Taiwan (adapted from Hung etal. (1968)).
"4-52t
4-52
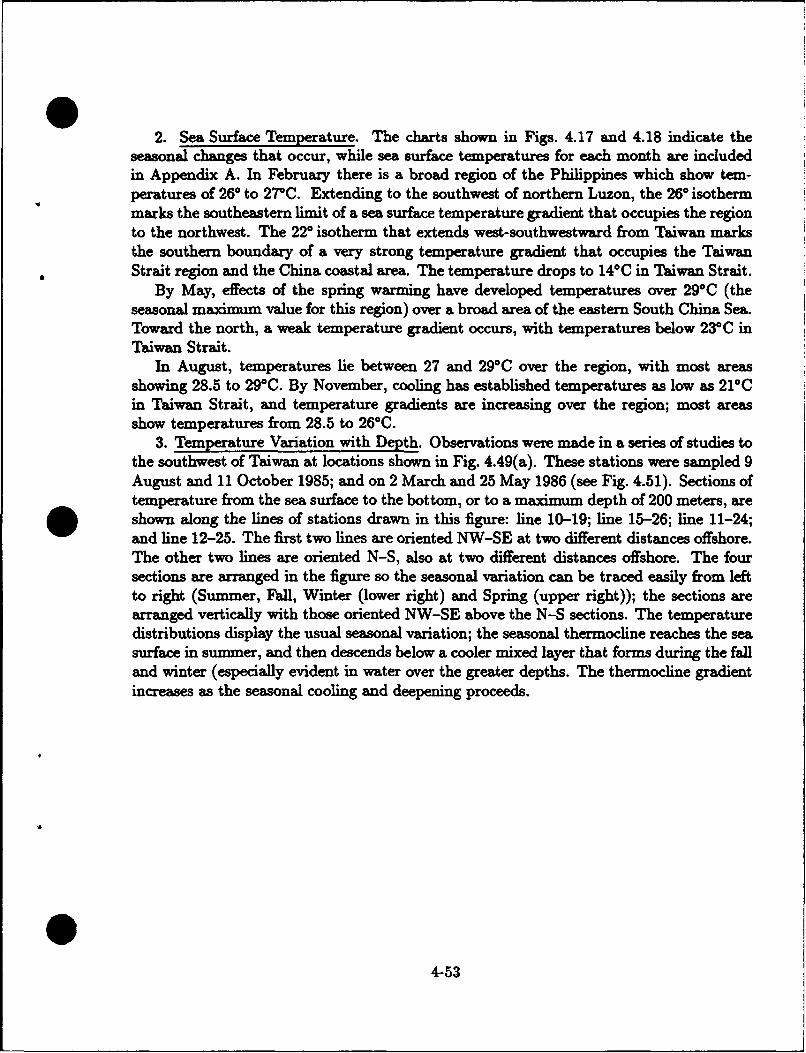
2. Sea Surface Temperature. The charts shown in Figs. 4.17 and 4.18 indicate theseasonal changes that occur, while sea surface temperatures for each month are includedin Appendix A. In February there is a broad region of the Philippines which show tem-peratures of 260 to 270C. Extending to the southwest of northern Luzon, the 260 isothermmarks the southeastern limit of a sea surface temperature gradient that occupies the regionto the northwest. The 220 isotherm that extends west-southwestward from Taiwan marksthe southern boundary of a very strong temperature gradient that occupies the TaiwanStrait region and the China coastal area. The temperature drops to 140C in Taiwan Strait.
By May, effects of the spring warming have developed temperatures over 290C (theseasonal maximum value for this region) over a broad area of the eastern South China Sea.Toward the north, a weak temperature gradient occurs, with temperatures below 23°C inTaiwan Strait.
In August, temperatures lie between 27 and 290C over the region, with most areasshowing 28.5 to 29°C. By November, cooling has established temperatures as low as 210Cin Taiwan Strait, and temperature gradients are increasing over the region; most areasshow temperatures from 28.5 to 260C.
3. Temperature Variation with Depth. Observations were made in a series of studies tothe southwest of Taiwan at locations shown in Fig. 4.49(a). These stations were sampled 9August and 11 October 1985; and on 2 March and 25 May 1986 (see Fig. 4.51). Sections oftemperature from the sea surface to the bottom, or to a maximum depth of 200 meters, areshown along the lines of stations drawn in this figure: line 10-19; line 15-26; line 11-24;and line 12-25. The first two lines are oriented NW-SE at two different distances offshore.The other two lines are oriented N-S, also at two different distances offshore. The foursections are arranged in the figure so the seasonal variation can be traced easily from leftto right (Summer, Fall, Winter (lower right) and Spring (upper right)); the sections arearranged vertically with those oriented NW-SE above the N-S sections. The temperaturedistributions display the usual seasonal variation; the seasonal thermocline reaches the seasurface in summer, and then descends below a cooler mixed layer that forms during the falland winter (especially evident in water over the greater depths. The thermocline gradientincreases as the seasonal cooling and deepening proceeds.
4-53
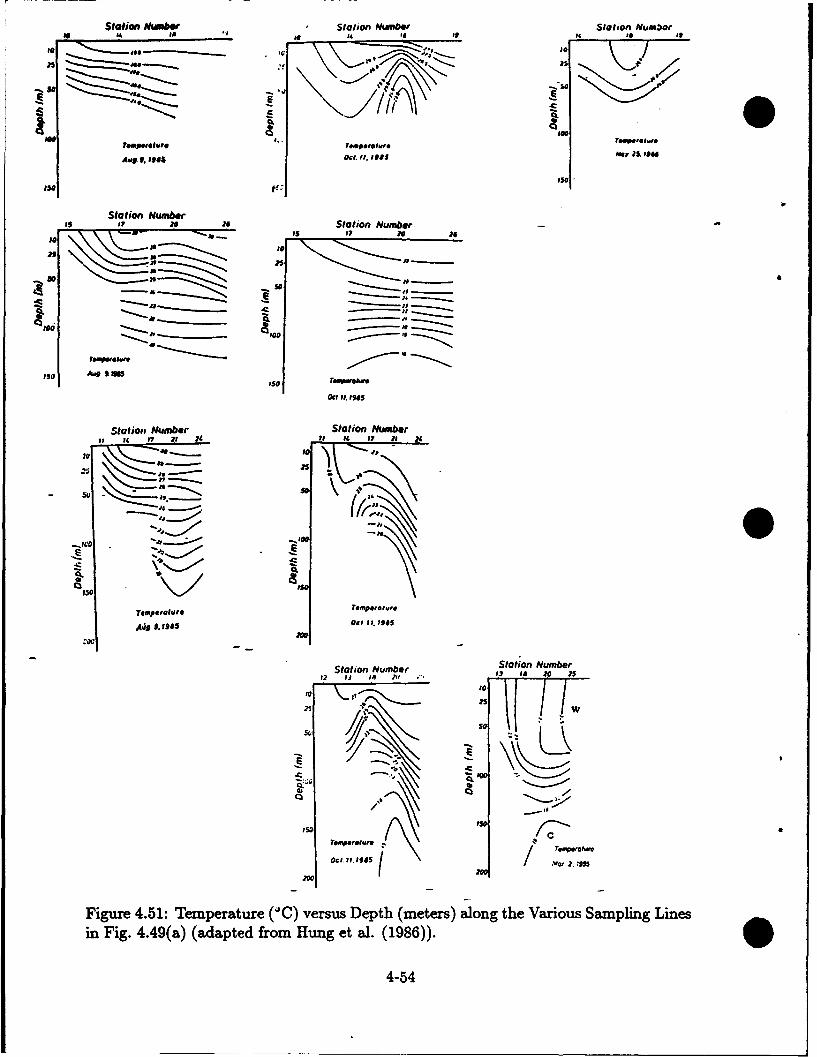
Station Number Station NuRefr Station Number
I.Q
/I .- SemeeetA..p.85u ITe CL..e Sa15 mi irS. 888
ls.
PS o7 N 28 Station Number9 no
Awp 9. 89830 act. It #sto
Station Number Station Mumf
Iss - 2I. 1P
aof
Statin NulberStation Numberof 14 7 Mr ,", it 14 10, 25i
t,
a* - 10as
A4 9.1905 Oc t of. 19 6S// epecw
,00 '1
0'
Fiue45:Tmertr )vru De.pth (m~etr)aogheViusSminLnsin ig 4.49(a) OaatdcrmHn t al. (1986).
Station Number Station Number12 12 18 21" to 5 N 2
- . 50
QS
ISO / '
Figure 4.51: Temperature ('IC) versus Depth (meters) along the Various Sampling Linesin Fig. 4.49(a) (adapted from Hung et al. (1986)).
4-54
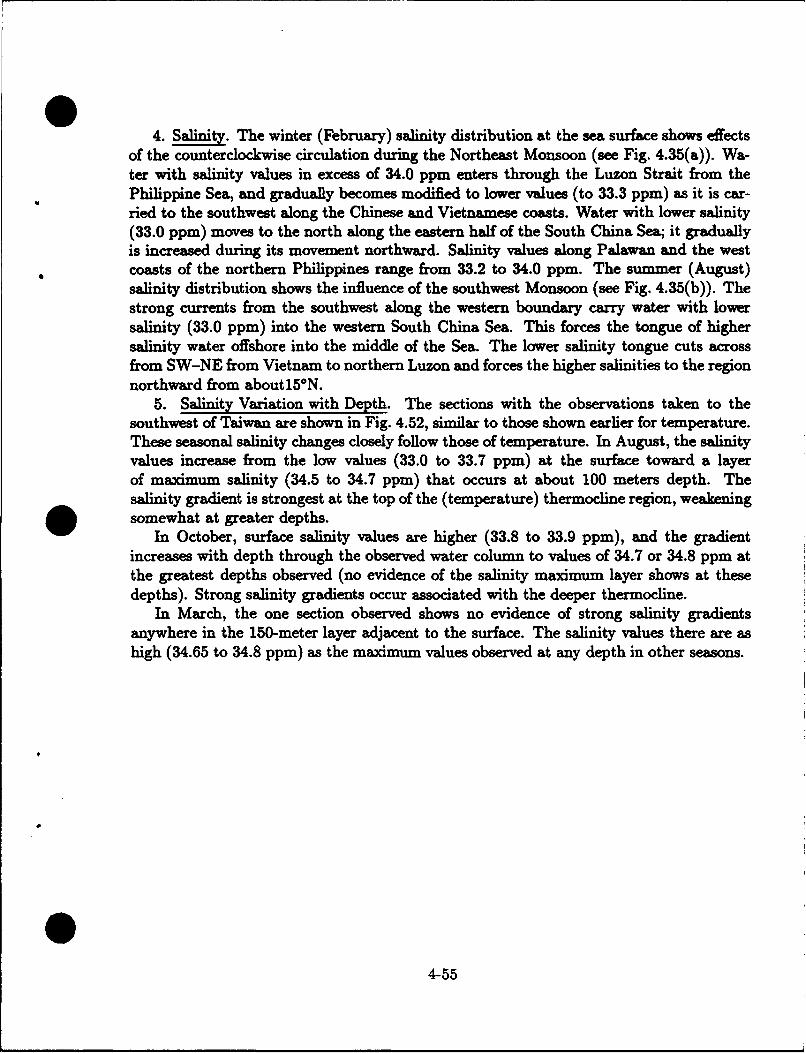
04. Salinit. The winter (February) salinity distribution at the sea surface shows effects
of the counterclockwise circulation during the Northeast Monsoon (see Fig. 4.35(a)). Wa-ter with salinity values in excess of 34.0 ppm enters through the Luzon Strait from thePhilippine Sea, and gradually becomes modified to lower values (to 33.3 ppm) as it is car-ried to the southwest along the Chinese and Vietnamese coasts. Water with lower salinity(33.0 ppm) moves to the north along the eastern half of the South China Sea; it graduallyis increased during its movement northward. Salinity values along Palawan and the westcoasts of the northern Philippines range from 33.2 to 34.0 ppm. The summer (August)salinity distribution shows the influence of the southwest Monsoon (see Fig. 4.35(b)). Thestrong currents from the southwest along the western boundary carry water with lowersalinity (33.0 ppm) into the western South China Sea. This forces the tongue of highersalinity water offshore into the middle of the Sea. The lower salinity tongue cuts acrossfrom SW-NE from Vietnam to northern Luzon and forces the higher salinities to the regionnorthward from about150N.
5. Salinity Variation with Depth. The sections with the observations taken to thesouthwest of Taiwan are shown in Fig. 4.52, similar to those shown earlier for temperature.These seasonal salinity changes closely follow those of temperature. In August, the salinityvalues increase from the low values (33.0 to 33.7 ppm) at the surface toward a layerof maximum salinity (34.5 to 34.7 ppm) that occurs at about 100 meters depth. Thesalinity gradient is strongest at the top of the (temperature) thermocline region, weakeningsomewhat at greater depths.
In October, surface salinity values are higher (33.8 to 33.9 ppm), and the gradientincreases with depth through the observed water column to values of 34.7 or 34.8 ppm atthe greatest depths observed (no evidence of the salinity maximum layer shows at thesedepths). Strong salinity gradients occur associated with the deeper thermocline.
In March, the one section observed shows no evidence of strong salinity gradientsanywhere in the 150-meter layer adjacent to the surface. The salinity values there are ashigh (34.65 to 34.8 ppm) as the maximum values observed at any depth in other seasons.
44-55
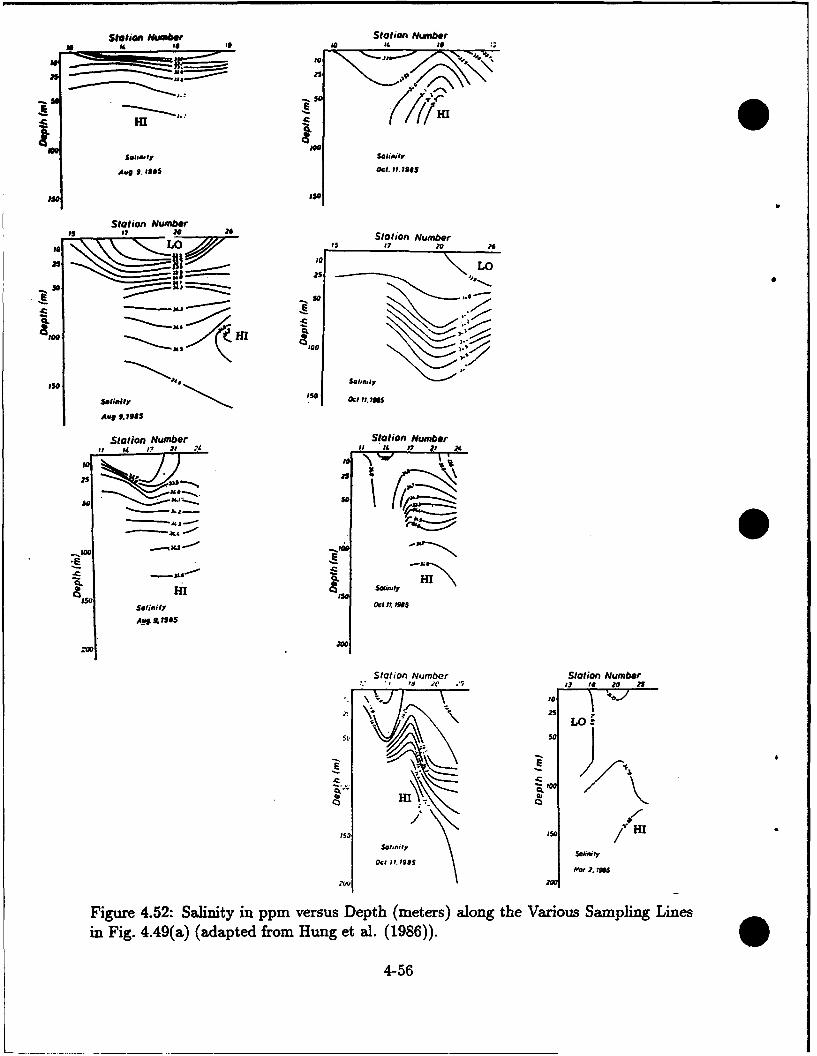
Station NJUbef Station Nuwrber
is _________S______Numbe
'as
AIS IS i.. S
Station NumberIs 2? Station Number
to" is•, )7 20 JIG
LO
iso
ISO . S
s$ihiy Oct if. los
Avg 9..1985
Station Number Srtaion Numberof i ? 2.1 N' toi It 0? 2) 24
Saiity H9 0d t It. loss
4-5
Staio Nube'taio ume& 2-
IH
ISO IS HI
S~i~ifyOct It. loss
200M
Fiur 452 Sliit i p erusDethto N(mbtersaln thVriu Statio in Numberin Fig. 4.4(a (aape fro Hun eta.186)
4-56
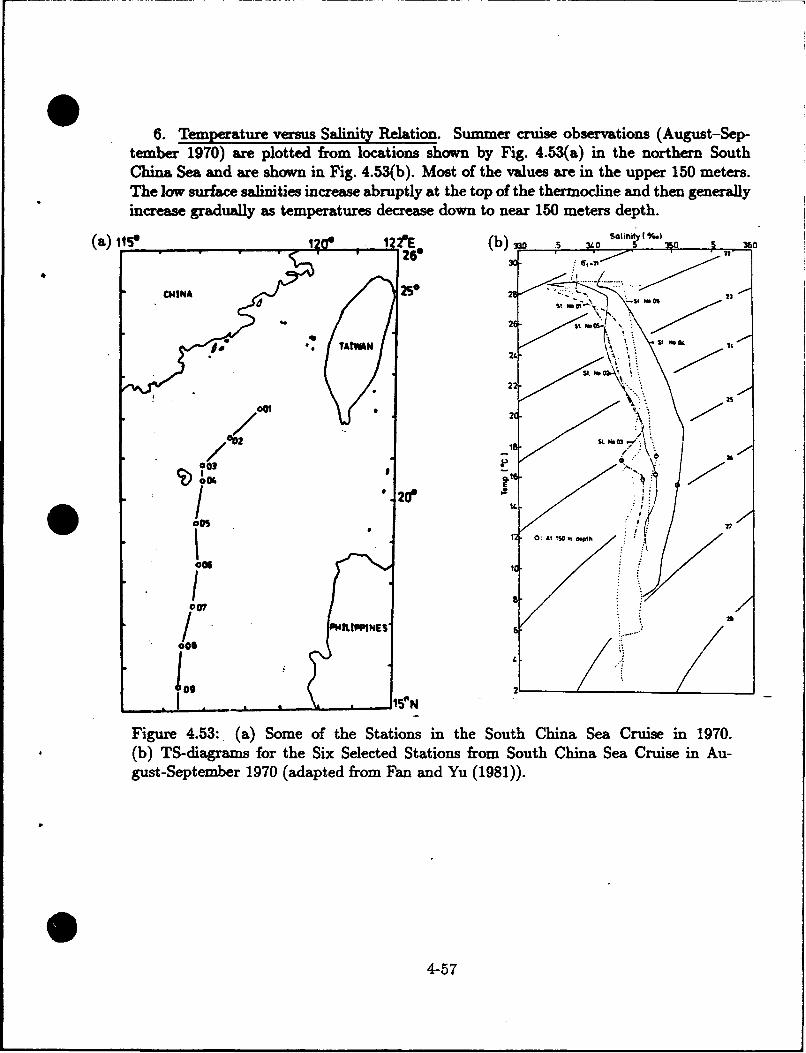
6. Temperature versus Salinity Relation. Summer cruise observations (August-Sep-tember 1970) are plotted from locations shown by Fig. 4.53(a) in the northern SouthChina Sea and are shown in Fig. 4.53(b). Most of the values are in the upper 150 meters.The low surface salinities increase abruptly at the top of the thermocline and then generallyincrease gradually as temperatures decrease down to near 150 meters depth.
(a) 1112 1 2. " (b)- .5 340 siV M .),0
CINA 250
d/
St , 0
21
@0
/OW 2as
00 2 -t me *
0037
CO 12 0:At ISO ft pth 2
Cos
007 / PHIjLPPNES'@06
Figure 4.53:. (a) Some of the Stations in the South China Sea Cruise in 1970.()TS-diagramrs frteSxSelected Stations from South China Sea Cruise in Au-
gust-September 1970 (adapted from Fan and Yu (1981)).
4-57
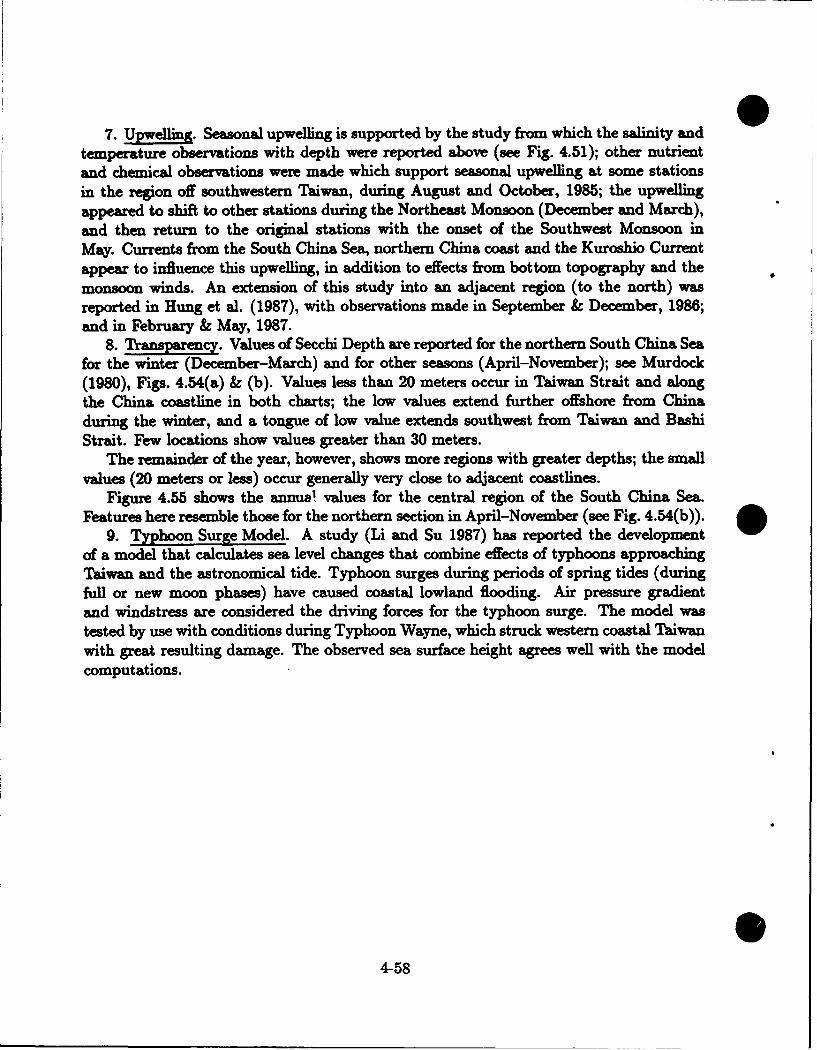
7. Upwelig. Seasonal upwelling is supported by the study from which the salinity andtemperature observations with depth were reported above (see Fig. 4.51); other nutrientand chemical observations were made which support seasonal upwelling at some stationsin the region off southwestern Taiwan, during August and October, 1985; the upwellingappeared to shift to other stations during the Northeast Monsoon (December and March),and then return to the original stations with the onset of the Southwest Monsoon inMay. Currents from the South China Sea, northern China coast and the Kuroshio Currentappear to influence this upwelling, in addition to effects from bottom topography and themonsoon winds. An extension of this study into an adjacent region (to the north) wasreported in Hung et al. (1987), with observations made in September & December, 1986;and in February & May, 1987.
8. Transparency, Values of Secchi Depth are reported for the northern South China Seafor the winter (December-March) and for other seasons (April-November); see Murdock(1980), Figs. 4.54(a) & (b). Values less than 20 meters occur in Taiwan Strait and alongthe China coastline in both charts; the low values extend further offshore from Chinaduring the winter, and a tongue of low value extends southwest from Taiwan and BashiStrait. Few locations show values greater than 30 meters.
The remainder of the year, however, shows more regions with greater depths; the smallvalues (20 meters or less) occur generally very close to adjacent coastlines.
Figure 4.55 shows the annuia values for the central region of the South China Sea.Features here resemble those for the northern section in April-November (see Fig. 4.54(b)).
9. Typhoon Surge Model. A study (Li and Su 1987) has reported the developmentof a model that calculates sea level changes that combine effects of typhoons approachingTaiwan and the astronomical tide. Typhoon surges during periods of spring tides (duringfull or new moon phases) have caused coastal lowland flooding. Air pressure gradientand windstress are considered the driving forces for the typhoon surge. The model wastested by use with conditions during Typhoon Wayne, which struck western coastal Taiwanwith great resulting damage. The observed sea surface height agrees well with the modelcomputations.
04-58

E£1O El 0
N 25
CH I NA 0PEAR ER-
HOG KONG
V1IETNAM/ , 11,31
t wi 20 n %dt.%3 N 20
I, 1 3266
26 5i2i
as 25 n
6 2? LU"1ZON233
--- 27
£ 110 E£120
as N25VIETNA,. -ill 23- a
C6 I N1 A t •
a.. aN
36 2 2% 03 26 2
S2 0 7 ( 2 26
KO~ 22jj 2626 a. 23.
27~~~2 722 232 S.~ U
* I 3sq37-
it 2015-1 o
1o 2 a 27 n$ 2 3 2 26 2
Figure 4.4 2e Dephs Sout Chin Sei(othr Section), (a
2o20 I HIANINA2 13
2 1'25 °3
DE-A &9 (b) APRNO (aatdfo2urok(90)
"20l 9 37 9N 02" "s is4-5232
go 7 2s0t 24112 31 23 soe 29 2i59,. Itl s 242 oX 2 ? 6 3
27 1,7 2 51, 00l 30 5 3 1 7 30 35" 037 35 0• U
~2 20 N1
Figure 4.54: Secchi Depths, South China Sea (Northern Section), (a)e DEC-MAR •z(b) APR-NOV (adapted from Murdock (1980)).
4-59
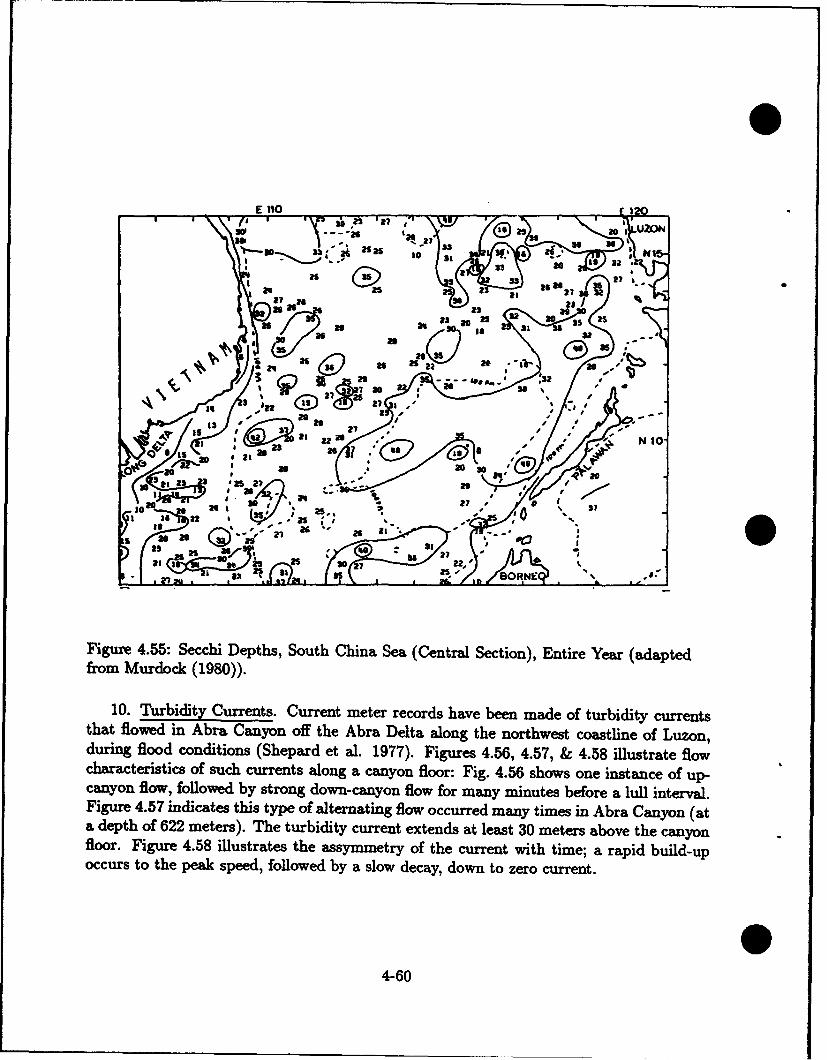
E 11o
"'y 33 U s3,1 2 25 ~ a 6 N15-21 19 2
2 toat5
25 20 3a 23 92
I,- __I- 0,/ ;"
26 2 5 sI
~26to3
il l lII I - I ,* % • ] *
It. 26s 0
7 . 21
I~ i,1 a"• •_/ a•+ fo "--/ i,
PA ElP 2
702 20 20 S
33 L 2
13 35 2
Figure 4.55: Secchi Depths, South China Sea (Central Section), Entire Year (adaptedfrom Murdock (1980)).
10. Turbidity Currents. Current meter records have been made of turbidity currentsthat flowed in Abra Canyon off the Abra Delta along the northwest coastline of Luzon,during flood conditions (Shepard et al. 1977). Figures 4.56, 4.57, & 4.58 illustrate flowcharacteristics of such currents along a canyon floor: Fig. 4.56 shows one instance of up-canyon flow, followed by strong down-canyon flow for many minutes before a lull interval.Figure 4.57 indicates this type of alternating flow occurred many times in Abra Canyon (ata depth of 622 meters). The turbidity current extends at least 30 meters above the canyonfloor. Figure 4.58 illustrates the assymmetry of the current with time; a rapid build-upoccurs to the peak speed, followed by a slow decay, down to zero current.
4-60
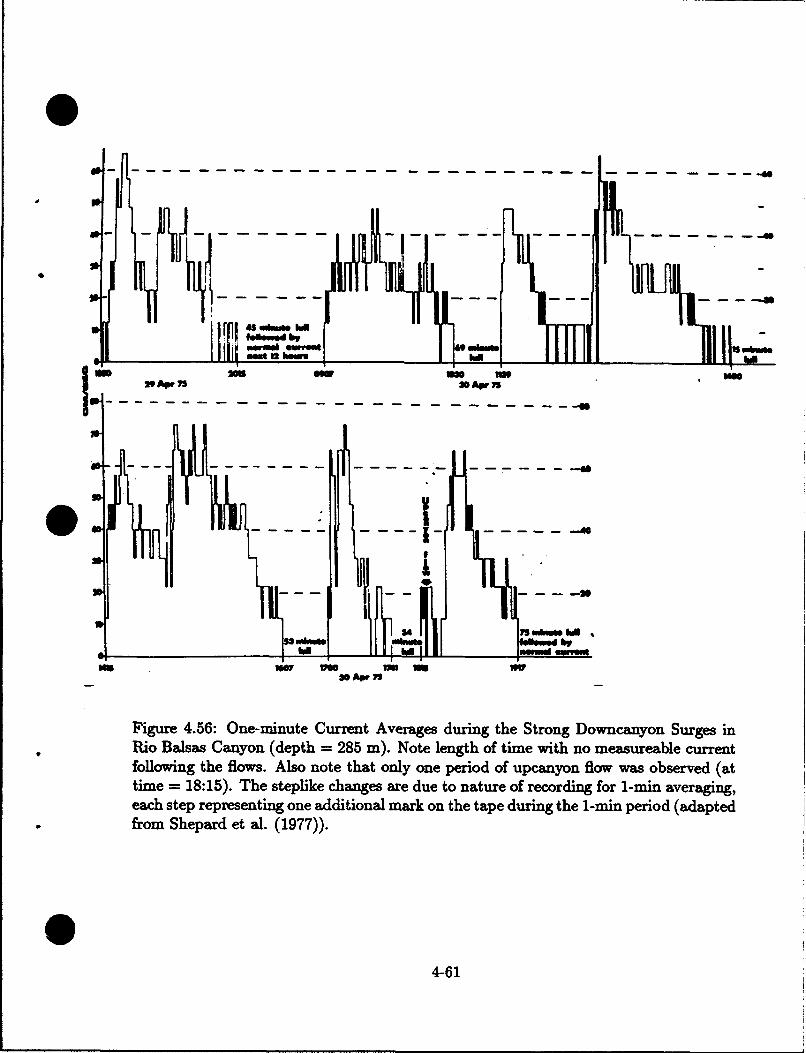
j
-; -
* °. I..
feow Ao t bye rd u y
hirm Nuew em
30 Apc M
Figure 4.56: One-minute Current Averages during the Strong Downcanyon Surges inRio Balsas Canyon (depth = 285 in). Note length of time with no measureable currentfollowing the flows. Also note that only one period of upcanyon flow was observed (attime = 18:15). The steplike changes are due to nature of recording for 1-min averaging,each step representing one additional mark on the tape during the 1-min period (adaptedfrom Shepard et al. (1977)).
04-61
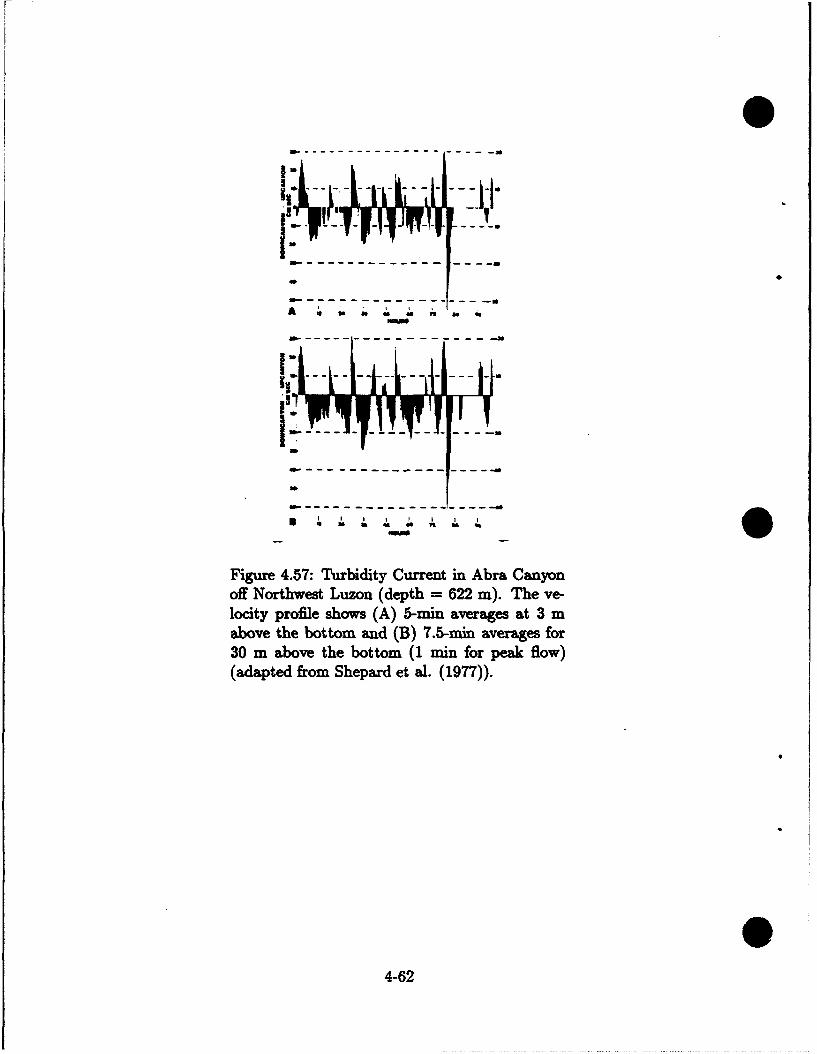
O
Aom
lis
Figure 4.57: Turbidity Current in Abra Canyonoff Northwest Luzon (depth = 622 m). The ve-locity profile shows (A) 5-mmn averages at 3 mabove the bottom and (B) 7.5-min averages for
30 m above the bottom (1 min for peak flow)(adapted from Shepard et al. (1977)).
O6
4-62
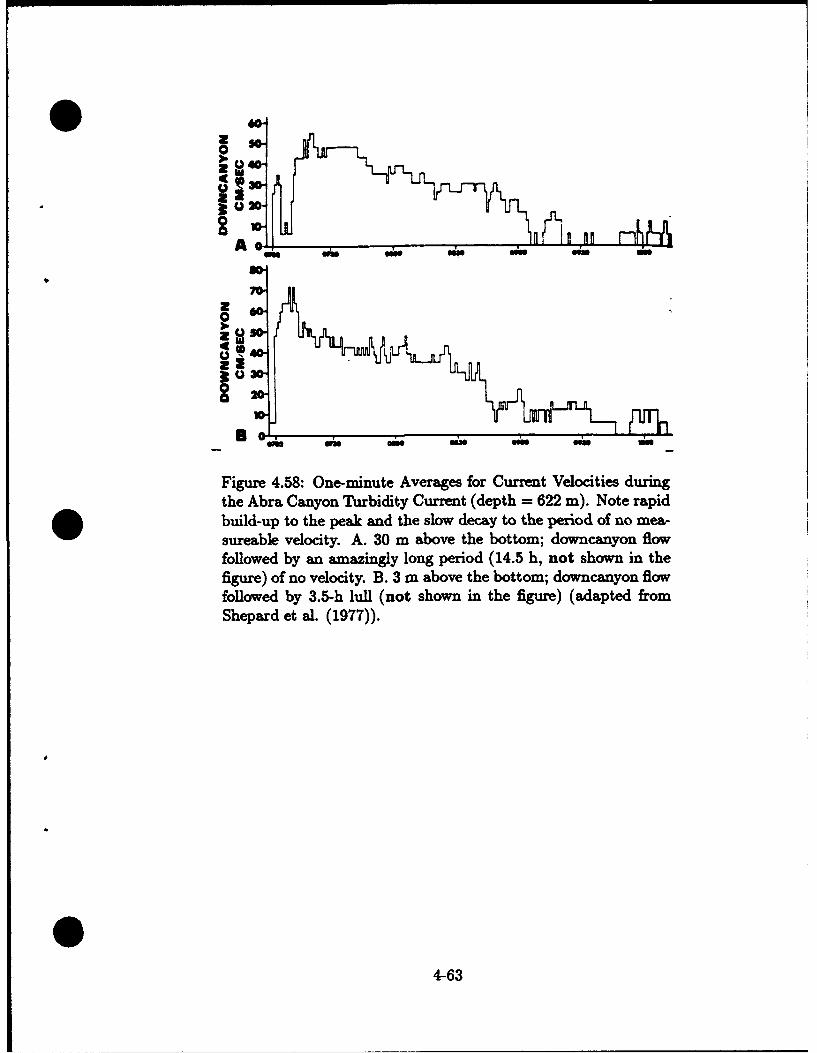
OZZ240
30
SI;W r, . 0~ ý 1 11
A 46n ai oe•,w "a ON
th AbaCno ubdiyCret(et - 62 m). Noera
2
0i
O build-up to the peak and the slow decay to the period of no mea-
sureable velocity. A. 30 m above the bottom; downcanyon flow
followed by an amazingly long period (14.5 h, not shown in the
figure) of no velocity. B. 3 m, above the bottom; downcanyon flowfollowed by 3.5-h luOl (not shown in the figure) (adapted from
Shepard et al. (1977)).
4-63
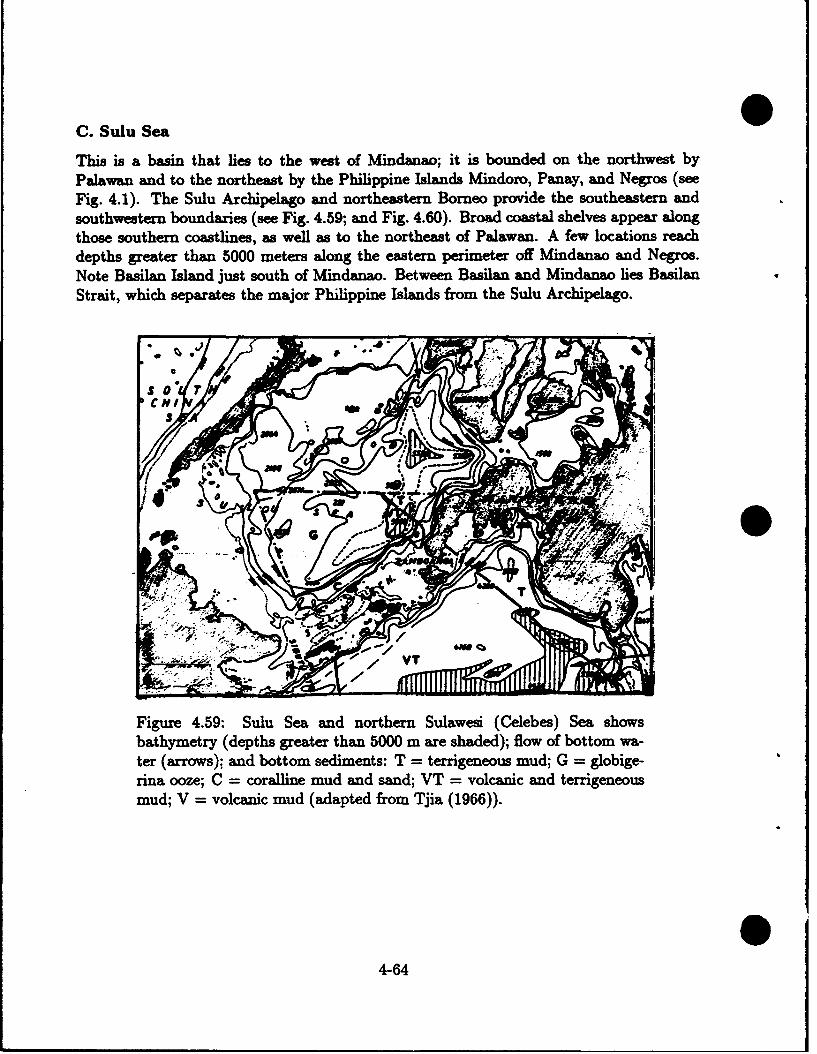
C. Sulu Sea
This is a basin that lies to the west of Mindanao; it is bounded on the northwest byPalawan and to the northeast by the Philippine Islands Mindoro, Panay, and Negros (seeFig. 4.1). The Sulu Archipelago and northeastern Borneo provide the southeastern andsouthwestern boundaries (see Fig. 4.59; and Fig. 4.60). Broad coastal shelves appear alongthose southern coastlines, as well as to the northeast of Palawan. A few locations reachdepths greater than 5000 meters along the eastern perimeter off Mindanao and Negros.Note Basilan Island just south of Mindanao. Between Basilan and Mindanao lies BasilanStrait, which separates the major Philippine Islands from the Sulu Archipelago.
Figure 4.59: Sulu Sea and northern Sulawesi (Celebes) Sea showsbathymetry (depths greater than 5000 m are shaded); flow of bottom wa-ter (arrows); and bottom sediments: T = terrigeneous mud; G = globige-rina ooze; C -coralline mud and sand; VT = volcanic and terrigeneousmud; V = volcanic mud (adapted from Tjia (1966)).
4-64r
CHI8
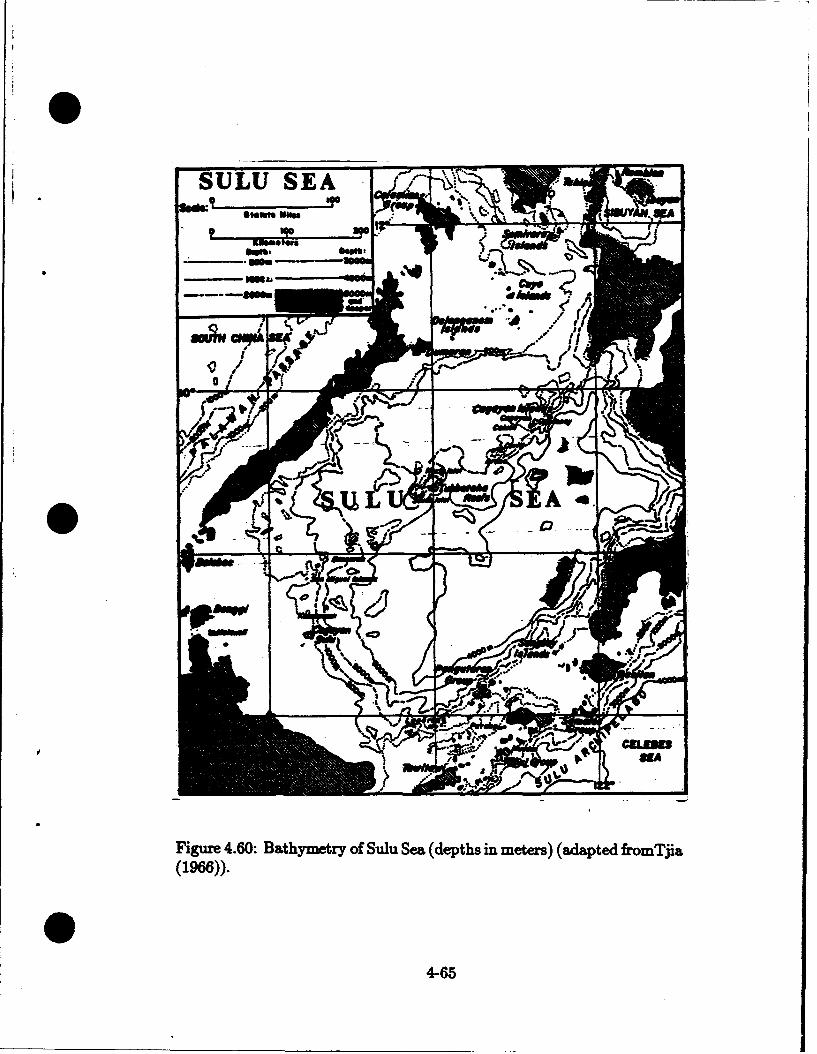
I
SULU SEA • .
Lg A
cll
Figure 4.60: Bathymetry of Sulu Sea (depths in meters) (adapted fromTjia(1966)).
4-65
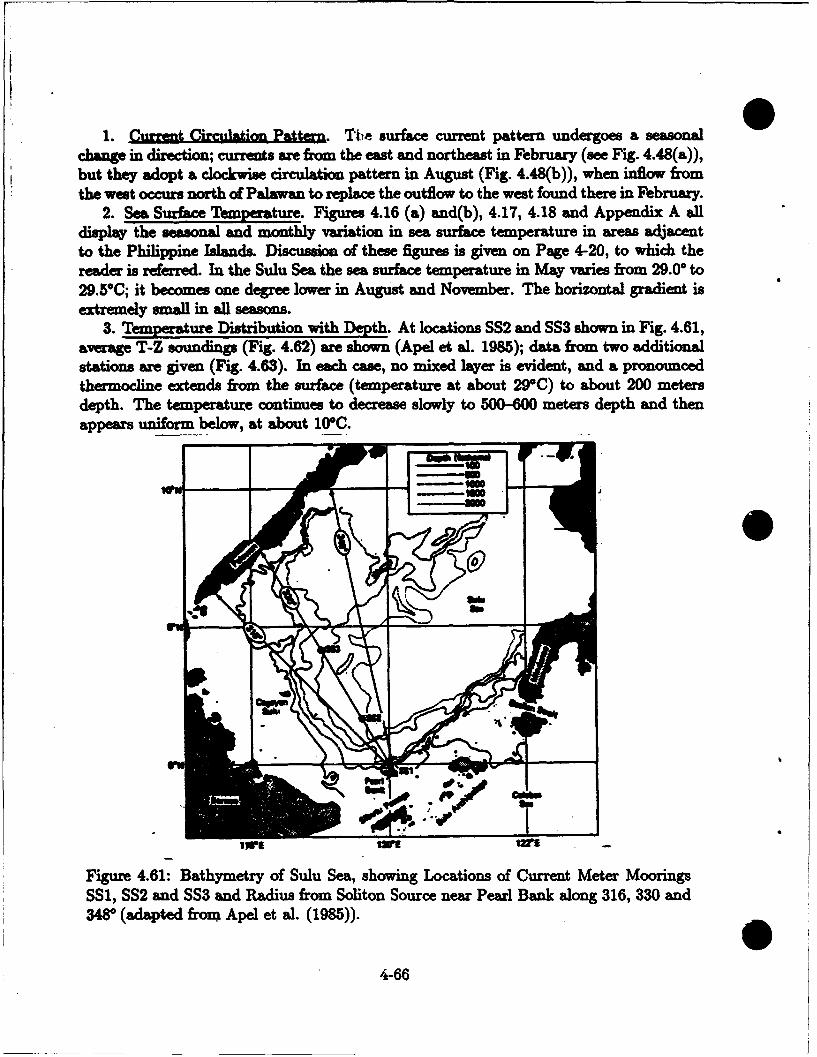
1. urrent Circulation Pattern. The surface current pattern undergoes a seasonalchange in direction; currents are from the east and northeast in February (see Fig. 4.48(a)),but they adopt a clockwise circulation pattern in August (Fig. 4.48(b)), when inflow fromthe west occurs north of Palawan to replace the outflow to the west found there in February.
2. Sea Surface Temperature. Figures 4.16 (a) and(b), 4.17, 4.18 and Appendix A alldisplay the seasonal and monthly variation in sea surface temperature in areas adjacentto the Philippine Islauds. Discussion of these figures is given on Page 4-20, to which thereader is referred. In the Sulu Sea the sea surface temperature in May varies from 29.0° to29.50C; it becomes one degree lower in August and November. The horizontal gradient isextremely small in all seasons.
3. Temperature Distribution with Depth. At locations SS2 and SS3 shown in Fig. 4.61,average T-Z soundings (Fig. 4.62) are shown (Apel et al. 1985); data from two additionalstations are given (Fig. 4.63). In each case, no mixed layer is evident, and a pronouncedthermocline extends from the surface (temperature at about 29°C) to about 200 metersdepth. The temperature continues to decrease slowly to 500-600 meters depth and thenappears uniform below, at about W0C.
IWE| On• WEI
Figure 4.61: Bathymetry of Sulu Sea, showing Locations of Current Meter MooringsSS1, SS2 and SS3 and Radius from Soliton Source near Pearl Bank along 316, 330 and3480 (adapted from Apel et al. (1985)).
4-66
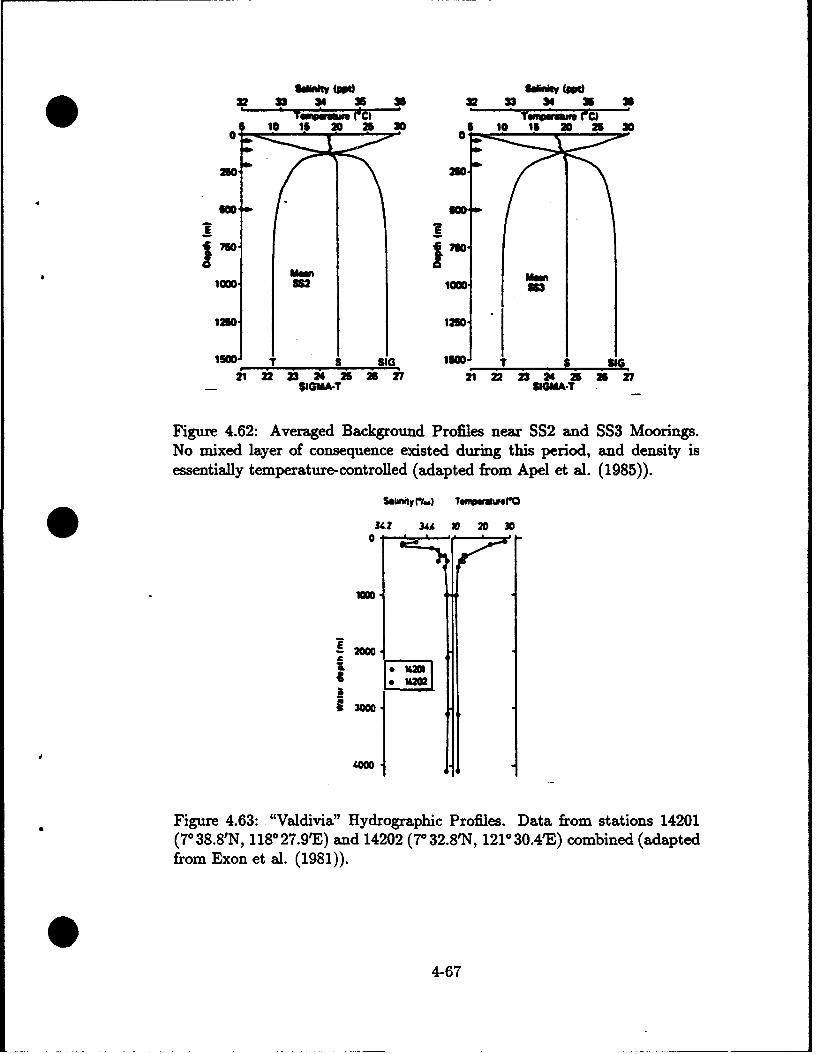
tuf Wu -- '032 2 34 w5 3 2 33 34 3U 3
Torwift" 1C) Ye,'pwrae F65 10 15 20 25 20 0 10 is 20) 25 20
250-
IWM. 1M
1250- m
I5W. T S SIG SwJ T 13 s SIG.21 n2n24 252527 212222 2425252
- SIGMA.T SIGMA-T
Figure 4.62: Averaged Background Profiles near SS2 and SS3 Moorings.No mixed layer of consequence existed during this period, and density isessentially temperature-controlled (adapted from Apel et al. (1985)).
Saunitr/-) 7Tnwt#rO34 V3Z •;I 2 0 3
-2000-
Figure 4.63: "Valdivia" Hydrographic Profiles. Data from stations 14201(70 38.8'N, 1180 27.9%) and 14202 (70 32.8'N, 1210 30.4'E) combined (adapted
from Exon et al. (1981)).
4-67
4. Salinity. In February, salinity at the surface varies from >34.0 ppm along thePhilippines to about 33.5 ppm along Palawan (see Fig. 4.35(a)). By August, salinityvalues have decreased generally and are all between 33.4 and 34.0 ppm (see Fig. 4.35(b)).The general gradient direction has shifted from westward in February to northwestward inAugust.
5. Salinity Variation with Depth. For the same locations noted above for Tempera-ture/Depth profiles, salinity variation with depth is shown (see Fig. 4.62 & Fig. 4.63). Inthe Fig. 4.62 profiles, the salinity value at the surface (>34.0 ppm) increases irregularlywith depth and becomes slightly larger near the bottom of the strong tropical thermo-dine (at about 200 meters); it retains that value (about 34.4 ppm) into the deep basin.The other profiles (see Fig. 4.63) experience a minimum value (about 34.3 ppm) at about100 meters, then increase to values near 34.5 ppm at about 300 meters and deeper to thebasin floor. At the south entrance to the Sulu Sea from the Celebes (Sulawesi) Sea throughSibutu Strait (see Fig. 4.60), a vertical section of salinity is given by Fig. 4.64. A salinitymaximum value (>34.8 ppm) occurs at about 1200 meters depth outside the Strait, but itbecomes modified and weakened as it enters the Sulu Sea, showing a very small increasewith depth below 1100 meters.
6. Sediments and Turbidity Currents. The broad shelves adjacent to Palawan, Borneoand the Sulu Archipelago are covered with calcareous sand, gravel and rocks (see Fig. 4.65).Calcareous ooze and silt covers the northwestern two-thirds of the deep basin; it is assumedthat turbidity currents moving along the indicated paths have carried the materials fromthe broad shelves into deep basins as calcareous turbidites. The shelf off Panay, Negros andMindanao is covered with sediment (silt) that is muddy and poorly sorted; turbidity cur-rents carried this into the adjacent deep basin region as mostly non-calcareous turbidites.
7. Seicbes, Internal Waves. The Sulu Sea has had evidence of long-wave seiches travel-ling from SE-NW in the form of lines of surface roughness that have been photographed bysatellites (Landsat-1 and Nimbus 7), by radar backscattering, by expendable bathythermo-graphs and by echo sounder records underwater. The seiches appear to be surface evidenceof large internal waves that extend from the surface to as deep as 500 meters below thesurface. These features show wave lengths of 7 to 16 km, and the "crests" extend horizon-tally for more than 350 km. The "crests" are about 2 km wide; and they travel in packetsthat are about 80 km apart (see Fig. 4.66; and Figs. 4.67, 4.68, 4.69, 4.70 & 4.71).
4-68
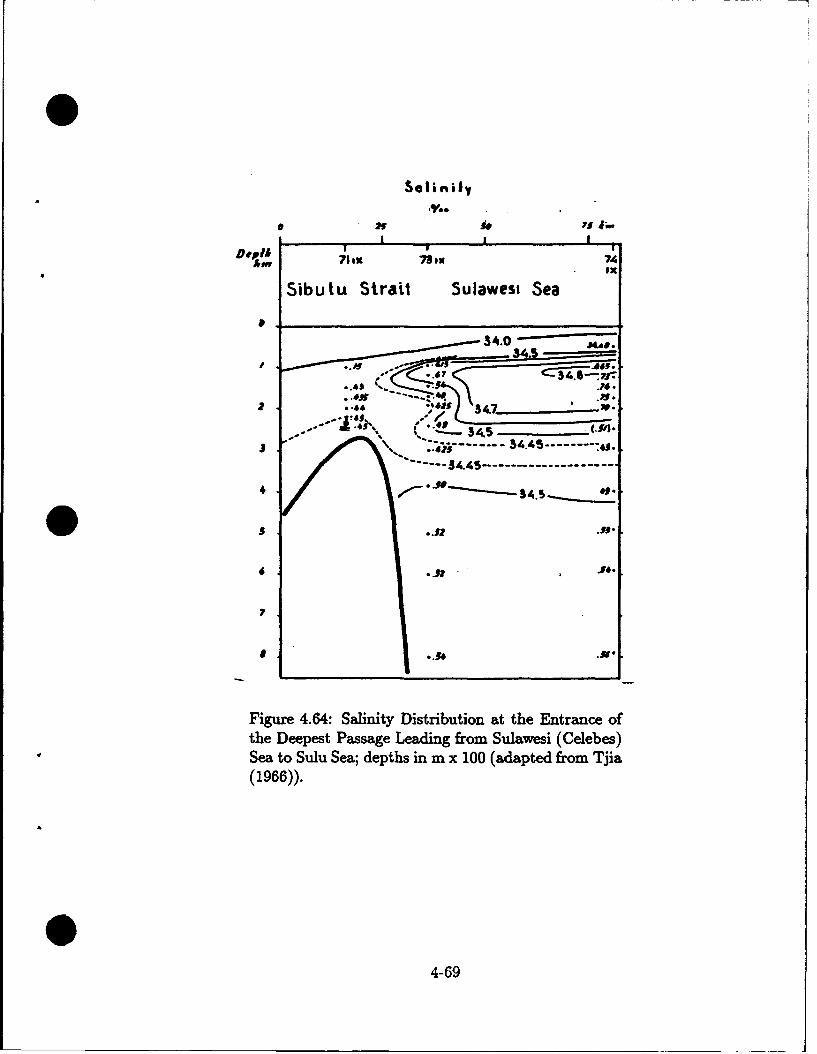
Solin ii,
pe j I I
71ex 73"w 74Ix
Sibutu Strait Sulawesi Sea
34.0
,__/.......... .. 34•.. . ... 5• s... .. :,34.5
/ \ -.:-~-, - -------..............
4
Figure 4.64: Salinity Distribution at the Entrance ofthe Deepest Passage Leading from Sulawesi (Celebes)Sea to Sulu Sea; depths in m x 100 (adapted from Tjia(1966)).
4-69
0 3 ..324-39
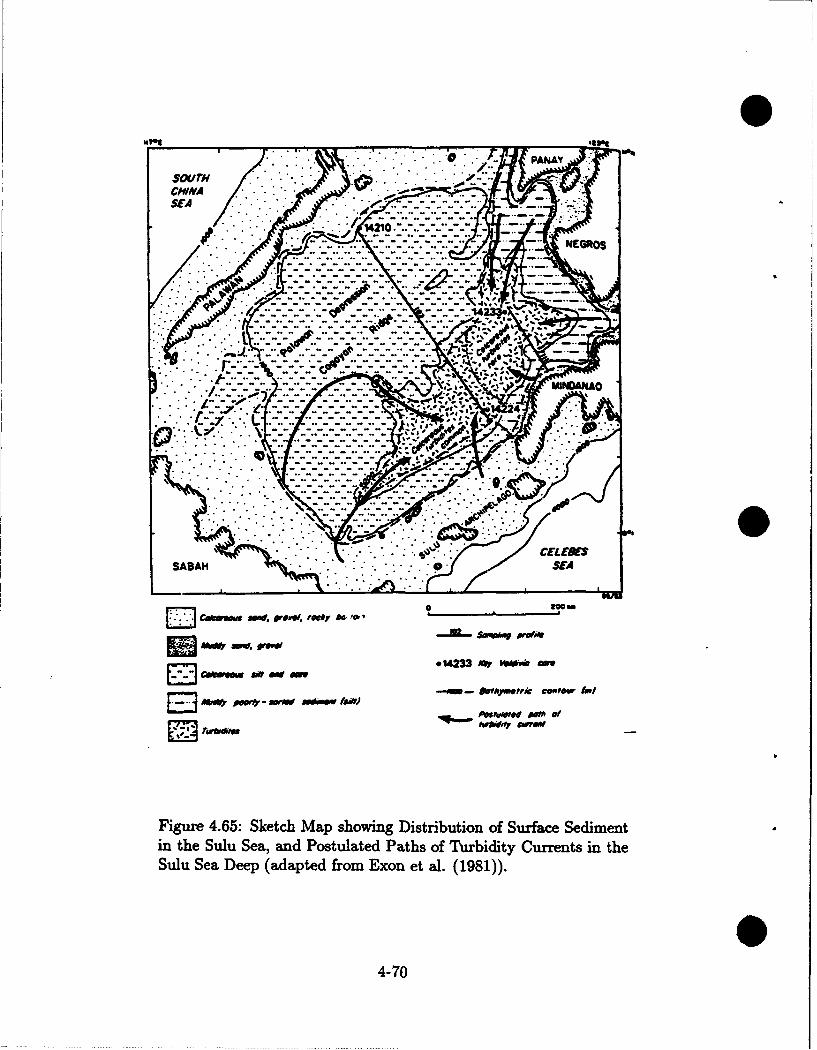
- PAN Y
J00SOU/TN
SABAH t SEA' ~D
Cat o" / M... f:bfC.r b. @.,I '.'''-.•'..
- ,-- - , svW.V pw..
.. .:-:.91M -My....
S . -... .,-..- ef•f.- c CO.~ fJ
p•q •r lý . . °, ° o,. . .
Figure 4.65: Sketch Map showing Distribution of Surface Sedimentin the Sulu Sea, and Postulated Paths of Turbidity Currents in theSulu Sea Deep (adapted from Exon et al. (1981)).
4-70
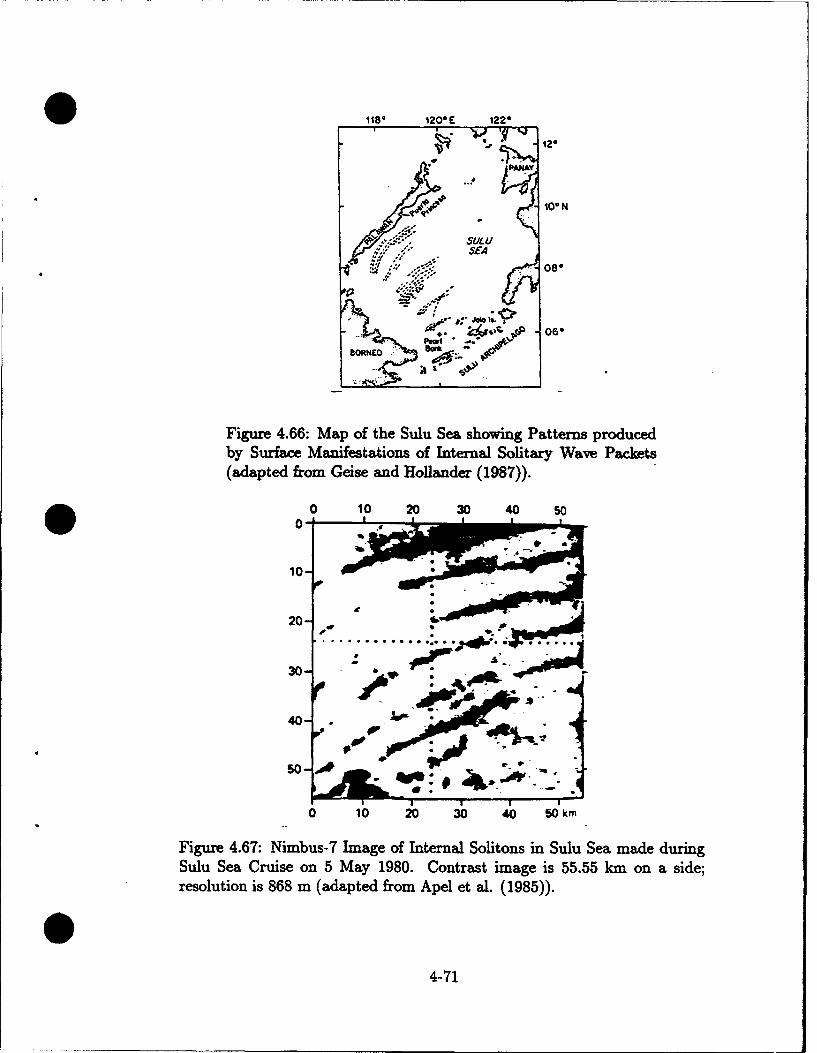
0 118 120E E 122*
10*N
o°°v
.ORNE
AAA
o N......,O N
Figure 4.66: Map of the Sulu Sea showing Patterns producedby Surface Manifetations of Internal Solitary Wave Packets(adapted from Geise and Hollander (1987)).
e0•. 10 20 30 40 50.
0- %IW- SE
10 _
p 0-
. .... ... ... .-. : •
30-4. . •i• •
0 10 20 30 40 50 k
Figure 4.67: Nimbus-7 Image of Internal Solitons in Sulu Sea made duringSulu Sea Cruise on 5 May 1980. Contrast image is 55.55 kmn on a side;resolution is 868 m (adapted from Apel et al. (1985)).
4-71
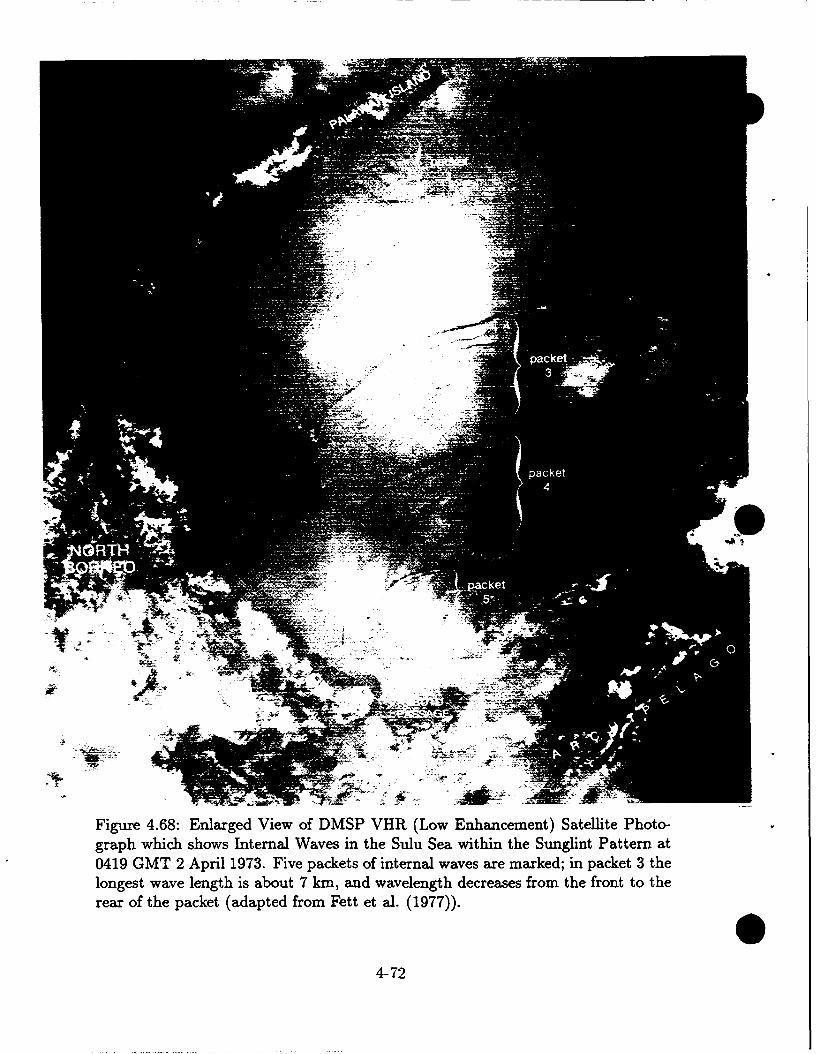
Figure 4.68: Enlarged View of DMSP VHR (Low Enhancement) Satellite Photo-graph which shows Internal Waves in the Sulu Sea within the Sunglint Pattern at0419 GMT 2 April 1973. Five packets of internal waves axe marked; in packet 3 thelongest wave length is about 7 kin, and wavelength decreases from the front to therear of the packet (adapted from Fett et al. (1977)).
4-72
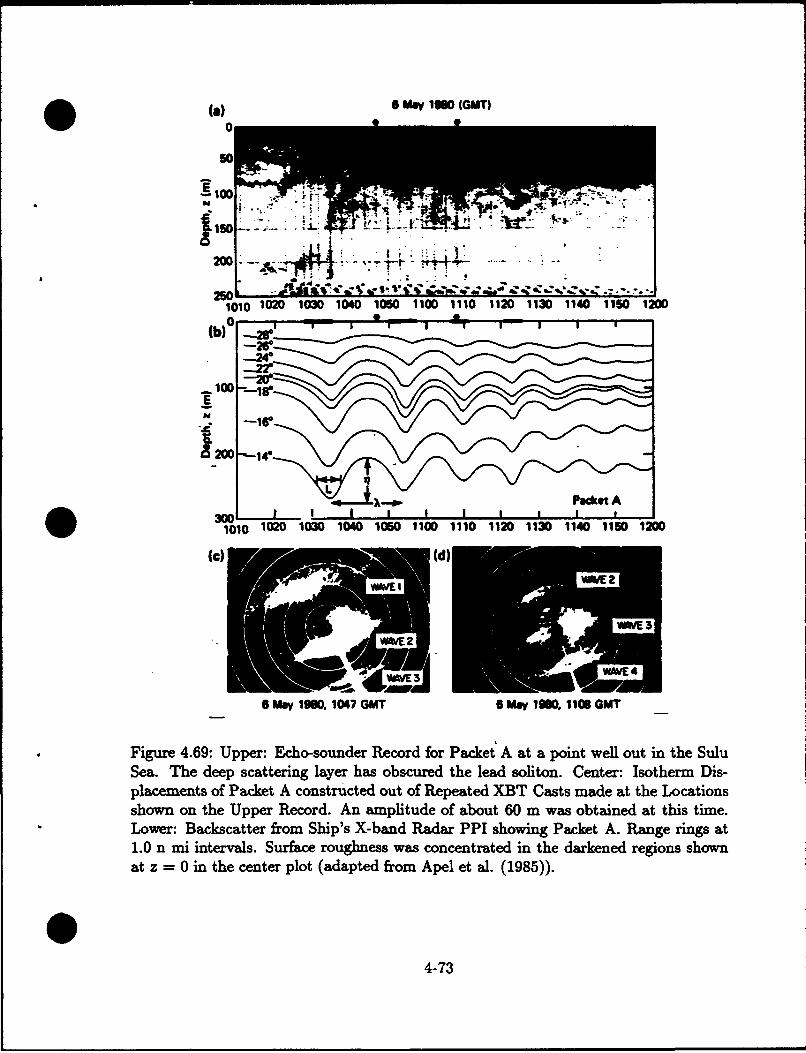
S(a) e May low0 (GMT)
0
:II
"2 -• . ..... .. . .
1010 1020 1030 1040 1050 1100 1110 1120 1130 1140 1150 1200
S3~~~~-00 I I I I I I
EE
11O 1020 1030 1040 1050 1100 1110 1120 1130 1140 1150 1200
YAE3- W&VE 4
6 May 190. 1047 GMT 6 may 1900. 110B GMT
Figure 4.69: Upper: Echo-sounder Record for Packet A at a point well out in the SuluSea. The deep scattering layer has obscured the lead soliton. Center: Isotherm Dis-placements of Packet A constructed out of Repeated XBT Casts made at the Locationsshown on the Upper Record. An amplitude of about 60 m was obtained at this time.Lower: Backscatter from Ship's X-band Radar PPI showing Packet A. Range rings at1.0 n mi intervals. Surface roughness was concentrated in the darkened regions shownat z = 0 in the center plot (adapted from Apel et al. (1985)).
4-73
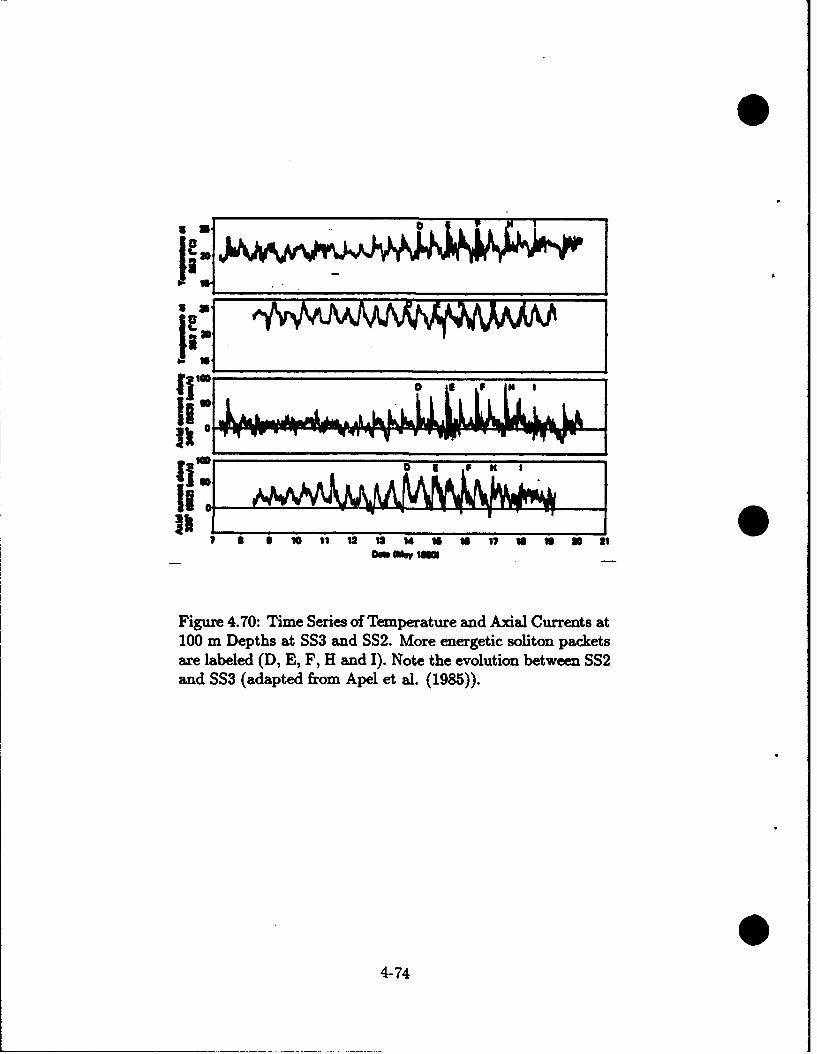
Eel
V~ F WW# N
1401
II
Is 0 1 F7 II W II
om UAW "Ml
Figure 4.70: Time Series of Temperature and Axdal Currents at100 m Depths at SS3 and SS2. More energetic soliton packetsare labeled (D, E, F, H and I). Note the evolution between SS2and SS3 (adapted from Apel et al. (1985)).
4-74
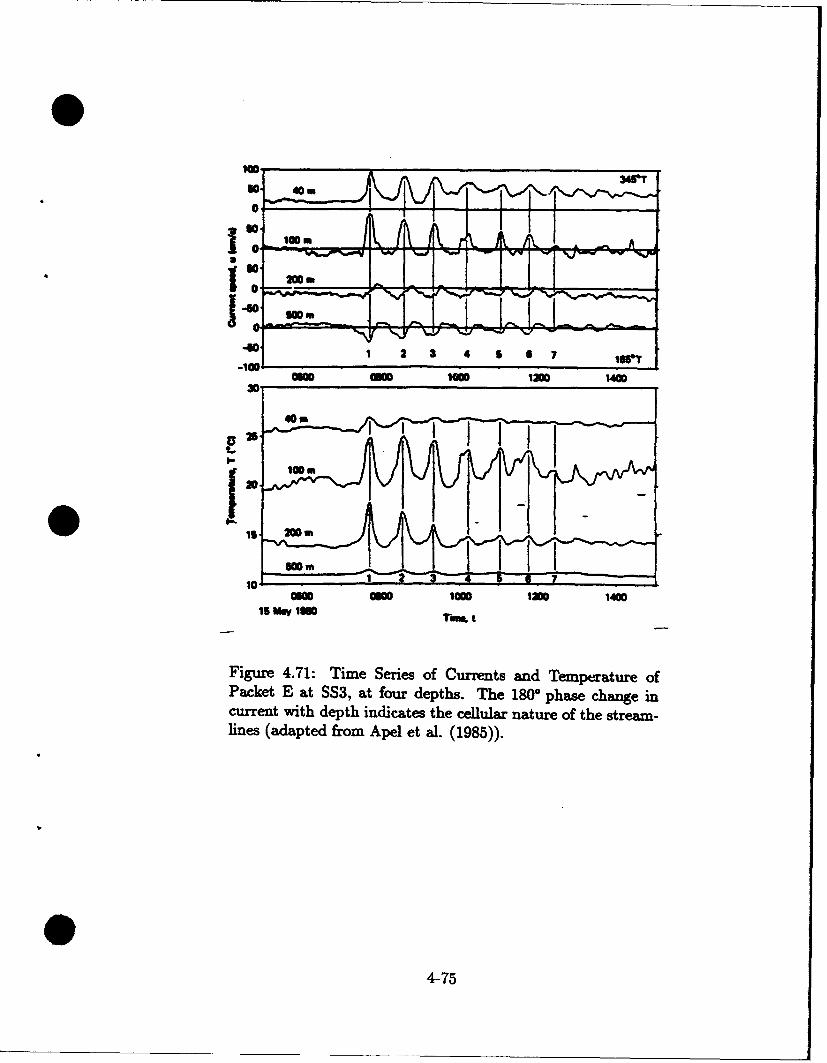
3rT
SIO.-01 2 3 4 6 t6 7 Illsr -
8Moo mo "Moo 12o 14o0
30'
15 IMw 1118 r... t
Figure 4.71: Time Series of Currents and Temperature ofPacket E at SS3, at four depths. The 180° phase change incurrent with depth indicates the cellular nature of the stream-lines (adapted from Apel et ah. (1985)).
40
24-7
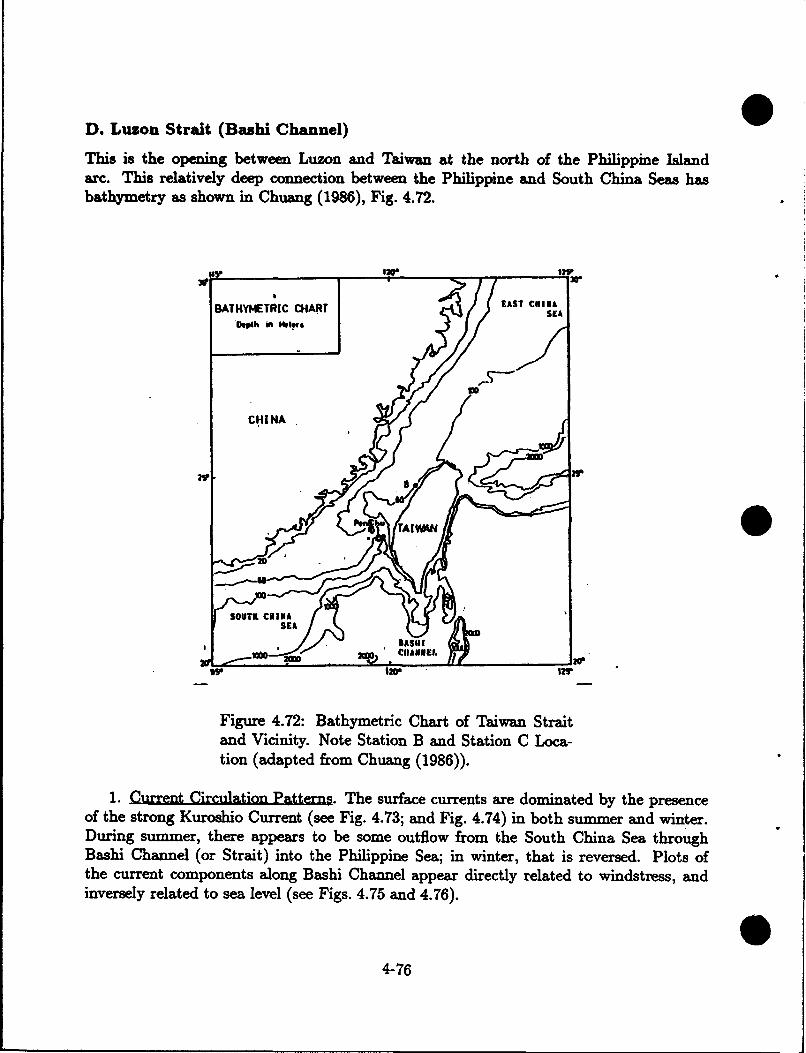
D. Luzon Strait (Bashi Channel)
This is the opening between Luzon and Taiwan at the north of the Philippine Islandarc. This relatively deep connection between the Philippine and South China Seas hasbathymetry as shown in Chuang (1986), Fig. 4.72.
BATHYMETRIC CHART LAST CHINA
CHINA
SU CNINA 'r/=TLSEA
Figure 4.72: Bathymetric Chart of Taiwan Straitand Vicinity. Note Station B and Station C Loca-tion (adapted from Chuang (1986)).
1. Current Circulation Patterns. The surface currents are dominated by the presenceof the strong Kuroshio Current (see Fig. 4.73; and Fig. 4.74) in both summer and winter.During summer, there appears to be some outflow from the South China Sea throughBashi Channel (or Strait) into the Philippine Sea; in winter, that is reversed. Plots ofthe current components along Bashi Channel appear directly related to windstress, andinversely related to sea level (see Figs. 4.75 and 4.76).
04-76
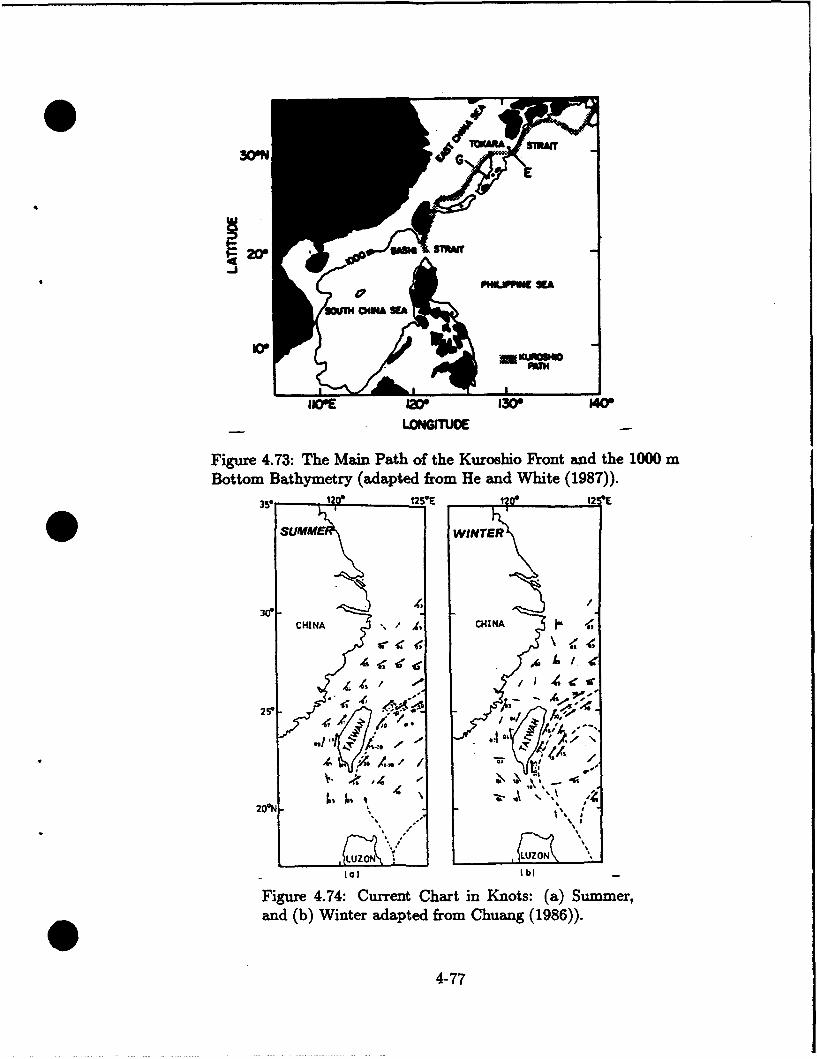
.IIIO'ETau3" S 140"
4r
H0E
LONGITUOE
Figure 4.73: The Main Path of the Kuroshio Front and the 1000 mBottom Bathymetry (adapted from He and White (1987)).
SUF4MEPP WIUE
JIWE w •lw lw' •t ~
3o= - 1 /
CHINA CHINA j '
.-, ._ 4I•II. ¶ ---
"2-1 A.]" . I, /ZAi. A. / - I.•.
•'- .a' ,.• -"-". •,,d -,'
20ON -
! p
cuzoý FLUZON -lal Ibl -
Figure 4.74: Current Chart in Knots: (a) Summer,and (b) Winter adapted from Chuang (1986)).
4-77
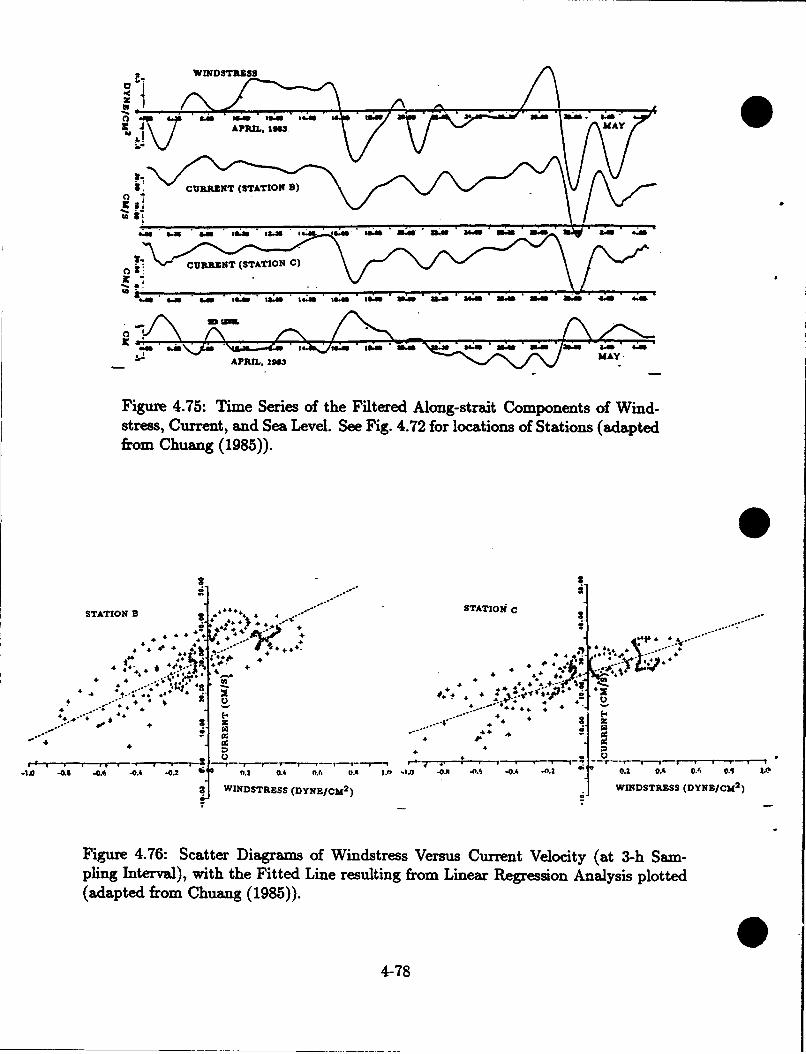
CWINDSTrST
SA "we.'-0 960 IV IN
""M, 1963. MAYS7v..CURB.UNT (STATION C)
Figure 4.75: Time Series of the Filtered Along-strait Components of Wind-
stress, Current, and Sea Level. See Fig. 4.72 for locations of Stations (adapted
from Chuang (1985)).•8 ATION C)4*
SAI I
STATION B 4444 .(STATIO C
4 4 4 k * , .- * * ... .. 4 4 r4 4 ' ,•4 - : 4 . . . . ."4 44 .. .... "eft ":d 0;.. "; ....
4 4 o 4 . 4 • 4 4
•t
es.C.
.u
r r
e n
t
.
a
S
e a
L
e v
e l .
S
i
7
4
o.n
... * . .. .. 4 .• ... . .. +++ a 4 . .
44 A IO B -4* 444 44TTI r
4 2E- -. 44 44
3 WINDSTRESS (DYNE/CM 2 ) ] WINDSTRESS (DYNE/CM 2 )
Figure 4.76: Scatter Diagrams of Windstress Versus Current Velocity (at 3-h Sam-pling Interval), with the Fitted Line resulting from Linear Regression Analysis plotted(adapted from Chuang (1985)).
4-78
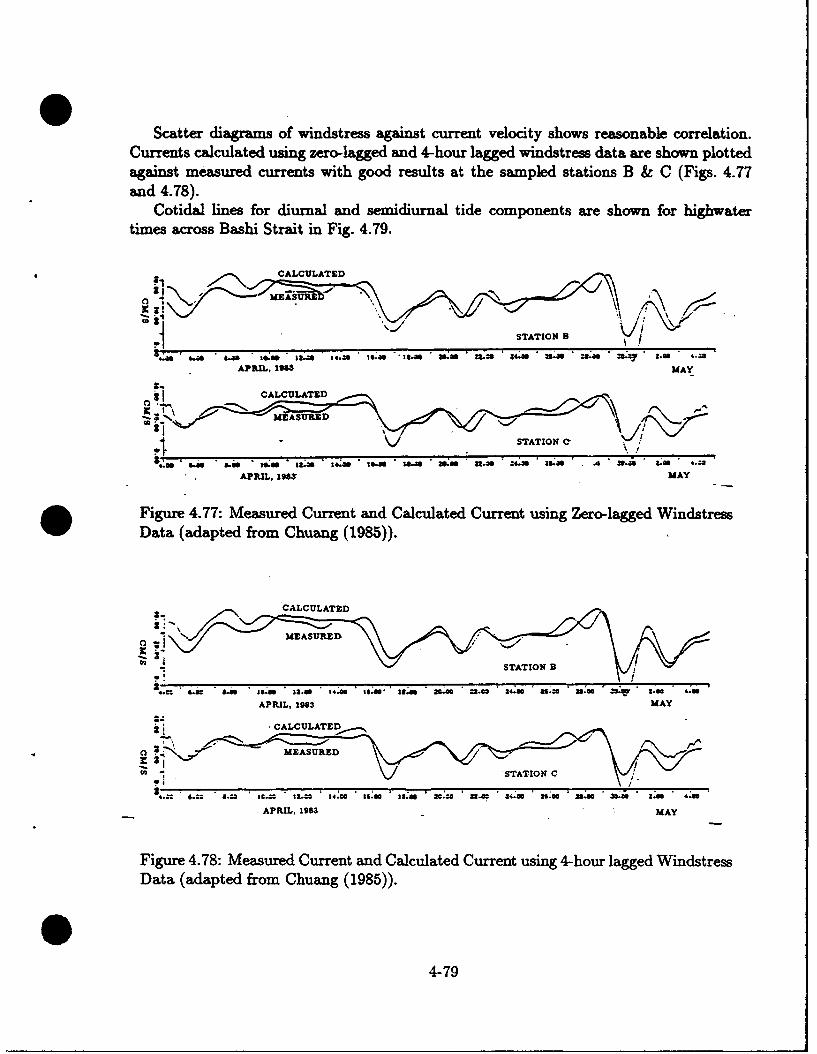
Scatter diagrams of windstress against current velocity shows reasonable correlation.Currents calculated using zero-lagged and 4-hour lagged windstress data are shown plottedagainst measured currents with good results at the sampled stations B & C (Figs. 4.77and 4.78).
Cotidal lines for diurnal and semidiurnal tide components are shown for highwatertimes across Bashi Strait in Fig. 4.79.
* 3, CALCULATED
MEASURED ',,ca
:1 STATION 38.•s~~~~~ ~ ~~ .. .,. a-. ,'. ,-. "- m"• . .z . . . ." . .:"" .- . "
APRIL, 198 MAY
ii CALCULATED
... ......
. . . .8 .i I" t• n * , 1=- , so-= W .a* :4.•= 00.0 .1. 0 . 4" 4.' =APRIL,IN 1M' AY
* Figure 4.77: Measured Current and Calculated Current using Zero-lagged WindstressData (adapted from Chuang (1985)).
CALCULATED
MEASURED / .
CA STATION B
4.2 .2 000 3080 3280 3400 588=3. SO 2880 223 24.00 20.=0 U0.'0 20.0 2.80 4.00*
APRIL, 1983 MAY
2- .CALCULATED
O- Cý..MEASýUREDX
W ~STATION C
APRIL, 1983 MAY
Figure 4.78: Measured Current and Calculated Current using 4-hour lagged WindstressData (adapted from Chuang (1985)).
4-79

TAUWAIN
LUZON
Figure 4.79: Cotidal Lines of the Diur-nal Tide K1 and the Semidiurnal TideM2 (adapted from Kanari and Teramoto(1981)).
2. Sea Surface Temperature. Average temperature charts (Figs. 4.17 and 4.18) showsome seasonal variation in Bashi Channel. In August the temperature is essentially uni-form in the Channel and very warm: almost 29°C. By November it has dropped by 2 to2.50C, with a gradient that shows temperature decreasing northward. In February, anotherdecrease (by almost 20C) has occurred, with a stronger N-S gradient present, showing the Wcoldest temperatures of the year (about 24 to 25°C). In May, the N-S temperature gradientremains strong with values from 27 to 290C. (Sea surface temperature for all 12 monthsare available in Appendix A.)
3. Temperature Variation with Depth. An E-W section of temperature in Bashi Chan-nel is presented in Fig. 4.80 for 17-20 May 1985. Below 1000 meters, the resulting distri-bution reflects the lack of free exchange across the Channel.
Long-term bimonthly averages of temperature that are values averaged over the upper200-meters of water are shown by Fig. 4.82. One feature in Bashi Channel is the stronggradient present between the warm conservative values to the east and more variable valuesto the west of the Channel. Annual mean values are shown in Fig. 4.81, and the stronggradient across the Bashi Channel is very much in evidence, as expected.
04-80
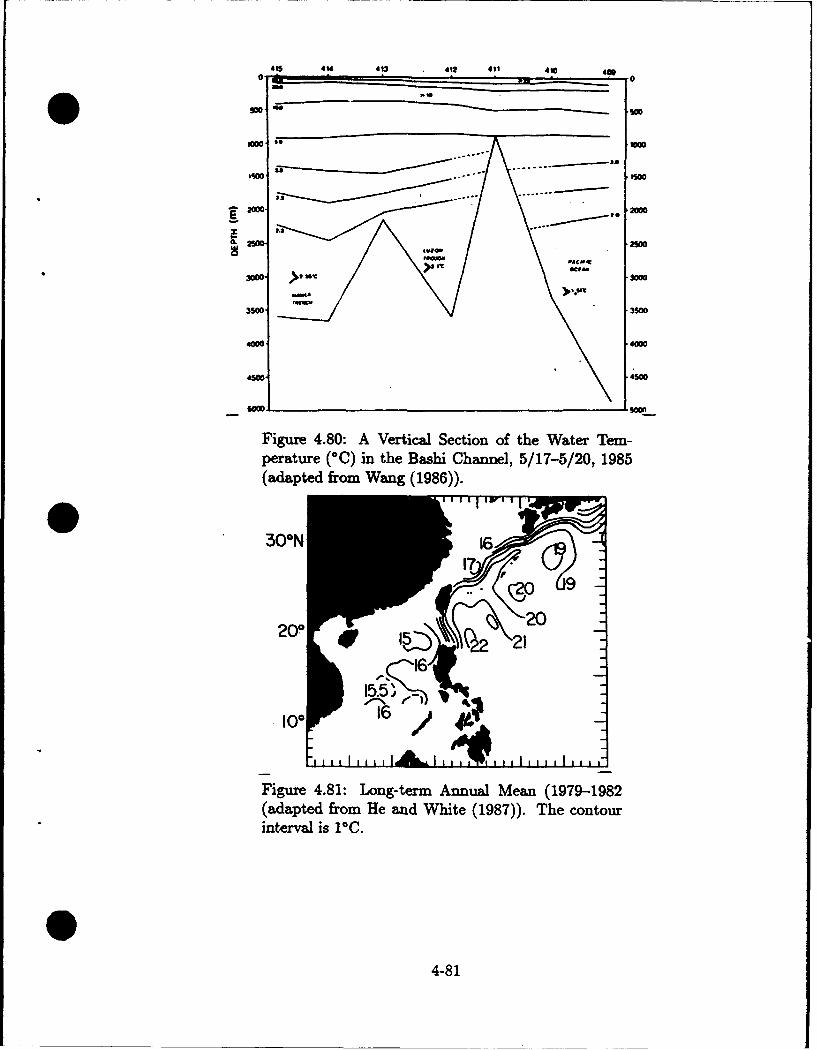
415 41S 413 4Q 411 410 40O
.50 .. .. - - --- -- -- --
a.. .. - .-
2=0 2=0
35000 >4*A5000
5000 soon
Figure 4.80: A Vertical Section of the Water Tem-perature (0C) in the Bashi Channel, 5/17-5/20, 1985(adapted from Wang (1986)).
200 I
155..o -.
Figure 4.81: Long-term Annual Mean (1979-1982(adapted from He and White (1987)). The contourinterval is I°C.
4-81
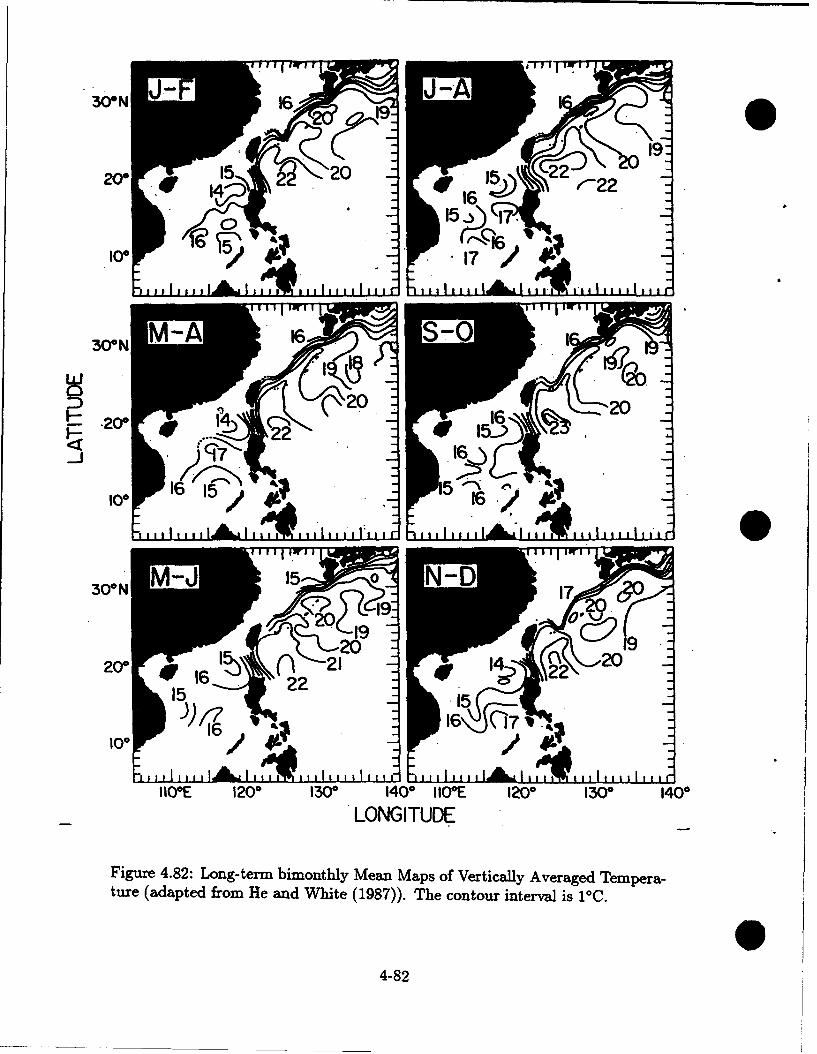
J- J-AcD 1691
14 /-4,220 .17 .-
30oN M-A 16 _ 0
0 20 -
2
100 16
IlO°E 1200 130° 140II IOF_ 120. 130 1400LONG I TUDE
Figure 4.82: Long-term bimonthly Mean Maps of Vertically Averaged Tempera-ture (adapted from He and White (1987)). The contour interval is I°C.
4-82

Contours of temperatures measured at depths of 2000 db (read "meters") and at 2500db (meters) in the Bashi Channel vicinity show some horizontal temperature variation(0.03 to 0.05*C) occurring in Figs. 4.83(a) & (b).
4
(a) ,, ,.,," , ","' (b) : , ,. ,"' ,4i
TAIWAN I ~WN
22,,
INI n
* I
LUZON LUZON
Figure 4.83: The Horizontal Distribution of Water Temperature (°C) (8/1-8/6, 1985)at (a) 2000 dB and (b) 2500 dB (adapted from Wang (1986)).
4-83
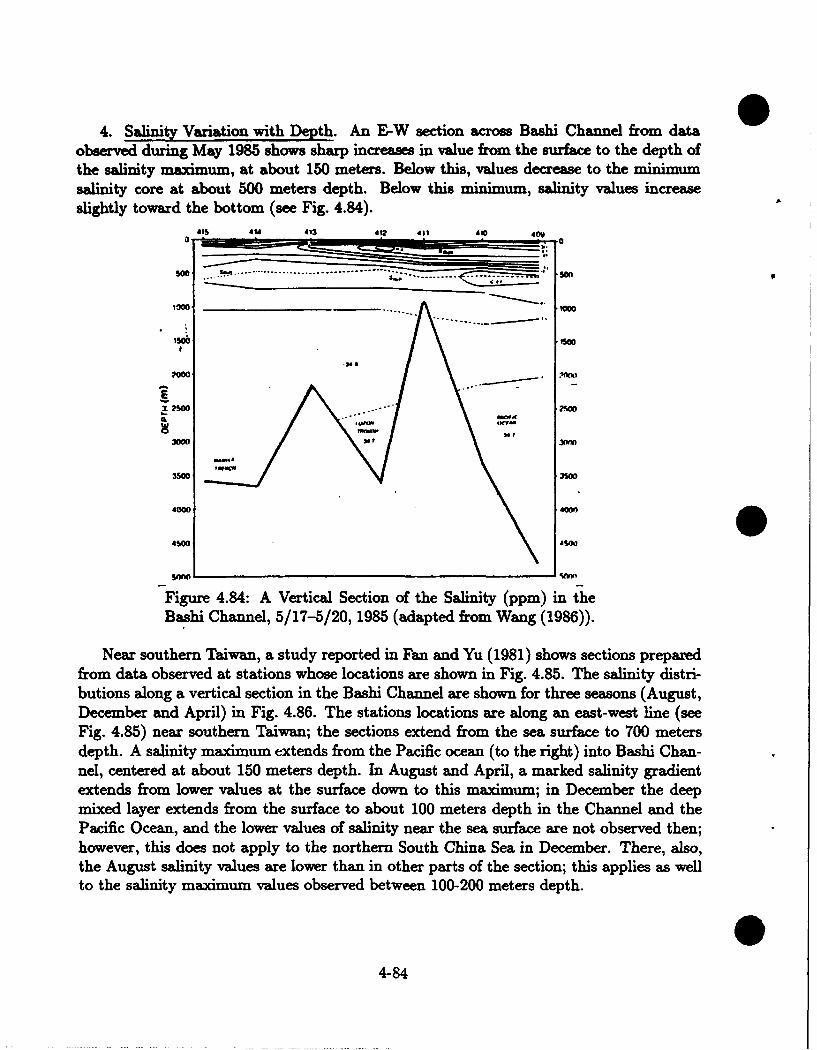
4. Salinity Variation with Depth. An E-W section across Bashi Channel from dataobserved during May 1985 shows sharp increases in value from the surface to the depth ofthe salinity maximum, at about 150 meters. Below this, values decrease to the minimusalinity core at about 500 meters depth. Below this minimum, salinity values increaseslightly toward the bottom (see Fig. 4.84).
415 414 413 412 11 4. 409
l . .. . ' _
3500 3500
4000 40
-Figur .4 A VetclSection, of the Salinity (ppm) in t-heBashi Channel, 5/17-5/20, 1985 (adapted from Wang (1986)).
Near southern Taiwan, a study reported in Fan and Yu (1981) shows sections preparedfrom data observed at stations whose locations are shown in Fig. 4.85. The salinity distri-butions along a vertical section in the Bashi Channel are shown for three seasons (August,December and April) in Fig. 4.86. The stations locations are along an east-west line (seeFig. 4.85) near southern Taiwan; the sections extend from the sea surface to 700 meters
depth. A salinity maximum extends from the Pacific ocean (to the right) into Bashi Chan-nel, centered at about 150 meters depth. In August and April, a marked salinity gradientextends from lower values at the surface down to this maximum; in December the deepmixed layer extends from the surface to about 100 meters depth in the Channel and thePacific Ocean, and the lower values of salinity near the sea surface are not observed then;however, this does not apply to the northern South China Sea in December. There, also,the August salinity values are lower than in other parts of the section; this applies as wellto the salinity maxidmuma values observed between 100-200 meters depth.
4-84
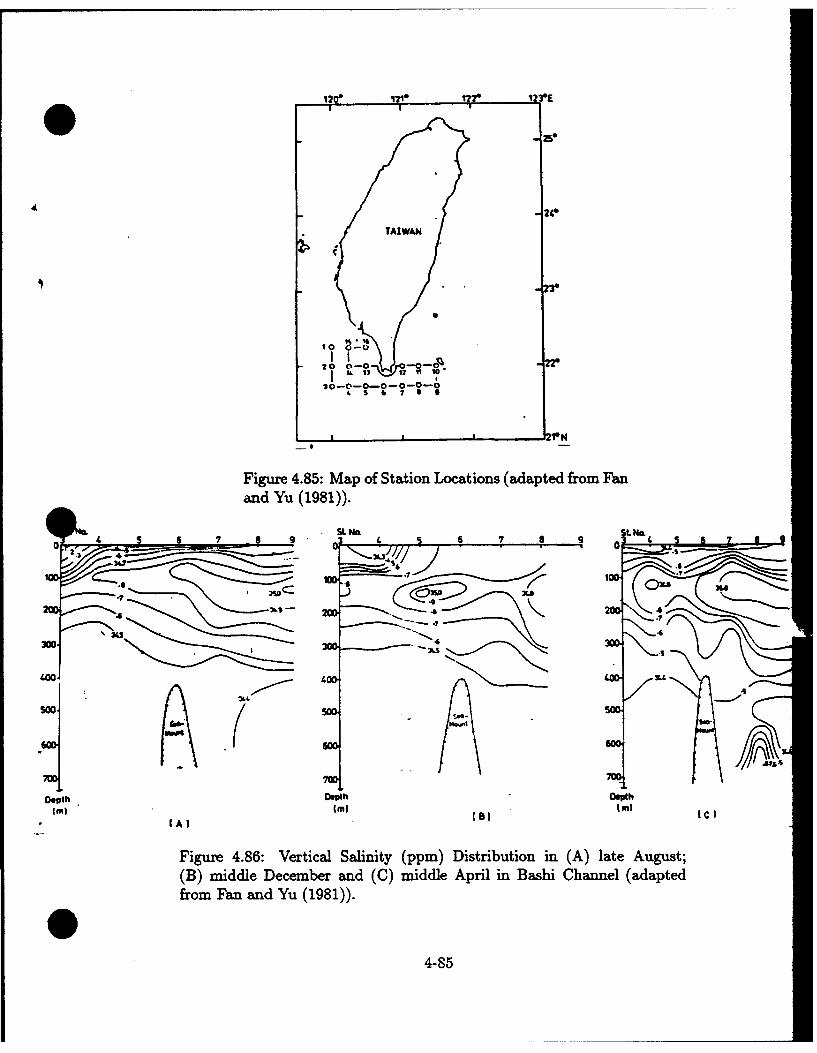
-20
I I11 ?TAIWAN
20 0C0 0 O
30-C0-0-0-0-0-04 S b 7 S
12rN
Figure 4.85: Map of Station Locations (adapted from Fanand Yu (1981)).
5 8 9 SL Na L NCL
.2... ..................... .1 .
" "7 3.
300.400. 4 0.
Oqpth vOeph 000thIr)IM)
W (C
Figure 4.86: Vertical Salinity (ppm) Distribution in (A) late August;(B) middle December and (C) middle April in Bashi Channel (adaptedfrom Fan and Yu (1981)).
4-85
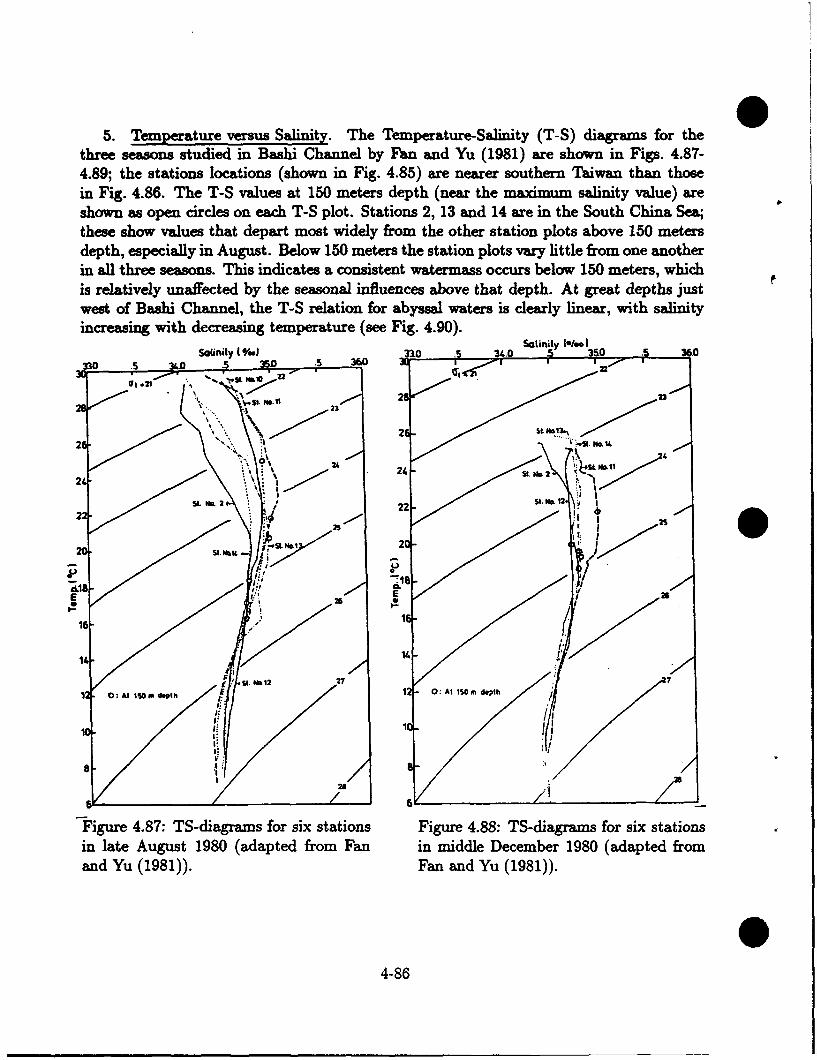
5. Temperature versus Salinity. The Temperature-Salinity (T-S) diagrams for thethree seasons studied in Bashi Channel by Fan and Yu (1981) are shown in Figs. 4.87-4.89; the stations locations (shown in Fig. 4.85) are nearer southern Taiwan than thosein Fig. 4.86. The T-S values at 150 meters depth (near the maximum salinity value) areshown as open circles on each T-S plot. Stations 2, 13 and 14 are in the South China Sea;these show values that depart most widely from the other station plots above 150 metersdepth, especially in August. Below 150 meters the station plots vary little from one anotherin all three seasons. This indicates a consistent watermass occurs below 150 meters, whichis relatively unaffected by the seasonal influences above that depth. At great depths justwest of Bashi Channel, the T-S relation for abyssal waters is dearly linear, with salinityincreasing with decreasing temperature (see Fig. 4.90).
Salinity (*s@ 3'.' Solinity l*l..I3n0y.55 33.0 530 ....35
23
1% o fs, 2 1
26
244 22222k
'2S
2662
Ne g 12 21 7
0. OAtISO 0depth 12 0: OAt 150mdepth
Figure 4.87: TS-diagrams for six stations Figure 4.88: TS-diagrams for six stationsin late August 1980 (adapted from Fan in middle December 1980 (adapted fromand Yu (1981)). Fan and Yu (1981)).
4-86
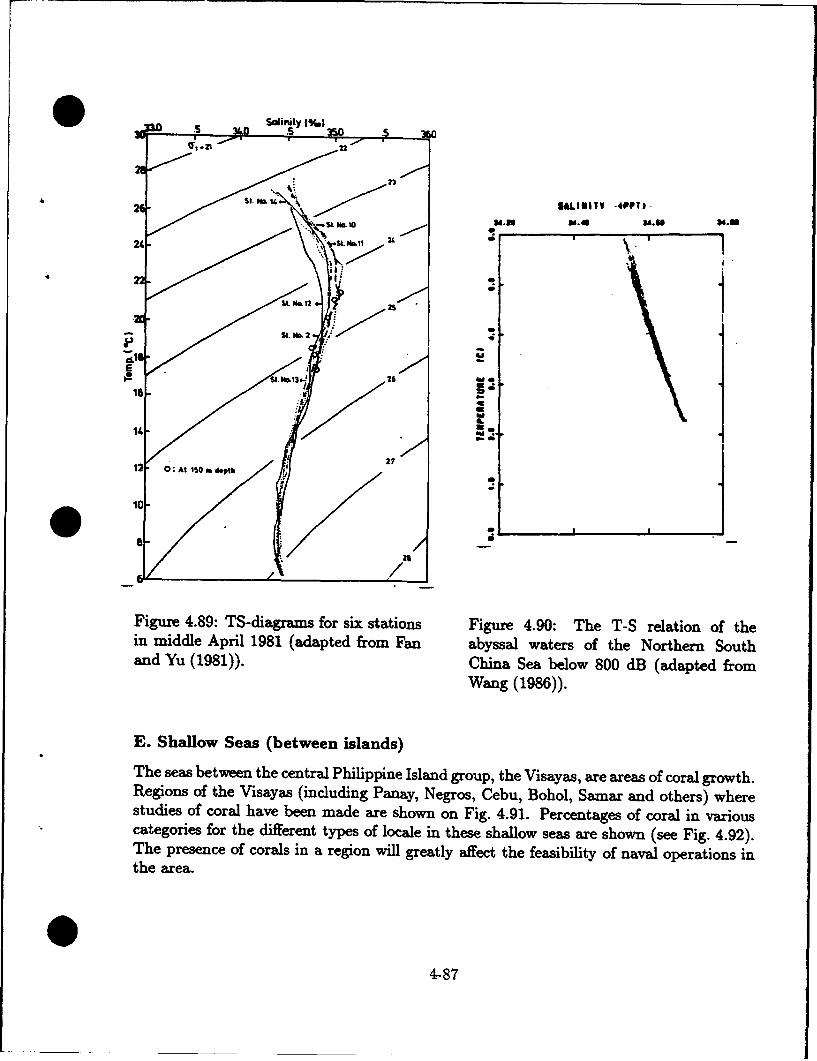
Salinity 1161
Fis 4 .9: Th.T- rao ft
Figue 4.89: etweendiacenras fhrsix e Istatins Fguroue 4.90:s The T-Srelation cof rothe
Regions of the Visayas (including Panay, Negros, Cebu, Bohol, Samnar and others) wherestudies of coral have been made are shown on Fig. 4.91. Percentages of coral in variouscategories for the different types of locale in these shallow seas are shown (see Fig. 4.92).The presence of corals in a region will greatly affect the feasibility of naval operations inthe area.
4-87
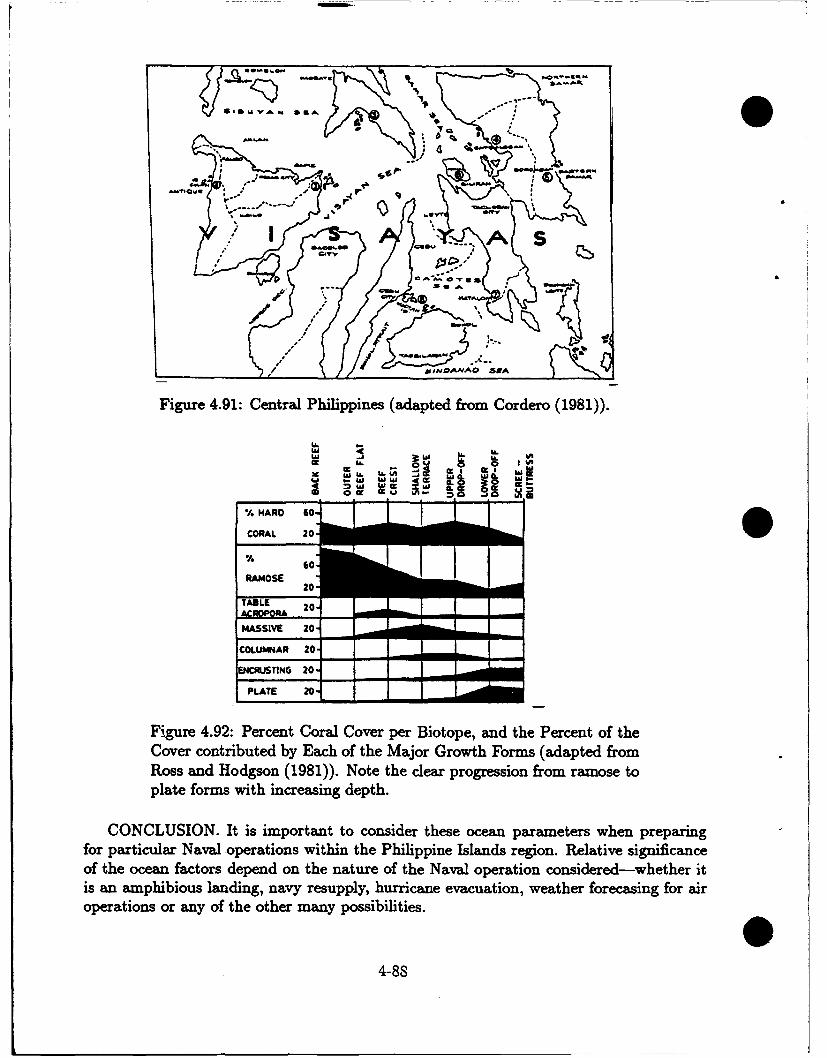
A S
'VI
Figure 4.91: Central Philippines (adapted from Cordero (1981)).
S ,
.A • AR -0-
COR l. F.0
HAR 60-
RAMOSE 0
TABLE A S
MASSIVE 20 -
C¢OLUMNAR 20-ENCRUSTING 20-
LPLATE 20-
Figure 4.92: Percent Coral Cover per Biotope, and the Percent of theCover contributed by Each of the Major Growth Forms (adapted from
Ross and Hodgson (1981)). Note the clear progression from ramose toplate forms with increasing depth.
CONCLUSION. It is important to consider these ocean parameters when preparingfor particular Naval operations within the Philippine Islands region. Relative significanceof the ocean factors depend on the nature of the Naval operation considered-whether itis an amphibious landing, navy resupply, hurricane evacuation, weather forecasing for air
operations or any of the other many possibilities.
4-88
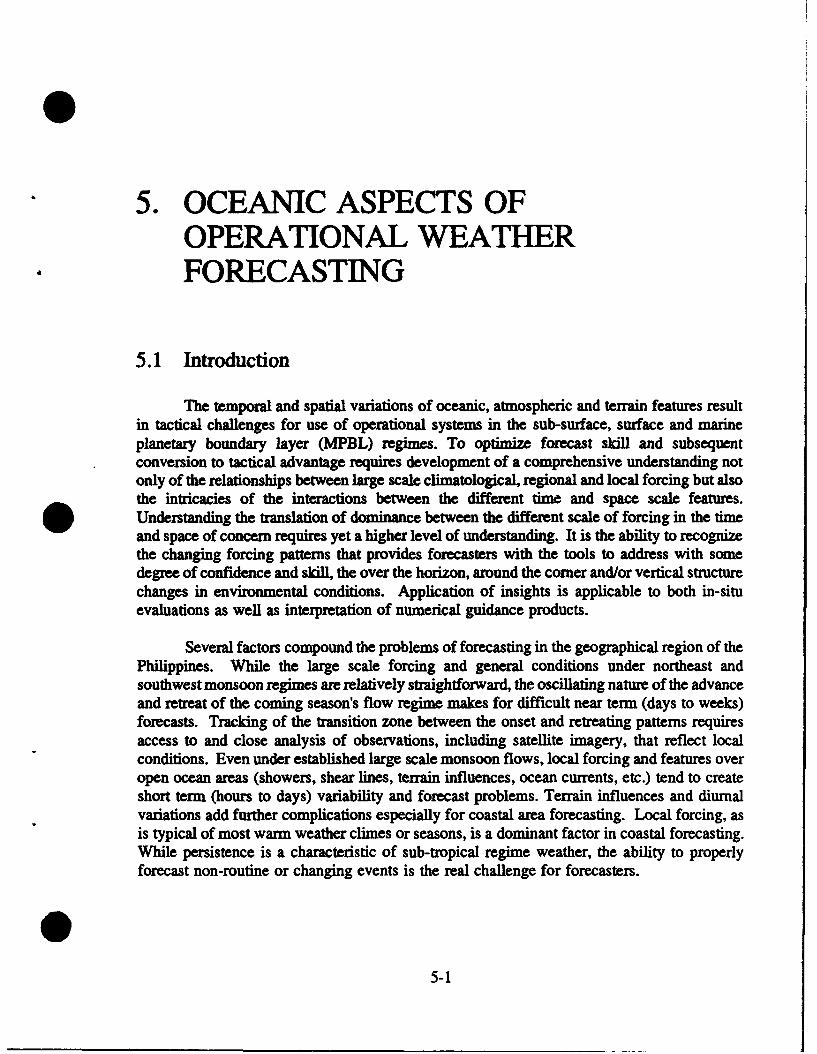
5. OCEANIC ASPECTS OFOPERATIONAL WEATHERFORECASTING
5.1 Introduction
The temporal and spatial variations of oceanic, atmospheric and terrain features resultin tactical challenges for use of operational systems in the sub-surface, surface and marineplanetary boundary layer (MPBL) regimes. To optimize forecast skill and subsequentconversion to tactical advantage requires development of a comprehensive understanding notonly of the relationships between large scale climatological, regional and local forcing but alsothe intricacies of the interactions between the different time and space scale features.Understanding the translation of dominance between the different scale of forcing in the timeand space of concern requires yet a higher level of understanding. It is the ability to recognizethe changing forcing patterns that provides forecasters with the tools to address with somedegree of confidence and skill, the over the horizon, around the comer and/or vertical structurechanges in environmental conditions. Application of insights is applicable to both in-situevaluations as well as interpretation of numerical guidance products.
Several factors compound the problems of forecasting in the geographical region of thePhilippines. While the large scale forcing and general conditions under northeast andsouthwest monsoon regimes are relatively straightforward, the oscillating nature of the advanceand retreat of the coming season's flow regime makes for difficult near term (days to weeks)forecasts. Tracking of the transition zone between the onset and retreating patterns requiresaccess to and close analysis of observations, including satellite imagery, that reflect localconditions. Even under established large scale monsoon flows, local forcing and features overopen ocean areas (showers, shear lines, terrain influences, ocean currents, etc.) tend to createshort term (hours to days) variability and forecast problems. Terrain influences and diurnalvariations add further complications especially for coastal area forecasting. Local forcing, asis typical of most warm weather climes or seasons, is a dominant factor in coastal forecasting.While persistence is a characteristic of sub-tropical regime weather, the ability to properlyforecast non-routine or changing events is the real challenge for forecasters.
5-1
Many factors of changing conditions can result in alteration of dominant forcing a nsubsequent further changes in conditions. While full understanding of the climatology of th'regime is essential, development of forecasting skill requires the understanding of thevariability of environmental parameters and the ability to anticipate short term and near termtrends and changes.
The material in the remainder of this section is provided as an aid in developing an
appreciation for the oceanic and atmospheric patterns and interactions for the regionsurrounding the Philippine Islands. Some discussions on applications of environmentalinformation to tactical situations and forecast aids are also provided. The emphasis here ison surface and MPBL aspects, the strata within which most of the navy operations occur.General atmospheric aspects are addressed in the first three sections of this handbook andoceanographic aspects in Section 4. For a review of ocean thermal and acoustic properties andresulting sound propagation readers are referred to general publications such as Aerographer'sMate Training manuals and area specific information in Special Publications 3160-NP7.Additional data and application programs can be obtained from the Tactical EnvironmentalSupport System (TESS).
5.1 Seasonal and Regional Variations
The atmospheric seasonal variability (climatology) is presented in Section 2. Oceanicregional variability is presented in Section 4. This section will combine aspects of bothseasonal and regional variations that can be used as forecast aids. 0
The largest temporal and spatial scale variability reflects the differences between thewarm season southwest monsoon and cold season northeast monsoon, and the transitionperiods from one to the other. Forecast reasoning for this subtropical region must be adjustedfor differing seasonal conditions just as must be done in midlatitudes. Oceanic structure andconditions also have pronounced seasonal variability.
The next largest spatial variability of atmospheric conditions reflect the interactions ofsynoptic circulation features including the subtropical high, Intertropical Convergence Zone,trade wind regime, alternating Asian continent warm season low and cold season high pressuresystems, and the monsoon trough. Comprehending the various roles of these features duringthe opposing monsoons and transitions can be viewed as a basic requirement for developingforecasting reasoning specific to this region. Generally only the northern most part of Luzonand waters to the north are influenced by midlatitude type migratory synoptic systems, andonly during the winter period. Translation of the variations of atmospheric flow conditionsto the forcing of the MPBL and upper layer of the ocean is the next step. Modifications ofthe synoptic scale atmospheric forcing and conditions due to local terrain and sea surfaceconditions is yet another level of complexity in forecast reasoning.
The geography and topography (Section 1.2) of the Philippines is very complex. Evenunder relatively uniform open ocean flow patterns such as those typical of the periods of fullydeveloped monsoons, terrain features induce a multitude of local effects including channelinO
5-2
comer effects, le/wind-ward side subsidence/convergence, barrier effects, etc. Routine studyof satellite imagery is the best way of rapidly acquiring expertise on local wind, weather,cloudiness and humidity patterns.
Oceanic features, in addition to the forcing by atmospheric conditions, are stronglyinfluenced by bathymetric and internal circulations (Section 4). In contrast with theatmosphere the variation of oceanic subsurface features are tied more to spatial than totemporal constraints. The oceanic transition from open basin to marginal sea occurs in thevicinity of the Philippines and has significant impact on surface conditions and air/seainteractions as well as on subsurface conditions. Details on spatial variations are presentedin Section 4.22.
5.3 Ocean Currents and Associated Fronts
The area east of the Philippines is dominated by the broad North Equatorial Currentwhich flows westward between 90 and 19°N, with speeds as high as 2.0 kt but generally atabout .5 kt. The current splits off southern Luzon and Lamar with the northern branchflowing through the Luzon Strait and then curving northeastward near 25°N as the KuroshioCurrent. The southern branch becomes the south-flowing Mindanao Current, with meanspeeds of 1.5 to 2.0 kt, which enters the Celebes Sea southeast of Mindanao. An eastwardextension of the Mindanao Current merges with other waters to form the east-flowing NorthEquatorial Countercurrent with an axis generally located between 30 and 6-N. A large coldeddy about 300 nm in diameter and centered near 70N, 134°E, produced by upwelling, existsbetween the North Equatorial Current and the North Equatorial Countercurrent.
The strongest ocean front in the western North Pacific region is associated with theKuroshio Current. The current and front increase in intensity as the current flows northwardeast of Taiwan and then northeastward west of the Ryukyu Islands. However, the Kuroshioshows little, if any, sea-surface-temperature signatures through the Luzon Strait area. Thelocation of the 16"C isotherm at a depth of 200 m is an indicator of the western boundary ofthe Kuroshio at the surface and the 180C isotherm at 200 m is representative of the locationof the maximum velocity core at a depth near 100 m. When crossing the Kuroshio thefollowing acoustic changes can be expected:
o Sound speed change of as much as 100 ft per sec.o Sonic layer depth changes of as much as 330 m.o In and below layer gradient changes.o Deep-sound channel axis changes of up to 800 m.o Sea-state changes and related ambient noise where SST gradients exist.o Refraction of sound rays with oblique crossing of the front.
The Mindanao Current results in acoustic changes similar to those of the Kuroshio.
5-3
Steep bathymetry gradients in coastal areas, along deep trenches, and regionstransition from deep basins to marginal seas can result in rapidly changing acoustic conditions.The Luzon Strait area has been noted for troublesome acoustic condition changes due to thecombination of bottom slope and ocean current/front conditions. An unclassified section ofSHAREM Report 35 of March 1980 addresses one such specific site located southeast ofOkinawa. In general the numerical guidance provided by grid point or single point ASW datadoes not account for the loss of bottom bounce or redirection of bottom bounce in areas ofsteeply sloped bottoms.
Areas of opposing ocean currents and winds are known to result in waves that arehigher, steeper, and of shorter wavelength. Additionally, it has been shown that areas of warmSST decrease the stability of the lower atmosphere and allow for more efficient transfer ofenergy from the wind to the sea surface. These elements are brought into focus in the areanorth of the Philippines when northwesterly winds behind frontal systems or migratory lowpressure systems flow over the oceanic frontal zones. The most extreme conditions of thisnature for the western North Pacific region occurs off southeastern Japan when northeasterlywinds, associated with migratory highs moving off Asia or lows passing south and east ofJapan, oppose the warm northeastward setting Kuroshio Current.
Some general purpose forecast aids for oceanographic conditions include:1. There is little seasonal change of the near-surface sound speeds, except for the
area north of the subtropical convergence zone (150 to 17"N).
2. The majority of the oceanic area is shallower than the critical depth; about 70of the area does not have enough depth excess to allow reliable convergence zones.
3. The cold eddy associated with upwelling of deep water, located in the vicinityof 7°N between Palau and Mindanao, results in a pronounced thermocline, and hence astronger negative sound speed gradient below the mixed layer.
4. Over the northern oceanic areas, the mixed layer depth generally increases inresponse to the strong northeast monsoon winds during winter with a steep thermoclinegradient below. During summer there is generally no mixed layer.
5. Over the near equatorial region the seasonal pattern of the mixed layer andthermocline tend to be reversed from the subtropical region.
6. The seasonal changes will be extreme over the shallow marginal sea areas; seeFigures 4.19a and b for seasonal variation examples.
7. The seasonal patterns follow the seasonal migrations of the sun.
5-4
S 5.4 Marine Planetary Boundary Layer
The marine atmosphere can be divided into two layers: the marine planetary boundarye (MPBL), and the free atmosphe. The MPBL is typically on the order of 1 km thick,
well mixed, and topped by a stable marine inversion. The free atmosphere is controlled bythe circulation of large-scale highs and lows. The surface effects exert little influence on thefree atmosphere. In contrast, the MPBL is influenced by both local and large scale patternsand is strongly influenced by surface effects. The primary surface effects are heating orcooling and friction. Surface effects cause the MPBL to be highly turbulent Electro-optical(E-O) and Electromagnetic (EM) systems performance are strongly influenced by thevariability of atmospheric conditions that characterize the MPBL.
5.5 Introduction to Electro-Optical and Electomagnetic Conditions
Electro-Optical (E-O) and Electromagnetic (EM) systems are playing an increasing rolein U.S. Navy operational activities. Fleet environmentalists have a growing requirement tosupport these systems and therefore a need for understanding the interactions between themarine environment and E-O/EM conditions. This introduction section provides some basicbackground material on electromagnetic (EM) radiation, its interaction with atmosphericconstituents, and general types of E-O systems of concern to fleet environmentalists. Theprimary sources of the information provided here are: Electro-Optical Handbook Volume I.. ASW/f-79-002 Cottrell et al, 1979, and Proceedings of Workshop to StandardizeAtmospheric Measurements in Support of Electro-Optical Systems. UDR-TR-83-71, Huffmanet al, 1983.
5.5.1 E-O/EM and the Atmosphere as a Medium
E-O and EM systems respond to electro-magnetic radiation as a sensed stimulus. Theatmosphere interferes to various degrees with these systems because it interacts with both thesource and propagation of radiation. The interaction depends on the atmospheric constituentsand the radiation wavelength. In this section the portions of the magnetic spectrum fromvisible through microwave wavelengths (0.4 micrometers through 10.0 centimeters) areaddressed. Table 5-1 provides categories of sensor wavelengths, general types of systems, andsignificance of adverse weather elements.
There are four atmospheric physical processes which affect electromagnetic (EM)radiation: reflection, scattering, absorption, and emission. The type and size of theatmospheric constituents, gaseous molecules and particulates (dust, haze, smokes, fogs, otheraerosols, cloud droplets, and precipitation) affect the propagation of radiation. The influenceon various wavelengths is determined by the relationship between the size of the atmosphericconstituents and the wavelength of the radiation. This relationship, referredto as the size parameter, is stated as:
5-5
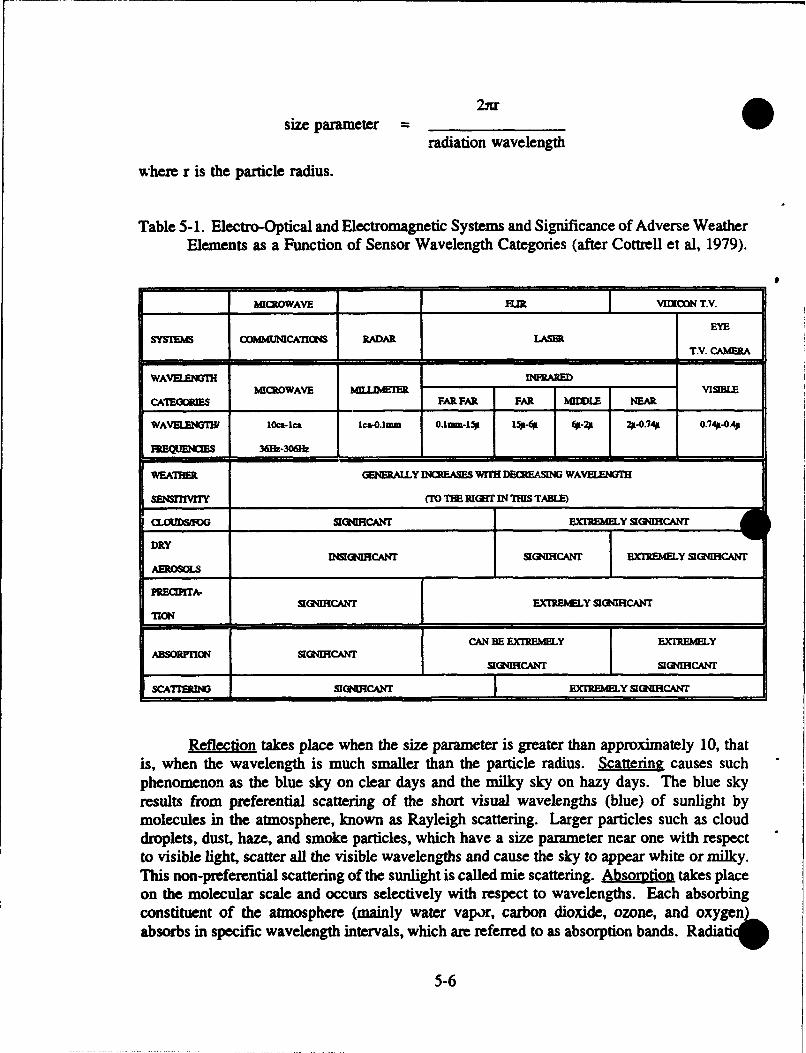
size parameter = 2sr
radiation wavelength
where r is the particle radius.
Table 5-1. Electro-Optical and Electromagnetic Systems and Significance of Adverse WeatherElements as a Function of Sensor Wavelength Categories (after Cottrell et al, 1979).
I MICROWAVE HA, VIICON T.V.
EYESYSTEMS COMMUNICATIONS RADAR LASER
TN. CMR
WAVELENOGI _ _ _ARED
M__OWAVE _LLUMER L
CATEGORS FAR FAR FAR MLE NEAR
WAVEEG 10locca Ica-0.1MM 0.1MM-15 1*-4 (0.2 21.74A o.741-oA•
FRQECE 36EPz.306&
WAHEAR GENERALLY 12CEAE Vff T CRES WAVELEGI'a
SENsrnivrY (Mo TEE RIGHTr IN THIgS TABLE)
CO D SIMIHCANT EXTREMELY gGMIHCANT
DRYIONI HCAN T SIGNICANT EXTREMY SIGNIHCANT
AEROSOLS
P'REClIPITASIONIRCANT UnEEY SIGNIGICANT
TION
CAN BE EXTREMELY EXIREMLYAmORFrONI SIGIMHCANT
SIONIRCANT SIGNIHCANr
SCATIEPRM SIG1%HCANT EXIIREMELY SIQNHCANT
Reflection takes place when the size parameter is greater than approximately 10, thatis, when the wavelength is much smaller than the particle radius. Scattering causes suchphenomenon as the blue sky on clear days and the milky sky on hazy days. The blue skyresults from preferential scattering of the short visual wavelengths (blue) of sunlight bymolecules in the atmosphere, known as Rayleigh scattering. Larger particles such as clouddroplets, dust, haze, and smoke particles, which have a size parameter near one with respectto visible light, scatter all the visible wavelengths and cause the sky to appear white or milky.This non-preferential scattering of the sunlight is called mie scattering. Absoation takes placeon the molecular scale and occurs selectively with respect to wavelengths. Each absorbingconstituent of the atmosphere (mainly water vapor, carbon dioxide, ozone, and oxygenSabsorbs in specific wavelength intervals, which are referred to as absorption bands. Radiati4
5-6
e a at other wavelengths is not significantly affected by that constituent. Emission is the emittingof electromagnetic radiation (for example, a flashlight beam or the heat from a householdradiator). The process operates on the molecular scale, and every constituent of theatmosphere or earth emits radiation. However, emission occurs selectively with respect towavelength, therefore the amount of energy emitted at a given wavelength may not besignificant.
The bulk or fundamental atmospheric Darameters of concern in E-O/EM forecastingare temperature, pressure, humidity, and wind. These elements determine the refractive index,absorption in the infrared, and the size and contribution to refractive index of atmosphericaerosols. Low-level profiles determine the atmospheric stability, which influences turbulence.Weather elements such as drizzle, rain, and snow can severely limit the performance of all ofthe E-O/EM systems.
Ogtcal turbulene, which degrades laser imaging systems, results from small-scaletemperature and humidity fluctuations associated with atmospheric turbulence or mixing of airof different temperature and humidity. This turbulence causes fluctuations in the opticalrefractive index in the atmosphere. The turbulence parameter that is related to laser systemperformance is known as the refractive index structure parameter, labeled C2N, which is afunction of temperature and humidity structure parameters. The turbulence or eddies that areof concern to lasers are very small, on the order of 10 to 20 cm. Surface effects of heating,cooling and friction cause the MPBL to be highly turbulent, and therefore large values of C&Nare encountered. The larger the CN value the greater the degradation of laser systems.
E-O systems in the visual through infrared wavelengths can be classified as eitherbroadband of laser (narrow line) types. Broadband means to extend over a range ofwavelengths, such as visual or infrared systems. A weapons system may combine bothbroadband and laser components e.g., a T.V. or forward looking infrared (FLIR) system usedto locate a target that is then designated (illuminated and tracked) with a laser. Environmentalsupport of combined systems would require consideration of the atmospheric parametersaffecting the wavelengths of each of the systems.
5.5.2 Comments on E-O/EM Systems and Atmospheric Interactions
This section addresses some general E-O/EM systems and atmospheric interactions ofconcern to the fleet environmentalist.
Visual Systems: (E-O) Cameras and human eyeballs are visual systems that requirecloud-free line-of-sight between the sensor and target. Furthermore, reduced visibility due toscattering and absorption by haze, fog, and precipitation limit the capabilities of visualsystems. Also, each visible system requires a minimum level of illumination.
55-7
Infrared Systems: (E-O) Lasers and Forward Looking Infrared Radar (FUR) are activand passive systems, respectively, that operate in the infrared wavelength and require cloud*free line-of-sight to the target Some lasers can penetrate thin cloudiness, and passive infraredsystems may detect hot targets through thin clouds. Haze, fog, and precipitation degrade thetransmission of energy at near infrared wavelengths. Systems operating at longer infraredwavelengths are degraded by absorption of energy by atmospheric water vapor.
Millimeter/Microwave Systems: (EM) Radar and microwave system performance isdegraded by two main atmospheric factors: Heavy cloudiness (thick cloudiness with largedroplet distributions of near-precipitation-sized particles), and precipitation.
5.5.3 High Energy Laser
Atmospheric conditions degrade High Energy Laser (HEL) system performance byreducing fluence (energy density per unit time deposited on the target) on the target in avariety of ways: aerosols and water vapor absorb energy, atmospheric turbulence spreads thebeam fluence, and atmospheric turbulence also causes the beam to wander off its intendedtarget (Burk et al, 1979).
Environmental conditions such as heavy rainfall and fog-induced low visibility canreduce the effectiveness of HEL systems to a point that precludes operation of such systems.Goroch and Brown (1980) produced a climatology of the frequency of occurrence of adverseweather conditions which would preclude operations of the HEL system. 0
In general the highest rain rates occur in the tropical zones (short periods of intenserain under convection cells), while higher latitudes tend to experience longer periods ofrelatively light rain. Local conditions related to upwelling and SST gradients, as well as large-scale warm surface air flow over cold water patterns, result in relatively high fog frequencies.Degraded HEL performance potential can be related to the climatology patterns of heavyrainfall and dense fog. Day-to-day performance will be influenced by these same conditions.
5.5.4 Forward Looking Infrared
The Forward Looking Infrared (FLIR) in ýormation presented in this handbook wastaken from the Naval Environmental Prediction Research Facility (NEPRF) technical report81-06, Climatology of Infrared Ranfes in Pacific OceanRe&Lons of the Northern Hemisphere(Goroch and Brown, 1981). This climatology was computed for a nominal FUR sensorattempting to detect a broadside cruiser target Expected range and standard deviations bymonth are available in this referenced report.
The basic concept of thermal sensing, such as FLIR, is the detection of a target by athermal detector which senses or perceives a temperature difference (contrast) between thetarget and its background. The temperature differences result from solar heating (insolation)or cooling by the ambient wind. The sensed or perceived contrast by the detector isdiminished by the atmosphere between the source (target and its background) and the receivO
5-8
(the infrared detector). The loss of contrast is termed the attenuation. The strongest reductionin contrast occurs during fog or precipitation. When visibility is less than I kin, FUR rangescan be considered the same as the visibility.
These absorption characteristics give the FUR ranges a close relationship to the generalatmospheric circulation patterns. In general there is a latitude-FLIR range correlation(increasing range with increasing latitude) reflecting a change from the warm moist stableequatorial area, to the cooler drier but variable mid-latitudes, and finally the cold dry polarregions. Effects such as continental outbreaks, stratus and fog regimes, upwelling, and oceaniccurrents and associated areas of cyclogenesis result in extreme variability of FUR ranges overnear coastal waters.
In the infrared wavelengths (3.4 to 5 micrometers and 8-12 micrometers) the absorptionby water vapor is generally the primary effect. Absorption by aerosol particles is normallyof secondary importance. However, under conditions of atmospheric low water vapor content(low temperature and/or relative humidity) the aerosol absorption becomes dominant. Theopen ocean north Pacific climatology of FLIR has the following general characteristics:
I. Increases from equator northward through mid-latitudes.WInter: Equator 10-15 km
40-50°N 30-35 knmSummer. Equator 10-15 km
near 60°N 30 km
2. Summer equatorial type ranges extend into mid-latitudes in central and westernPacific. Reflects the northward advection of warm/moist equatorial air on the western sideof northern hemisphere oceanic highs.
3. The variability of ranges increases with latitude and near coastlines. Reflectsthe variation of the general weather patterns and specifically the associated variations intemperature, relative humidity, and pressure.
FLIR climatology for the area of the Philippine Island and surrounding seas isinfluenced by coastal, as well as seasonal and latitudinal changes. FLIR ranges and variationsover the area south of about 40°N correlate highly with the monsoon patterns. Equatorialvalues, near 15 km with about 2 km variations, occur during July and August under the fullydeveloped Southwest Monsoon. Mid-latitude ranges of 25 to 30 km with variations of 10 to20 km are found during December through March reflecting the Northeast Monsoon andmigratory systems.
05-9
5.5.5 Radar and Microwave
The rfrtve index "n" is defined as the ratio of the speed of propagation of anelectromagnetic (EM) wave in a vacuum to that in the actual atmosphere. Since EM wavestravel slightly slower in air than in a vacuum, the index is slightly greater than unity. In orderto have numbers that are easy to handle, refractive index is expressed as (n-1)x10 6 or simplyN, which at the earth's surface has a numberical range between 250 and 400. Thiscorresponds to an n range of 1.000250 to 1.000400. Refraction is the bending of waves dueto a change in density of the medium (atmosphere) through which they are passing. Understandard, or "normal", conditions the density of the atmosphere decreases at a gradual butcontinuous rate with altitude. This density change is a function of decreasing temperature,humidity, and pressure and results in a rate-of-change of N of 12 units/1000 ft. When non-standard temperature and humidity vertical distributions occur the rate-of-change of N becomesnon-standard too unless the changes cancel each other out.
The speed of propagation of an EM wave in a vacuum is greater than in air.Therefore, under normal conditions with decreasing density with height, EM waves travelfaster at higher levels in the atmosphere than at lower. The result is that as a wave front, withsome vertical extent, moves through the atmosphere the upper portion moves fastest andresults in a downward bending or refraction of the wave front. The standard refraction ratehowever, is less than the curvature rate of the earth's surface. The end result is that understandard atmospheric conditions the wave front gradually moves away from (to higher altitude)the earth's surface but at a lesser rate than a line tangent to the earth's surface.
5.5.6 Elevated and/or Surface Based Ducts
In the real world the atmosphere is seldom, ff ever, standard. The actual refractivegradient is typically slightly greater (super refraction) or less (subrefraction) than standard.Certain conditions occur which disrupt the standard temperature and humidity distributions tothe extent that a significant degree of EM wave bending occurs and the wave becomes twithin a layer of the atmosphere. This occurs under conditions of increasing temperature orsharply decreasing humidity with increasing altitude (as with an inversion). Anomalouspropagation (AP) of the radar or microwave energy will then take place. The energy trappedwithin the layer will provide extended ranges in the layer or duct, but reduced ranges willresult in the region which the waves were refracted away from.
There are three general types of ducts: 1) elevated ducts, 2) surface-based ducts thatextend down from elevated trapping layers, and 3) evaporation ducts.
Elevated ducts primarily affect airborne operations. They are the result of moisturelayers and/or elevated temperature inversions. They may be found anywhere from the surfaceto 20,000 ft or more, but are most common below 10,000 ft.
Surface-based ducts can result in extended detection, intercept, and communicationranges for all frequencies above 100 MHz (Petit and Hamilton, 1984). These extended rang*
5-10
presuppose that both the transmitter and receiver are in or near the duct. Surface-based ductsare typically associated with subsidence under high pressure systems or other areas highlystable atmospheric condition. In reference to high pressure cells they form most frequentlyunder the southeast quadrant (northern Hemisphere), northeast quadrant (southern hemisphere)and near the center of the systems.
Evaoraio ducts are created by strong negative vertical water vapor gradients (i.e.,water vapor rapidly decreases with height). Normally they occur within 100 ft of the surfaceand tend to extend ranges for surface-to-surface systems operating above 3 GHz.
Meteorological factors affecting evaporation duct height climatology for 10 Atlanticocean weather stations were studied by Sweet (1980). Some general observations from thisstudy that are considered applicable to the general problem include:
1. Evaporation duct heights are normally within 100 ft of the sea surface.
2. Evaporation duct heights increase as latitude decreases. Median annual ductheights (the height exceeded half the time during the year) ranged from about 50 ft at 35°Nto about 20 ft at 55°N and remained nearly constant to 62°N, the northernmost station in thestudy.
3. Increased air and sea surface temperatures result in higher duct heights.
4. Stronger winds result in higher duct heights.
5. Sea surface temperatures greater than air temperatures result in higher ductheights.
Helvey and Rosenthal (1983) conducted a study to define ways of inferring refractionconditions from synoptic parameters. Considerable scatter or variation in duct conditions wasfound when attempting to correlate synoptic conditions with refractive conditions, resultingin an acknowledgement in the report that the procedures developed should be consideredtentative interim guidance.
Ducting in the open ocean areas surrounding the Philippines is representative of thegeneral latitudinal (subtropical) and atmospheric circulation (subtropical high and monsoonalconditions) conditions. The largest variations will be found in those regions that experiencethe greatest amount of synoptic pattern variability. In general the area to the north and westof the Philippines, which experiences both of the monsoon patterns plus northeast trades underthe westward extension of the oceanic subtropical high as well as cold season passage of shearlines and midlatitude frontal systems, will experience the greatest variability in ductingconditions and heights. The complex terrain of the Philippine Islands will result in largelocalized variations in EM and E-O conditions. Satellite imagery and local knowledge ofterrain/wind flow interactions are important in recognizing existing or potential conditions ofleeside drying, funneling of low level flow, areas of convergence, land/sea breeze regimes andother locally forced conditions.
5-11
General forecast aids based on region-specific conditions include:
1. Evaporation ducts tend to be slightly higher (4-8 m) east relative to west of thePhilippines.
2. During the winter the area to the east tends to have a greater frequency ofenhanced surface-to-surface range conditions.
3. The conditions throughout the region are more homogenous in space and timeduring summer than during winter.
4. Spatial variations are greater from east to west over the northern oceanic areasrelative to the more equatorial latitudes.
5. In the region north and west of the Philippines surface ducts are most commonduring summer, while elevated ducts are more common during winter.
6. The region north and west of the Philippines experiences significant seasonalatmospheric circulation change (NE and SW monsoons) and therefore is the area of largestseasonal variations in E-O/EM conditions.
7. Over the cold eddy, centered near 7°N 134E, there is a winter seasonalmaximum of elevated ducts, but a summer maximum of surface ducting.
8. Over the northern oceanic areas evaporation ducts with heights exceeding 40m (132 ft) are more frequent during day than night, while evaporation ducts of 20 m (66 ftor less) are more common at night.
9. In general elevated ducts are most common in the 5 to 10,000 ft range, withlower heights (<3,000 ft) occurring over the southern oceanic areas during summer and fall.
5.5.7 Forecast Aids for Elevated and/or Surface Based Ducts
The following synoptic features and inferred elevated trapping layer (ETL) indicatorsare provided for assistance in forecasting existing ETL conditions. When coupled withforecasting of synoptic or climatological patterns, these inferences can also be helpful inforecasting future ETL conditions.
1. The strongest and most persistent inversions and associated refractive layersoccur in the equatorward half of subtropical oceanic highs, particularly the southeast quadrantin the northern hemisphere and northeast quadrant in the southern hemisphere.
2. Tracking westward under the equatorward half of the subtropical highs,convection related to warmer SST results in a progressively higher and weaker inversion (andrefractive layer) with a correspondingly deeper marine planetary boundary layer (MPBL).
5-12

3. Changes from fog through low stratus areas to higher stratocumulus andcumulus areas infer a higher and weaker inversion.
4. Ocean currents influence the thickness of the MPBL. Warm currents, such asthe Kuroshio of the western North Pacific weaken and increase the thickness of the MPBLwhile cold currents intensify and reduce the thickness of the MPBL.
5. Because inversions and ducting are associated with subsidence and stable layers,therefore highs rather than lows, the frequency of ducting shows a strong correlation with SLP.When the SLP is below 1000 mb, the probability of ducting is very low (<10%) while withSLP >1020 the probability approaches 50%.
6. Duct frequency versus surface wind direction is at a minimum for S throughWNW winds and a maximum for NNW through SE winds.
7. Duct frequency increases as the temperature difference between the surface and700 mb decreases. Small differences indicate a stable atmosphere (high frequency of inversionand ducts) and large differences indicate an unstable atmosphere and convective activity (lowfrequency of inversion and ducts).
Forecast Aids for Prediction of Standard Refractive Conditions
1. Area of concern is located within the northwest quadrant of subtropical highs.
2. Under or immediately following an active front.
3. Area of cyclonically curved isobars.
4. Close to a low pressure center.
5. Surface pressure less than 1000 mb.
6. Cold air aloft, 700 mb temperature less than -10C.
7. Presence of cumulus and deep convective clouds.
8. Unstable, windy conditions.
9. Open celled clouds behind frontal systems.
Forecast Aids for Duct Height
1. The maximum frequency of oceanic ducts occurs in the 4,000 to 6,000 ft layer.
2. A secondary frequency maximum occurs between the surface and 2000 ft whenthe SLP is >1018 mb and surface winds are <6 kt (near centers of highs).
5-13
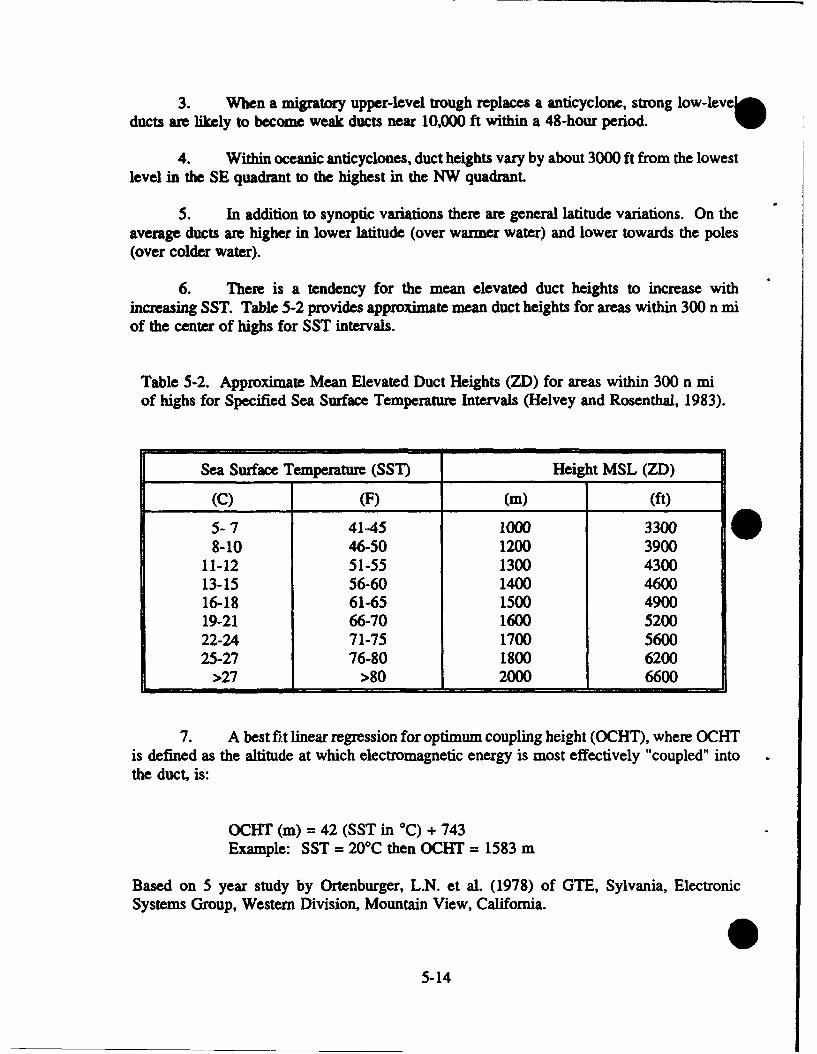
3. When a migratory upper-level trough replaces a anticyclone, strong low-leveoducts are likely to become weak ducts near 10,000 ft within a 48-hour period.
4. Within oceanic anticyclones, duct heights vary by about 3000 ft from the lowestlevel in the SE quadrant to the highest in the NW quadrant.
5. In addition to synoptic variations there are general latitude variations. On theaverage ducts are higher in lower latitude (over warmer water) and lower towards the poles(over colder water).
6. There is a tendency for the mean elevated duct heights to increase withincreasing SST. Table 5-2 provides approximate mean duct heights for areas within 300 n miof the center of highs for SST intervals.
Table 5-2. Approximate Mean Elevated Duct Heights (ZD) for areas within 300 n miof highs for Specified Sea Surface Temperature Intervals (Helvey and Rosenthal, 1983).
Sea Surface Temperature (SST) Height MSL (ZD)
(C) (F) (m) (ft)
5-7 41-45 1000 33008-10 46-50 1200 3900
11-12 51-55 1300 430013-15 56-60 1400 460016-18 61-65 1500 490019-21 66-70 1600 520022-24 71-75 1700 560025-27 76-80 1800 6200
>27 >80 2000 6600
7. A best fit linear regression for optimum coupling height (OCHT), where OCHTis defined as the altitude at which electromagnetic energy is most effectively "coupled" intothe duct, is:
OCHT (m) = 42 (SST in °C) + 743Example: SST = 20°C then OCHT = 1583 m
Based on 5 year study by Ortenburger, L.N. et al. (1978) of GTE, Sylvania, ElectronicSystems Group, Western Division, Mountain View, California.
0
5-14
. Forecast Aids Based on Satellite Interoretation
1. In regions of offshore flow where clear conditions extend seaward and changeto lighter gray shade areas and then smooth stratus type clouds, surface-based ducts are likely.These areas are under the influence of high pressure and subsidence.
2. In regions of offshore flow where distinct cloudlines are seen forming, near-standard propagation conditions are probable. The areas generally have well mixed andunstable atmospheric conditions.
3. Improved visibility, EM ranges, and weakened low level inversions are typicallyfound in the lee of mountainous islands. In visual imagery these areas will appear darkerthan surrounding areas, unless they are in a sunglint area in which case very bright return willbe seen if surface winds are light.
4. Cornering effects result in increased winds, convergence, cloud development,and typically degraded visibility and EM conditions. Cornering effects occur where moderateor stronger winds blow around islands or points of land.
5. Increasingly lighter gray shades over water areas imply increased atmospherichumidity and/or aerosols and reduced visibility and EM ranges.
6. When smoke plumes from coastal facilities can be seen extending for somedistance in satellite imagery or by eye, a temperature inversion is likely near the top of thesmoke plume level.
7. The SST pattern in shallow coastal water areas will exhibit a strong seasonalreversal relative to the deep water SST. Coastal waters tend to be hot in summer and cold inwinter and will modify the atmosphere above it and the EM conditions. Summer heatingprovides well mixed and near normal conditions. Winter cooling will stabilize the lowerlevels resulting in low level inversions and generally reduced EM ranges.
8. Areas of smooth low-level stratus are likely to be topped by a low-levelinversion, and ducting is likely (may be surface-based).
9. The appearance of ship condensation wails indicates a strong shallow marinelayer and probable surface-based ducts.
10. Frontal bands imply strong winds, well mixed atmosphere, and near-standardpropagation conditions.
11. The areas of open cells, to the rear of fronts, indicate unstable conditions andtherefore are likely to have near-standard propagation conditions.
12. Areas of closed cells indicate stable conditions, and inversions and ducting areprobable.
5-15
13. Over the region where the closed cells become smaller and change to smootlcontinuous structures the inversions and duct heights will be lowering. W
5.6 REGIONAL ATMOSPHERIC CIRCULATION PATTERNS
The following paragraphs cover circulation patterns over and to the west of thePhilippine Islands. Forecast aids for the oceanic area east of the Islands are contained inSection 5.7.
5.6.1 Northeast Monsoon
During the Northeast Monsoon, a Siberian high cell commencing to move southeasterlywill cause the gradient to strengthen across southern China and the northern South China Sea.Usually a surface wind maximum will move south from the Yellow and East China Seas. Thewind maximum may not be gale force, but when it reaches the Taiwan Strait it will increaseby 10 to 15 kt. If a wind maximum with speeds of 20 kt or greater is approaching Taiwan,the forecaster should expect gale force winds in the channel. If the wind maximum wasalready gale force, then a storm warning should be considered. Similar conditions occur withan approaching tropical cyclone (FWC/JTWC, 1978).
When the 1017 mb isobar reaches the south coast of China and the pressure at HongKong (45005) is higher than the pressure at the southern tip of Taiwan, gale force winds wi*occur in the Taiwan Strait with speeds up to 40 kt (NOCF, Cubi Point, 1984).
Within 6 to 12 hours after a cold frontal passage at station 46734, gale force winds willprevail in the Taiwan Strait and spread into the South China Sea (NOCF Cubi Point, 1984).
The following has been extracted from NOCF, Cubi Point, 1984):
1. During the Northeast Monsoon, when strong winds are being funneled throughthe pass to the northeast of Cubi Point, moderate turbulence may be expected for all aircraftdeparting on runway 07 on climb through 5,000 feet.
2. During the Northeast Monsoon, light to moderate turbulence up to 10,000 feetmay be forecast on the lee side of mountains in northern Luzon. Lenticular clouds arecommon with mid-level inversion.
3. Indications that a northeast surge is invading the Cubi Point area are: Gustywinds starting about 0200L, sea level pressure above normal between 0200L and 0400L, andtemperatures slightiy cooler than normal.
5-16
4. During the Northeast Monsoon, when the 3,000 to 5,000 ft winds are 10 to15 kt and the inversion on the 1200 GMT Clark AB sounding is' fairly deep, small craftconditions may be forecast for the following day.
5. The oceanic region around and north of Luzon experiences the highest windspeeds during autumn as the northeast monsoon builds up. Over the rest of the area, windspeeds reach a maximum in winter at the height of the combined northeast monsoon and tradewinds regimes.
5.6.2 Shear Lines
1. If the outbreak of polar air is weak, there will be increased mid-level cloudinessbut no precipitation with the passage of a shear line at Cubi Point. If the shear line isparticularly intense and well defined, rainfall will be heavier but will last for only a few hoursand be followed by clearing weather.
2. With an isotach maximum of 30 kt or more over the South China Sea andmoving westward, a shear line may form over Luzon.
3. When the sea level pressure difference between Cubi Point and Okinawa is10 mb or more, light rain or drizzle will be experienced with passage of a shear line. If thepressure difference is less than 10 mb, only increased cloudiness will occur.
4. When the continental high pressure cell is moderate to strong and ridging east-southeastward behind a moderate cold front, the following guidelines apply.
a. If the low associated with the front moves north of Japan, expect shearline passage at Cubi Point when the low moves east of 115TE.
b. When the Shanghai low forms and moves along the southern coast of
Japan, expect passage of the shear line at Cubi Point when the low passes 140TE.
5.6.3 Easterly Waves
Because of the lack of a good network of reporting stations east of the Philippines, itis difficult to forecast or detect passage of easterly waves at Cubi Point. At no time are theya typical occurrence and only in the spring when the easterly flow is best established is theremuch likelihood of their passage over the Cubi Point area.
. 'Not available since 1991.
5-17
The following guidelines have been taken from the 1984 edition of the Eoamr'ICLsHandbook. NAS Cubi Point. R.P.. published by the NOCF, Cubi Point, R.P.
1. Unless it is possible to analyze and follow the progress of an easterly wavefrom the time it passes Belau (91408), the first indication of entry into ate Philippines maybe its passage across eastern Mindanao.
2. Easterly wave passage at Cubi Point may be anticipated roughly 24 hours afterthe first indications of its approach are observed along the east coast of the Philippines.
3. Weather conditions during passage of an easterly wave consist of drizzle orshowers, scattered to broken low clouds, broken middle clouds, and a high overcast
4. If an easterly wave passes during the period of maximum heating of the day,it may set off a wide area of thunderstorm activity.
5. The most adverse weather conditions at Cubi Point during the winter monthsusually occur when an easterly wave passes over the Philippines at the same time that a shearline is approaching from the north.
6. Easterly waves move at an average speed of 10 to 15 kt and reach theirmaximum intensity in the layer from 700 to 500 mb, sloping eastward with height.
7. When the wave moves slower than the basic current in the low levels and fasterthan the basic current in the upper levels, the area west of the wave is characterized bysubsidence and fair weather while areas of convergence and disturbed weather occur east ofthe trough.
8. The best aid in looking for easterly waves is by use of consecutive satellitepictures. By looking for the inverted "V" cloud pattern, which is often diffused, and bykeeping a daily track on these cloud patterns, the forecaster can determine its movement.
9. Easterly wave generally stagnate over the Philippines or intensify the "lee side"trough to the west.
10. Any time a station in the tropics is observed reporting haze, with the exceptionof industrialized Manila, it should be immediately suspected as being below the subsidenceinversion in advance of an easterly wave.
5.6.4 Southwest Monsoon
1. A shift from southwesterly to easterly flow during the Southwest Monsoon willbring a period of fair weather to Cubi Point for the duration of the easterly flow.
5-18
2. With moderate southwesterly flow, weather over Cubi Point will be lowovercast with reduced visibility and intermittent light to moderate rain and thunderstorms.This condition can be expected to last for at least a 24-hour period.
3. Tropical cyclones crossing the Philippines or moving through the Bashi Channelenhance the southwest flow once they reach the South China Sea.
4. During the Southwest Monsoon, expect the most frequent rainshower orthunderstorm activity between 0600L and 1000L with a break between 1 100L and 1300L withrainshower activity commencing again at 1300L until 1700L. If the showers do not let upbetween I1OOL and 1300L, but persist until about 1400L, there will be no further afternoonshowers.
5. During the Southwest Monsoon, if the winds are southwesterly greater than15 kt between the surface and 300 mb, continuous rain may be forecast.
5.6.5 Cloudiness
1. When surface winds are from the south-southwest through west-southwest(190°-240°), coming right up the mouth of the bay, conditions within the bay will ge solidovercast. With surface winds from the west-southwest through west (240°-270o), coming overthe mountains to the west of Cubi Point, broken conditions or breaks in the overcast may beforecast.
2. During the Northeast Monsoon, when the 1200Z Clark sounding2 shows astrong inversion and surface winds are forecast in the 6-10 kt range, broken stratocumulus maybe forecast over the field from just before sunrise to two hours after sunrise. When the 1200Zsounding shows a mid-level inversion and the 850 mb winds are 10-20 kt, a middle cloudlayer may be forecast over the field during the same time period.
5.6.6 Visibility
When showers are coming in from the east, visibility may be forecast as low as 3 to5 miles; if approaching from the southwest through west, it is possible for visibility to gobelow minimums.
5.6.7 Thunderstorms
1. When the southwesterly flow is comparatively deep in the spring transitionmonths or during the Southwest Monsoon, afternoon thunderstorms may be expected at CubiPoint.
* 2Not available since 1991.
5-19
2. The frequency of occurrence of elevated ducts or superrefraction layers over th•Philippine Sea is at a maximum during winter (30-70%) and in general increases in frequency4Wand height under the portion of the subtropical flow where subsidence/trade wind cappedinversions is developed. Frequencies of occurrence decrease to the south due to surfaceheating and to the west due to atmospheric mixing and synoptic scale circulation.
3. During the Southwest Monsoon when a land breeze, however light, exists,expect a line of thunderstorms and associated rainshowers to form off the coast between0500L and 0700L.
4. There is a good chance of thunderstorms if 850 mb winds are southwesterly25 kt or greater.
5. Well developed cumulus buildups often result in a weak counter-clockwisemicro-circulation that may extend 3 to 5 miles out from the cell and result in 5 to 10 kt ofextra wind speed.
5.6.8 Turbulence
1. During a strong surge in the southwesterly flow, the easterly jet stream isdirectly over Luzon and creates moderate turbulence between 10,000 and 25,000 feet.
2. During the Northeast Monsoon, when strong winds are being funneled throug:the pass to the northeast of Cubi Point, moderate turbulence may be expected for allaircrdeparting on runway 07 on climb through 5,000 feet.
3. During the Northeast Monsoon, light to moderate turbulence up to 10,000 feetmay be forecast on the lee side of the mountains in northern Luzon. Lenticular clouds arecommon with a mid-level inversion.
4. During a strong surge in the southwesterly flow, the easterly jet stream isdirectly over Luzon and creates moderate turbulence between 10,000 and 25,000 feet.
5.7 FORECAST AIDS FOR OCEANIC AREAS EAST OF THEPHILIPPINES
The following guidelines have been taken from the 1969 edition of NWSED, Agana,Guam's Local Area Forecaster's Handbook and generalized for forecasting shear line passageover the oceanic area east of the Philippine Islands.
5.7.1 Forecasting the Movement of Shear lines
The forecasting of the movement of shear lines has been a difficult experience formany meteorologists due to their unique nature and the paucity of reference material.
5-20

1. A weak frontal inversion will be associated with the shear line.
2. As the shear line approaches within about 200 n mi the trade inversion willstrengthen.
3. As the shear line passes, winds will back from easterly and increase in speed.There will be a marked decrease in convective type clouds. An increase in the temperature-dew point spread will occur following passage of the shear line.
5.7.2 Intertropical Convergence Zone (1TCZ)
Pilot reports and satellite data, along with oceanic island reports, are essential forlocating and determining movement of the ITCZ3. An increase in middle clouds and abovenormal convective activity can be expected as the ITCZ approaches from the south. Whenthe =TCZ moves to within about 100 n mi to the south of a location a marked increase inshower activity can be expected. Weather will improve rapidly when the 1TCZ moves to thenorth and dissipates. The situation will be of short duration, however, as a new ITCZ willform within 12 to 24 hours near the mean seasonal position.
5.7.3 Easterly Waves
Troughs in the easterlies are sometimes difficult to locate. Often the best indicationof a wave approaching the area will be from a pilot debrief or satellite imagery. Sharpquestioning by the forecaster concerning winds and weather enroute will often provide theclues needed to ascertain the location of a wave. Factors te determine include: The locationand extent of any significant weather, significant wind shifts, and the position of the shift inrelation to the weather. The line of weather should be oriented north-south, and the wind shiftfrom easterly to southeasterly, thence northeasterly, when proceeding westbound. A good ruleof thumb is to advance the wave westward at an average speed of 10 kt when actual data arenot available.
h 3If the winds to the south of the convergence zone cloudiness have a westerly component,
the phenomena is the Monsoon Trough, not the ITCZ.
5-21
* References
Apel, J. R., J. R. Holbrook, A. K. Liu, and J. J. Tsai, 1985: The Sulu Sea Internal SolitonExperiment. Journal of Physical Oceanography, 15, 1625-1651.
Atkinson, G., 1971: Forecasters' Guide to Tropical Meteorology. Air Weather ServiceTechnical Report 240, 300 pp.
Bowin, C., R. S. Lu, C.-S. Lee, and H. Schouten, 1978: Plate Convergence and Accretion in theTaiwan-Luzon Region. Bull. Am. Assoc. Pet. Geol., 62 (9), 1645-1672.
Boyle J. S. and T.-J. Chen, 1987: Synoptic Aspects of the Wintertime East Asian Monsoon.Monsoon Meteorology. Eds. C.-P Chang and T. N. Krishnamurti. Oxford Monographson Geology and Geophysics No. 7. Oxford University Press, New York.
Brand, S. and L. Blelloch, 19-12: Changes in the Characteristics of Typhoons Crossing thePhilippines. ENVPREDRSCHFAC Technical Paper No. 6-72, Naval ResearchLaboratory, Monterey, CA 93943-5502, 31 pp.
Burk, S. D., A. K. Goroch, A. I. Weinstein, and H. A. Panofsky, 1979: Modeling the RefractiveIndex Structure Parameter in the Marine Planetary Boundary Layer. NEPRF 79-03, NavalResearch Laboratory, Monterey, CA 93943-5502.
Carpenter, G. H., 1989: Surface Circulation Associated with the Mindanao and HalmaheraEddies. Master's Thesis, Naval Postgraduate School, Monterey, CA, 122 pp.
Chingchang, B., C. T. Shyu, J. C. Chen, and S. Boggs, Jr., 1985: Taiwan: Geology,Geophysics & Marine Sediments. Chapter 11, pp. 520, 522, 536. The Ocean Basins andMargins, Vol 7A, The Pacific Ocean, A. E. M. Nairn, F. G. Stehli, and S. Uyeda, Eds.Plenum Press, New York & London.
Chuang, W.-S., 1985: Dynamics of Subtidal Flow in the Taiwan Strait. Journal,Oceanographical Society of Japan, 41, 65-79
Chuang, W.-S., 1986: A Note on the Driving Mechanisms of Current in the TaiwanStrait. Journal, Oceanographical Society of Japan, 42, 355-361.
Commander Naval Oceanography Command (CNOC), 1989: U. S. Navy Regional Climatic Studyof the Central East Asian Coast and Associated Waters. NAVAIR 50-IC-556.NAVOCEANCOMDET Asheville NC, 313 pp.
R-1
Commander Naval Oceanography Command (CNOC), 1990: Naval Oceanography CommandFacility, Cubi Point Forecaster's Handbook. NAVOCEANCOMFAC USNAS Cubi Point, WRepublic of the Philippines, 127 pp.
Conlee, D. T., 1991: Satellite Image Display and Processing with Microcomputers: A Proof-of-concept for the Navy Oceanographic Data Distribution System. MS thesis. NavalPostgraduate SchooL Monterey, CA 93943-5000, 56 pp.
Cordero, P. A., Jr., 1981: Eco-morphological Observation of the Genus SARGASSUM in CentralPhilippines, including Notes on their Biomass and Bed Determination. THE REEF ANDMAN, Vol. 2 (Gomez, E. L. et al., Editors). University of the Philippines, Quezon City,Philippines, p. 401.
Cottrell, K.G., P.D. Try, D.B. Hodges, and R.F. Wachtmann, 1979: Electro-Optical Handbook,Volume 1, Weather Support for Precision Guided Munitions Air Weather Service.AWS/TR-791002, 97 pp.
Dewey, J. F., 1972: Plate Tectonics. Continents Adrift and Continents Aground. W. H. Freeman& Co., San Francisco, 34-35, 40.
Dvorak, V. F., 1984: Tropical cyclone intensity analysis using satellite data. NOAA Tech.Report NESDIS 11, Washington D.C., 47 pp.
Eicher, D. L., and A. L. McAlester, 1980: History of the Earth. Prentice-Hall, Inc., EnglewoodCliffs, NJ, p. 291.
Elsberry, R. L., W. M. Frank, G. J. Holland, J. D. Jarrell and R. L. Southern, 1987: A GlobalView of Tropical Cyclones. Marine Meteorology Program, Office of Naval Research,Washington, DC, 185 pp.
Exon, N. F., F.-W. Haake, M. Hartmann, F.-C Kogler, P. J. Muller, and M. J. Whitiker, 1981:Morphology, Water Characteristics and Sedimentation in the silled Sulu Sea, southeastAsia. Marine Geology, 39(3/4), 165-195.
Fan, K.-L., and C.-Y. Yu, 1981: A Study of Water Masses in the Seas of Southernmost Taiwan.
Acta Oceanog. Taiw., 12, 94-111.
Fan, K.-L., 1982: A Study of Water Masses in Taiwan Strait. Acta Oceanog. Taiw., 13, 140-153.
Fengqi L, S. Yusong, and F. Liqun, 1988: Application of Method of Fuzzy Sets to theAnalysis of Water Masses in the northern South China Sea. Acta Oceanologica Sinica,7(2), 170-185.
R-2
* Fett, R. W., P. E. La Violette, M. Nestor, J. W. Nickerson, and K. Rabe, 1977: Navy TacticalApplications Guide. VoL II. Naval Research Laboratory, Monterey, CA 93943-5502, p.3D-5.
First Weather Wing, U. S. Air Force, 1987: Terminal Forecast Reference Notebook. Detachment5, 20th Weather Squadron, Clark Air Base, Republic of the Philippines, 73 pp.
Fleet Weather Central/Joint Typhoon Warning Center (FWC/JTWC), Guam, 1978: Area ofResponsibility Forecaster's Handbook. U.S. Naval Weather Service Command, NSTLStation, Bay St. Louis, MS 39529.
Flores, J. F., and V. F. Balagot, 1969: Climate of the Philippines. World Survey of Climatology(H. Arakawa, Ed.), Vol. 8, Elsevier Scientific Publishing Company, Amsterdam, TheNetherlands, 159-213.
FNOC, 1991: Navy Oceanographic Data Distribution System (NODDS 3.0) Users' Manual. FleetNumerical Oceanography Center, Monterey CA 93943-5005, 76 pp.
Fu, R., A. D. Del Genio and W. B. Rosso, 1990: Behavior of Deep Convective Clouds in theTropical Pacific Deduced from ISCCP Radiances. J. Climate., 3, 1129-1152.
Geise, G. S., and R. B. Hollander, 1987: The Relationship between Coastal Seiches at PalawanIsland and Tide-Generated Internal Waves in the Sulu Sea. Journal of GeophysicalResearch, 92 (C 5), 5151-5156.
Goerss, J. S., and P. A. Phoebus, 1992: The Navy's Operational Atmospheric Analysis. Wea.Forecasting, 7, 232-249.
Goroch, A.K. and T. Brown, 1980: Frequency of Adverse Weather Conditions AffectingHigh Energy Laser Systems Operations. NAVENVPREDRSCHFAC Technical ReportTR 80-06, Naval Research Laboratory, Monterey, CA 93943-5502.
Guard, C. P., 1985: An Observational Assessment of the Southwest Monsoon East of EastAsia. Presented at the International Conference on Climatology and AppliedMeteorology. Manila, Republic of Philippines, 17 pp.
Guard, C. P., 1986: Local and Regional Influences on the Meteorology of CentralAmerica. Air Weather Service Forecaster Memo (AWS/FM-86/002), 23 pp.
Guard, C. P., L. E. Carr, F. H. Well, R. A. Jeffries, N. D. Gural and D. K. Edson, 1992: JointTyphoon Warning Center and the Challenges of Multibasin Tropical Cyclone Forecasting.Wea. Forecasting, 7, 328-352.
R-3
He, Y., and W. B. White, 1987: Interannual Variability of the Kuroshio Frontal Structure alongits western boundary in the N. Pacific Ocean associated with the 1982 ENSO Event.Journal of Physical Oceanography. 17(9), 1494-1506.
Helvey, R.A. and J.S. Rosenthal, 1983: Guide for Inferring Refractive Conditions from SynopticParameters. Pacific Missile Test Center, Tech. Paper TP00005, 36 pp.
Hogan, T. F., and T. E. Rosmond, 1991: The Description of the NavyOperational Global Atmospheric Prediction System's spectral forecast model Mon. Wea.Rev., 119, 1786-1815.
Huang, R., and C.-C. Huang, 1987: Plankton Communities in the Surface Waters ofTaiwan Strait. Acta Oceanog. Taiw., 18, 16-23.
Hufford, G. L., 1991: Some Items of Interest from the First Symposium on Volcanic Ash andAviation Safety. Western Region Technical Attachment, No. 91-32. Western RegionHeadquarters of the National Weather Service, Salt Lake City, UT, 4 pp.
Hung, T.-C., C. C. H. Tsai, and N.-C. Chen, 1986: Chemical and Biomass Studies: (1) Evidenceof UpweUing off the Southwestern Coast of Taiwan. Acta Oceanog. Taiw.. IT, 19-44.
Hung, T.-C., B.-C. Han, and D.-S. Hsu, 1987: Chemical and Biomass Studies: (2) BiologicalActivities in Upwelling off the Southwestern Coast of Taiwan Including the Penghu Area.Acta Oceanog. Taiw., 18, 62-74.
Ingmanson, D. E., and W. J. Wallace, 1973: Oceanology, An Introduction. WadsworthPublishng Co., Inc., Belmont CA, pp. 51, 55.
Kanari, S-I., and T. Teramoto, 1981: Bashi Channel, Luzon Strait: A Hydraulic ModelExperiment of the Tidal Current. J. Oceanog. Soc., Japan, 37, 31-48.
Kendall, T. R., 1969: Net Transports in the Western Equatorial Pacific Ocean. Journal ofGeophysical Research, 74(6), 1388-1396.
Krause, D. C., 1966: Tectonics, Marine Geology, and Bathymetry of the Celebes Sea - SuluSea Region. Bull. Geological Society of America. 77(8), 813-832.
LaFond, E. C., 1966: South China Sea. Encyclopedia of Oceanography, R. W. Fair-bridge, Ed., Reinhold Publishing Corp. NY, 829-837.
Levitus, S., 1982: Climatological Atlas of the World Ocean. NOAA Professional Paper 13.Environmental Research laboratories, Geophysical Fluid Dynamics Laboratory,Princeton, NJ, 173 pp.
R-4
* Li, H.-W., and K.-H. Su, 1987: A Numerical Model of Typhoon Surges and Tides in theSeas Adjacent to Taiwan. Acta Oceanog. Taiw.,18, 39-48.
Liu, C.-T., S.-G. Liau, S-.C. Pai, and K.-K. Liu, 1986: Water Masses in the WesternPhilippine Sea-Physical Aspects. Acta Oceanog. Taiw., 17, 1-17.
Lukas, R., 1988: Interannual Fluctuations of the Mindanao Current Inferred from Sea LevelJournal of Geophysical Research, 93(C 6), 6744-6748.
Matsuzawa, J., 1968: Second Cruise for CSK RYOFU MARO, Jan. - Mar. 1968. TheOceanographical Magazine, 20(2), 173-185.
McCoy, F. L., and C. Sancetta, 1985: North Pacific Sediments. The Ocean Basins and MarginsVol. 7A, The Pacific Ocean, A. E. M. Nairn, F. G. Stehli, and S. Uyeda, Eds. PlenumPress, New York & London, 1-64.
Miller, R. J., T. L. Tsui and A. J. Schrader, 1988: Climatology of North Pacific TropicalCyclone Tracks. Technical Report TR 88-10, Naval Research Laboratory, Monterey, CA,93943-5502, 511 pp.
Miller, R. J., A. J. Schrader and T. Tsui, 1989: Automated Tropical Cyclone ForecastingSystem Version 2.6 (Users Guide), Naval Research Laboratory, Monterey, CA, 93943-5502, 57 pp.
Murdock, J. M., 1980: The Transparency of Southeast Asian and Indonesian Waters. Master'sThesis. Naval Postgraduate School, Monterey, CA, 161 pp.
National Geographic Society, 1981: National Geographic Atlas of the World. 5th ed.Washington, DC, 383 pp.
Naval Oceanography Command Facility (NOCF), Cubi Point, R.P., 1984: Forecaster's Handbook,NAS Cubi Point, R.P. Commander, Naval Oceanography Command, NSTL Station, BaySt. Louis, MS 39529.
Ortenburger, L.N., S. B. Lawson, and G. K. Miller, 1978: Optimum ElectromagneticEnergy/Ducting Coupling Height. GTE, Sylvania, Electronic Systems Group, WesternDivision, Mountain View, California.
PAGASA, 1987: Climatological Normals/Averages of the Philippines (1951-1985). PhilippineAtmospheric, Geophysical and Astronomical Services Administration, Quezon City,Republic of Philippines, 64 pp.
R-5
Petit, P, and H. Hamilton, 1984: Assessing and Displaying the Effects of Elevated Trapping Layersin Support of Navy Command and Control. NEPRF CR 84-01, Naval Research Laboratory, WMonterey, CA, 93943-5502, 82 pp.
Ramage, C. S., 1971: Monsoon Meteorology. Academic Press, New York, 296 pp.
Ross, M. A., and G. Hodgson, 1981: A Quantitative Study of Hermatypic Coral University andZonation at Apo Reef, Philippines. THE REEF AND MAN, Vol. 2 (Gomez, E. L. et al.,Editors). University of the Philippines, Quezon City, Philippines, p. 283.
Sadler, J. C. and T. C. Wann, 1984: Mean Upper Tropospheric Flow over the Global Tropics,Volume II. AWS/IR-83/002 Air Weather Service (MAC), Scott AFB, illinois 62225,48 pp.
Sadler, J. C., M. A. Lander, M. A. Hori and L. K. Oda, 1987a: Tropical Marine Climatic Atlas.Vol. I (Indian Ocean and Atlantic Ocean). Dept. Met., U. of Hawaii. Tropical OceansGlobal Atmosphere (TOGA) and Equatorial Pacific Ocean Climatic Studies (EPOCS).UHMET Report 87-01, 51 pp.
Sadler, J.C., M. A. Lander, M. A. Hori and L. K. Oda, 1987b: Tropical Marine Climatic Atlas.VoL H (Pacific Ocean). Dept. Met., U. of Hawaii. Tropical Oceans Global Atmosphere(TOGA) and Equatorial Pacific Ocean Climatic Studies (EPOCS). UHMET Report 87-02,27 pp.
Schramm, W. G., 1979: Airborne Expendable Bathythermograph (AXBT) ObservationsImmediately Before and After Passage of Typhoon Phyllis in August of 1975. TR-79-05,Naval Research Laboratory, Monterey, CA, 93943-5502, 48 pp.
Shepard, F. A., P. A. McLaughlin, N. F. Marshall, and G. G. Sullivan, 1977: Current-meterRecordings of Low-speed Turbidity Currents. Geology, 5, 297-301.
Shevtosov, V. P., A. S. Salomatin, and V. I. Yusupov, 1985: Investigation of the VolumeScattering of 12- and 30-kHz Frequency Sound in the Pacific Ocean. Izvestiya,Atmospheric and Oceanic Physics, 21(6), 489-494.
Shoemaker, D. N., 1991: Characteristics of Tropical Cyclones Affecting the Philippine Islands(draft). Naval Oceanography Command Center/Joint Typhoon Warning Center TechnicalNote 91-01, 35 pp.
Sweet, W., 1980 Meteorological factors Affecting Evaporation Duct Height Climatologies.NAVENVPREDRSCHFAC Technical Report TR 80-02, Naval Research Laboratory,Monterey, CA, 93943-5502, 33 pp.
R-6
* Tjia, H. D., 1966: Sulawesi (Celebes) and Sulu Seas. The Encyclopedia of Oceanography, R.W. Fairbridge, Ed., Reinhold Publishing Corp., NY, 885-890.
Toksoz, M. N., 1975: The Subduction of the Lithosphere. Continents Adrift and ContinentsAground. W. H. Freeman & Co., San Francisco, 114-115.
Toole, J. M., E. Zou, and R. C. Millard, 1988: On the Circulation of the Upper Waters in thewestern equatorial Pacific Ocean. Deep-Sea Research, 35(9), 1451-1482.
Uda, M., 1966: Philippine Sea and Waters South of Japan. The Encyclopedia of Oceanography,R. W. Fairbridge, Ed., Reinhold Publishing Corp., NY, 705-712.
United States Air Force Environmental Technical Applications Center (USAFETAC), 1985:Situation Climatic Briefs. USAFETAC/DS-85/030. Scott Air Force Base, Illinois 62225-5438, Asia: pp. C-56-2 through C-56-5.
U.S. Department of Commerce, National Oceanic and Atmospheric Administration, National OceanService, 1989: Tide Tables, 1990: High and Low Water Predictions: Central and WesternPacific Ocean and Indian Ocean, pp. 144-167.
U.S. Naval Oceanography Command Center/Joint Typhoon Warning Center 1991: 1990 AnnualTropical Cyclone Report. NAVOCEANCOMCEN/JTWC, COMNAVMARIANAS, PSC489, Box 12, FPO AP 96540-0051, 278 pp.
U.S. Naval Oceanography Command Center/Joint Typhoon Warning Center, 1992: 1991 AnnualTropical Cyclone Report. NAVOCEANCOMCEN/JTWC, COMNAVMARIANAS, PSC489, Box 12, FPO AP 96540-0051, 238 pp.
Wang, L., 1986: Observation of Abyssal Flows in the Northern South China Sea. Acta Oceanog.Taiw., 16, 36-45.
Wang, J., and C.-S. Chern, 1988: on the Kuroshio Branch in the Taiwan Strait duringWintertime. Progress in Oceanography, 21(3-4), 469-491.
Western Region Headquarters of the National Weather Service, 1992: The Volcanic AshForecast Transport and Dispersion (VAFIAD) Model. Western Region Technical
Attachment, No. 92031, Salt Lake City, UT, 5 pp.
Williams, F. R., G. H. Jung and R. J. Renard, 1989: Forecasters Handbook for CentralAmerica and Adjacent Waters. Naval Research Laboratory, Monterey, CA, 93943-5502,TR-89-08, 508 pp.
Wilson, J. T., 1963: Continents Adrift Continents Adrift and Continents Aground. W. H.Freeman & Co., San Francisco, 22-23.
1R-7
Woodruff, S. D., R. J. Slutz, R. L. Jenne and P. M. Steurer, 1987: A Comprehensive Ocean- iAtmosphere Data Set. Bull. Amer. Meteor. Soc., 68, 1239-1250. '
Xiang, H. Y., 1988: Temperature and Salinity Distributions in the South China Sea andAdjacent Waters. Progress in Oceanography, 21(3-4), 493-501.
Yin, F., 1988: Seawater Variation east of Taiwan. Progress in Oceanography, 21(3-4), 457-467.
R-8
Appendix A
Comprehensive Ocean-AtmosphereData Set
During the 1970s and 1980s many programs set out to improve the atmospheric and oceanic data bases.The Equatorial Pacific Ocean Climate Studies (EPOCS) conceived a large joint effort to compile global shipobservations by the Environmental Research Laboratories of NOAA; the Cooperative Institute for Researchin Environmental Sciences (CIRES) of NOAA and the University of Colorado; the National Center forAtmospheric Research (NCAR); and the National Climatic Data Center (NCDC) of NOAA. The productof the endeavor was the Comprehensive Ocean-Atmosphere Data Set (COADS) for the period 1850-1979.Details of the collection, evaluation and compilation of the ship observations are contained in Woodruff etal. (1987).
Data density is three times greater in the Atlantic Ocean basin than in the Pacific Ocean basin, andgreater along shipping lanes. Presented on 2? by 20 grids in two volumes (Sadler et al. 1987a and Sadleret al. 1987b), COADS, while being the best data base yet assembled, displays large areas, especially in thetropics and the Southern Hemisphere, with inadequate data for analysis. Since the Philippine Islands wereplotted on the margins of both of the original volumes, the data was replotted over a single chart coveringthe South China Sea, the Philippine Islands and the Philippine Sea. While the reader must refer to Sadleret al. (1987a/b) to determine the number of observations in each 2? by 2? grid, generally there are >30 shipobservations per month in the northwest sector of the following charts, 2-10 ship observations per monthnear Visayas and Mindanao, but only 1-2 ship observations per month in the southeast region (east of 130*Eand south of 10*N.). Therefore the analyses of the southeastern corner of the charts in this appendix wereperformed on a very inadequate data base.
This inadequate and uneven distribution of data, as well as large gradients and relatively small atmo-spheric systems in the tropics dictated a manual analysis. Thus, in contrast to machine analysis-with whichit differs significantly-, the manual analysis permits a variable radius of data influence and the incorporationof auxiliary information and experience.
The authors selected the 80-year period, 1900-1979 for their atlases. In this appendix, the averagesfor the following three elements are presented for each month of the year: surface wind (streamlines andresultant wind speeds in m/s), sea level pressure in hectopascals (hPa or millibars) minus a thousand, andsea surface temperature (in degrees Celsius).
A-1
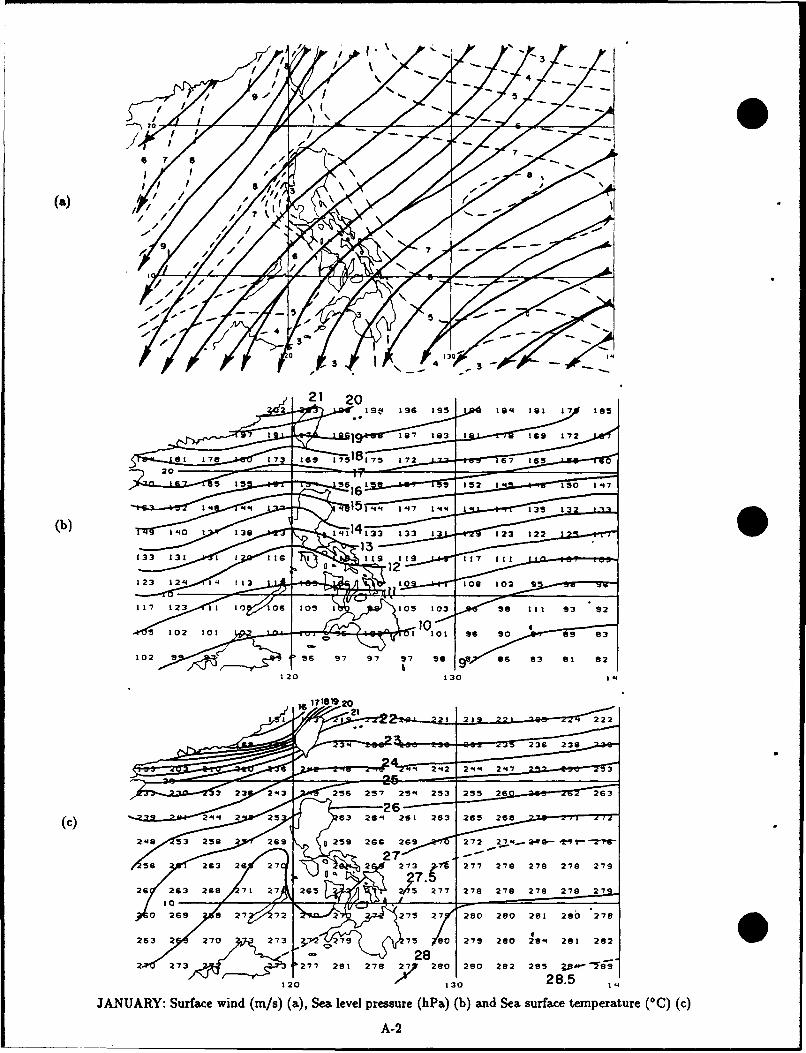
(a) ,
6 7
/ no / ,/' "J •,-.\Y ","
3AUAY Srac wn (/) a, ealve resre(ha ()an Sasufcetmpraue °)5c
4 ' 11A12

S/5 \ ,(a)
4112 to0 I
14ý,4
14 '045 296 2'418 SO 1 7
56 265 266 267 267
2I4253 215 2 2266 2 266 266 261 27]M2I 27 ('c)
265 267 266 273277 277 2"77 217 277 278 28 0b
13 2 3 t 271 12 " 2 7 1 2 ! i"17 1 7
06 2J .. 276 275J 2"76 277 277 2"78 275 92 263 282S~28030 1'
FEBRIUARY: Surface wind (m/s) (a), Sea level pressure (hPa) (b) and Sea surface temperature (0 C) (c)A-3
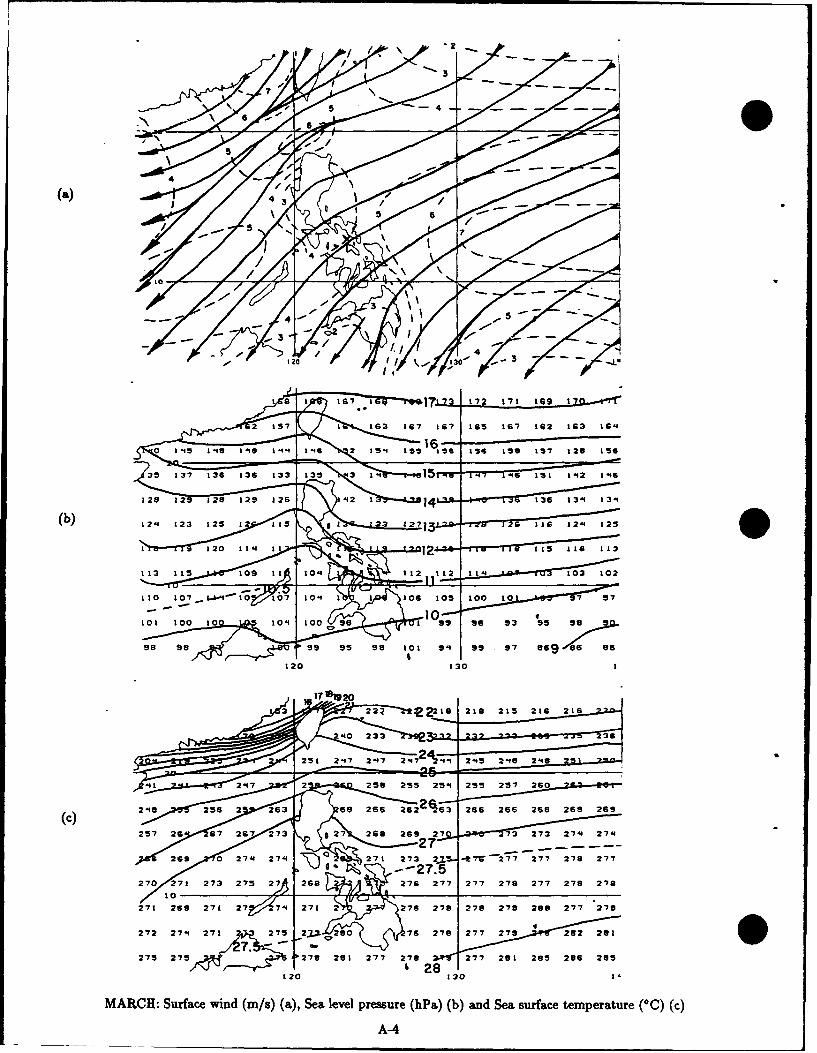
7 ,3(a) 01
4 15-"
M 4
6120_ 1 20 1
2 -15 17 1620 1. -- 6 6 12 13 1
35~~~~~• 137 236 13 3 3531 5r72 47 i 3,11 N
(b) 12 2 25 q 1 7 its a 13 11 ý17 ý2- 2s'
1 13 15 109 2 17 10• 1 2 ? 27 27 20 8
2so so25 s27 18 277 998 92 7 2 e 28 28 9
(c)8
120 130 1+
MARCH: Surface wind (m/s) (a), Sea level presure (hPa) (b) and Sea surae temperature (°C) (c)
A-4
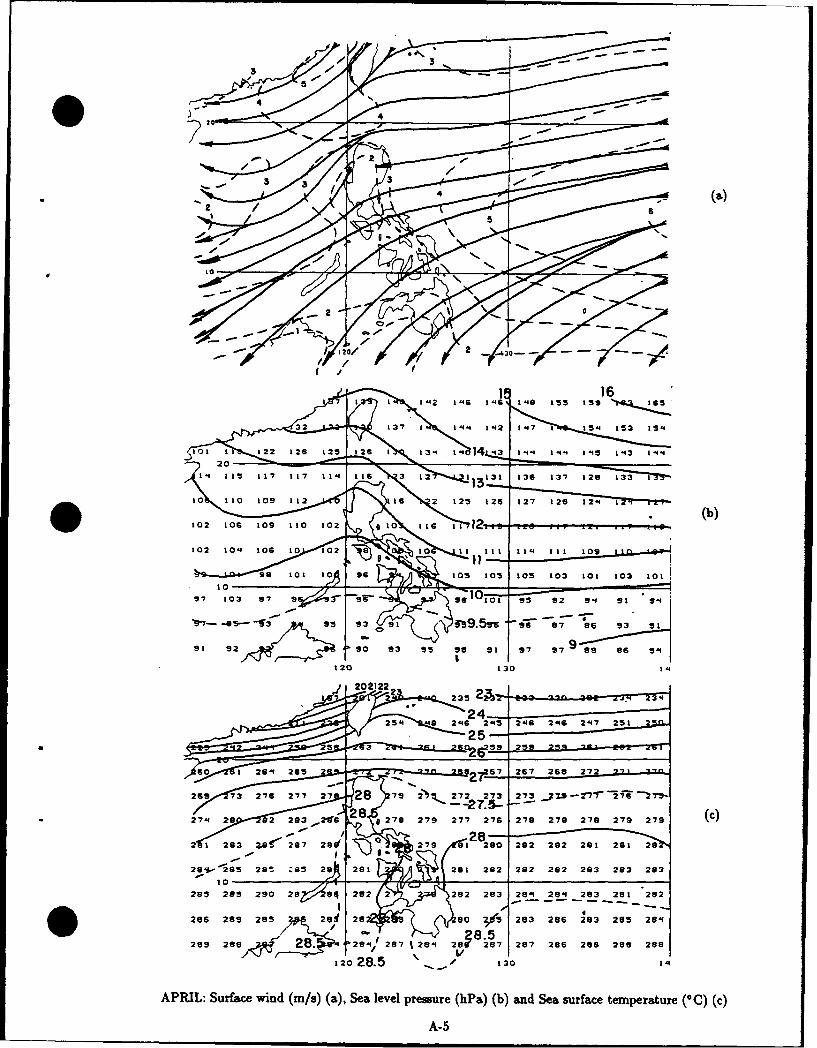
120%
....... ...... .........
4'
29g. 29 9 9 9 2 3 29 29 292 29..3.93..
4-1
1! 1
28 28 28 28z 28 .86 1/ 269 . 53 28 283 285 28
/
2832828 137 28 1 26 284 128 28 286 28 288
""I--'1•J 122 126 125 L26 t3 I ( "+ '149.5 1. .'7 1-4 1"3 "1-4
31120 130 1
110 ~ ~ • 10 20112 .... 2i2 2 - 2 l-
:02 10,_ 109 2110 102z• 1_ 1" I-S 1• 12 -- b
102 014 oe 1 10 ----1 . 1 "- -W li
1 0 so lot_,, ills Cj 10 03 1 5 10 0 0 o
io 28. 23 2...- 3-o
APRIL: Surface wind (m/s) (a), sea level pressure (hPa) (b) and Sea surface temperature (0 C) (c)
A-5
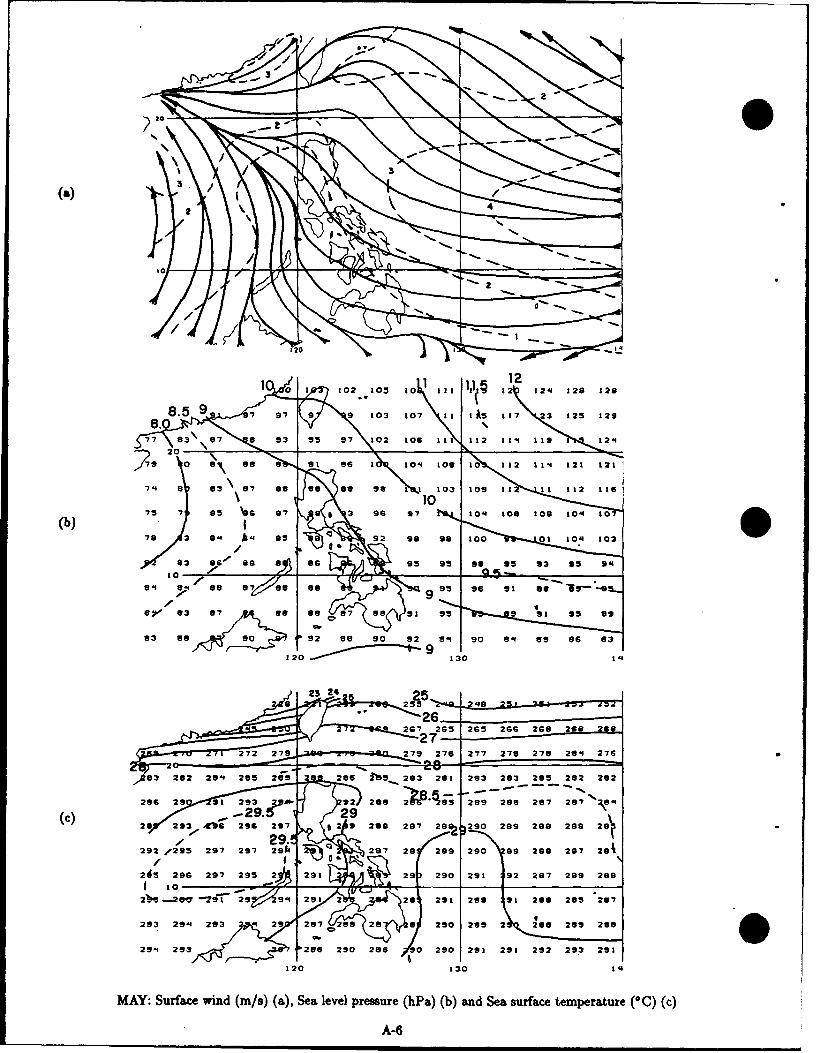
21
8 • 84 8 7 88 88132014
2 267 26 1 S 21 12 12G 129
279 7 9 7 9 9 1 0 27 6 277 127 278 128 1276
8322 8 29 289 2 86- 283 28 2328 8522 I8
92 2 2 7 28 72 3
(c) 2 293\ *b 997 0 9 95 2097 10 106\1 29 1 129 2004 200 12.
207 2 209' 2907 09/ 2008 207 201
28526 2 9 295 2 2912 9021 9 207 20 2902792 029 a29 s 29 894 291 2 28 291 289 288 28- 128
27- 94 29 9 2 8 2 92 288s 289 288
294 29'3 2 6 2 0 2 I 29 1 2 29 291
120 130 14
MAY: Surface wind (m/s) (a), Sea level pressure (hPa) (b) and Sea surface temperature (00) (c)
A-6

4 (a)
A6 3 7 3 76 7 a99 a 3 99 1 105 123 09
. . a
86-,, 872 7 /9 889 99 92 t90 29 899 S
8)" 89 88'93 5 93 73 9 933 96 13 931 941"4 2 2
f"-'49 23 t 27 27 1 127
28 28 23 83 87 2 987 28 285 287 28 90 28 8
6 29 23 293 286 029 293 2 92 \ 2 92 -2 05- 1 o (b)as 2 8 a so 9 2 C, 297 294 292 022
29 2 2 292 29 10 197 94 292 293 29896~~9 9 9
0 291 2 93 292 2 290 24 94 2 9429 291 9
7 a s 3 5 91 294 293 2S91 288 29-
27 22
0A 289 23 22- 286 20 ;89 -292 27 28 2
S2-1-ý ý912 193 191 2 867 288ý 287 291 28 290 289 290 2689 2899
200 9
JUNE: Surface wind (m/s) (a), Sea level pressure (hPa) (b) and Sea surface temperature (00) (c)
A-7
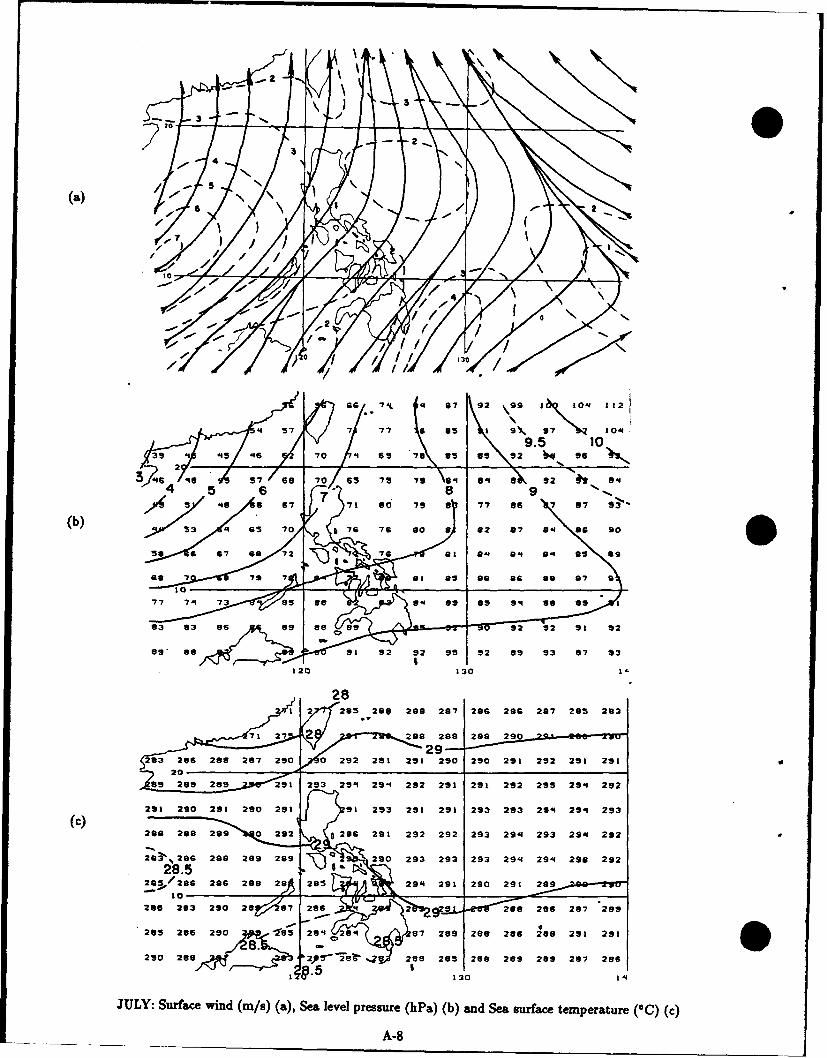
96 8
6
8
2 2 29 29 291 29 2 92 2 2 9
290 29 23 0 29 0
29
\2 • 92 •0
2 8• 20 7 126
289 266 29028S 264 264 678 28 9 2ee 28 6 2 66 2 91 2 91
•• [5- 23 2 2 22 21 21 29 20 27 ,
2p 928 2.38 2 06 2 85 2 60 2 89 2 09 2 67 2 66
5 -10
J U L Y : S r a c w in d (m n/ ) (a ), S e a le v e l p r e s re (h P a) (b ) ad S e asu rf a c ete m p e ra tu r e( C ) ( c)
7a _ _
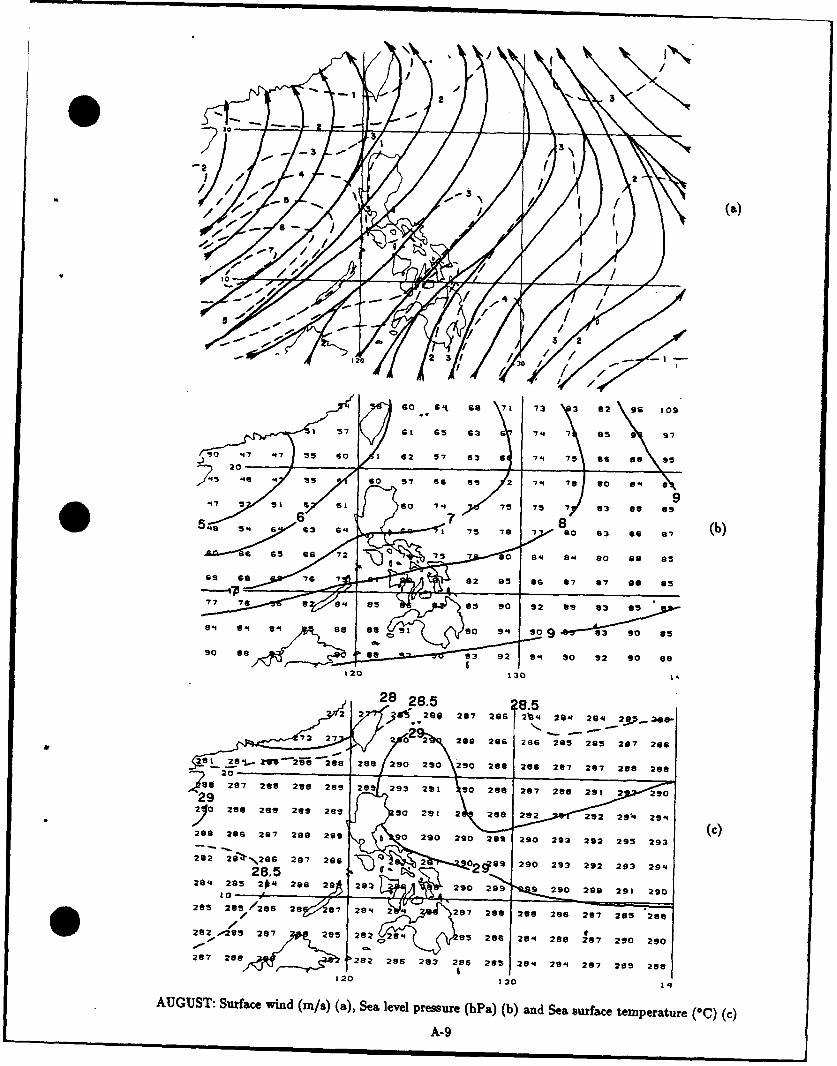
'475 SI3 N 16 ' 5 5 7 6 8
/ 101 . 0
'2 75 79 7 13 93 92 9 7 109
775 7 80 93 7q 0 8s 97
.0 47 "7 15 so 1 62 57 63 65 7- 75 528 s0 88
12001'r
20
7 1 2 6 2 5 2 5 2 8 57 2 o 2 26 8 2 724 27 2so '4 2'0I
8 2 6782 8 2 27 2 85-" 4 6 %3 6-.,.4.. 1 58 1 G 3 as 6
a 6 % 7 7 7 0 8 M 8 9 0 9 8
269 26 28 2G 2 8326 25 as' 97' 267 28 526
so0 as a a 3 92 9',4 so0 92 so0 s
II3120 1310 -
~~2 28.! 28, ,= .5 8 1 02 85,. - 2•" ' 22,01 290 297 286 2a6 q 8 20 " 29M 2ff -20
A-2
87127 28 299 275 2 0 2 22 2 286 298 295 919
Be58 29 • 2,q •9 2• 'So281 6, 28-L ze 2,=S-28 28 0 290 210 290 28e 290 297 287 268 290 C
280
9428 7 28 8 2 99 299 299 293 • 2 90 s 286 12 29 8 2912 290
294 ,,28 6 207 288 09 2 902291 299 2890 298 292 290 293
282 2941,9 . 287 2 89i 21t C8 1 9 290 283 292 293 29M
28 8 # 9 9 2129 9 s290 29O 2 1 ".90
AUGUST: Surface wind (m/s) (a), Sea level pressure (hPa) (b) and Sea surface temperature (*C) (c)
A-9i I I I I I
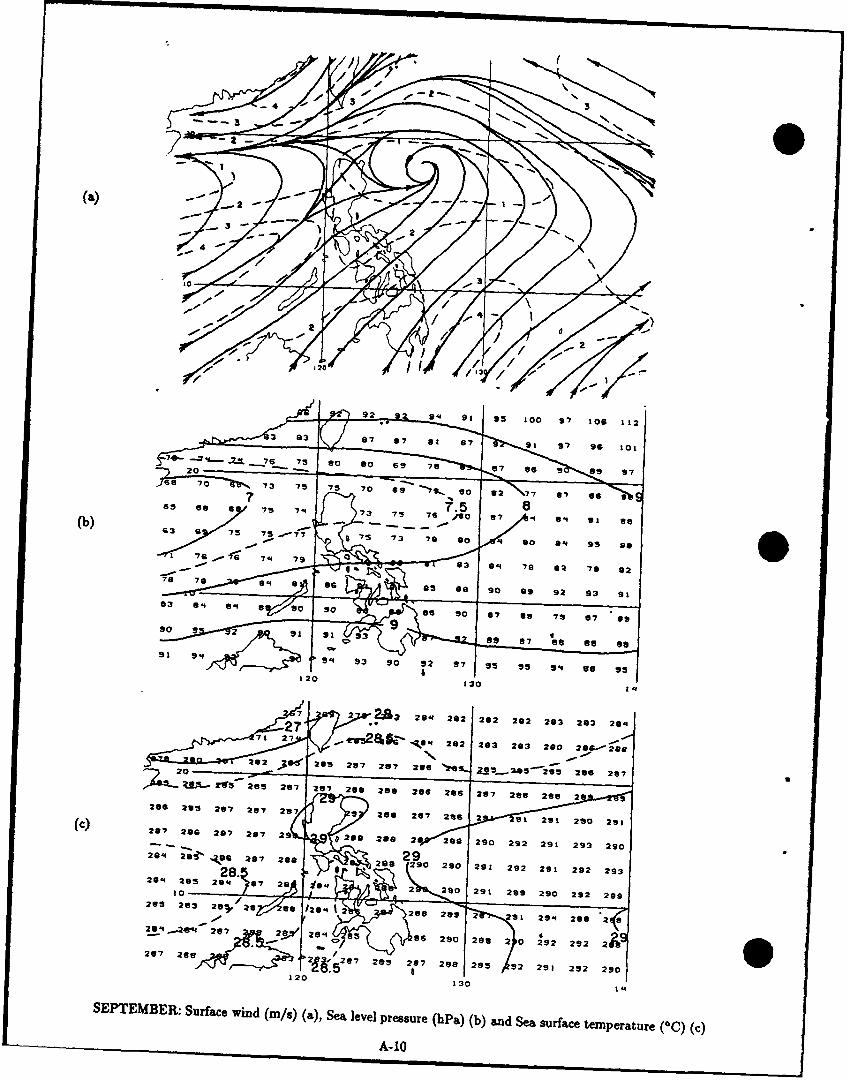
9 3 1
3 i1
3 8 87 97 83 87/ 91• 97 96t 101
7,7 7-3 70 ,, - 7g• 80 82 77 87 "86 863 6 6 7 7 3 3 76 j 0 87 94 8 3 91 8
41
9 f 2 7 2 7 28 2 8 8 9 16 2 8 6 2 8 7 2 8 8 2 8 21 1 228 28 8737 8 9 7 28 27 2at 27 2 91 291 290 2 a3
(c 0 7 2 0 0 2 7 2 0 9 2 0 2 0 2 8 0 2 9 9 2 3 2 3 9
2007 20o
2 s o 2 8 0 2 8 4 0 7 5 2 9 0 2 2 s o 9 2 9 2 0 9 9
8 26 3 2 8 . 28 88 2 8 4 2 2:8 2 8 8 2 291 2 94 288. 2a827o a 26 7.4 3 -6 2 60 288 2 -0 292 282
267 726 2• '5,,2- 3 2 28.76 23 8 2 .2, 2 82 20
120 330
15SEPTEMBER: Surface wind (m/s) (a), Sea level pressure (hPa.) (b) and Sea surface temperature ('C) (c)
A-10
I• I I I
1 2 0 1 3 ii i
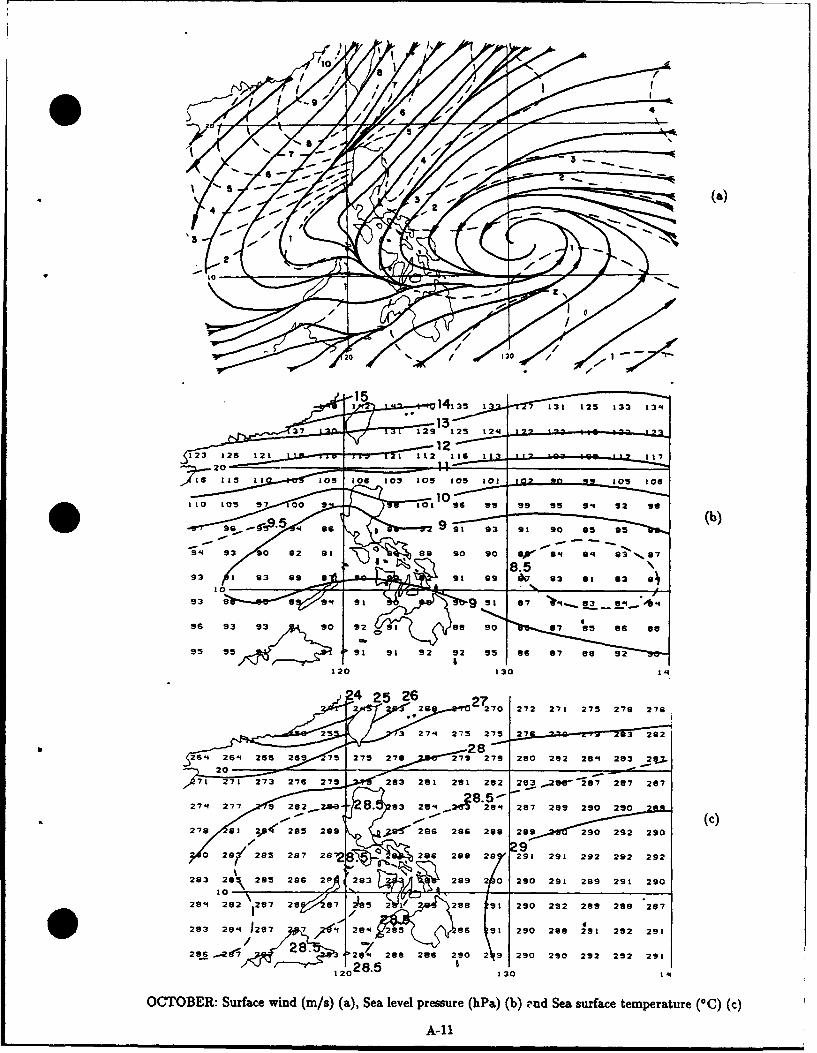
0 0
t -2 -2 -~ - -- -. --* t)
0 6 ...................
e • Cb)4 93 90 82 81
98 93 88 90 86 7 8, 8 88
120 130 14
Ito05 97 0, 91 1 9 2 19 =99 1 8 87 88 9:2
280 282s 28- 2o8 2I3 (b
727 26 279 203 281 281 282 20 5 2
274 277 so 282 2..0 8.8 28o so 28o 287 291 290 20 7
28 6 288 2 2o99 29 292 292 292
284 82 27 2 87 185 2 1 288 09 290 27t 289 288 287
0283 284 1258 2 75 285 289 86 79 290 288 28m 29?29
2 271 273 276 2 84 283 286 289 2 92 290 290 292 292 298028.8.5 • ,
OCTOBER: Surfac~e wind (m/s) (a), Sea level pressure (hPa) (b) •nxd Sea surfac~e temperature (00) (c)
A--I
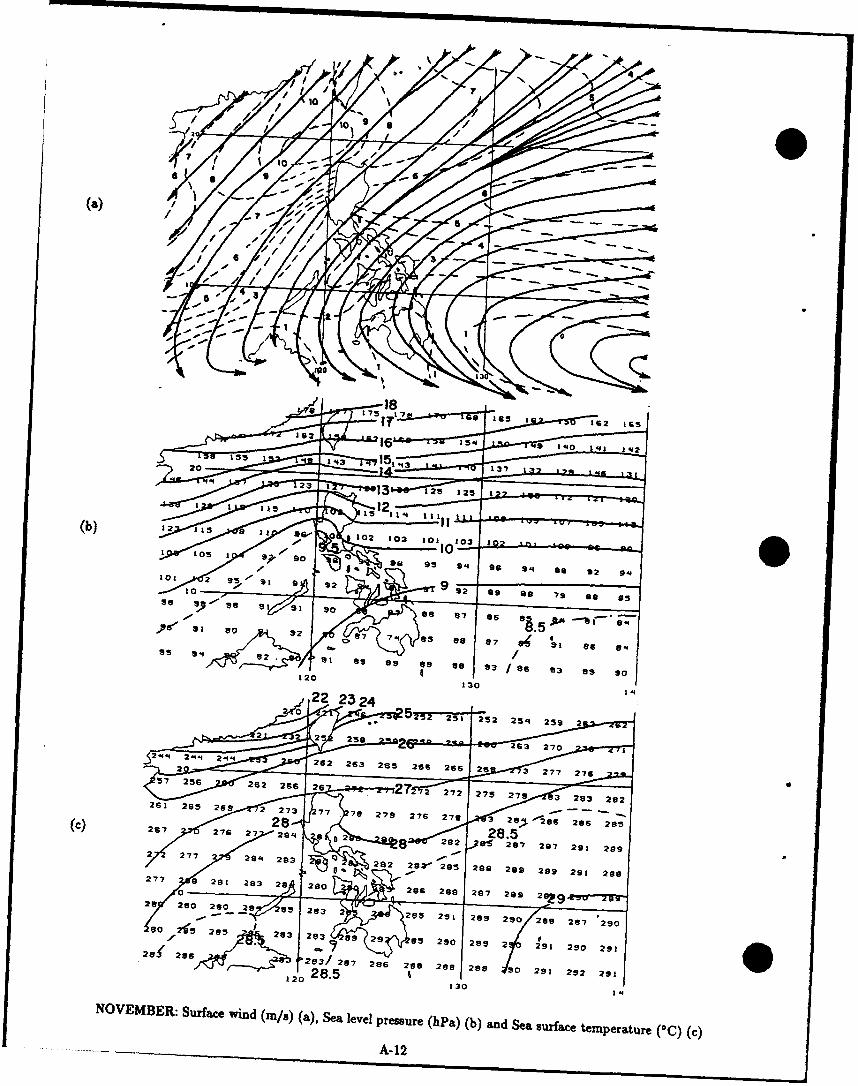
106
(b) ~ ~ ~ ~ ~ t 92 1a ~ '12 0 0 0
(a,)
58 3),, 81 31 30. 88'@y• ,..,•.' .87 8l /8"5 --- --
t7 85 8g 7 931 162 8 5
20 153 /8 831 83,4 137
120 130 1
6: 263 77 78 2 27 2102 1 2
80 202 21
2 28aso 28 94
21 27 2 09 2 2 9 - -22 2 a2a. 26 88 t7s 2 06 12- ' ;Z
120
2c 4: 2324
28 5 25 5 251 28 20 289 2
2 263 2707 29 1
283 2 65 2656 3 8757283 228682 225 2 85 2 8 29 290 29 2
283 286 21>A 28 9 9
8 28 9`• 5 29 7 287 291 '299
-23/ 207 286 288 282 288 20 291 297 290
130120 28.5 1 130 1,4NOVEMBER: Surface wind (m/s) (a), Sea level pressure (hPa) (b) and Sea surface temperature (0C) (c)
A-12
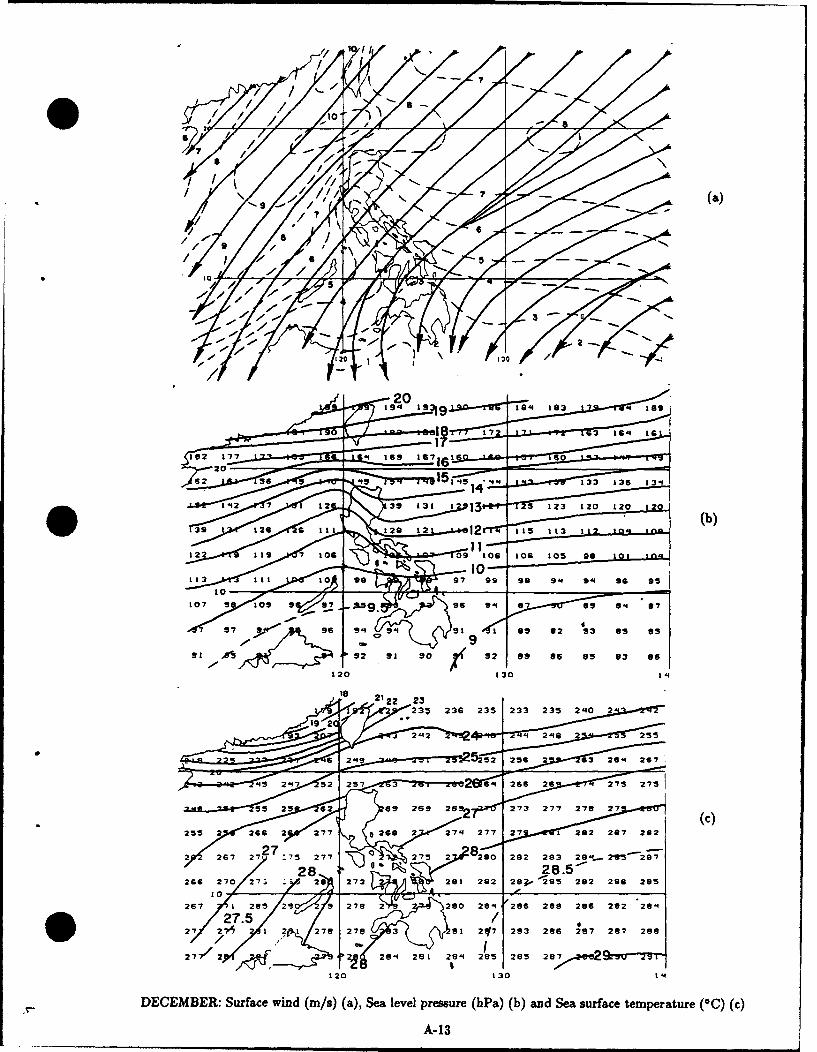
6 6
79
7
6
9
/6 X
"
3
20194 is 19q 193 Z-9--ý , 9 1
0 18 17 3 1614 117
SI-0-2 177 1 1119 167
-05 15 133 139 j3q14: " 11'42 1 1 39 131 1 134-4ý 5 123 120 120 12a
(b)32 12S 6 11 129 12 12r?"4- 115 113 1
1112 119 7 log 09 106 to& 105 go
I ". .10
113 10 Ill 1 99 97 99 so 914 914 96 95
V107 9 10 as 9-0 elm 07
97 9-4 1ý 94 91 09 92 93 as 0.3
91 loo, At r 92 91 90 ý( 92 09 as 95 93 as
120 130 1-4
2122 232 23ý 236 235 2:3 3 2315 2 :MO ýý2
19 22142 4P-t8- 1414 2140 ý211
6 2"S 5g;2 256 2 63 26-1 2S7
AJS 2"7 52 257 2as< 266 26 275 275
55 as 269 26 7-e 273 277 270 27
2" 2-1 1:2 :13: 2 771 2 "a ý 21
2, 2 2.. 2 02 2 a 221.22357 2 266 2 277 0 269 2 27m 277 27 1 262 207 202
-;7 2."267 27 :75 27 260 282 283 28't- 2-05-2;7
28 28.5266 270 271 273 211 292 29;ý,, '295 292 206. 285
0110 / -ýt .267 1 495 9 278 2 0,
290 2e" 2196 2eS 296 2192 29"
27. 3 9A/s,5 0, / 2 S 4
27 2 / 17A L 278 3 el 2 ff7 283 286 287 287 2eO
277/ 2.04ý 22 ?2 181 - 281 284 2eS 285 2e;,,2.&e29rvu--7n1120 130 1-1
.r- DECEMBER: Surface wind (m/s) (a), Sea level pressure (hPa) (b) and Sea surface temperature (OC) (c)
A-13
Appendix B
Characteristics of Tropical CyclonesAffecting the Philippine Islands(Shoemaker 1991)
Using a powerful desktop computer and computerized data bases available at the Naval Oceanography Com-mand Center/Joint Typhoon Warning Center (NAVOCEANCOMCEN/JTWC), Shoemaker (1991) presentsa climatology of tropical cyclones (TCs) approaching or crossing the Philippine Islands.
The data base for examining TC intensity, direction and speed includes all six-hourly best track positionsO from 45 years (1945-1989). However due to the lack of satellite coverage the earlier portion of the record
identified fewer weak TCs and lowered the number of TCs which hit the PI by more than one per year (20%).Therefore the climatology section is based on 20 years (1970-1989) to preclude lowering the numbers ofweaker systems.
The September-November period has the maximum potential for TCs to hit the Philippine Islands. Theaverage time over land is 11 hours north of 14.5*contrasted to 20 hours south of 14.50.
The average latitude of landfall has an annual cycle, similar to the monsoon trough, with a latitudemaximum during August (-15.5°N) and a latitude minimum during February (-9.0°N).
TCs of intensity >65 knots just prior to landfall reach peak intensity 6 to 12 hours prior to landfallwhereas storms 65 knots or less prior to landfall peak only 0 to 6 hours before landfall. TCs of typhoonintensity generally weaken as they cross the PI, but TCs with intensity less than -50 knots at landfall do notweaken significantly. The amount of weakening is proportional to intensity, and weakening is less for TCssouth of 14.5.
The average speed in the 12 hours prior to landfall for TCs hitting the PI south of 14.5*N is 13.3 knotswith a standard deviation of 4.2 knots. North of 14.5*N, the average speed is 11.8 knots with a standarddeviation of 3.2 knots. Accordingly, the average time over land is 20 hours south of 14.5*N, but only 11 hoursnorth of 14.5*N (due to the narrow E-W dimension of Luzon).
TCs moving faster than 15 knots tend to slow down after making landfall; however, TCs moving 15 knotsor less experience little velocity change.
The mean direction of motion just before first landfall is west-northwestward; only two storms in 45 yearshave first hit the PI with an eastward velocity component, (i.e., coming from the South China Sea), andboth were weak systems.
TCs moving south of west tend to turn more westward after landfall; however, TCs moving west-northwestward show little change in direction. TCs moving more north than west (320°-360°) tend torecurve before hitting the Philippine Islands (Shoemaker 1991).
B-1
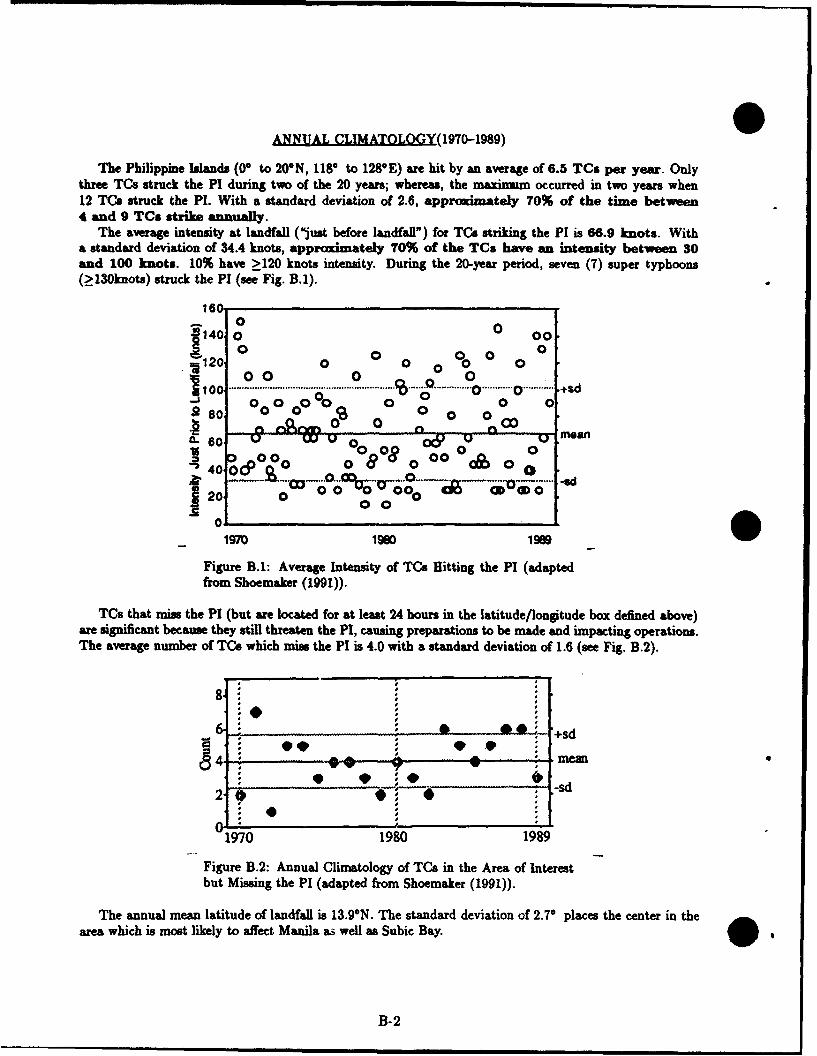
ANNUAL CLIMATOLOGY(1970-1989)
The Philippine Islands (0- to 20"N, 118° to 1280E) are hit by an average of 6.5 TCs per year. Onlythree TCs struck the PI during two of the 20 years; whereas, the maxinmm occurred in two years when12 TCO struck the P1. With a standard deviation of 2.6, approximately 70% of the time between4 and 9 TCs strike annually.
The average intensity at landfall ("just before landfall") for TCs striking the PI is 66.9 knots. Witha standard deviation of 34.4 knots, approximately 70% of the TCs have an intensity between 30and 100 knots. 10% have >120 knots intensity. During the 20-year period, seven (7) super typhoons(_>130knots) struck the PI (see Fig. B.1).
160
~140. 0 0 00.
-10 0 0 0 0120. 0 0 0 0 0
1100.00 0 0S...... 0 . 0• ...' *....*0*..... .. -- , /'"0 00000 0 0. 0.-s
S600 0 OC 0 mean
2400&0 0 8 0 A 00....... d.. ... .
0 0
1970 19M 19M
Figure B.A: Average Intensity of TCs Hitting the PI (adaptedfrom Shoemaker (1991)).
TCs that miss the PI (but are located for at least 24 hours in the latitude/longitude box defined above)are significant because they still threaten the PI, causing preparations to be made and impacting operations.The average number of TCs which miss the PI is 4.0 with a standard deviation of 1.6 (see Fig. B.2).
6. ;... , _ _+sdI4. me.,
~ * '.- sd
1970 1980 1989
Figure B.2: Annual Climatology of TCs in the Area of Interestbut Missing the PI (adapted from Shoemaker (1991)).
The annual mean latitude of landfall is 13.9*N. The standard deviation of 2.70 places the center in thearea which is most likely to affect Manila as well as Subic Bay.
B-2
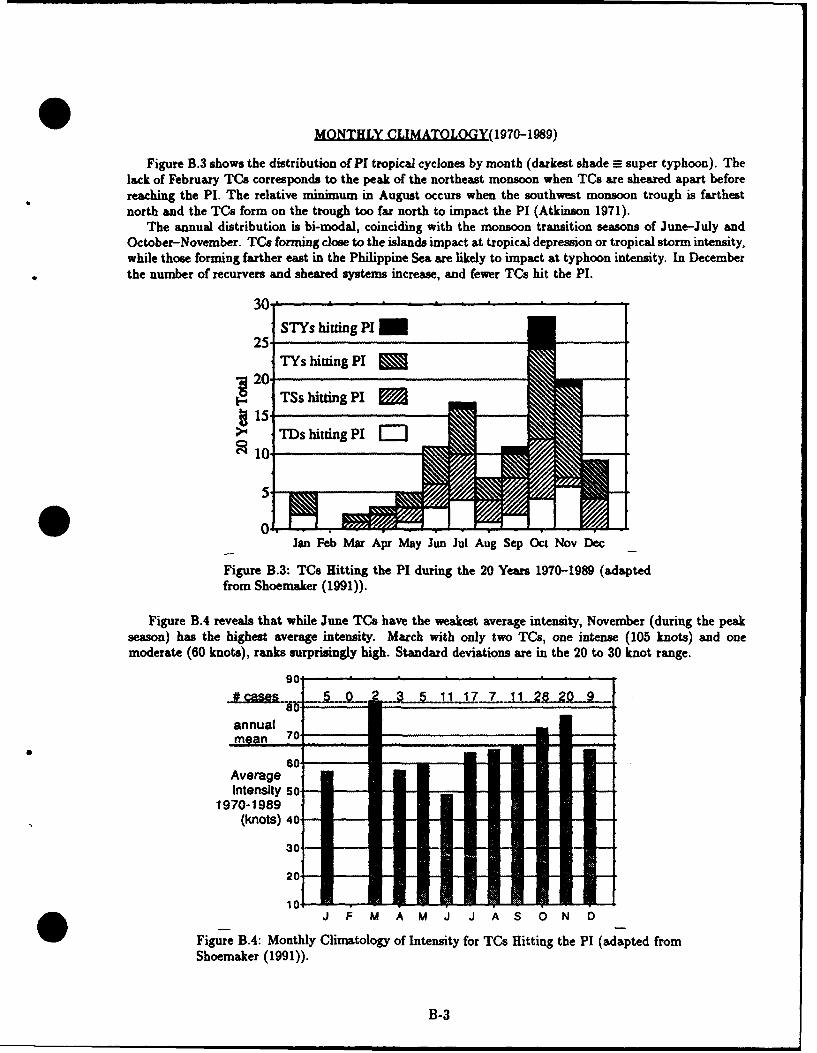
SMONTHLY CLIMATOLOGY(1970-1989)
Figure B.3 shows the distribution of PI tropical cyclones by month (darkest shade = super typhoon). Thelack of February TCs corresponds to the peak of the northeast monsoon when TCs are sheared apart beforereaching the PI. The relative minimum in August occurs when the southwest monsoon trough is farthestnorth and the TCs form on the trough too far north to impact the PI (Atkinson 1971).
The annual distribution is hi-modal, coinciding with the monsoon transition seasons of June-July andOctober-November. TCs forming close to the islands impact at tropical depression or tropical storm intensity,while those forming farther east in the Philippine Sea are likely to impact at typhoon intensity. In Decemberthe number of recurvers and sheared systems increase, and fewer TCs hit the P1.
30-STYs hitting PII
25-
2 s htng PI
TSs hitting PI
15-> TDs hitting PI El
~10.
5
Jan Feb Mar Apr May Jun Jul Aug Sep Oct Nov Dec
Figure B.3: TCs Hitting the PI during the 20 Years 1970-1989 (adaptedfrom Shoemaker (1991)).
Figure B.4 reveals that while June TCs have the weakest average intensity, November (during the peakseason) has the highest average intensity. March with only two TCs, one intense (105 knots) and onemoderate (60 knots), ranks surprisingly high. Standard deviations are in the 20 to 30 knot range.
90.
annual
60.AverageIntensity so.
1970-1989(knots) 40,
30
20.
10.J F M A M J J A S O N D
Figure BA: Monthly Climatology of Intensity for TCs Hitting the PI (adapted fromShoemaker (1991)).
B-3
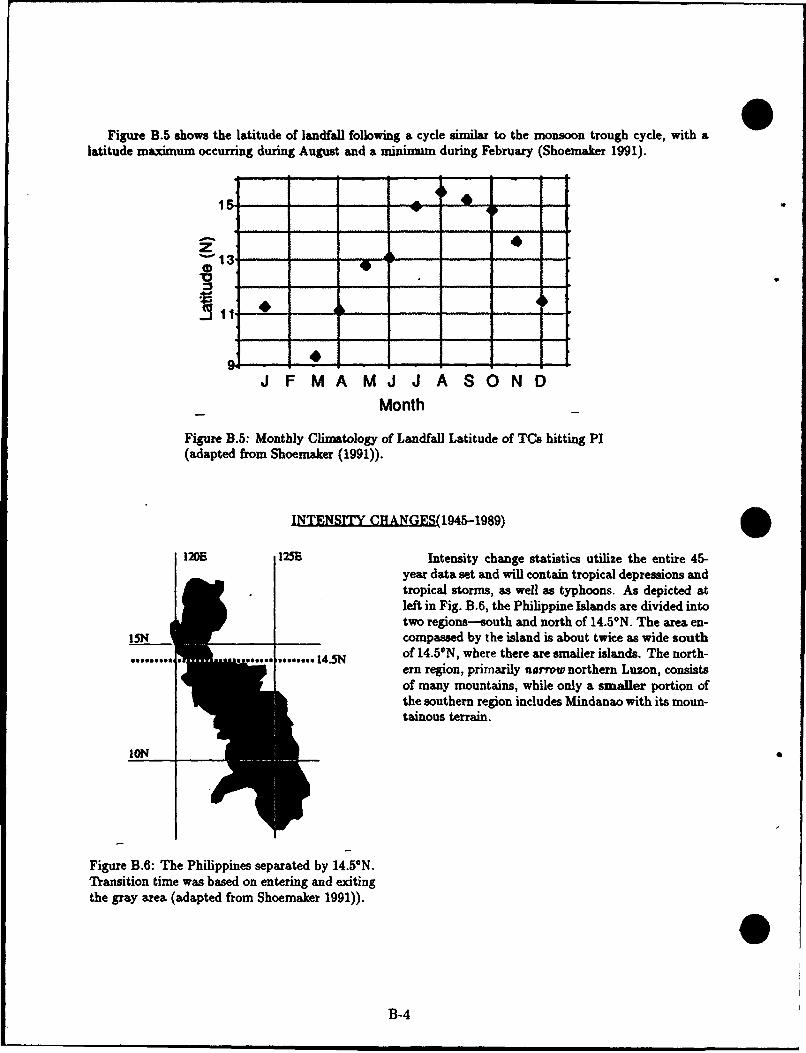
Figure B.5 shows the latitude of landfall following a cycle similar to the monsoon trough cycle, with alatitude maximum occurring during August and a minininum during February (Shoemaker 1991).
13
V 9P
-J 11 . ... .,-....-... ..
J F M A M J J A S O N DMonth
Figure B.5: Monthly Climatology of Landfall Latitude of TCs hitting PI(adapted from Shoemaker (1991)).
INTENSITY CHANGES(1945--1989)O
120E 125E Intensity change statistics utilize the entire 45-year data set and will contain tropical depressions andtropical storms, as well as typhoons. As depicted atleft in Fig. B.6, the Philippine Islands are divided intotwo regions-south and north of 14.50N. The area en-
15N compassed by the island is about twice as wide south
@assesses .s............e 14.5N of 14.50N, where there are smaller islands. The north-ern region, primarily narrow northern Luzon, consistsof many mountains, while only a smaller portion ofthe southern region includes Mindanao with its moun-tainous terrain.
ION
Figure B.6: The Philippines separated by 14.50 N.Transition time was based on entering and exitingthe gray area (adapted from Shoemaker 1991)). 0
B-4
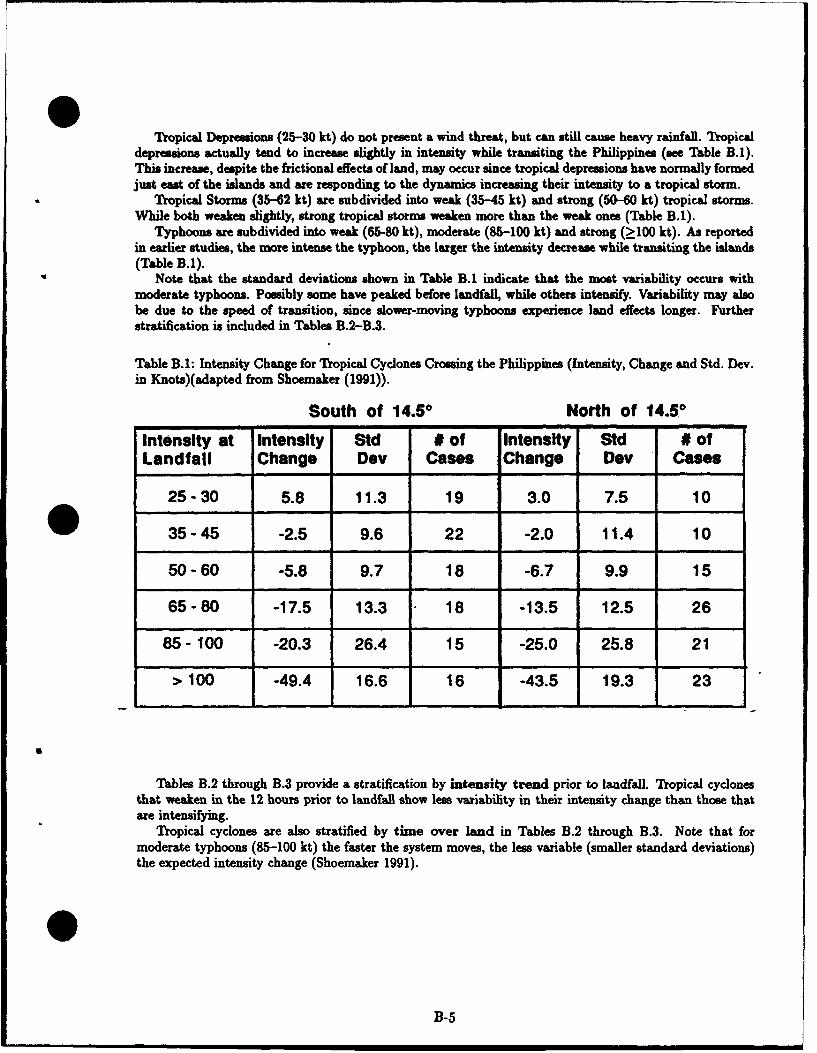
Tropical Depressions (25-30 kt) do not present a wind threat, but can still cause heavy rainfall. Tropicaldepressions actually tend to increase slightly in intensity while transiting the Philippines (see Table B.1).This increase, despite the frictional effects of land, may occur since tropical depressions have normally formedjust east of the islands and are responding to the dynamics increasing their intensity to a tropical storm.
Tropical Storms (35-62 kt) are subdivided into weak (35-45 kt) and strong (50-60 kt) tropical storms.While both weaken slightly, strong tropical storms weaken more than the weak ones (Table BA).
Typhoons are subdivided into weak (65-80 kt), moderate (85-100 kt) and strong (Ž100 kt). As reportedin earlier studies, the more intense the typhoon, the larger the intensity decrease while transiting the islands(Table B.1).
Note that the standard deviations shown in Table B.1 indicate that the most variability occurs withmoderate typhoons. Possibly some have peaked before landfall, while others intensify. Variability may alsobe due to the speed of transition, since slower-moving typhoons experience land effects longer. Furtherstratification is included in Tables B.2-B.3.
Table B.A: Intensity Change for Tropical Cyclones Crossing the Philippines (Intensity, Change and Std. Dev.in Knots)(adapted from Shoemaker (1991)).
South of 14.50 North of 14.50mI
Intensity at Intensity Std # of Intensity Sid # ofLandfall Change Dev Cases Change Dev Cases
25-30 5.8 11.3 19 3.0 7.5 10
35-45 -2.5 9.6 22 -2.0 11.4 10
50-60 -5.8 9.7 18 -6.7 9.9 15
65-80 -17.5 13.3 18 -13.5 12.5 26
85- 100 -20.3 26.4 15 -25.0 25.8 21
> 100 -49.4 16.6 16 -43.5 19.3 23
Tables B.2 through B.3 provide a stratification by intensity trend prior to landfall. Tropical cyclonesthat weaken in the 12 hours prior to landfall show less variability in their intensity change than those thatare intensifying.
Tropical cyclones are also stratified by time over land in Tables B.2 through B.3. Note that formoderate typhoons (85-100 kt) the faster the system moves, the less variable (smaller standard deviations)the expected intensity change (Shoemaker 1991).
B-5
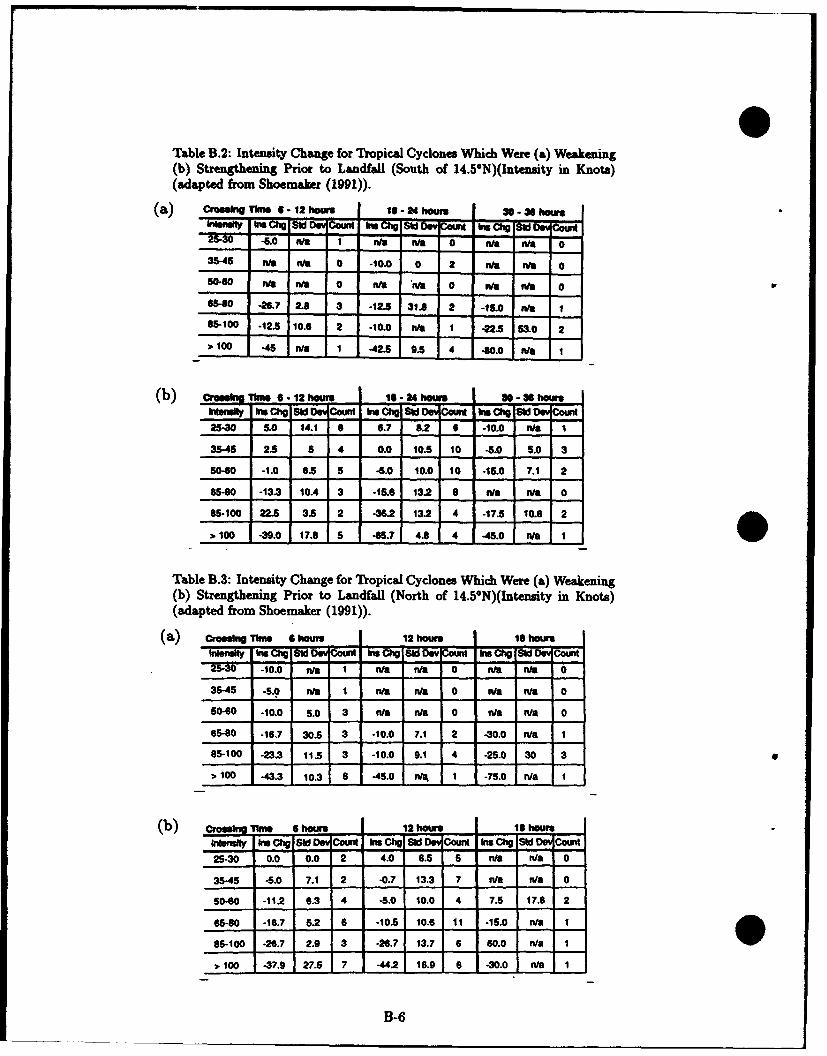
.0
Table B.2: Intensity Change for Tropical Cyclones Which Were (a) Weakening(b) Strengthening Prior to Landfall (South of 14.5*N)(Intensity in Knots)(adapted from Shoemaker (1991)).
(a) Cros" 11s 6- 12 hour ,-. t o 2s1- Is 3,,-fnot Inho~ SDConIsCho~ ISdDv C km~ beig sw d Count
25.30 -6.0 ea I na na 0 nia ria 0
35-45 NOa nf 0 .10.0 0 2 na ie 0
10-60 nfa NO 0 na "n/a 0 nia nft 0
wo-o0 -26.7 2.8 3 -12.5 31.8 2 -15.0 nfa 1
8W5100 -12.5 10.6 2 -10.0 n/a 1 -22.5 53.0 2
> 100 -45 n/a 1 -42.5 9.5 4 -80.0 IVa I
- m . hgy SWD Count •n s Ch, S Ch CouDoCosunts
25-30 5.0 14.1 s 6.7 8.2 6 -10.0 Va I
35-45 2.5 5 4 0.0 10.5 10 -5.0 5.0 3
50450 -1.0 6.5 5 -5.0 10.0 10 -15.0 7.1 2
65-80 -13.3 10.4 3 -15.6 13.2 8 we eWa 0
W5-100 22.5 3.5 2 -36.2 13.2 4 -17.5 10.6 2
)"100 -39.0 17.8 S -65.7 4.8 4 -45.0 n/a I
Table B.3: Intensity Change for Tropical Cyclones Which Were (a) Weakening(b) Strengthening Prior to Landfall (North of 14.5-N)(Intensity in Knots)(adapted from Shoemaker (1991)).
(a) crosng Tw w .hous 12 hours IsItnf Ity Cig Ssi 0 •SsCou W4Ch0id Dev C IsChg Sid0W Cou2S.30 -10.0 ro I nva n"a 0 nma n/a 0
35-45 -5.0 n/A 1 n/a n/a 0 n/a Wta 0
50-60 -10.0 s.0 3 n/a n/a 0 nim I Wa 0
65-80 -16,7 30.5 3 -10.0 7.1 2 -30.0 rVa 1
65-100 -23.3 11.5 3 -10.0 9.1 4 -25.0 30 3 a
> 100 -43.3 10.3 6 -45.0 n/m, 1 -75.0 n/a I
() Crossing • hours 12 ho 1 hourlitnsW by Chg Sc De s Count Im Cg S• d Count hi Chg IS Count1
25-30 0.0 0.0 2 4.0 6.5 5 n/a n/a 0
35-45 -5.0 7.1 2 -0.7 13.3 7 n/a n/a 0
50-60 -11.2 6.3 4 -5.0 10.0 4 7.5 17.6 2
65-80 -16.7 5.2 6 -10.5 10.6 11 -15.0 n/a I
85-100 -26.7 2.9 3 -26.7 13.7 6 60.0 n/a I
2 100 -37.9 27.5 7 -44.2 16.9 6 -30.0 n/a 1
B-6
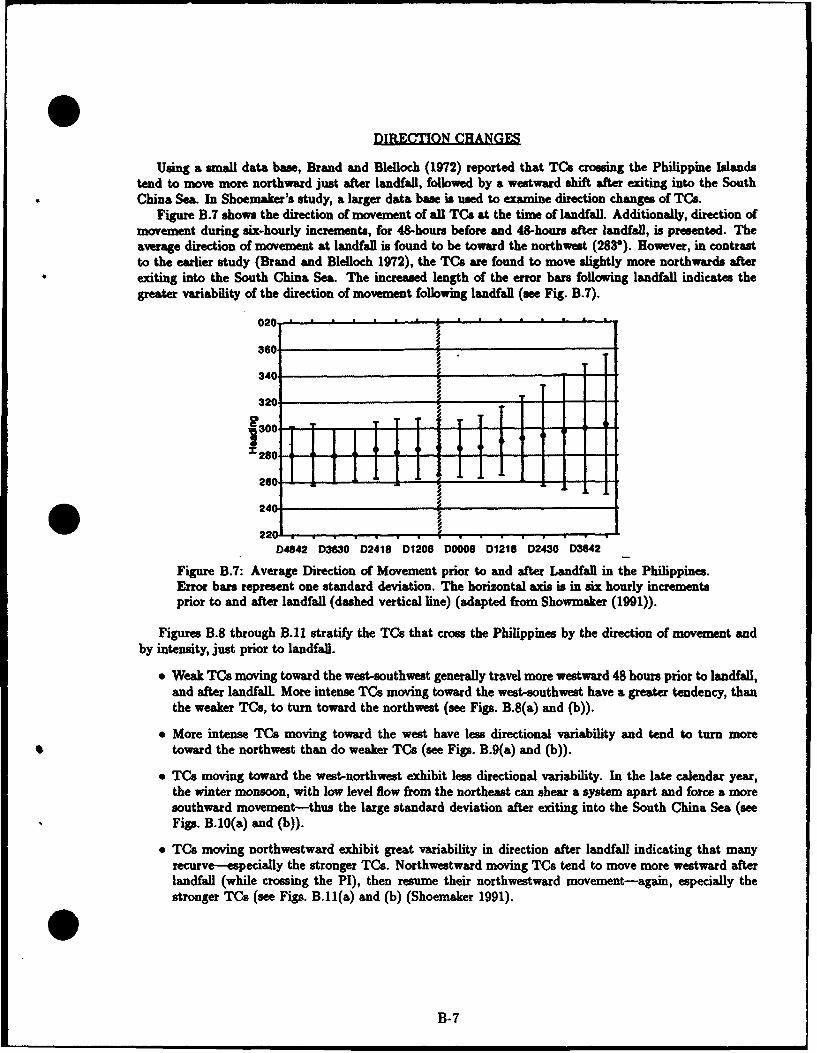
DIRECTION CHANGES
Using a small data base, Brand and Blelloch (1972) reported that TCs crossing the Philippine Islandstend to move more northward just after landfall, followed by a westward shift after exiting into the SouthChina Sea. In Shoemaker's study, a larger data base is used to examine direction changes of TCs.
Figure B.7 shows the direction of movement of all TCs at the time of landfall. Additionally, direction ofmovement during six-hourly increments, for 48-hours before and 48-hours after landfall, is presented. Theaverage direction of movement at landfall is found to be toward the northwest (283"). However, in contrastto the earlier study (Brand and Blelloch 1972), the TCs are found to move slightly more northwards afterexiting into the South China Sea. The increased length of the error bars following landfall indicates thegreater variability of the direction of movement following landfall (see Fig. B.7).
020.
360
340 -
320so " TT T TT
-r280,-
260. .....
240 .
220- .......
D4842 D3630 D2418 D1206 D0006 D1218 D2430 D3642
Figure B.7: Average Direction of Movement prior to and after Landfall in the Philippines.Error bars represent one standard deviation. The horizontal axis is in six hourly incrementsprior to and after landfall (dashed vertical line) (adapted from Showmaker (1991)).
Figures B.8 through B.11 stratify the TCs that cross the Philippines by the direction of movement andby intensity, just prior to landfall.
" Weak TCs moving toward the west-southwest generally travel more westward 48 hours prior to landfall,and after landfall. More intense TCs moving toward the west-southwest have a greater tendency, thanthe weaker TCs, to turn toward the northwest (see Figs. B.8(a) and (b)).
" More intense TCs moving toward the west have less directional variability and tend to turn more* toward the northwest than do weaker TCs (see Figs. B.9(a) and (b)).
" TCs moving toward the west-northwest exhibit less directional variability. In the late calendar year,the winter monsoon, with low level flow from the northeast can shear a system apart and force a moresouthward movement-thus the large standard deviation after exiting into the South China Sea (seeFigs. B.10(a) and (b)).
" TCs moving northwestward exhibit great variability in direction after landfall indicating that manyrecurve-especially the stronger TCs. Northwestward moving TCs tend to move more westward afterlandfall (while crossing the PI), then resume their northwestward movement-again, especially thestronger TCs (see Figs. B.11(a) and (b) (Shoemaker 1991).
B-7
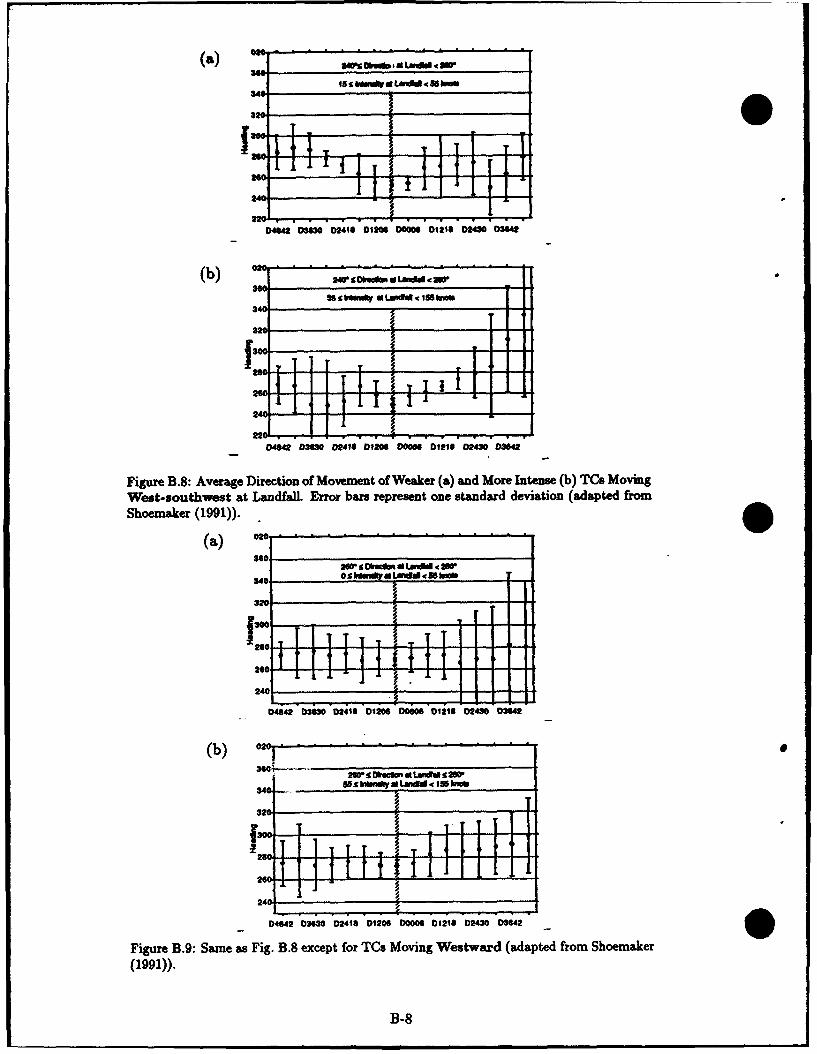
(a) *' W Lmmb i SWd, m
l$ s k.*l - La'd• € MlESb360
U620
04642 0UN30 02416 01206 O00M0 01211 0240 036
(b) . . . . . . ..
SOn
34t' 'IT
240 _
04842? 0363I 02416 0120 00006 012161 02430 036t42
West-southwest t Landfal Erro bas epresent oned 5taddvaio aatdfo
3001
8200..
260 i
(:, II ~II T ,
240O4
0464 0363*0 0241 o00 000'06 o2 023 036
Figure B.8: Average Directi" •Dlreon ofMvee t of dl Wtkr a anMoreItne()TsMvn
Fig-sureB.hwaes as nFig. B8Excetror Tars Mersetovng Wstwnard (adaptidnfromaShoemaker(1991)).199))
(Ba8
320
no i1 T T 7
240
Figure~ ~ 04 9.9: 024me DIFg.8ecp frTsMovn DODStwr (0dapte from Sheme
(]99]344
0--
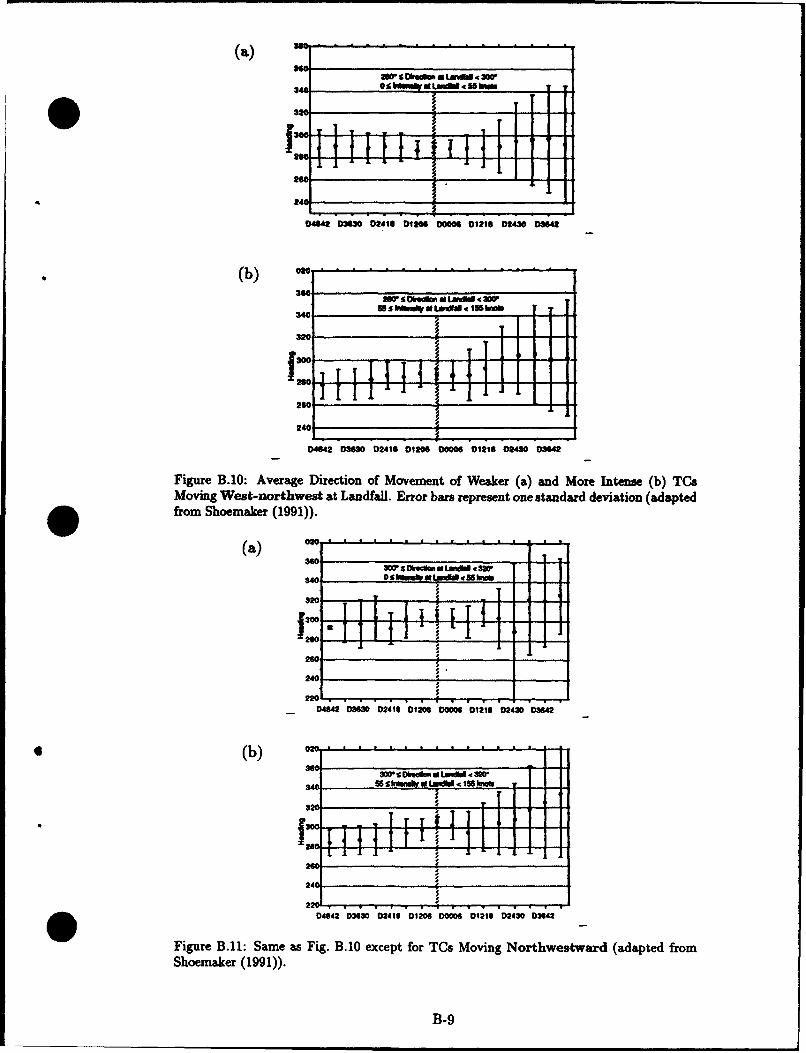
30 s a e 3
0O do"% lT - 55 415 ib
"13
24"
-: T i4[ROR
304e 2I M0e63n t of41 -2 0 360eV (a) 0 M6e2
34i 555 kWes -no h A Lad E b 1ar p se
320
044 0360 021 0120 I I
04642 ~ ~ 000 D30040 I O 1216 02430 03642
Figure B.10: Average Direction of Movement of Weaker (a) and More Intense (b) T~sMoving West-northwest at Landfall. Error bars represent one standard deviation (adaptedfrom Shoemaker (1991)).
(a ) 3" . . . . ..
34C . 0. Sb6UUIVA 1I55 ls
240-
842 '030 2416 01206 0o006 01211 02430 03642
* (b) o2C.................................
340. 55zSknaIbLandld155hwf i
300 _ . r rT ] ] | •
22C4 01
O~~ ~~~~ ~~ .~o .o~ o, ".o .o o,. " .;• . .04842 03630 02410 01206 000M 01218 02430 03642
Figure B.11: Same as Fig. B.10 except for TCs Moving Northwestward (adapted fromShoemaker (1991)).
B-9
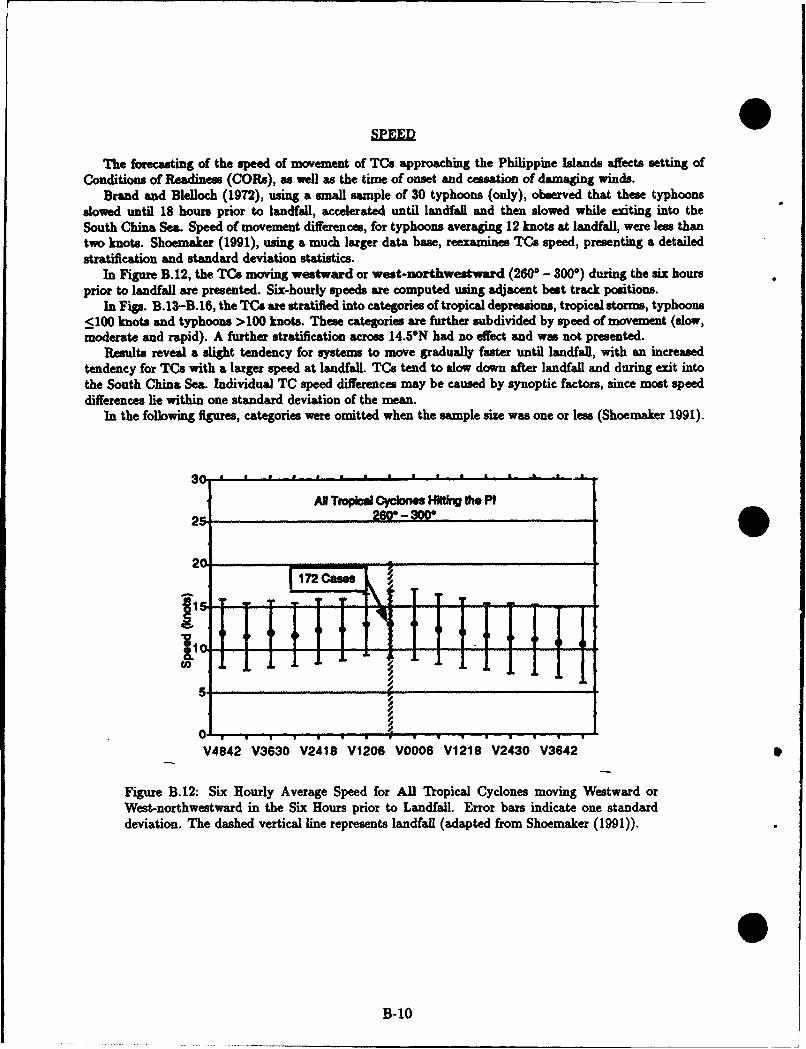
The forecasting of the speed of movement of TCs approaching the Philippine Islands affects setting ofConditions of Readiness (CORs), as well as the time of onset and cessation of damaging winds.
Brand and Blelloch (1972), using a small sample of 30 typhoons (only), observed that these typhoonsslowed until 18 hours prior to landfall, accelerated until landfall and then slowed while exiting into the
South China Sea. Speed of movement differences, for typhoons averaging 12 knots at landfall, were less thantwo knots. Shoemaker (1991), using a much larger data base, reexamines TCs speed, presenting a detailedstratification and standard deviation statistics.
In Figure B.12, the TCs moving westward or west-northwestward (260* - 300*) during the six hoursprior to landfall are presented. Six-hourly speeds are computed using adjacent best track positions.
In Figs. B.13-B.16, the TCs are stratified into categories of tropical depressions, tropical storms, typhoons<100 knots and typhoons >100 knots. These categories are further subdivided by speed of movement (slow,moderate and rapid). A further stratification across 14.5"N had no effect and was not presented.
Results reveal a slight tendency for systems to move gradually faster until landfall, with an increasedtendency for TCs with a larger speed at landfall. TCs tend to slow down after landfall and during exit intothe South China Sea. Individual TC speed differences may be caused by synoptic factors, since most speeddifferences lie within one standard deviation of the mean.
In the following figures, categories were omitted when the sample size was one or less (Shoemaker 1991).
.e . . . .. . '. .. . . ..
AN Tropial Cycbnes HMffing the P1
25 -
20
C1"O L
5 .I
V4842 V3630 V2418 V1206 V0006 V1218 V2430 V3642'
Figure B.12: Six Hourly Average Speed for All Tropical Cyclones moving Westward orWest-northwestward in the Six Hours prior to Landfall Error bars indicate one standarddeviation. The dashed vertical line represents landfall (adapted from Shoemaker (1991)).
0
B-1O
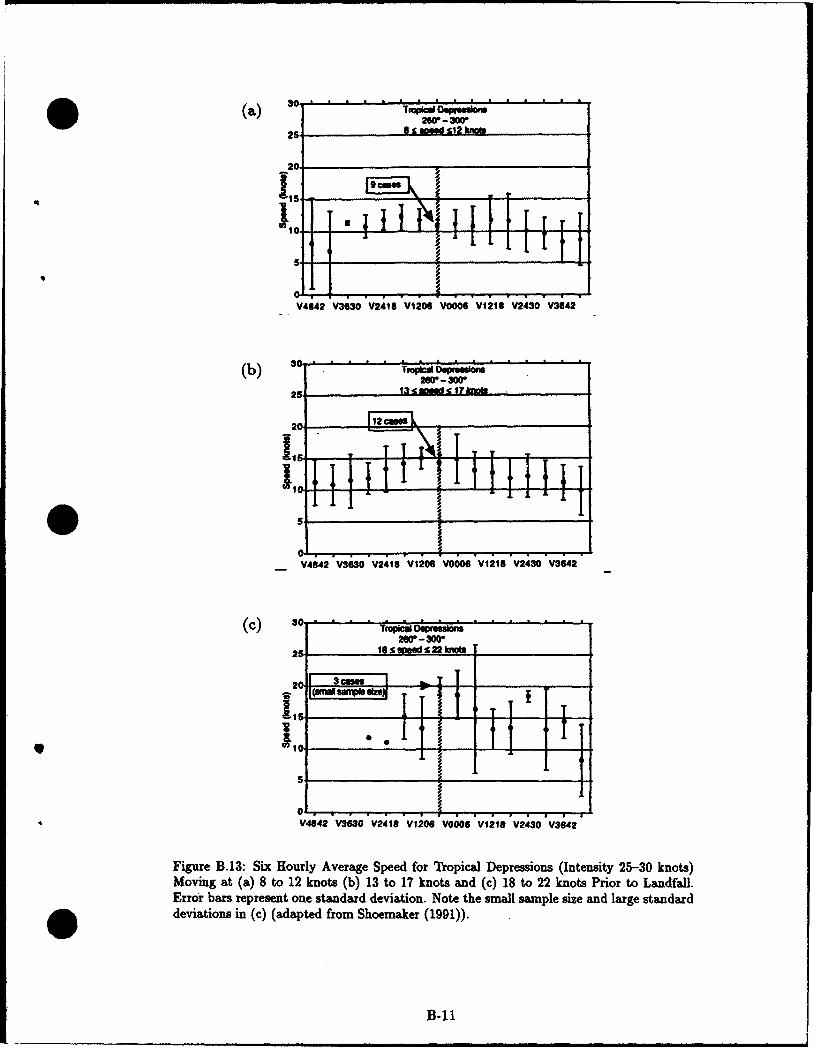
SC ) so . .. . ... .. . . ... .... . . . .(a) SOk Ofssa
25 6S! sedp 12 knfl
20
~~r T
~10vIA
S -V4842 V3630 V2416 'V1206 VOCO6 V12'i8 V24'30'V3i42'
30- 6T- . . . . .•
25 t13 k!nu d17k kft
01-1
V4842 V3i30 V24'1S V120O6 WOOS 6V12iS V2i30 *V36'42
(C) 30 . . . cPlcul . . . . a .an.2WO- 3001
_ _- ± ftlpWS 2kn
0 5ý4iQV366 V248 V2OG OýO,'Vj18'V;30'~iI
Figure ~ B.13:___ Si oryAvrg pedfrToica ersin Itniy20kosMovig a (a 8 o 1 knos () 1 to17 notsand(c)18 o 2 knos Piorto andall
Error bars represent one standard deviation oetesalsmlieadlresadr
Movingatiosi (a) 8adato d 12rkots Sh 1 oear (917kosad())1. o2 ntrirt dal
B-li
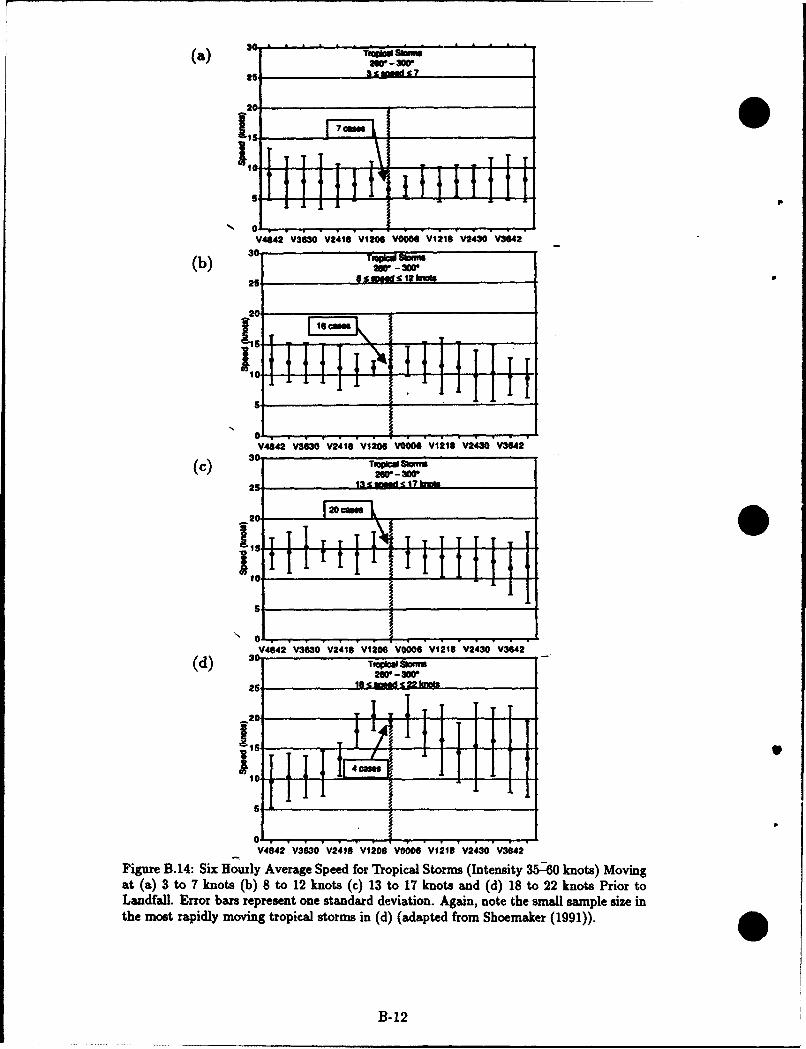
(a) ScT~'8
20oIt$
V4842 V3630 V2418 V12" ¶0006 VO 121 V2430 V3642
(b) 2WTil sm -3o
2••
'1;0
i '
V4842 V43630 V2416 V1206 Vo006 ViiS 4V2430 V3642
d) 30- TMoPkMlsloMl
25 -JLAD€ OILUZ In
IIII i8SIIIU'019
¶44842 ¶43630 ¶42418 V41206 ¶40006 ¶412'10 ¶2430 V342 _
(d) TeMpOW~m
- 0 , r T,
4ca
v4842 V330 'V2418 V1206 VO6" VIVO V2430 V'3642
Figure B.14: Six Hourly Average Speed for Tropical Storms (Intensity 35-60 knots) Movingat (a) 3 to 7 knots (b) 8 to 12 knots (c) 13 to 17 knots and (d) 18 to 22 knots Prior toLandfall. Error bars represent one standard deviation. Again, note the small sample size inthe most rapidly moving tropical storms in (d) (adapted from Shoemaker (1991)).
B-12
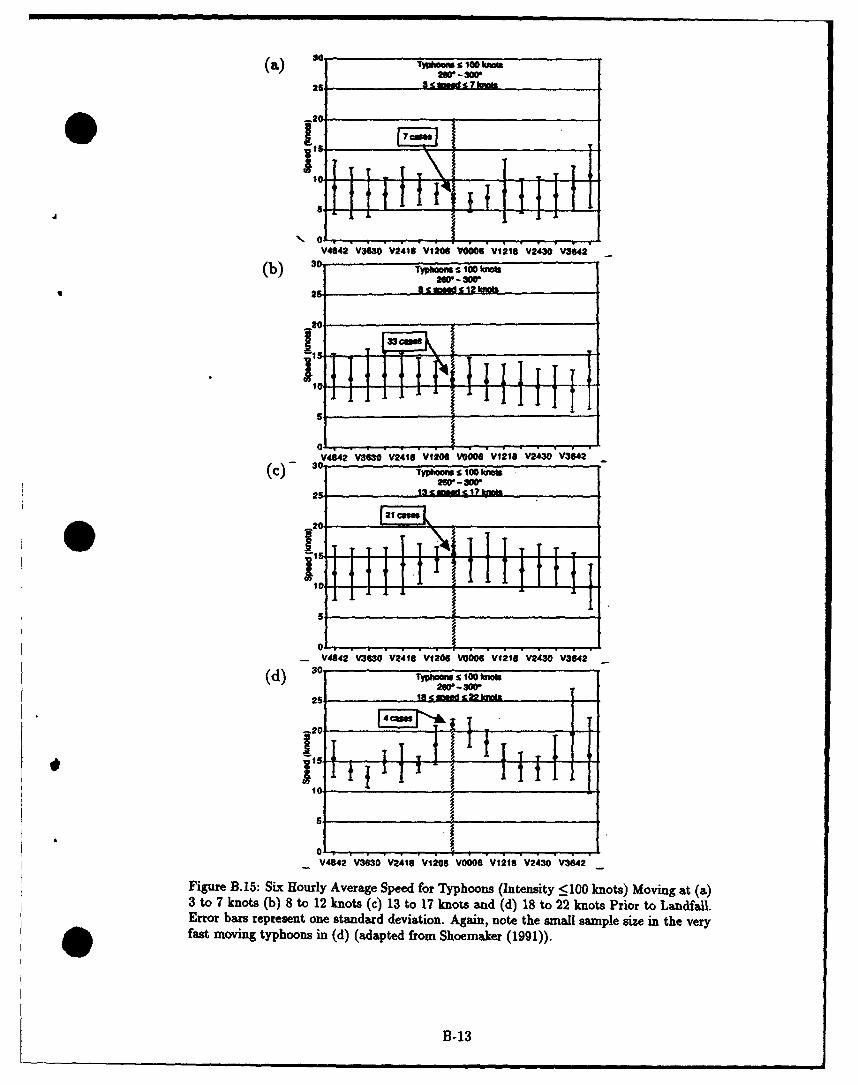
(a) T)atomO x 100 mm
t" ~ 2 -- J3
II
00
V4842 V3630 V2418 Vi2O6 VO000 V1218 V24O V3642-
(b) 30ý Tphioora s100 knols
2O'-300*2S A
II
20 1
II
1 -
01
-- W2 V364, 0'0V24,, V,12" VMS0 V'itS* V430 V3642
d 3o Tylphoost 100,OO
20-- EEL"
V825 WW 218 W20 VOd VM V243 V38'42'
lIl
0.5
5
V,4842 vi3.o'v •V248 106V00 vo2o•'wi,4'30v3642•;•
Figure B.15: Six Hourly Average Speed for Typhoons (Intensity _5100 knots) Moving at (a)3 to 7 knots (b) 8 to 12 knots (c) 13 to 17 knots and (d) 18 to 22 knots Prior to Landfall.Error bars represent one standard deviation. Again, note the small sample size in the very
O fast moving typhoons in (d) (adapted from Shoemaker (1991)).
B-13
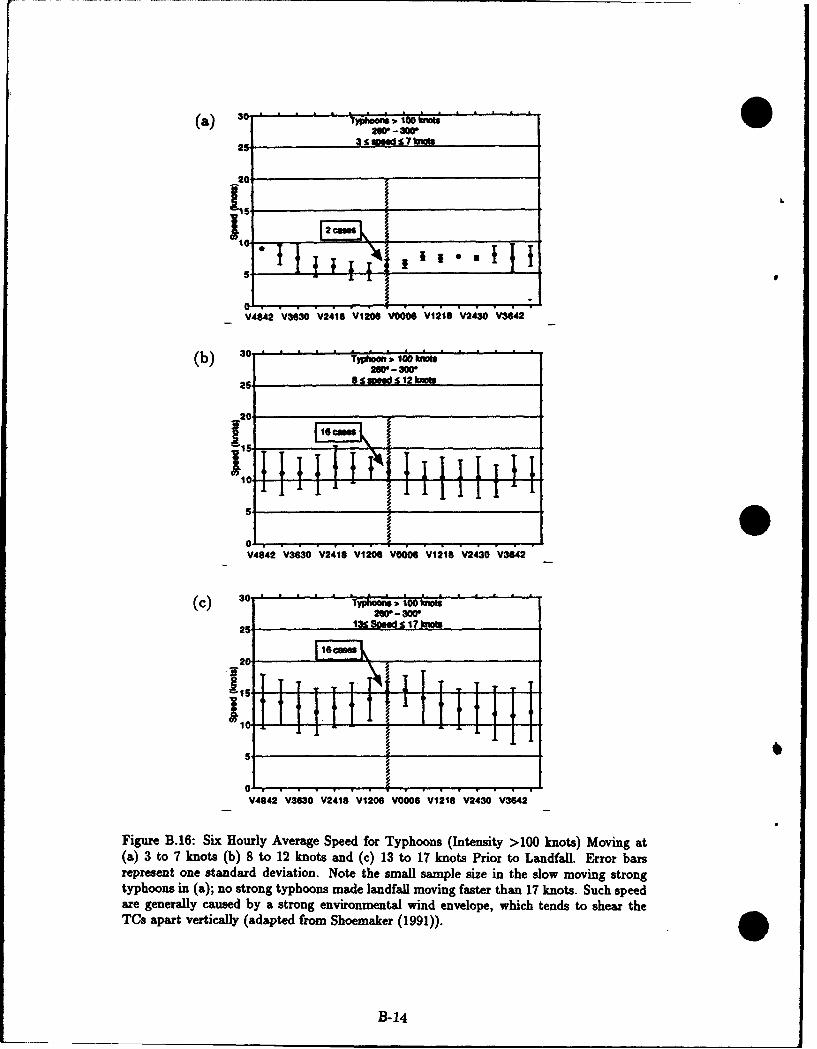
(a) 30 ,r • • " • -Moo i, too J= . . . ... .
NO'-300
21 3 smds7knots
212I t
5,
0 . . . . . . .
V4842 V3630 V241t V1206 VO006 V1218 V2430 V3642
(b) 1. 1 1.. . . . .Ti I&o . . . . . ..
S2W - 300025. S =, 8 S 12 knots..
I 1'.. I I I Il T
55
V4842 V3630 V2418 V1200 V0006 V1218 V2430 V3642
(c) B1 . .l.. Typhooa s 100t =ft
25 13sS o SO 17 knots
20-
5
0j
V4;42 V3630OV2418 V1206 V0006 V1218 V2430 V3"42
Figure B.16: Six Hourly Average Speed for Typhoons (Intensity >100 knots) Moving at(a) 3 to 7 knots (b) 8 to 12 knots and (c) 13 to 17 knots Prior to Landfall. Error barsrepresent one standard deviation. Note the small sample size in the slow moving strongtyphoons in (a); no strong typhoons made landfall moving faster than 17 knots. Such speedare generally caused by a strong environmental wind envelope, which tends to shear theTO. apart vertically (adapted from Shoemaker (1991)).
B-14
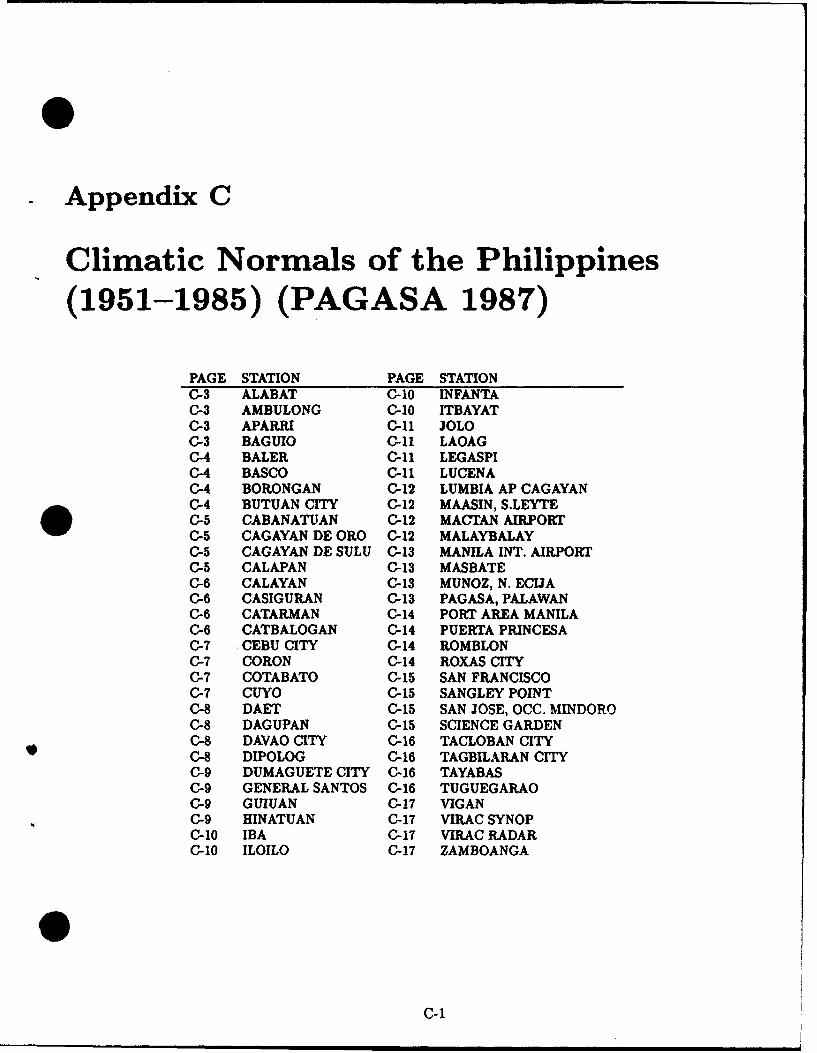
Appendix C
Climatic Normals of the Philippines(1951-1985) (PAGASA 1987)
PAGE STATION PAGE STATIONC-3 ALABAT C-10 INFANTAC-3 AMBULONG C-10 ITBAYATC-3 APARRI C-11 JOLO0-3 BAGUIO C-1i LAOAGC-4 BALER C-il LEGASPIC-4 BASCO C-11 LUCENAC-4 BORONGAN C-12 LUMBIA AP CAGAYANC-4 BUTUAN CITY C-12 MAASIN, S.LEYTEC-5 CABANATUAN C-12 MACTAN AIRPORTC-5 CAGAYAN DE ORO C-12 MALAYBALAYC-5 CAGAYAN DE SULU C-13 MANILA INT. AIRPORTC-5 CALAPAN C-13 MASBATEC-6 CALAYAN C-13 MUNOZ, N. ECIJAC-6 CASIGURAN C-13 PAGASA, PALAWANC-6 CATARMAN C-14 PORT AREA MANILAC-6 CATBALOGAN C-14 PUERTA PRINCESAC-7 CEBU CITY C-14 ROMBLONC-7 CORON C-14 ROXAS CITYC-7 COTABATO C-15 SAN FRANCISCOC-7 CUYO C-15 SANGLEY POINTC-8 DAET C-15 SAN JOSE, OCC. MINDOROC-8 DAGUPAN C-15 SCIENCE GARDENC-8 DAVAO CITY C-16 TACLOBAN CITYC-8 DIPOLOG C-16 TAGBILARAN CITYC-9 DUMAGUETE CITY C-16 TAYABASC-9 GENERAL SANTOS C-16 TUGUEGARAOC-9 GUIUAN C-17 VIGANC-9 HINATUAN C-17 VIRAC SYNOPC-10 IBA C-17 VIRAC RADARC-10 ILOILO C-17 ZAMBOANGA
0
C-1
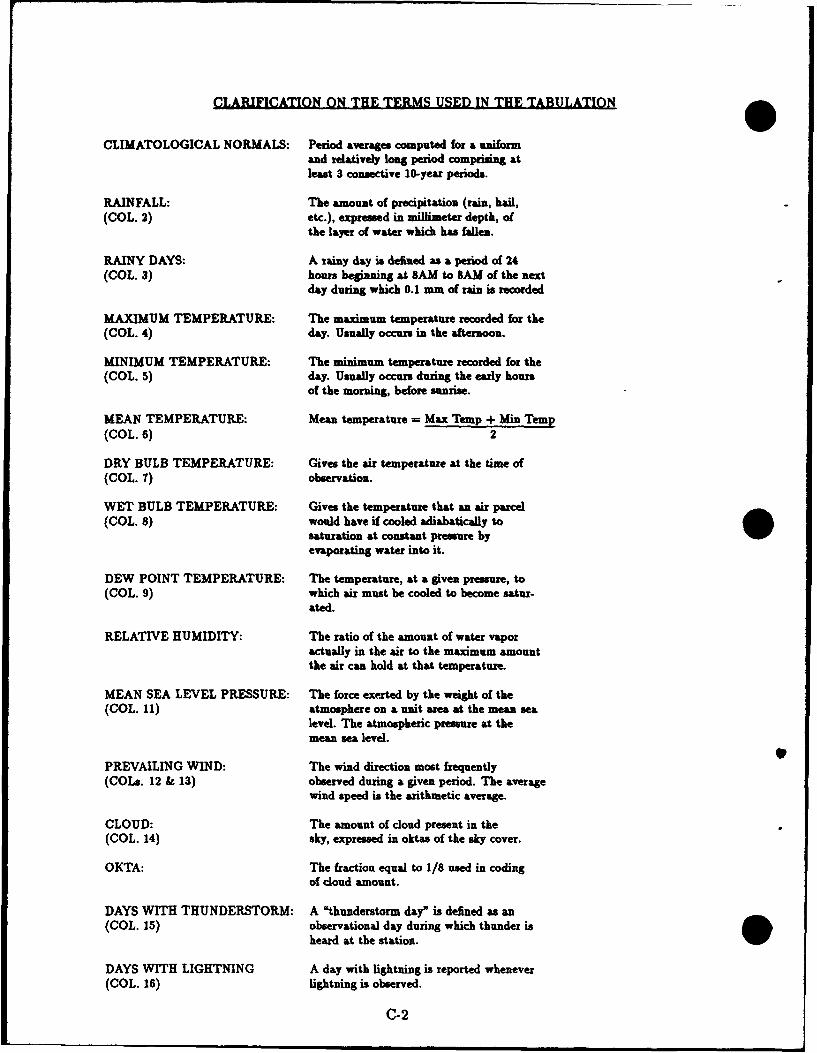
CLARIFICATION ON THE TERMS USED IN THE TABULATION
CLIMATOLOGICAL NORMALS: Period averages computed for a uniformand relatively long period comprising atleast 3 consective 10-year periods.
RAINFALL: The amount of precipitation (rain, hail,(COL. 2) etc.), expressed in millimeter depth, of
the layer of water which has fallen.
RAINY DAYS: A rainy day is defined as period of24(COL. 3) hours beginnng at SAM to SAM of the next
day during which 0.1 mm of rain is recorded
MAXIMUM TEMPERATURE: The maximum temperature recorded for the(COL. 4) day. Usually occurs in the afternoon.
MINIMUM TEMPERATURE: The minimum temperature recorded for the(COL. 5) day. Usually occurs during the early hours
of the morning, before sunrise.
MEAN TEMPERATURE: Mean temperature = Max Temp + Min Temp(COL. 6) 2
DRY BULB TEMPERATURE: Gives the air temperature at the time of(COL. 7) observation.
WET BULB TEMPERATURE: Gives the temperature that an air parcel(COL. 8) would have if cooled adiabatically to
saturation at constant pressure byevaporating water into it.
DEW POINT TEMPERATURE: The temperature, at a given pressure, to(COL. 9) which air must be cooled to become satur-
ated.
RELATIVE HUMIDITY: The ratio of the amount of water vaporactually in the air to the maximum amountthe air can hold at that temperature.
MEAN SEA LEVEL PRESSURE: The force exerted by the weight of the(COL. 11) atmosphere on a unit area at the mean sea
level. The atmospheric pressure at themean sea level.
9PREVAILING WIND: The wind direction most frequently(COLs. 12 & 13) observed during a given period. The average
wind speed is the arithmetic average.
CLOUD: The amount of cloud present in the(COL. 14) sky, expressed in oktas of the sky cover.
OKTA: The fraction equal to 1/8 used in codingof cloud amount.
DAYS WITH THUNDERSTORM: A 'thunderstorm day" is defined as an(COL. 15) observational day during which thunder is
heard at the station.
DAYS WITH LIGHTNING A day with lightning is reported whenever(COL. 16) lightning is observed.
C-2
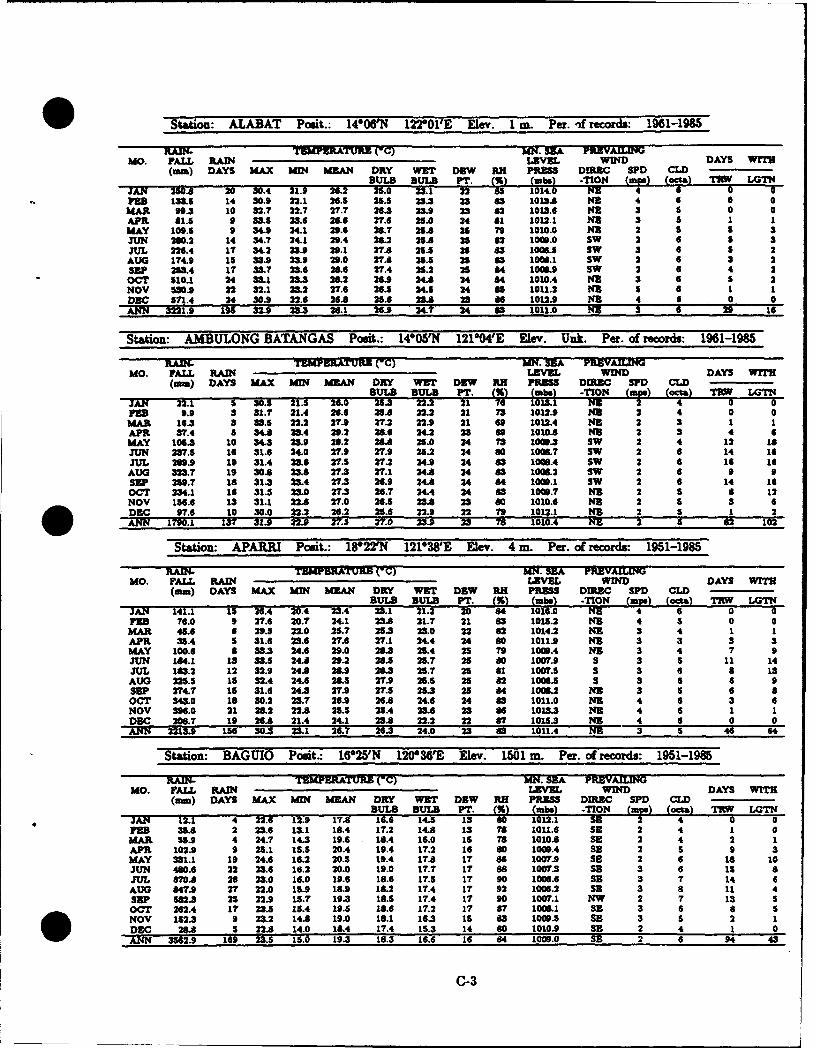
Station: ALABAT Posit.: 14"06'N 12201'E Elev. I m. Per. -f records: 1961-1985_
RAMC- T KEERATURJ ('C) MN. SEA PR9VA-IIJ;MO. PALL RAIN z.EL WIND DAYS WITH
(mm) DAYS MAX MIN MEAN DRY WET DEW RH PRESS DIRWC SPD CLD
2 UL2 2 UL0 PT -W(b) TO (Te) (oTa) Owl LOTNJAN 280.8 20 30.4 21.9 'U.2 25.0 23.1 2 8 114FEB 133.5 14 30.9 22.1 26.5 25.5 25.3 23 1013.8 NE 4 6 0 0MAR 99.3 10 32.? 22.? 27.7 26.3 23.9 23 82 1013.6 NE 3 5 0 0APR 81. 9 23.8 23.6 26.6 27.6 21.0 24 81 1012.1 N2 3 5 1 1MAY 109.5 9 34.9 24.1 29.6 26.? 25.8 25 79 1010.0 NE 2 5 5 3JUN 260.2 14 34.? 24.1 29.4 26.2 25.8 35 82 100I.0 SW 2 6 s 3JUL 26.4 17 34.2 23.9 29.1 27.8 25.5 2 83 1006.5 sw 3 8 s 2AUG 174.9 15 33. 23.9 29.0 27.8 2.5 25 63 1006.1 SW 2 6 3 2SEP 253.4 17 33.7 23.6 26.6 27.4 23.2 23 84 1008.9 sw 2 6 4 2OCT 110.1 24 33.1 23.3 26.2 26.9 348 24 84 1010.4 NE 3 6 5 2NOV 530.9 22 32.1 23.2 27.6 26.5 24.5 24 85 1011.2 NE 5 6 1 1DEC $71.4 24 30.9 22.6 26.8 2.6 23.8 23 8s 1012.9 NE 4 6 0 0ANN 3221.9 195 32.9 23.3 26.1 26.9 24. 24 as lOU.0 NE s 6 29 is
Station: AMBULONG BATANGAS Posit.: 14005'N 121"04'E Elev. Unk. Per. of records: 1961-1985
RAIN- TEMPERATURE (WC) MN. SEA PREVAILINGMO. PALL RAIN LEVEL WIND DAYS WT
(mm) DAYS MAX MW MEAN DRY WET DEW RH PRESS DIRC SPD CLDBULB BULB PT. () mi) TIN mj tL l LGTI
JAN 22.1 S 30.5 21.5 26.0 253$ 22.2 21 6 13 0P 9.9 3 31.7 21.4 26.8 2.8 22.2 21 73 1012.9 NIS 2 4 0 0MAW 16.3 S 33.5 22.2 27.9 27.2 22.9 21 6 1012.4 NE 2 3 1 1APR 37.4 S 34.8 23.4 29.2 26.6 24.2 23 89 1010.8 NZ 2 3 4 6MAY 106.3 10 34.3 23.9 29.2 26 25.0 24 73 100.3 SW 2 4 12 18JUN 237.5 16 31.6 24.0 27.9 27.9 25.2 24 80 1008.7 SW 2 6 14 18JUL 269.9 19 31.4 23.6 27.5 27.2 24.9 24 83 1008.4 SW 2 6 16 16
AUG 323.7 19 30.8 23.8 27.3 27.1 24.8 24 83 1006.2 SW 2 6 0SEP 259.7 18 31.3 23.4 27.3 26.9 24.8 24 84 1006.1 SW 2 6 14 16OCT 234.1 16 31.5 23.0 27.3 26.7 24.4 24 83 1000.7 NE 2 5 8 12NOV 186.6 13 31.1 22.8 27.0 26.5 23.8 23 80 1010.6 NE 2 5 3 6DEC 97.6 10 30.0 22.2 26.2 23.6 22.9 22 79 1012.1 NE 2 S 1 2ANN 1790.1 137 31.9 22.9 27. 27.0 23." 23 78 1010.4 NE 2 6 82 102
Station: APARRI Posit.: 18*22'N 12138'E Elev. 4 m. Per. of records: 1951-1985
RAUI- TEM RATURE (OC) MN. SEA PREVAILINGMO. PALL RA LEVEL WIND DAYS WITH
(mm) DAYS MAX MIN MEAN DRY WET DEW RH PRESS DIREC SPD CLDRULS RULE PT. (B) (,-b.) -TION (m-.) WodM) T F LGTN
JAN 141.1 15 26.4 20.4 23.4 231 21.2 20 84 1016.0 NE 4 6 o oFEB 76.0 9 27.6 20.7 24.1 23.8 21.7 21 83 1015.2 NE 4 5 0 0
MAR 45.8 6 29.3 2.0 25.7 25.3 23.0 22 62 1014.2 NE 3 4 1 1APR 35.4 5 31.6 23.6 27.6 27.1 24.4 24 80 1011.9 NE 3 3 3 3MAY 100.6 8 33.3 24.6 29.0 28.3 25.4 28 79 1006.4 NE 3 4 7 9JUN 184.1 13 33. 24.8 29.2 28.35 2S.7 25 8o 1007.9 s 3 5 11 14JUL 183.2 12 32.9 24.8 26.9 26.3 25.7 25 81 1007.5 S 3 6 8 13AUG 225.5 15 32.4 24.6 26.3 27.9 25.5 23 82 1006.5 3 3 6 6 9SEP 274.7 15 31.6 24.3 27.9 27.5 25. 25 84 1003 NE 3 5 6 8OCT 343.0 18 30.2 23.7 26.9 26.8 24.6 24 83 1011.0 NE 4 6 3 6NOV 396.0 21 262 22.8 25.5 25.4 23.6 23 86 1013 NE 4 6 1 1DEC 206.7 19 26.8 21.4 24.1 23.8 22.2 22 87 1015.3 NE 4 6 0 0ANN 2213.9 166 30.3 3.1 26.7 26.3 24.0 23 83 1011.4 NE 3 5 46 64
Station: BAGUIO Posit.: 162V'N 12036'E Elev. 1501 m. Per. of records: 1951-1985
RAIN- TEME URE (-c) MN. SEA PREVAILINGMO. PALL RAIN LEVEL WIND DAYS W
(mm) DAYS MAX M]I MEAN DRY WET DEW RH PRESS DIREC SPD CLDRULE RULE PT. () ( ) -TON (t.) (acm) TMW LGTN
JAN 12.1 4 22.6 12.9 17.8 16.6 14.5 13 80 1012.1 SE 2 4 0 0FEE 35.8 2 23.6 13.1 16.4 17.2 14.8 13 78 1011.6 SE 2 4 1 0MAR 55.9 4 24.7 14.3 19.6 18.4 16.0 15 ?8 1010.8 SE 2 4 2 1APR 102.9 9 25.1 15.5 20.4 19.4 17.2 16 80 1006.4 SE 2 5 9 3MAY 331.1 19 24.6 16.2 20.5 19.4 17.8 17 86 1007.9 SE 2 6 18 10JUN 480.6 22 23.6 16.2 20.0 19.0 17.7 17 88 1007.3 SE 3 6 15 8JUL 670.8 26 23.0 16.0 19.6 18.6 17.5 17 90 1006.6 SB 3 7 14 6AUG 847.9 27 22.0 15.9 18.9 18.2 17.4 17 92 1006.2 SE 3 a 11 4SEP S823 25 22.9 15.T 19.3 18.5 17.4 17 90 1007.1 NW 2 7 13 5OCT 262.4 A 1 23.3 15.4 19.3 18.6 17.2 17 87 1006.1 SE 3NOV 152.3 9 23.2 14.8 19.0 18.1 16.3 15 83 1006.5 SR 3 5 2 1DEC 28.8 5 22.8 14.0 18.4 17.4 15.3 14 80 1010.9 SE 2 4 1 0ANN 32.9 169 23.5 15.0 19.3 18.3 16.6 16 84 1009.0 SE 2 6 94 43
C-3

tatio: ER QU N Posit.: 1545'N 12134'E E7ev. 6 m. Per. of records: 1951-1985
RADI- TEMOMATURE ( C) MW. SEA PREVAILINO. FALL RAIN LEVEL WIND DAYS WITH
(u-a) DAYS MAX MEN SWAN DRY WET DEW RH PRESS DIRBC SPD CLDEULIB EULE PT. (% 1bs -TIO Lum) (aTm) 2W WTH"
JAN 1.1 15 WA 20.3 4.4 24.0 21.7FEE 15A 1s 29.0 280 24.8 34.2 21.9 21 82 1014.9 E 2 6 0 0
MAR 213.1 17 30.1 21A 25.7 25.1 22, 22 81 1014.2 2 f 0 2APR 2324 19 31.5 22.6 27.0 26.5 24. 23 82 1012.5 B 2 a 3 7MAY 3IA 19 32.7 25.4 28.0 27.5 25.0 24 82 1010.1 3 2 a 12 17JUN 272.3 17 33.0 23.7 26.3 2"8 25.1 24 so 100L8 Sw 2 6 11 17JUL 240. 18 22.8 23.6 2.2 27.6 24.8 24 so 1007.9 w 2 6 11 16AUG 218.6 18 32.5 23.7 26.1 27.5 24.7 34 so 1007. w 3 6 8 13SEP 800.6 18 82.3 23.4 27* 27.2 24* 24 81 100.5 Sw 2 6 9 15OCT 416.0 18 31.5 22.6 27.0 26A 24.3 24 as 1010.1 3 2 6 6 11NOV 444.4 18 30.2 21.9 26.0 25.7 23.5 23 a 101,.0 3 2 6 2 3DiC 327. 16 29.1 21.1 25.1 24.8 22.5 22 62 103.9 B 2 6 0 0
A In 311.1 20 31.1 22.4 26.7 26.2 23, 23 2 1011U E 2 6 62 610
Statio: BA O Posit.: 200271N 12158WE MYev. 11 m. Per. of records: 1951-1985
RA-lN TEM ErATURE (SC) MN. SEA PRELVAIuINMO. FALL RAIN LE L WIND DAYS WrIT
(mm) DAYS MAX MWN ME"AN DRY WET DEW RH PRESS DI]C SPD CLDBUL3 IBULB PT. () mb,) WTO Imps) (ocs. TRW LG"TN
JAN 133. 19 24.7 192 2.0 22.0 19.9 1 62 016* N5 6 a 0FEE 126N 15 25.7 19* 22.7 22.7 20.5 20 62 1015.9 NE 5 6 0 1MAR 102.6 13 27.5 21.2 24.3 24.2 21.9 21 a2 1014* N 5 N 0 0APR 83.1 10 29.2 23.3 26.3 26.2 23= 23 82 1012.6 SE 4 5 2 2MAY 1384 11 30.9 24.7 274 27.9 25.6 25 83 1006.7 SE 4 5 3 7JUN3 278.3 15 314 25.2 2. 26.5 26.1 25 83 1007.9 SE 4 6 3 9JUL 259.2 17 31.6 25.1 28.4 26.6 264 26 84 1007.1 SE 5 5 5 9AUG 430.2 21 30.9 24.8 27.9 28.1 26.1 26 8a 1006.4 SW 5 6 4 7SEP 370.1 20 30.9 24.4 27.6 274 25.6 25 84 1008.2 NE 4 6 3 7
.OCT 330.1 20 2"A 231 26. 26.7 24.3 24 62 1010.1 NE 4 6 3 7NOV 317.1 21 27.5 22.3 24.9 24.9 22.6 20 82 103.9 NE 6 6 0 1DEC 259.9 21 25.7 20.3 22.9 23.0 21.0 20 84 1014.1 NE 6 6 0ANN X287.0 2=038 22.8 25A 25.9 23.6 23 S3 1011.4 NE 5 6 21
Station: BORONGAN SAMAR Posit.: 11036'N 12526'1E Eev. 6 m. Per. of reords: 1951-1985
RA - TEMPEjAT•.RE (-c) MW. SEA PREVAINGMO. FALL RAN LEVEL WIND DAYS WITH
(mm) DAYS MAX MIN MEAN DRY W•r DEW RH PRESS DIREC SPD CLDBULB IBULB PT. (2) (b) .TO ms ot) TW LGTN
JAN 6U3 25 29.0 22.1 25. 25 2.5 66 0FEE 414.1 22 29.5 22.3 25.9 25.4 235 23 85 1012.3 NE S 6 0 0MAR 306.9 21 30.3 22.S 26.4 26.1 23.9 23 83 1012.5 NE 2 5 0 1APR 256.1 21 31.4 23.1 27.2 27.0 24.7 24 83 1011.2 NE 2 5 2 3MAY 296.9 18 32.1 23.4 27.7 274 25.1 24 83 1010.0 E 2 5 6 6JUN 232.0 18 32.2 23.2 27.7 27.3 25.1 24 84 1000.6 W 2 5 6 9JUL 196.8 17 32.3 23.1 27.7 27.2 248 24 62 1009.0 W 2 6 7 8AUG 182.0 15 32.7 23.1 27.9 27.3 24.7 24 81 1008.6 W 2 6 6 10SEP 204.5 16 32.6 23.0 268* 27.2 24. 24 62 1008.9 W 2 6 7 9OCT 312.7 20 31* 224 27.3 26* 24.7 24 84 1009.5 W 2 6 6 8NOV 554 23 30.7 224 26.7 26.3 24.5 24 86 1010.2 NE 2 6 3 4DEC 663.3 27 29.7 22.7 26.2 25.9 24.1 23 86 1011.2 NE 2 6 1 2ANN 4248.0 243 31.2 22A 27.0 26.6 24.5 24 84 1010.4 NE 2 6 44 60
Station: BUTUAN CITY Posit.: 08156N 125041'E Elev. 46 m. Per. of records: 1981-1985
RA•N- TEMPERATURE ('C) MN. SEA PREVAILINGMO. FALL RAIN LEVEL WIND DAYS WITH
(amm) DAYS MAX MIN MEAN DRY WET DEW RH PRESS DIREC SPD CLD
BULB BULB PT. (1 Ima ..TION (fl) (oq?. TR LGTNJA W5.9 29 30.0 21 .25.9 25.6 24.1 N W 0, w 1 6 2 14FEB 205.4 13 31.5 21.1 26.3 25.9 23.9 23 85 1011.2 NW 1 5 1 6MAR 100.1 13 32.1 21.8 26.9 26* 24.3 23 81 1013.4 SE 1 5 3 6APR 63.49 10 335 22.8 28.1 27.9 25.1 24 80 1011.4 ESP 1 4 9 11MAY 124.6 13 34.1 23.3 28.7 26.3 25.5 25 80 1010A4 ES 1 5 16 21JUN 124.4 13 33.1 23.3 28.2 27* 25.2 24 81 1010.0 ESE 2 6 10 22JUL 161.2 15 32.5 22.6 27.5 27.4 25.3 25 84 1010.9 NW 2 6 12 26
AUG 73.3 9 32.9 23.0 27.9 27.8 25.2 24 81 1011.3 ESE 2 6 11 20SEP 182.1 16 32.5 22.9 27.7 27.3 25.1 24 84 1011.6 VBL 1 6 10 19OCT 181.1 17 32.0 22.7 27.3 27.1 25.1 24 85 1011.8 NW 1 6 14 24NOV 158.7 15 32.0 22.5 27.2 27.0 26.0 24 85 1011.9 VRBL 1 6 11 22DEC 223.5 18 30.7 22.3 26.5 26.8 24.5 24 83 1012.9 NW 1 5 4 19ANN 2033.7 171 32.2 22.5 23.4 27.1 24.9 24 83 1011.7 NW 1 6 103 210
C-4
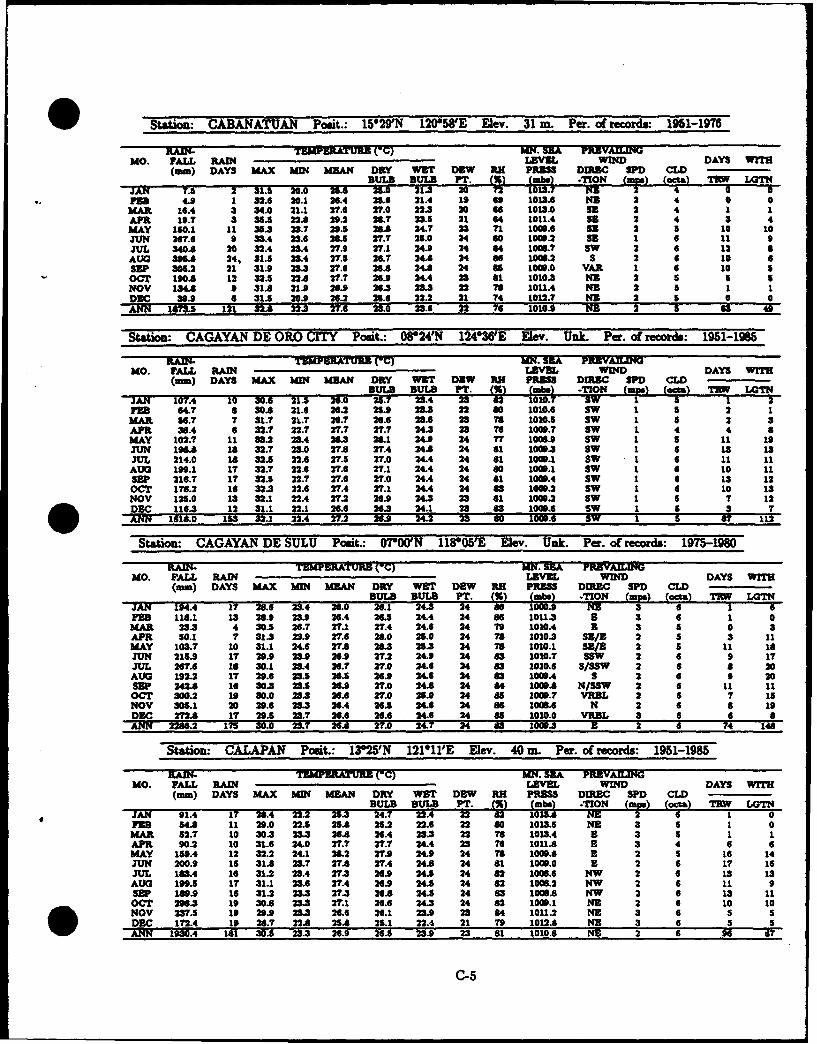
Station: CABANATUAN Posit.: 1529'N 120*58'E Elev. 31 n. Per. of records: 1961-1976
RAM- TENMIP ATURE ('C) MN. SEA PRNVAMLINGMO. FALL RAIN LEVEL WIND DAYS WIMh
(mm) DAYS MAX MUN MEAN DRY WET DEW RK PRESS DIRBC SPD CLIBULB BULB PT- % TO me) (ca 2 LOTN
JAN T.A 2 31.5 20.0 26.8 25.0 21'3 20 22 4 0E 4.9 1 32.6 20.1 26.4 25.6 21.4 19 6o 1013.6 NE 2 4 0 0
MAR 16.4 3 34.0 21.1 27.6 27.0 22.3 20 6 1013.0 SE 2 4 1 1APR 19.7 3 35. 22.8 29.2 25L? 23.5 21 64 1011.4 SE 2 4 3 4MAY 150.1 11 35.3 23.7 29.5 26&8 24.7 23 71 1009.6 SE 2 5 10 10JUN 267.6 9 33.4 23.6 26.5 27.? 25.0 24 s0 1009.2 SE 1 6 11 9JUL 340.8 20 32.4 23.4 27.9 27.1 24.9 24 64 1006? SW 2 6 12 8AUG 395.8 24, 31.3 M.4 27.5 26.7 24 24 a6 1006.2 S 2 6 10 6SEP 305.2 21 31.9 23.3 27.6 26.8 24.8 24 85 1009.0 VAR 1 6 10 SOCT 190.8 12 324. 22.8 27.7 26.9 24.4 23 81 1010.3 NE 2 5 5 5NOV 134.8 9 31.8 21.9 26.9 .3 23.3 22 78 1011.4 NE 2 5 1 1DBC 39.9 6 31.5 20.9 26.2 25.6 2.2 21 T4 1012.7 NE 2 5 0 0ANN 183.5 121 32.8 22.32 7.6 N 3.0 23.6 22 76 1010.9 NZ 2 5 63 49
Station: CAGAYAN DE ORO CITY Posit.: W24'N 124*36'E Elev. Unk. Per. of records: 1951-1965
RAIN- TUMMEATUR (-C) MN. SEA PRJUVALnGMO. FALL RAIN LEVEL WiND DAYS WITH
(m) DAYS MAX SUN MEAN DRY WETr DEW RH PRESS DIREC SPD0 CLDBULB BULB PT- (25) L*V-TION LOW
JAN 107.4 10 30.6 21.5 26.0 25.7 W4 23 2W 1TFE 64.7 6 30.8 21.6 26.2 25.9 23.3 22 80 1010.6 SW 1 5 2 1MAR 567. 7 31.7 21.7 26.7 26.6 23.6 23 78 1010.5 SW 1 5 2 3APR 36.4 6 32.7 22.7 27.7 27.7 24.3 23 76 1009.7 SW 1 4 4 8MAY 102.7 11 =3.2 23.4 26.3 26.1 24.9 24 77 1008.9 SW 1 5 11 19JUN 196.8 18 32.7 23.0 27.8 27.4 24.8 24 81 1000.3 SW 1 6 13 13JUL 214.0 18 32.5 22.6 27.5 27.0 24.4 24 81 1009.1 SW 1 6 11 11
AUG 199.1 17 32.7 22.6 27.6 27.1 24.4 24 80 1009.1 SW 1 6 10 11SEp 216.7 17 32.5 22.7 27.6 27.0 24.4 24 61 1009.4 SW 1 6 13 12OCT 178.2 16 32.3 22.6 27.4 27.1 24.4 24 83 1009.2 SW 1 6 10 13NOV 125.0 13 32.1 22.4 27.2 26.9 34.3 23 81 1009.2 Sw 1 5 7 12DEC 116.3 12 31.1 22.1 26.6 26.2 24.1 23 a 1009.6 Sw 3 7ANN 1616.0 153 W.1 22.4 27.2 26. 24.2 23 8o 1009.6 sw 1 5 67 112
Station: CAGAYAN DE SULU Posit- 07'0O'N 118"05'E Elev. Unk. Pa. of records: 1975-1980
RAI•- TEMPERATURE (OC) MN. SEA PREVALINGMO. FALL RAIN LEVm WIND DAYS WITH
(mm) DAYS MAX MIN MEAN DRY WET DEW RH PRESS DIREC SPD) CL)BULB BULB PT. (25 {ks -IO
JAN 194.4 17 2,.6 23.4 26.0 26.1 24" 24FEB 11&.1 13 28.9 23.9 26.A 26.5 24.4 24 86 1011.3 B 3 6 1 0MAR 23•3 4 30.5 26.7 27.1 27.4 24.6 24 79 1010.4 B 3 5 0 3APR 50.1 7 31.3 23.9 27.6 28.0 25.0 24 78 1010.3 SMBE 2 5 3 11MAY 103.7 10 31.1 24.6 27.8 28.3 25.3 24 78 1010.1 ME/3 2 5 11 18JUN 215.8 17 29.9 23.9 26.9 27.2 24.9 24 as 1010.7 SSW 2 6 9 17JUL 267.6 18 30.1 23.4 26.? 27.0 24.6 24 83 1010.6 S/SSW 2 6 8 20AUG 192.2 17 29.6 23.5 26.5 26.9 24.6 24 83 1009.4 S 2 6 9 20SEP 242.8 16 30-3 23.3 26.9 27.0 24.8 24 84 1009.8 N/SSW 2 6 11 11OCT 300.2 19 30.0 23.3 26.8 27.0 26.0 24 a5 1009.7 VROL 2 6 7 1sNOV 305.1 20 29.6 23.3 26.4 26.5 24.6 24 86 1008.6 N 2 6 8 19DEC 2728 17 29.5 23.7 26.6 26.6 24.6 24 85 1010.0 VRBL 3 6 6 8ANN 2266.2 175 30.0 23.7 26, 27.0 24.7 24 as 1000.3 B 2 74 148
Station: CALAPAN Posit.: 1325'N 121011'E Elev. 40 mi. Per. of records: 1951-1985
Tr TEMPERATURE ( C) MN. SEA PREVALINGMO. FALL RAIN LEVE WIND DAYS WITH
(mm) DAYS MAX MW MEAN DRY WET DEW RH PRESS DIREC SPD CLDBULB B3ULBI Pr- () 'IN TpN (Mp) Coa TIq WTN
JAN 91.4 17 2W.4 22.2 253 24.7 22.4 1 0FEB 4.8 11 29.0 22.5 25.8 25.2 22.6 22 80 1013.5 NE 3 5 1 0
MAR 52.7 10 30.3 23.3 26.8 26.4 23.3 22 To 1013.4 B 3 5 1 1APR 90.2 10 31.6 24.0 27.7 27.7 24.4 23 76 1011.8 a 3 4 6 6MAY 159.4 12 32.2 24.1 38.2 27.9 24.9 24 78 1009.6 a 2 5 16 14JUN 200.9 15 31.8 23.7 27.8 27.4 24.8 24 81 1009.0 a 2 6 17 16JUL 183.4 16 31.2 23.4 27.3 26.9 24.5 24 82 1006.6 NW 2 6 13 13AUG 199.5 17 31.1 23.6 27.4 26.9 24.5 24 82 1006.2 NW 2 6 11 9SEP 189.9 16 31.2 23.3 27.3 26.8 24.S 24 83 1008.8 NW 2 6 13 11OCT 296.3 19 30.8 23.3 27.1 26.6 24.3 24 82 1009,1 NE6 2 6 10 10NOV 237.5 19 29.9 23.3 26.6 26.1 23.9 23 84 1011.2 NE 3 6 5 5DEC 172.4 19 28.7 22.8 25.8 25.1 22.4 21 79 1012.8 NE 3 6 5 SANN 1930.4 11 30.5 23.3 26.9 26.5 23.9 23 61 1010.8 NE 2 6 96 87
C-5
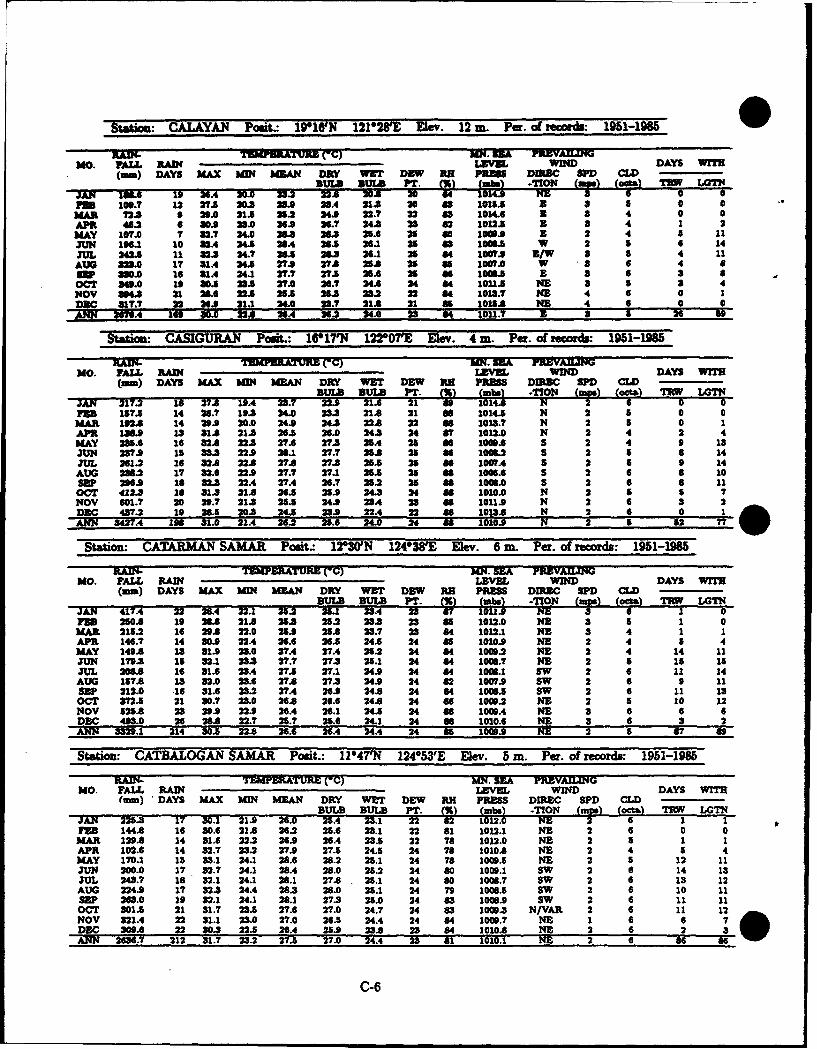
Stgtion: CALAYAI Posit.: 19"6N 1210281E Elev. 12 m. Per. o records: 1951-1966
WAIN- T*IWERATURZ (-C) MN.a lE PE amLNMO. FAnu RAIN LA = WIND DAYS WrTH
(rm) DAYS MAX MW MAN DRY W8T DEW RH PR DUWC WD CLDBIULB BULI T I) ~ -f~l (a at) T L07N
JAR 1MI.; 19 36A4 30.0 33.2 H2. 20A 75 84j n; 0PU 10.? 22 275 203 23 .4 2 21. 20 as 10183 3 3 S 0 0MAI 72. 9 29.0 21.5 25.2 " 4 2 .7 . 22 S 1014.6 3 4 0 0APR 46. 6 30.9 28.0 26.9 26.7 24.3 23 82 1012. 3 3 4 1 2MAY 107.0 7 27.T 4.0 23 283 25.6 25 so 1i B, 2 4 5 11JUN 196.1 0o 32.4 8 28.4 28 26.1 25 as 101A, w 2 6 14JU 242. 11 32. 4.3? 26 282 24.1 25 84 1007.2 3w 5 4 11
AlUG 328.0 17 31A 24.5 2742 27* 26A 25 85 1007.0 EW 3 4 8AEP C.0 16 31A 24.1 27.7 27. 25.6 25 8 lo0. w 3 6 3 8OCT 349.0 19 308 23.5 27.0 26. 24. 24 64 IOUs, NE 3 5 3 4NOV 34. 21 20.6 225 25 25.3 2.2 22 64 1013.7 NE 4 6 a I
D3 1.7 22 26.9 21.1 24.0 23.7 21 21A 058 N 4 6 0 0ANN 2674 16g U0.0 22A 26.4 26.2 24. 323 304 lOU.1?8 T 3 a 26 59-
tto: CASIGUR.AN Posit.: 16017'N 1220071E Elev. 4 m. Per. of records: 1951-18,5
RAIN- TEPU.ATUNE (-C) MPA. SEA PFREVAIMLNMO. FALL RAIN LEVEL WIND DAYS WITH
(mm) DAYS MAX M]N MEAN DRY WET DEW RN PRESS DIRBC SPD CLD22.2 2U1.6 21j 89!, 10MN; LOWI
JAN 217.2 IS 27.8 19A 23.7 2UL 21LB PT (% (0-TOFEB 157.5 14 26.7 19.2 24.0 23.3 2 21 8s 1014.5 N 2 5 0 0MAR 192A 14 29.9 20.0 24.9 24. 22.6 22 SO 1013.7 N 2 5 0 1APR 1380 3 331.6 21.3 26.5 26.0 24.3 24 S7 1012.0 N 2 4 2 4MAY 255.6 16 32.8 22.3 27.6 27.3 25.4 25 86 108.6 5 2 4 9 13JUN 237.9 15 33.3 22.9 26.1 27.? 28.8 25 86 1006a S 2 5 8 14JUL 261.2 16 32.8 22.8 27.8 27.3 25.5 25 86 100.A S 2 5 S 14AUG 236.2 17 32.6 22.9 27.7 27.1 255 25 8s 1006.4 S 2 6 8 10SEP 296. 18 32.3 22.4 27A4 26.7 25.3 25 s 1005.0 S 2 6 8 11OCT 423.2 18 81.3 21,6 26.5 25.9 24.3 24 W 1020.0 N 2 5 5 7NOV 601.7 20 29.7 21.3 25.5 24.9 23.4 23 86 1011.9 N 2 6 3 2DEC 437.2 19 26.5 20.3 24.5 23.9 22.4 22 as 1023A N 2 6 -0 1
ANN 3427.4 196 31.0 21.4 26.2 25.6 2.0L 24 86 1010.9 N 2 G 52 7
Station: CATARMAN SAMARL Posit- 1230N 1240WE Elev. 6 n. Per. of records: 1951-18
RAIN- TEMPE.ATURB ('c) MN. SEA PREVAILIMMO. FALL RAIN LEVEL WIND DAYS WrM
(m,) DAYS MAX MIN MEAN DRY WET DEW B PRESS DIRC SDD CLDBIULB3 BULB PT A*I *ms TO mu) (c. E LGTN
JAN 417.4 22 28.4 22.1 25.2 25.1 23.4 E213 87 zou*4 NE 61FEa 250* 19 26.8 21A 26.3 25. 23.3 23 8s 1012.0 NE 3 5 1 0MAR 215.2 16 29* 22.0 25.9 25* 23.7 23 84 1012.1 NE 3 4 1 1APR 146.7 14 30.9 22.4 26.6 26.5 24.5 24 85 1010.9 NE 2 4 5 4MAY 149A 13 31.9 23.0 27A4 27.4 25.2 24 84 1009.2 NE 2 4 14 12JUN 179.3 15 32.1 23.3 27.7 27.3 25.1 24 84 1006.7 NE 2 5 15 15JU 20&* 16 31.6 23.4 275 27. 24.9 24 2 4 1008.1 SW 2 6 1 14AUG 157.8 13 32.0 23.6 27A 27.3 24.9 24 82 1007.9 SW 2 6 9 11SEP 212.08 16 31.6 23.2 27.4 26.9 244 24 84 1006.5 SW 2 6 11 13OCT 372.5 21 30.7 23.0 26* 26.6 24.8 24 s8 1000.2 NE 2 4 10 12NOV 525* 23 29.9 22.9 26.4 26.1 24.5 24 8s 1009A NE 3 6 6 6DEC 493.0 26 28* 22.7 25.7 25.6 24.1 24 86 1010.6 NE 3 6 3 2ANN 3329.1 214 30.5 22*. 26.6 26.4 24.4 24 65 1009.9 NE 2 87 69
Station: CATBALOGAN SAMAR Posit.: 1147'N 124*53'E Elev. 5 m. Per. of records: 1951-1985
RAIN- TEAMPEATURE (-C) MN. SEA PREVAILINGMO. FALL RAIN LEVEL WIND DAYS WITH
(m) DAYS MAX MIN MEAN DRY WET DEW 311 PRESS DIREC SPD CLD
--BULB BULB PT. (% ubo) ..T3W gpjs IV!, X LGTI4JAN 225.3 17 30.1 =21.926. 2-5.4 -- 23.1 2 82 12. NE61 1FEB 144A 16 30.6 21*8 26.2 25.6 23.1 22 81 1012.1 NE 2 6 0 0MAR 129*8 14 81.6 22.2 26.9 26A 23.5 22 78 1012.0 NE 2 5 1 1APR 102. 14 32.7 23.2 27.9 27.5 24.5 24 78 1010* NE 2 4 5 4MAY 170.1 15 33.1 24.1 28.6 28.2 25.1 24 78 1009.5 NE 2 5 12 11JUN 200.0 17 32.7 24.1 28.4 28.0 25.2 24 80 1009.1 SW 2 6 14 13JUL 243.7 18 32.1 24.1 28.1 2746.25.1 24 80 1006.7 SW 2 6 13 12AUG 224.9 17 32.3 24.4 28.3 28.0 25.1 24 79 1006.5 SW 2 6 10 11SEP 263.0 19 32.1 24.1 28.1 27.3 25.0 24 83 1008.9 SW 2 6 11 21OCT 301.5 21 31.7 23.5 27.6 27.0 24.7 24 83 1009.3 N/VAR 2 6 11 1NOV 321.4 22 31.1 23.0 27.0 26.5 24.4 24 84 1009.7 NE 1 6 6
DE 06 22 30.3 22.5 26.4 25.9 23.8 23 84 1010.8 NE - _ 22 212 31.7 23.2 27.5 27.0 24.4 23 81 1010.1 NE 2 6 86
C-6
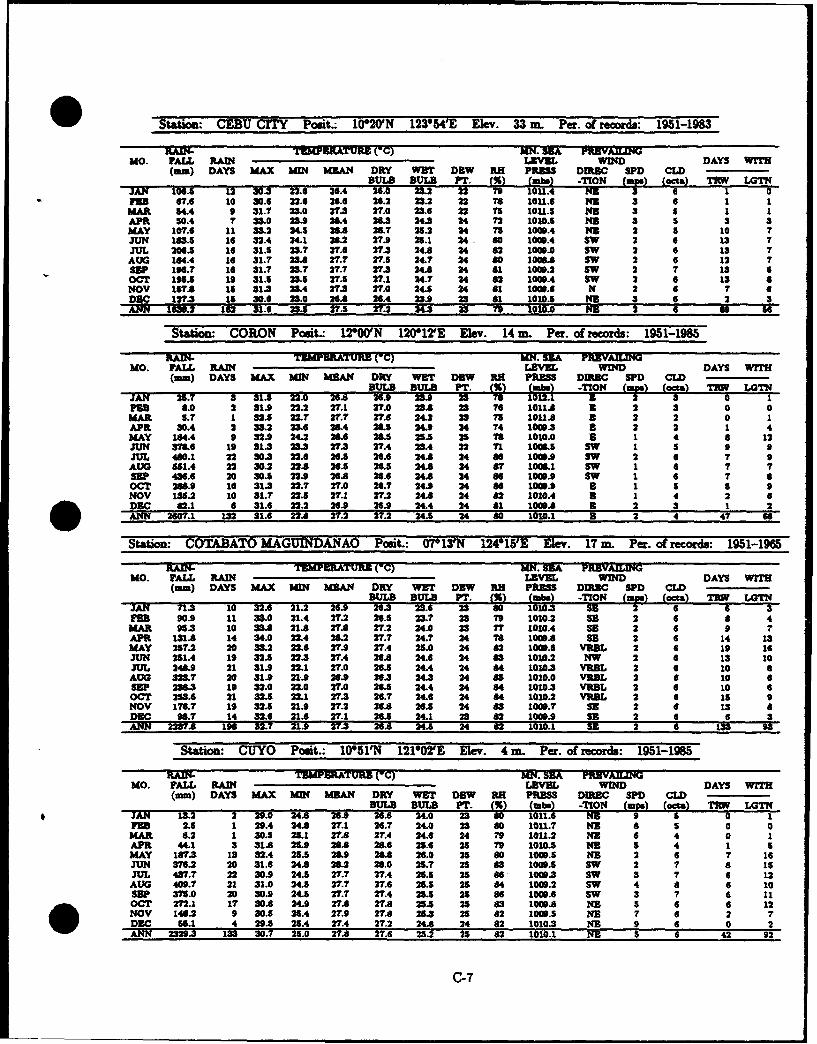
Station. CEBU CITY Posit.: 1020'N 123054E Elev. 33 m. Pe. of records: 1951-1983
RAIK- TEMPERATURE (*C) MN. SEA PREVAMIIMNMO. PALL RAIN LEVEL WIND DAYS WITH
(mm) DAYS MAX Mb MEAU DRY WET DEW RH PRESS DIC SPD CLDBSULB BULB PT- % ma fON Ip ot) 1 LG-TN
JAN 106.5 12 30.3 22.6 36.4 16.0 23.2 22 a911. UFEE 67.6 10 30.6 22.6 26.6 24.2 23.2 22 78 111.6 NN 3 G 1 1MAR 54.4 9 31.7 =2.0 273 27.0 23.6 22 i5 £011.5 NE 3 5 1 1APR 50.4 7 33.0 23.9 26. 26.3 24.3 24 72 1010.5 NIS 3 5 3 3MAY 107.6 11 33.2 24.5 26 26.7 25.2 34 75 1009.4 NZ 2 5 10 7JUN 163.5 16 32.4 24.1 26.2 27.9 25.1 14 80 1009.4 SW 2 6 13 7JUL 206.5 16 31.6 23.? 27.6 273 24A 14 62 1009.0 SW 2 6 13 7
AUG 164.4 16 31.7 23.8 27.7 27.5 24.7 24 8o0 1006 SW 2 6 12 7SEP 196. 16 31.7 23.7 27.7 27.3 24.8 24 61 1009a2 SW 2 7 13 6OCT 196.5 19 31.5 23.5 27.5 27.1 24.7 14 62 1009.4 SW 2 6 13 8NOV IT6.8 15 31.3 23.4 27.3 27.0 24 24 61 1009.6 N 2 6 7 aDEC 127.3 15 30.6 23.0 2. 264 23.9 23 61 1010.5 NE 3 6 2 3ANN 13.2 162 31.6 2W. 2M 7T 1010.0 NE 2 6
Station: CORON Posit.: 12'00N 120112'E Elev. 14 m. Per. of records: 1951-1985
RAN- TEMPE TUR ( C) MN. SIX PREV.AIINGMO. PALL RAIN LEVEL WIND DAYS WITH
(mm) DAYS MAX WN MEAN DRY WET DEW RH PRESS DIR- C SPD CLDB3ULB BULB PT. 'g,(ba TIFN Lqps (gVa nW LGTN
JAN 25.7 3 31.5 223. 26.A 26.9 23.9 23 7 10,2 .1 l 0 1pan 8.0 2 31.9 22.2 27.1 27.0 23.8 23 6 1011.8 iE 2 3 0 0MAR 5.7 1 32.5 22.7 21.7 27.6 24.2 23 75 1011.8 a 2 2 0 1APR 30.4 2 33.2 23.6 26.4 2LS 24.9 34 74 1009.3 E 2 2 1 4MAY 164.4 9 323.9 24.2 28.6 28.5 25.5 26 76 1010.0 E 1 4 a 12JUN 376.6 19 31.3 23.3 27.3 27.4 23.4 22 71 1006.5 SW 1 5 9 9JUL 460.1 22 30.3 22.6 26.5 26.6 24A 24 8s 100.9 SW 2 6 7 9AUG 551.4 22 30.2 22.8 26.5 26.5 24.8 24 67 1005.1 SW 1 6 7 7SEP 436.6 20 30.5 22.9 26.8 26.6 243 24 86 100.9 SW 1 6 7 6OCT 268.9 16 31.3 22.7 27.0 26.7 243 24 86 1000.9 3 1 5 5 9NOV 135.2 10 31.7 22.5 27.1 27.2 24.8 24 82 1010.4 8 1 4 2 6DEC 62.1 6 31.6 22.2 2639 2639 24.4 24 61 1009.8 E 2 3 1 2-MMN 2607.1 132 31.6 223 27.2 127.2 24-5 24 so 1010.1 B 2 4 47 a
Station: COTABATO MAGUINDANAO Posit.: 0713'N 124*1WE Elev. 17 r. Per. of records: 1951-1965
RAIN- TEMP ATURE (-C) MN. SEA PREVALIMO. PALL RAN LEVEL WIND DAYS WITH
(mm) DAYS MAX MW MEAN DRY WW DEW RB PRESS DUC SPD CLDBUL BLB T. (%) (ma) TIN (mpp) (o) 1 WV R LOWN
JAN 71.3 10 32.6 21.2 26.9 26.3 . 1010.3 6 3
FEB 90.9 11 33.0 21.4 27.2 26.5 23.7 23 79 1010.2 SE 2 6 a 4MAR 95.3 10 33A 21.8 27.8 27.2 24.0 23 7? 1010.4 SE 2 6 9 7APR 131.8 14 34.0 22.4 28.2 27.7 24.7 24 78 10093 SB 2 6 14 13MAY 257.2 20 33.2 22.6 27.9 27.4 25.0 24 82 1009.6 VRL 2 6 19 16JUN 281.4 19 32.5 22.3 27.4 26.8 24.6 24 83 1010.2 NW 2 6 13 10JUL 246.9 21 31.9 22.1 27.0 26.5 24.4 24 64 1010.3 VEUL 2 6 10 6
AUG 323.7 20 319 21-9 26.9 26.3 24.3 24 85 1010.0 VUEL 2 6 10 6SEP 238.3 19 32.0 22.0 27.0 2.5 24.4 24 6 1010.3 VUEL 2 6 10 6OCT 253.6 21 32.5 22.1 27.3 26.7 24.6 24 84 1010.2 VRBL 2 6 15 9NOV 176.7 19 32.S 21.9 27.2 26.8 26.5 24 83 1009.7 Si 2 6 13 8DEC 96.7 14 32.6 21.6 27.1 26.3 24.1 23 82 1009.9 SE 2 6 6 3ANN 223 198 32.7 21.9 27.3 263 24.5 24 82 1010.1 s 2 2 6 133 93
Station: CIYO Posit.: 1051'N 121*02'E Elev. 4 m. Per. of records: 1951-1985
RAIN- TEMPERATURE (-C) MR. SPA PREVAULING
MO. FALL RAM LEVEL WIND DAYS WITH(,) DAYS MAX MEN MEAN DRY WET DEW RK PRESS DIREC SPD CLD
BUL13 BULB PT. ;% (mba) -TIO (mpg (oJ IM; LGTNJAN 13.2 2 29.0 24.8 263 26.6 40 3 80 1011.6 ,N 9 , d 1133 2.5 1 29.4 24.8 27.1 26.7 24.0 23 80 1011.7 NE 6 5 0 0
MAR 6.2 1 30.5 25.1 27.8 27.4 24.6 24 79 1011.2 NE 6 4 0 1APR 44.1 3 313 25.9 28.8 26.6 26.6 25 79 1010.5 NE S 4 1 5MAY 187.3 13 32.4 25.5 26.9 263 26.0 25 80 1009.5 NE 2 6 7 16JUN 376.2 20 31.6 24.8 26.2 26.0 25.7 25 83 1009.5 SW 2 7 8 15JUL 437.7 22 30.9 24.5 27.7 27.4 25.5 25 86 1009.3 SW 3 7 6 12AUG 409.? 21 31.0 24.5 27.7 27.6 25.5 25 4 1009.2 SW 4 8 6 10SEP 375.0 20 30.9 24.5 27.7 27.4 25.5 25 86 1009.6 SW 3 7 6 11OCT 272.1 17 30.8 24.9 27.8 27.8 25.5 25 83 1009.8 NE 5 6 6 12NOV 146.2 9 30.5 26.4 27.9 27.8 25.3 25 82 1009.5 NE 7 6 2 7DEC 55.1 4 29.5 25.4 27.4 27.2 24.8 24 82 1010.3 NE 9 6 0 2ANN 2329.3 133 30.7 25.0 27.8 27.6 25.2 25 62 1010.1 NE 5 6 42 92
C-7
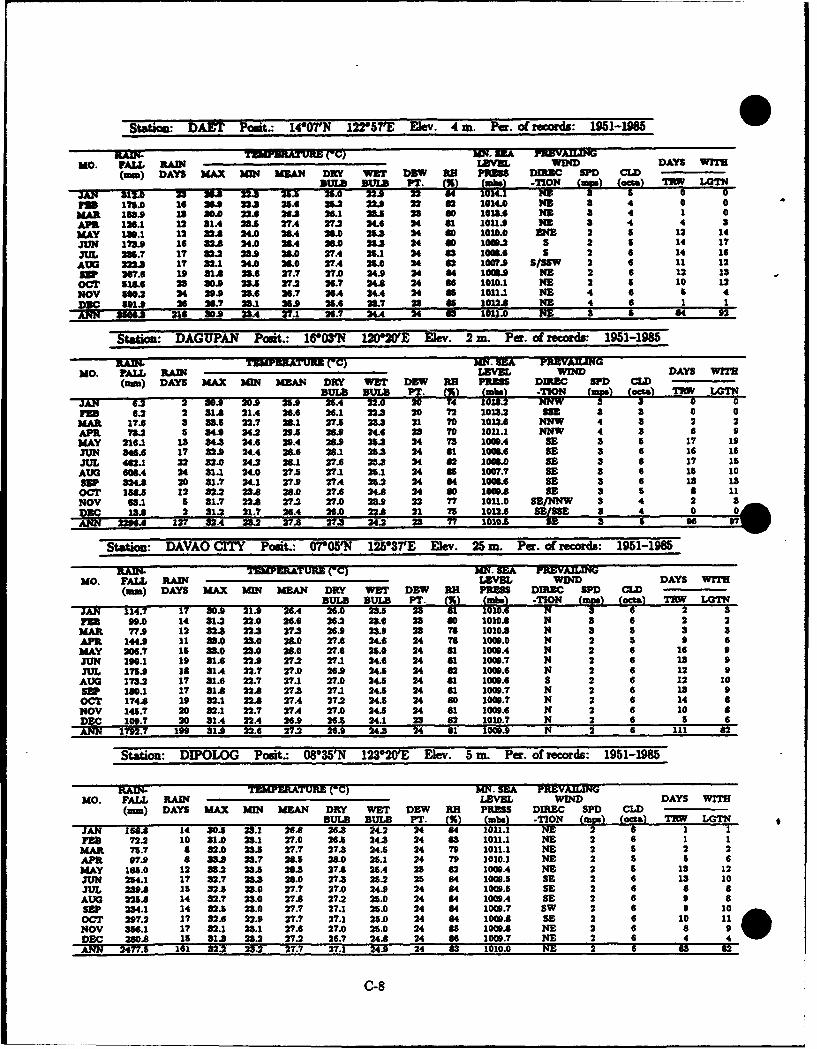
Station: DAET Posit. 1407'N 122?57'E Ekev. 4 m. Per. of records: 1951-1985
RAIN- T7 A 7rUTUMJ (C') MN. SEA PRMVARIINGMO. PALL RAW LEVE WIND DAYS WrTM
(ran) DAYS MAX MIN MEAN DRY WET DEW RE PRESS DIRC SD CLDSULB MU" PT. w% ismb wlO (Tm.) (Gems 3; LTOT
JAN 312.0 33 26. 22. 2.5* 25.0 22. 2rm 175.0 16 269 22.3 25. 25. 213 22 a 1014.0 NI 3 4 0 0MAR 123.3 13 30.0 22.6 264 26.1 23.5 23 so 1013.6 NZ 3 4 1 0APR 126.1 12 31.4 235 27.4 27. 24.6 24 81 1011.9 NE 3 4 4 3MAY 131.1 12 32A 24.0 28.4 2. 26.3 24 60 1020.0 DEN 2 S 12 14JUN 17&9 16 2A 24.0 2 6.4 2.0 25.3 24 80 1064.2 S 2 6 14 17JUL 235.7 17 32.2 22.9 28.0 27.4 2.1 24 83 1006.6 S 2 6 14 16
AUG 2" 17 32.1 24.0 .0 274 25.0 24 82 1007.9 S/SSW 2 6 11 122r67.6 19 31A 23.6 27.7 27.0 243 24 84 10013 NE 2 6 12 13
OCT 510.6 23 20.9 23. 27.2 26.7 24* 24 a6 1010.1 NE 2 5 10 12NOV 50.2 24 29 29.6 26.7 26A 24.4 24 65 1011.1 NIB 4 6 & 4D.9 3513 26 26.? 23.1 2539 25.6 23.7 23 a6 1012* NE 4 6 1 1
NN 218 203 2.4 2.1 26.7 244 24 1011.0 NE 3 5 64 02
Station: DAGUPAN Poit.: 16"03N 12020'E EMev. 2 m. Per. of records: 1951-1985
KA4N.- -1MWERATURE (0C) MN. SEA PRVAILiANGMO. PALL RAIN LIVE. WIND DAYS WITH
(sun) DAYS MAX MIN MEAN DRY WET DEW RH PRESS DIRMC SDM .DDULIS BULIB PT % m) -lO
JAN 6.2 3 30.9 2709 253 28.4 22.0 20 1V Mm w2l "PUS 6.2 2 31A 21.4 26.6 26.1 22.3 20 72 1013.2 NE 3 a 0 0MAR 17.6 3 33.5 22.7 20.1 27. 23-3 21 70 1012.6 NNW 4 3 2 2APR 733 5 6349 24.2 29.5 26 24.6 23 70 1011.1 NNW 4 3 6 9MAY 216.1 13 343 24.6 29.4 23 25.3 24 73 1009.4 SE S 3 17 19JUN 346.6 17 32.9 24.4 26.6 26.1 25.3 24 81 1005.6 SE S 6 16 1iJUL 462.1 22 32.0 24.2 26.1 27.6 258 24 82 10O50 SE 3 6 17 1sAUG 606.4 24 31.1 24.0 27.5 27.1 28.1 24 as 1007.7 SE 3 6 is 10SEP 324 20 21.7 24.1 27.9 27.4 25.2 24 84 100.6 SE 3 6 13 13OCT 1is6 12 32.2 23. 26.0 27.6 24.8 24 80 1009A SE 3 5 8 11NOV 63.1 5 21.7 22* 27.2 27.0 23 22 77 1011.0 S1/INNW 3 4 2 3
DC 1* 2 31.2 21.7 26.4 26.0 22* 21 75 11* SI/USE 3 4 0 0* 12 3.4 22.2 27A 24.2 3 7 1io-010 3 5 0 0 7 W-6_ J
Staticm: DAVAO CITY Posit.: 0705r N 12537'E Elev. 25 nx. Per. of records: 1951-1985
"RAIN- TEMPMEATURE (-C) SIn. s3 PREvALINMO. FAUL RMN LVEL WvN DAYS WrrH
(mim) DAYS MAX UIN MEAN DRY WIT DEW RH PRESS DIRMC SPD CLDBULB BULB PT. 'a) (mT. OIN '
JAN 114.7 17 3039 21.9 26.4 26. 535 -9 81I 100. :I 6) 2 373m 99.0 14 31.2 22.0 26.6 26.2 23.6 23 80 1010* N 3 6 2 2MAR 77. 12 322 22.3 27.3 26.9 23.9 23 78 1010* N 3 5 3 3APR 144.9 11 23.0 23.0 28.0 27.6 24.6 24 76 1005.0 N 2 5 9 6MAY 206.7 13 33.0 23.0 26.0 27.6 21.0 24 61 1000.4 N 2 6 16 0JUN 190.1 19 31.6 22.9 27.2 27.1 24.6 24 61 1005.7 N 2 6 13 9JUL 11.9 16 31.4 22.7 27.0 26.9 24.5 24 82 1005.6 N 2 6 12 9
AUG 173.2 17 31.6 22.7 27.1 27.0 24.5 24 81 1000.6 S 2 6 12 10SEP 180.1 17 31* 22.8 27.* 27.1 24.5 24 81 1009.7 N 2 6 13 9OCT 174* 19 22.1 22.8 27.4 27.2 24.5 24 80 1005.7 N 2 6 14 aNOV 145.7 20 32.1 22.7 27A 27.0 24.5 24 61 1009.6 N 2 6 10 8DEC 109.? 20 31.4 22.4 26.9 26.5 24.1 23 82 1010.7 N 2 6 5 6ANN 1792.7 19" 31.9 22.6 27.2 26.9 24.3 24 61 10003 N 2 6 111 82
Station: DIPOLOG Posit.: 08035'N 123020'E Eev. 5 m. Per. of records: 1951-1985
RAMI- TEMPERATURE (C) MN. SEA PREVAIANGMO. FALL RAIN LEVEL WIND DAYS WITH
(mm) DAYS MAX MIN MEAN DRY WET DEW RH PRESS DIREC SPD CLDBULBS BULB El. k% mba -TION (=I*) (OPt) TEW LGTN
JAN 156* 14 30. 23.1 26.8 26.3 24.2 24 W4 101.1 NE 2 6 1 1FEE 72.2 10 31.0 23.1 27.0 26.8 24*3 24 63 1011.1 NE 2 6 1 1
MAR 75.7 6 32.0 23.* 27.7 27.3 24.5 24 79 1011.1 NE 2 8 2 2APR 97.3 8 33* 23.7 26.5 26.0 25.1 24 79 1020.2 NE 2 55 6MAY 163.0 12 23.2 235 28. 27* 25.4 25 82 1009.4 NE 2 13 162JUN 254.1 17 22.7 23.3 25.0 27*3 25.2 25 64 1009.5 SI 2 6 15 10JUL 230A 15 32.* 23.0 27.7 27.0 2439 24 64 1009.5 SE 2 6 a aAUG 225A 14 22.7 23.0 27* 27.2 25.0 24 64 1009.4 SE 2 6 9 8SEP 224.1 14 324 23.0 27.7 27.1 28.0 24 64 1006.7 SW 2 6 9 10OCT 297.2 17 32.6 22.9 27.7 27.1 25.0 24 64 2009* SE 2 6 10 11 @NOV 35,6.1 1 32.1 23.1 27.6 27.0 25.0 24 5 1009* NE 2 6 8DEC 280* 15 31*3 22. 27.2 26.7 24* 24 86 1009.7 NE 2 6 4
-ANN 2477.5 161 32.2 23.2 27.7 27.1 24.9 24 83 1010.0 NE 2 6 83 82
0-8
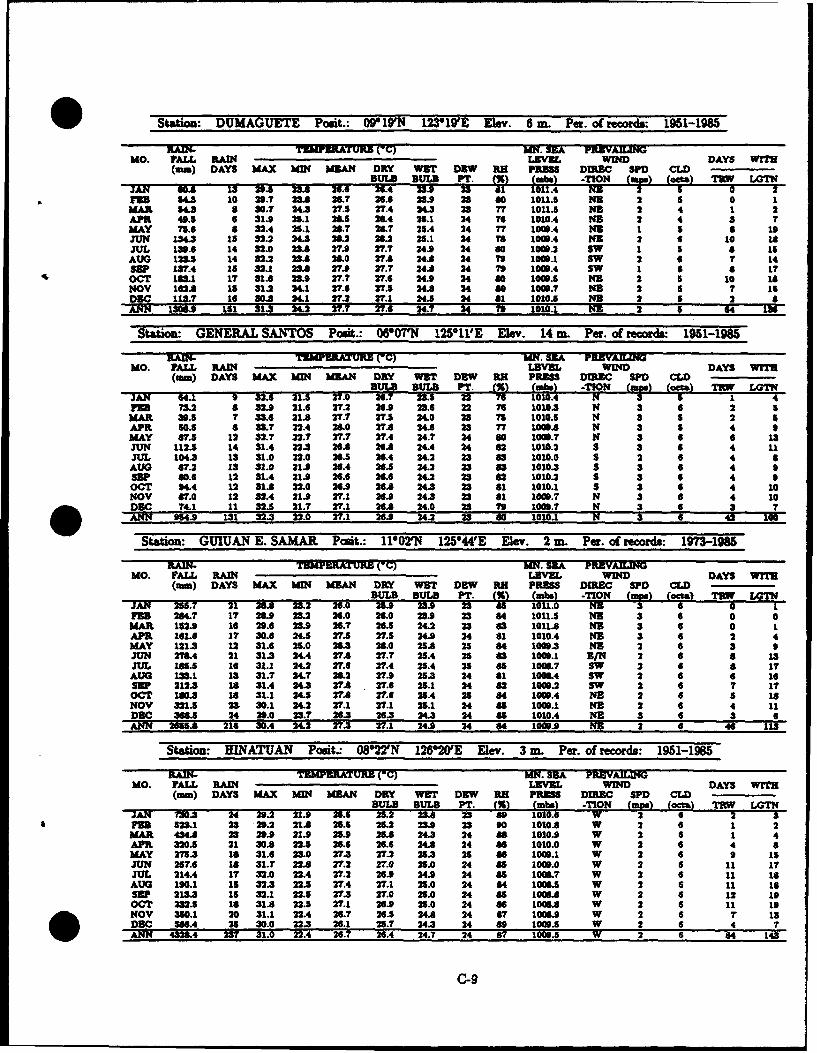
Station: DUMAGUETE Posit.: 09W 19'N 123"19E Ekev. 6 m. Pa. of records: 1951-1985
KA~~~lC TEFEAUE W N. IE OUVALNGMO. FALL RAW LV WDVD DAYS WITH
(ram) DAYS MAX MW MAN DRY WIT DBW RB PRES DIREC SF0 CLDBULB BULB PT. (%) ,bs ) -0e0) To 0 r2
"JAN 83. 13 29.5 23A 26.6 26.4 2.9 5 81 No. o =1m3 54 10 29.7 23.8 26.7 26.6 23.9 23 so 1011.5 NN 2 0 1
AR 54.3 8 30.7 24.3 27.5 27.4 24.3 23 77 1011.5 NE 2 4 1 2APR 49.5 6 31.9 25.1 26.5 32.4 25.1 24 76 1010.4 NN 2 4 3 7MAY 75.6 6 32.4 25.1 26.7 .7 25.4 24 77 1080.4 NE 1 5 6 19JUN 34.3 15 32.2 24.3 M2 22 25.1 24 78 100o.4 NE 2 10 9JUL 139.6 14 32.0 23. 27.9 27.7 24.9 24 s0 1080.2 sw 1 s s 1sAUG 12.5 14 32.2 3.8 2.0 2.8 24.8 24 79 100.1 sw 2 67 14UP *.4 15 32.1 23.8 27.9 27.7 24.A 24 79 1080.4 sw 1 6 17
OCT 18.1 1T 31.6 23.9 27.7 27.6 24.9 24 80 1080.5 NE 2 5 10 PANOV 162.8 131.2 3 2. 27.6 2t.5 24.8 24 so 1080.7 NE 2 5 7 16DEC 113.7 16 30.3 24.1 27.2 27.1 24.5 24 81 1010.5 NS 2 2ANN 1306. 151 31.3 24.2 27.7 27.6 24.7 24 To 1010.1 NZ 2 S 64 13
Station: GENERAL SANTOS Posit.: 06*07'N 125*11'E Elev. 14 m. Per. of record: 1951-1985
Auc- TZMPEHTURB (-C) MN. SA PBVAUIINGMO. FALL RAIN LVBL WIND DAYS WIT
(m,) DAYS MAX MW MEAN DRY WST D8W RB PRBSS DIRIC S0 CD,UB BL T % us TO (,,.e) (acts) TRW LTJAN "4.1 9 32.6 21.5 27.0 .7 23My 22 7 1 I 5 1 4
F 73.2 & 32.9 21.6 27.2 26.9 23.6 22 76 1010.3 N 3 6 2 5MAR 39.5 7 33.6 21.8 27.7 27.5 24.0 23 75 1010.5 N 3 S 2 5APR 50.5 6 3&.7 22.4 26.0 27.8 24.6 23 77 0l8o N 3 5 4 SMAY 87.5 12 32.7 22.7 27.7 27.4 24.7 24 s0 1080.7 N 3 6 6 13JUN 112.5 14 31.4 22.3 26.8 26A 24.4 24 82 1010.2 5 3 6 4 11JUL 104.3 13 31.0 22.0 26.5 26.4 24.2 23 S3 1010.90 S 2 6 4 a
AUG 67.2 13 31.0 21.9 26.4 26.5 24.1 23 83 1010.3 5 3 6 4 9SEP 60.6 12 31.4 21.9 26.6 26.6 24.2 23 62 1010.2 5 3 6 4 9OCT 94.4 12 31.8 22.0 26.9 26.8 24.3 23 61 1010.1 5 3 6 4 10NOV 87.0 12 32.4 21.9 27.1 26.9 24.3 23 81 1080.7 N 3 6 4 10DEC 74.1 11 32.5 21.7 27.1 26A 24.0 23 79 100.7 N 3 6 3 7ANN 954.9 131 32. 22.0 27.1 26.5 24.2 23 s0 1010.1 N 3 6 4 t
Station: GUIUAN E. SAMAR Poit.: 11*02'N 125"44E Elev. 2 m. Per. of records: 1973-1985
RAIN- TEMPERATURB (WC) MN. SEA PREVAIINGMO. FALL RAIW LEEL WIND DAYS WITH
(am) DAYS MAX MW MEAN DRY WET DEW RH PRESS DIREC SPD CLDJAN 215.7 21 26.8 23.2 26.0 2T.9ION IMF, ci M;
BULB BULB PT. L% LOW E -----FE 2684.7 17 2.5 23.2 26.0 26.0 23.9 23 64 1011.5 NE 3 6 0 0
MAR 1532.9 16 29.6 23.9 26.7 26.5 24.2 23 63 1011.8 NE 3 6 0 1APR 161.6 17 30.6 24.5 27.5 27.5 24.9 24 a1 1010.4 NE 3 6 2 4MAY 121.3 12 31.6 25.0 21L3 26.0 25A 25 64 1009.3 NE 2 6 3 9JUN 27&4 21 31.3 24.4 27.* 27.7 25.4 25 63 1009.1 S/N 2 6 6 13JUL LS.5 16 31.1 24.2 27.6 27.4 25.4 25 d8 1080.7 SW 2 6 6 17AUG 133.1 13 31.7 24.7 26.2 27.9 25.3 24 f1 1006.4 SW 2 6 6 16SIP 212.3 16 31.4 24.3 27* 27.6 25.1 24 82 1009.2 SW 2 6 7 17OCT 180.3 16 31.1 24.5 27. 27.6 25.4 25 84 1009.4 NZ 2 6 5 18NOV 321.5 2330.1 24.2 27.1 27.1 25.1 24 85 1009.1 NE 2 6 4 11DBC 366.5 24 29.0 23.7 26.3 26.3 24.3 24 65 1010.4 NE 3 6 3 6ANN 265.8 216 30.4 24.2 27.3 27.1 24.9 24 64 1000.9 NE 2 6 46 113
Station: HiNATUAN Posit.: 0822'N 12620'E Elev. 3 m. Per. of records: 1951-19W5
RAIN- TEMPERATUR (C) MN. BA P VAILIMO. FALL RAI LEVEL WIND DAYS WK
(am) DAYS MAX MIN MEAN DRY WET DEW RK PRESS DIRC SPD CLDBULB BULB PT. (%) Cabs) .9N 5 •( m.o (ct T2RW LGTN
JAN 730.3 24 29.2 21.9 25.6 25.2 WA. 23 8 M 400N -- 2I62-FEB 523.1 23 29.2 21L. 25.5 252 23.9 23 90 1010. w 6 1 2
MAR 434. 23 29.9 21.9 25.9 25.8 24.3 24 as 1010.9 W 2 6 1 4APR. 320.5 21 30.S 22.5 26.6 26.6 24.6 24 66 1010.0 W 2 6 4 tMAY 275.3 16 31.6 23.0 27.3 27.2 25.3 25 s6 1080.1 W 2 6 9 15JUN 257.6 16 31.7 22.8 27.2 27.0 25.0 24 86 1009.0 W 2 6 11 17JUL 214.4 17 32.0 22.4 27.2 26.9 24.9 24 65 1006.7 W 2 6 11 16AUG 190.1 15 3231 22.5 27.4 27.1 25.0 24 64 1006.5 W 2 6 11 16SEP 213.3 15 32.1 22.5 27.3 27.0 25.0 24 as 1006.8 W 2 6 12 19OCT 2323.5 18 31.8 22.5 27.1 26.9 25.0 24 66 1006.8 W 2 6 11 19NOV 360.1 20 31.1 22.4 26.7 26.5 24.8 24 87 1006.9 W 2 6 7 13DBC S66.4 25 30.0 22.3 26.1 25.7 24.3 24 89 1009.5 W 6 4 7"ANN 4326.4 237 31.0 22.4 26.7 26.4 24.7 24 87 1009.5 W 2 6 84 143
C-9
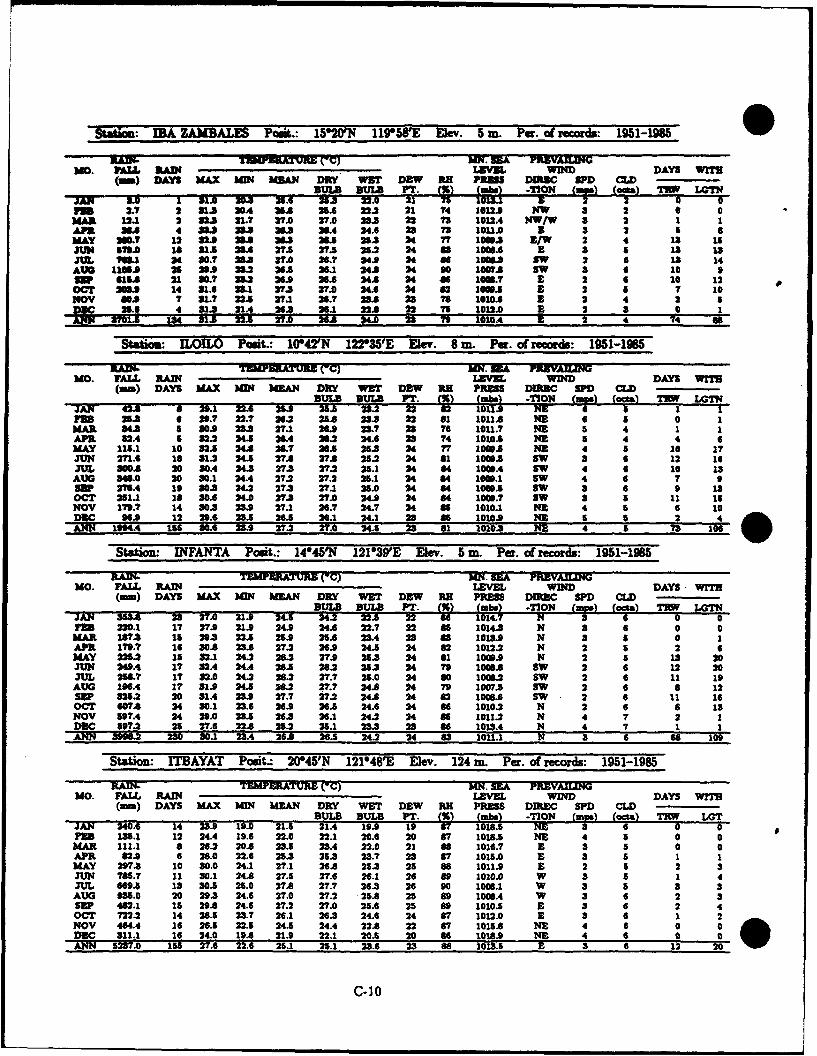
Station: M .A ZAMBALES Posit.: 1520'* N 11958 .E.ev. 5m Pa.- d records: 1951-IM,
Kmu . ItU (C) Am. 5EA PFRKVAD GMO. PALL RAIN LEME WIND DAYS WITH
(m) DAYS MAX AM MEAN DRY WET DEW RH PRES DRSC 1PD CLDBola aU," -B ULr34(I) -OTN .'_a_2;LOTN
JAN .6 1 20.5. 2 2.0 MV 321. 2 51.3 0A =A 256 22.2 21 74 1012.9 NW 3 2 0 a
MAR 12.1 2 2. 21.? 27.0 27.0 22 22 7 1012. NW/W 3 2 1 1APR 258 4 .32 .3 23.3 26. 246 23 73 1011.0 3 3 2 5 6MAY 30 12 22S 25. 2.3 2.5 25.3 4 77 1009.3 E/W 2 4 13 15JUN 549* 14 8 .5 22 27.5 27.5 25.2 24 a 1006.6 3 3 G 13 13JUL I6.1 24 80.7 25.3 27.0 26.7 24.8 24 as IS". SW 2 6 13 14AUG 1105.9 26 29.9 22 2.4 26.2 24.* 24 90 1007* sw 3 4 10 9SEP 615. 218 $0.72 326.9 2.6 24* 24 81 1003.7 3 2 6 10 12OCT . 14131.6 28.1 37.3 27.3 24.4 24 82 1003. 3 2 • 70 10NOV 808. 7 31.7 224 27.1 25.7 23A 23 75 1010.6 a 2 4 2 542.6 31.3 216 25.3 25.1 22.0 22 5 1012.0 2 2 3 0 1
3.1 . 22- 27. 26. 24.0 23 79 10104 5 2 4 74 0
Statics: ILOILO Posit.: 10042'N 122035'E Elev. 8 m. Per. of records: 1951-1085
RAIN- T]MFPRATURZ (-C) MN. SEA PFI]VAUsNGMO. PALL RAW LEVEL WIND DAYS WITH
(am) DAYS MAX M1W MEAN DRY WET DEW RH PRESS DIR3C WD CLDUlaw B3ULB mT CR) V20 Iae (cas 2W LOi
JAN 42A 8 29.1 22.6 4s.9 24.5 23.2 22 82 NE16 5 1 0FEP 20.3 6 2 4.7 22.7 252 25. 23.3 22 61 101,i NZ 6 50MAK" 34.2 5 3. 22.3 27.1 25.6 25.7 28 76 101.7 NE 5 4 1APR 52A a 22.2 245. 27.4 28.2 24.6 23 74 1010.5 NE 5 4 4 6MAY 115.1 10 32.5 24 26.7 28.5 25.3 24 77 1009. NE 4 & 10 17JUN 271*. 18 31.2 24.4 27* 27A 25.2 24 51 1003.5 SW 3 6 12 16JUL 00* 20 M0A 34.3 27.3 27.2 25.1 24 84 1006A SW 4 6 10 13AUG 348.0 20 80.1 24.4 27.2 27.2 25.1 24 64 1006.1 SW 4 4 7 gSEP 276 19 30.5 24.2 27.3 27.1 25.0 24 64 1009. SW 3 6 9 13OCT 251.1 18 80.6 24.0 27.3 27.0 24 24 864 1006.7 SW 3 & 11 isNOV 179.7 14 80.3 23* 27.1 26.7 24.7 24 85 1010.1 ND 4 5 6 10AN 9 21 1 8 .6 2 5.9 267. 2 7.0 24.5 23 86 1010.9 N E 4 a 2
D EC 96 12 22.6 23.5 26.5 25.1 24.1 23 85 1010. NE 4 a 73 ID
Station: INFANTA Posit.: 14*45'N 121439'E Elev. 5 m. Per. of records: 1951-1985
RAIN- TEMPERATURE (-C) MN. 5EA PRZVAJIINGMO. FALL RAIN LEVEL WIND DAYS WITH
(mm) DAYS MAX KdIN MEAN DRY WET DEW RH PRESS DIRC SPD CLD"JAN W4. 23 27.0 21.9 24.5 24.2 22.5 22 56 2 L0TN
MUL BU.. PT. WN ONbe aF cj ' MPrU 220.1 17 27. 21.9 24.9 24. 22.7 22 85 1014.3 N a 6 0 0
MAR 167.3 15 2.3 22.5 256. 25.6 23.4 22 83 1013.9 N 3 5 0 1APR 173.7 1680 0 23.6 27.2 26.9 24.5 24 82 1012.2 N 2 5 2 6MAY 225.2 15 32.1 24.2 28.2 27.9 26.3 246 1 1009. N 2 5 13 0JUN 249. 17 32A 24A 26.5 26.2 25.3 24 79 1008 SW 2 6 12 20JUL 256.7 17 32.0 24.2 26.2 27.7 25.0 24 s 1008.2 SW 2 6 11 19
AUG 196.4 17 32*9 24. 28.2 27.7 24.* 24 79 1007.5 SW 2 6 6 12SEP 325.2 20 31.4 23.9 27.7 27.2 24* 24 82 1008.6 SW 2 6 11 16OCT 607.8 24 80.1 23.6 26.* 26.3 24.6 24 so 1010.2 N 2 6 6 13NOV 467.4 24 22.0 22.5 26.3 26.1 24.2 24 as 1011.2 N 4 7 2 1DEC 517.2 2 5 27.6 22* 25.2 25.1 23.3 23 66 1013A N 4 7 1 1ANN M3al. 230 30.1 23.4 26.1 26. 24.2 24 83 1011.1 N 3 6 2 109
Station: ITBAYAT Posit.: 2045'N 12148E Eev. 124 m. Pea. of records: 1951-1985
RAIYM TEMPEATURE (-C) MM. SEA PREVAILINGMO. FALL RAIN LEVEL WIND DAYS WITH9
(mm) DAYS MAX M1W MEAN DRCY weT DEW RH PRESS DIREC 510 cLDBULB BULB PT. 'pr (ae) p20 (Mpe (2V n; LOT
JAN 240.6 14 23.9 173.0 21.5 21.4 19. 9 IF 101.5 Mr pl - T-PUB 135.1 12 24.4 19.6 22.0 22.1 20.6 20 87 1018.5 ND 4 5 o 0
MAR 111.1 8 26.2 20A 23.5 23.4 22.0 21 a 1016.7 E S 5 0 0APR 82.9 6 26.0 22.6 25.3 25.3 23.7 23 67 1015.0 E 3 5 1 1MAY 297.3 10830.0 24.1 27.1 26* 25.3 25 as 1011.9 E 2 s 2 3JUN 766.7 11 80.1 24*S 27.5 27.6 26.1 26 89 1010.0 W 3 5 1 4JUL 669-5 13 30.5 25.0 27.8 27.7 26.3 26 90 1006.1 W 3 5 3 3AUG 935.0 20 29.3 24.6 27.0 27.2 -25.8 25 89 1006.4 W 3 6 2 3SEP 462.1 15 29* 24.6 27.2 27.0 25.6 25 so 1010.5 3 3 6 2 4OCT 722.3 14 28.5 23.7 26.1 26.3 24.6 24 67 1012.0 E 3 6 1 2NOV 464.4 16 26.5 22.5 24.5 24.4 22*8 22 67 1015*8 NE 4 6 0DEC 11. 16 24.0 19A 21.9 22.1 20.5 20 66 1018.9 NE 4 6 0
AN 237. 155 27.6 22.6 25.1 25. 23.6 23 66 1013.5 3 3 6 12 2
C-10
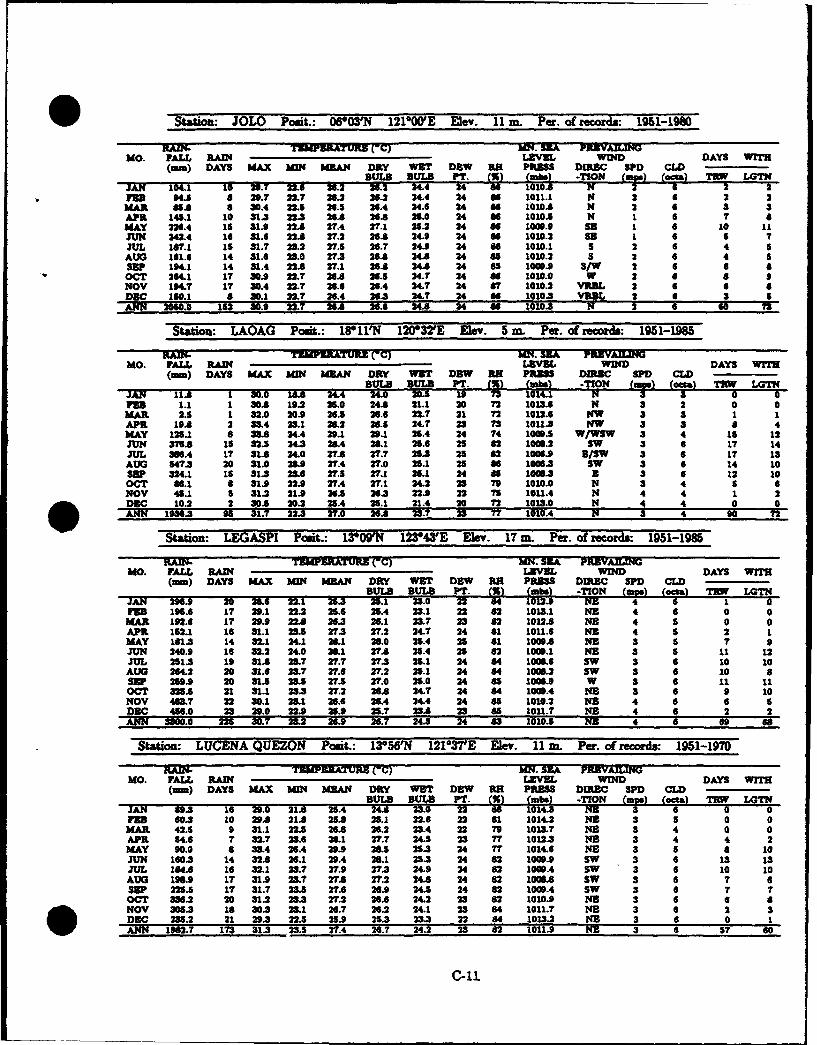
tai : JOLO Posit.: 0603'N 12100'E Elev. 11 m. Per. of records 1951-19W0
RAM TEMPERATURZ (IC) MN. SEA PFRVAIJLMO. FALL RAIN LEVEL WIND DAYS WrTH
(=m) DAYS MAX UN MEAN DRY WY DEW SH PRESS DIC SPD CLDBULB BULB PT. !; ~ h~ IN (q!p) (at) M LGTN
JAN 104.1 10 23.7 22.6 2.2 26.2 24.4 24nE 9N- 8 M.7 22.7 26.3 26.2 14.4 24 8 1011.1 N 2 6 2 2MAPR "A8 6 30.4 22.5 2.5 26.4 24.6 24 66 1010A8 N 2 6 3 3APR 146.1 10 31J 22.3 26.8 26.8 25.0 24 6 1010.5 N 1 6 T 6MAY 226.4 15 31.9 22.S 27.4 27.1 26.2 24 so 100.9 SE 1 6 10 11JUN 242.4 16 31.6 22.8 27.2 25.8 24.9 24 86 1010.2 SE 1 6 5 TJUL 187.1 15 31.7 22.2 27.3 26.7 24.9 24 86 1010.1 S 2 6 4 SAUG 161.6 14 31.6 23.0 27.3 26.8 24.8 24 8a 1010.2 S 2 6 4 5SEP 194.1 14 31.4 22.8 27.1 26.8 24.8 24 85 100.9 S/W 2 6 4 8
OCT 64.1 17 30.9 22.7 24.8 26.5 24.7 24 so 1010.0 W 2 6 8 9NOV 194.7 17 30.4 22.7 26.6 26.4 24.7 24 87 1010.2 VRIL 2 6 6 6DEC 110.1 8 30.1 22.7 26. 263 24.7 24 8o 10103 VerL 2 6 3 5ANN 2060.0 152 0.9 22.7 2648 26.6 248 24 6 1010. N 2 6 60 73
Staton: LAOAG Posit.: 18*11'N 12032'E Elev. 5 nt. Per. of records: 1951-1985
""RAJ- TEMPERATURE (-G) MN. S3A PF.EVAIMO. FALL RAW LEVE WIND DAYS WrT
(=m) DAYS MAX MN MEAN DRY WY DEW 33 PRESS DIREC SP CLDBULD BULB T. ( o) TION Pp) (T TEW LT
JAN 11.8 1 30.0 18.8 244 24.0 20.5 19 1 0 0FEE 1.1 1 30.8 19.2 25.0 24.8 21.1 20 72 1013.6 N 3 2 0 0
MAR 2.5 1 32.0 20.9 26.5 26.6 22.7 21 72 1012.6 NW 3 3 1 1APR 19.8 2 33.4 23.1 26L2 26.5 24.7 23 73 10U11 NW 3 3 & 4MAY 125.1 8 31.8 24.4 20.1 29.1 25.4 24 74 10093 W/Waw 3 4 15 12JUN 376.8 15 =32. 24.3 25.4 28.1 25.6 25 82 1008.2 SW 3 6 17 14JUL 366.4 17 31.8 24.0 27.8 27.7 25.3 25 82 1006.9 B/SW 3 6 17 13AUG 547.3 20 31.0 23.9 27.4 27.0 25.1 25 so 1006.2 SW 3 6 14 10SEP 324.1 15 313 23.6 27.5 27.1 26.1 24 8s 10063 B 3 6 12 10OCT 86.1 8 31.9 22.9 27.4 27.1 24.2 23 79 1010.0 N 3 4 5 4NOV 45.1 5 31.2 21.9 26.5 26.3 22.9 22 75 1011.4 N 4 4 1 2DEC 10.2 2 30.5 20.2 25.4 25.1 21.4 20 72 1013.0 N 4 4 0 0ANN 19M6.3 95 31.7 22.3 27.0 2.,8 23.7 23 77 1010.4 N 3 4 90 72
Station: LEGASPI Posit.: 13009'N 1243'E Eley. 17 n. Per. of records: 1951-1985
RAWN- TEMERATURE (-C) MN. SEA PRE9VAILINMO. FALL RA LEVEL WIND DAYS WITH
(mm) DAYS MAX MWN MAN DRY WYT DEW RH PRESS DIREC SPD CID
BULB BULB P'T. W5 (uNk. -TION (m3)(ct) LGTNJAN 296.9 20 29.6 22.1 H.3 25.1 23.0 22 8 029 NFEE 195.6 17 29.1 22.2 25.6 25.4 23.1 22 82 1013.1 NE 4 6 0 0AR 192.6 17 29.9 22.8 26.3 26.1 23.7 23 82 1012.8 NE 4 S 0 0
APR 152.1 16 31.1 23.5 27.3 27.2 24.7 24 81 1011.6 NE 4 5 2 1MAY 181.3 14 32.1 24.1 2iL. 28.0 25.4 25 81 1009.8 NE 3 5 7 9JUN 240.9 16 32.2 24.0 38.1 27.8 25.4 23 82 1009.1 NE 3 5 11 12JUL 251.3 19 31.8 23.7 27.7 27.3 25.1 24 84 10OL6 SW 3 6 10 10AUG 26C2 20 31.6 23.7 27.6 27.2 23.1 24 84 1008.2 Sw 3 6 10 SSEP 259.9 20 31.5 23.5 27.5 27.0 25.0 24 86 1008.9 w 3 6 11 11OCT 323.5 21 31.1 23.3 27.2 26.8 24.7 24 84 100s.4 NE 3 6 9 10NOV 4637 22 30.1 23.1 26.6 26.4 24.4 24 86 1010.2 NE 4 6 6 5DEC 456.0 23 29.0 22 25.9 25.7 23.8 23 86 1011.7 NE 4 6 2 2ANN 3300.0 2S 30.7 23.2 26.9 26.7 24.5 24 83 1010.3 NZ 4 6 69 a
Station. LUCENA QUEZON Posit.: 1356'N 121*37'E Elev. 11 ,,, Per. of records: 1951-1970
RAW- TE M -RATUM (-C) MW. SBA PRE9VA-MJMMO. PALL RA LEVEL WiND DAYS WT
(mm) DAYS MAX MEN MEAN DRY WY DEW RH PRESS DIR]C SPD CLDBULB BULB PT- ;5 (uk. M TbO (mip) (9act) n; LGTH;JAN 89.3 16 29.0 21A8 26.4 24A8 23.0 22 1
EE 60.3 10 29.8 21.8 25.8 23.1 22.6 22 61 1014.2 NE 3 5 0 0MAR 42.5 9 31.1 22.5 26.8 26.2 23.4 22 79 1013.7 NE 3 4 0 0APR 54.6 7 32.7 23.6 2.1 27.7 24.5 23 77 1012.3 NE 3 4 4 2MAY 90.0 6 33.4 26A 29.9 26-3 23.3 24 77 1014.6 NE 3 5 8 10JUN 160.3 14 32.8 26.1 29.4 28.1 25.3 24 82 1009.9 SW 3 6 13 13JUL 184.8 16 32.1 23.7 27.9 27.3 24.9 24 82 1009.4 SW 3 6 10 10AUG 196.9 1T 31.9 23.7 27.8 27.2 248 24 82 1009.8 SW 3 6 7 6SEP 225.5 17 31.7 23.5 27.6 26.9 24.5 24 82 1009.4 SW 3 6 7 7OCT 33*.2 20 31.2 23.3 27.2 26.6 24.2 23 82 1010.9 NES 3 6 6 8NOV 306.3 16 30.3 23.1 26.7 25.2 24.1 23 84 1011.7 NE 3 6 2 3DEC 235.2 21 29.3 22.3 25.9 25.3 23.3 22 84 1013.2 NE 3 6 0 1ANNM 162.7 173 31.3 23.5 27.4 26.7 24.2 23 62 1011.9 NE 3 6 S7 60
C-11
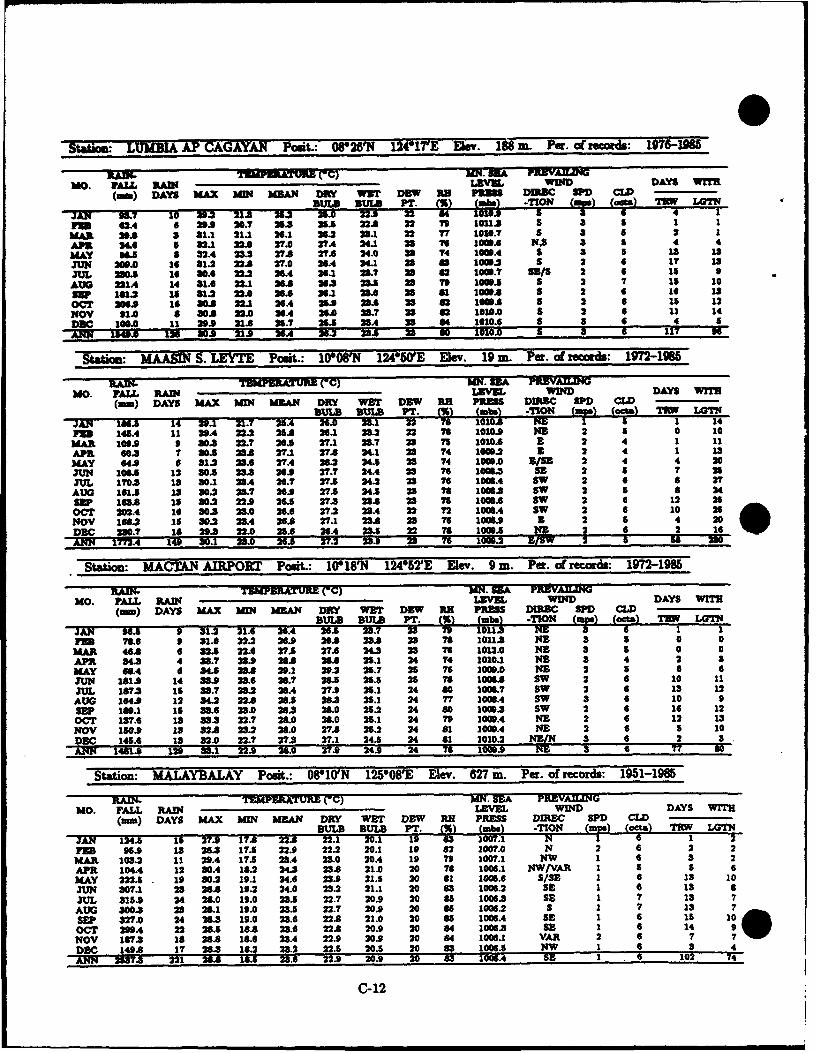
StWou: LUMBIA AP CAGAYA?4 Posit.: 08 26'N 124"17'E Eev. 188 m. Per. of 'cords,: 197-I3M8
RAU&- -ATUNM ("C) UN. SEA PR,., UMMO. FALL RAIN LEVEL WuID DAYS WfUR
(m) DAYS MAX DAM blAN DRY WWT DEW RE PUNM DEC WF0 CLIDBULB BULB T (IN ms TO ~) (~) 2
JAN 93.7 10 20.2 1 325 2..0 2215 I22 IF 5 * 64FOB 64 6 29.0 20.7 2.83 25.5 22A 22 79 1011. S 3 6 1 1
MAR 29* 3 31.1 21.1 26. 26.2 2.1 22 77 1010.7 S 3 a 2 1APR 24. 32.1 22.0 27.0 27.4 24.1 23 76 180.6 NS a 1 4 4MAY 9" S 32.4 23.2 27* 27A. 24.0 23 T4 IWA S 3 5 13 13JUN 200.0 16 31.2 22 27.0 26A 24.1 23 a 100w S 2 6 17 13JUL 230.5 16 30.6 22.2 26.4 26.1 2B.7 23 a2 1000.7 5m/S 2 6 Is 9AUG 221A 14 31.6 22.1 26. 263 23.5 23 To 100.5 S 2 7 Is 10SU 181.2 15 31.2 22.0 26.6 26.1 2. 23 $1 10.• S 2 6 16 1iOCT 206. 1i 0. 22.1 26.4 2.9 22* 23 a 100.6 S 2 6 15 12NOV 91.0 8 30* 22.0 26.4 26.0 23.7 23 a2 1010.0 S 2 6 11 14DEc 100* 11 20. 2136 25.7 25.5 .3A .3 64 1010.6 S 3 6 4 5
IN, 1545n 1 I M0. 21.9 29A 26.2 23.5 33 80 1010.0 a & 6 117 96
Station: A S. LEYTE Posit.: 10"08'1q 124"0'E Elev. 19 m. Per. of re rds: 1972-1985
.. TEMPR AT E (-C) MN. UM PRUVAHM40
MO. PA=L RAM MM DAYS WrTH(rm) DAYS MAX xcN MrAN DRY WIo DEW RK FRESs DDC SPD CLD
BUIA SULS Pr l)aba TIN (m. (TJa iii LATIJAM 136.1 14 2..1 21.7 25. 26.0 23.1 2 7E 1 14FM 143.4 11 29A 223. 26* 26.1 23.2 22 76 1010. NE 2 5 0 10MAR 109.9 0 303 22.7 26o 27.1 23.7 23 7S 1016 E0 2 4 1 11APR 60.3 7 20 23* 27.1 27*.8 24. 23 74 1002 3 2 4 1 13.MAY 6" 6 321. 231.6 27A 28.2 43" 23 74 1000.0 8/38 2 4 4 20J3UN 1O0. 12 0.5 23. 26. 27.7 24.4 23 76 1oo63 Sm 2 5 7 26JUL 170.3 1$ 0.1 23A 26.7 27.5 24.2 23 76 1006L4 SW 2 6 6 27
AUG 1610 13 30.2 23.7 26. 27.5 24.5 23 76 100.3 SW 2 a $ 24SW 163A 15 30.2 22.5 26 273 23*. 23 75 1800.6 Sw 2 6 12 2OCT 202A 16 20.3 23.0 26.6 27. 23. 22 72 108A Sw 2 6 10 2NOV 166.2 15 30.2 23A 26. 27.1 23*8 23 76 100o09 2 5 4 20DESC 230.7 1820.3 220 26.6 26A 23.5 22 76 10.5 NE 2 62 iANN 1_,72A 14 30.8 18. Sit. 37.42 • 359 23 7 193 . 1 1 SO WO
Station: MACW. AIRPORT Posit.: 1008'N 12452'E Elev. 9 m. Pa. of records: 1972-1985
lADS- TEMMERTURE rc) MN. SEA PREVAUJMIMO. FALL RA LEVEL WIND DAYS W
(m) DAYS MAX MOOE MEAN DRY WIT DEW RH PRESS DINE SF0 CIO
JAN 96.5 0 31.2 21.6 26.4 26.l 23L.7 P." 011 NTO 3 6FEB 7. 9 3.18 22.2 26.* 26.8 2* 23 76 1011.3 NE 3 5 0 0MAR 46* 632.S 22.3 27A. 27 24.3 23 To 1012.0 NE 3 5 0APRI 34.3 4 3.7 23.9 2* 26* 23.1 24 74 1010.1 NE 3 4 2 0MAY .4 0 34.5 23 2.1 2.2 25.7 25 76 100.0 NE 2 5JUN 162.0 14 33. 2.6 26.7 26. 2. 25 7 1006* Sw 2 6 10 11JU 167.3 15 33.7 23.2 46A 27. 25.1 24 so 1006.7 Sw 2 6 13 12AUG 164.9 12 34.2 22*8 2.5 26.3 25.1 24 77 1008.4 Sw 3 6 10 9SEP 160.1 16 33.6 23.0 26.3 26.0 5.2 24 so 100o.3 Sw 2 6 16 12OCT 137.6 13 33.3 22.7 26.0 26.0 25.1 24 79 1O`4A NE 2 6 12 13NOV 180.0 1332* 23.2 26.0 278 254. 24 81 IOWA NE 2 6 5 10DC 145. 13 32.0 227 27.3 27.1 24.5 24 61 1010.3 1W/ 3 6 2 3MM 1461.0 12 3o.1 22. .0 27.9 24.9 24 7s 1000.0 6 77 60
Station: MALAYBALAY Posit.: 0810'N 125008'E Elev. 627 m. Pa. of records: 1951-1985
RAIN- TEMPERATURE (-C) MN. SEA PREVA/ILIGMO. FALL RAIN LEVEL WIuD DAYS WITH
(mm) DAYS MAX MIN MEAN DRY WET DEW RH PRESS DIREC SPD CLDBULB BULDB PT;- WR %abs -TIO LGTN I
JAN 12s 15 27.9 17.68 22. 1 . 1 63 07.1 2.61 2FEB 08* 13 26-. 17.4 22. 22.2 20.1 19 82 1007.0 N 2 6 2 2MAR 103.2 11 29A 176 23.4 23.0 20.4 19 79 1007.1 NW 1 6 3 2APR 104.4 12 20.4 18.2 24 23* 21.0 20 76 1006.1 NW/VAR 1 56MAY 222.5. 10 30.2 10.1 24.6 23.9 21.5 20 $1 1005.6 S/SE 1 6 13 10JUN 207.1 2S 268 10.2 24.0 23.2 21.1 20 83 1006.2 SE 1 6 13 6JUL 31.9 24 26.0 10.0 23.5 22.7 20.9 20 as 1006.2 SE 1 7 13 7AUG 300.3 23 25.1 10.0 23.5 22.7 20.9 20 66 1006.2 S 1 7 13SEP 327.0 24 26.3 19.0 23.6 22A 21.0 20 6s 1006.4 SE 1 6 1s 10 1OCT 299A 22 26.5 18* 23.6 22* 20.9 20 84 1006.3 SE 1 6 14 9NOV 167.3 8 28.8 16.6 23.4 22.9 20.* 20 84 1006.1 VAR 2 6 7 7DEC 1480* 1? 2.3 18.2 23.2 22.1 20.5 20 83 1006.5 NW 1 6 3 4ANN3 2673 221 26* 16._ 23.6 22.9 20.9 20 63 1006.4 SE 2 6 102 74
C-12
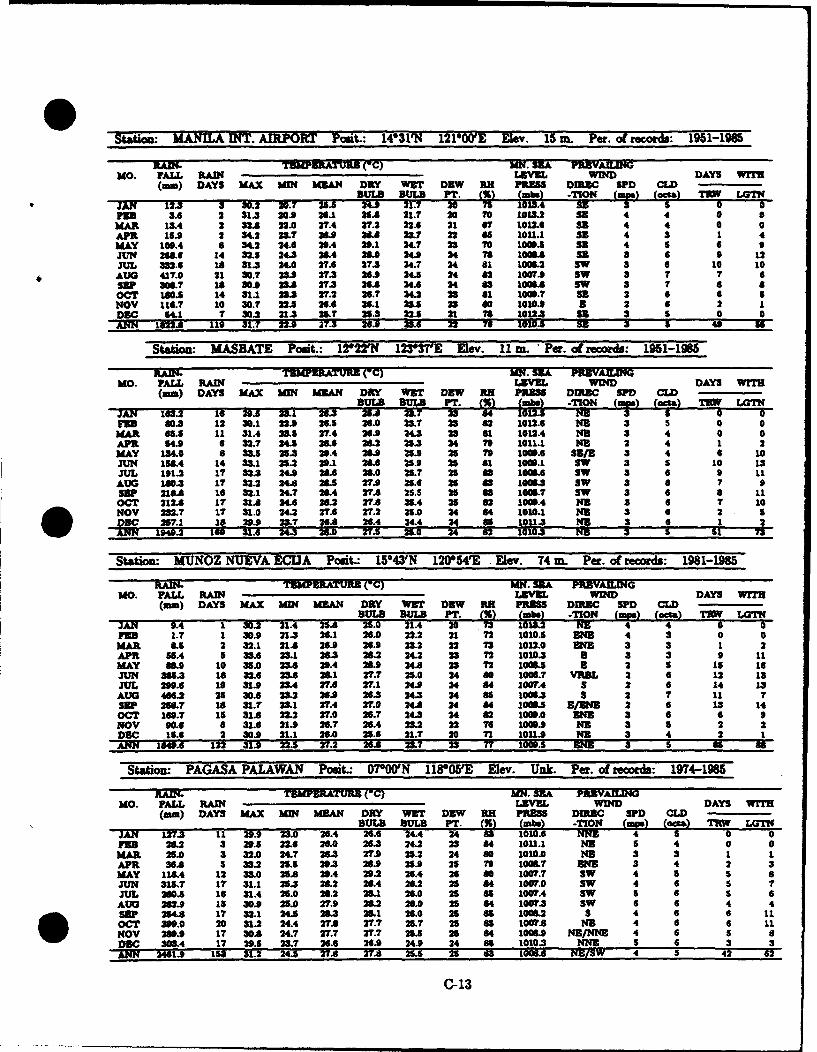
Station: MANILA INT. A/RPORl Pont.: 14"31VN 121000'E Elev. 15 E. Per. of records: 1951-1985
RAD& TEW EATURS ('C) MN. SEA PARVAZAL GMO. FALL RAW Lim= WIND DAYS WITH
(rm) DAYS MAX MIW MbAN DRLY WT DEW RH PR. DM SPD CLDR5ULE RUOLE PT. IV) (Mba 4 EIO L ) (ocja TR; LG"ItE
JAN 12.3 3 30.2 20.7 25A5 4.9 21.7 2010.4 a5S133 3.6 2 31. 20* 26.1 21A 21.7 20 70 1011. SE 4 4 0 0MA 13.4 2 3.8 22.0 27.4 27.2 22.6 21 67 1012.6 sE 4 4 0 0APR 15.9 2 S4.2 23.? 2. 2. 23.7 22 45 1ou.1 SE 4 3 1 4MAY 100.4 4 34.2 24.6 20.4 20.1 24.7 23 To 1006.5 ss 4 6 gJUN 268.6 14 32.5 24.3 26.4 2". 24 4 76 1oo0. Si 6 9 12JUL 332.6 16 31. 24.0 27.6 27.3 24.7 24 $1 1006.2 sw S 6 10 10
AUG 417.0 21 30.7 23.9 275 26.9 4s 24 62 1007'. sw 33 7 7SEP 306L7 18 30.9 23.8 27.3 26A 24.6 24 83 1006.8 SW 3 7 6OCT 180.5 14 31.1 2.3 27.2 26.7 4.2 23 41 1006.7 s 6 6 5NOV 116.7 10 30.7 22.3 26.6 26.1 23.5 23 60 1610*$ B 2 62 1DEC 4.1 7 30.2 21.3 25.7 25.3 22.5 21 78 10o. s S 5 0 0AMN 122. 119 31.7 22.9 27.3 269 13.A 22 76 1010.8 5E 3 5 49
Station: MASBATE Posit.: 121221N 123W370E Elev. 11 m. Per. of records: 1951-1965
RAIN- TEMPEATURE (-C) MN. SBA PJEAI.LMO. FALL RAIN LEVEL WIDm DAYS WITH
(am) DAYS MAX M MEA/N DRY WRT DEW RH PRESS DIREC SPD CWDBULM OMK PT. () (b) TIN (s ( ocss T W LTt
JAN 16342 to H.5 23.1 26. 25.8 237 23 8 02S Nfm 80.3 12 30.1 229 26.5 26.0 W 23 82 1012.6 Ns 3 s 0 0
MAR 63.5 11 31.4 2&3 27.4 26.9 4. 23 41 1012.4 NS S 4 0 0APR 14.* 6 32.7 24.5 2.6 2.2 25. 14 70 1011.1 NE 2 4 1 2MAY 134. 8 3335 25.3 20.4 26 25.9 25 79 1006.6 32/2 3 4 6 10
N 15.4 14 33.1 25.2 20.1 26.6 25. 26 &1 1006.1 sw 3 5 10 13JUL 191.2 17 32.3 24 2.6 2.0 25.7 25 83 10.6 SW S 6 3 11AUG 180.3 17 32.2 14. 26.5 27.* 25.6 as 83 1006.3 SW 3 697SEp 216A. 16 32.1 24.7 26.4 27.6 25.5 25 s 1o0.7 SW 3 6 6 1OCT 212* 17 31A 4.6 26.2 27A 25.4 25 82 100.4 NS 6 47 l1N OV2 .? 17 31.0 24.2 27.6 27.2 25.0 24 84 1010.1 NN S 6 2 5
257.1 I8 20.9 23.7 26.8 26.4 24.4 24 6 101. E 3 6 1 2S1 . 169 31.6 24.3 26.0 27.5 15.0 24 62 10103 NZ 3 £ 51 73
Station: MUNOZ NUEVA ECUA Pasit.: 15043"N 12054'E Elev. 74 u. Per. of records: 1981-1986
RAH%. T MERATURE (-C) UN. SEA PRnEVALNGMO. FALL RAIN LEVEL WIND DAYS WITH
(mm) DAYS MAX M]I ]MAN DRY Wn DEW R3 PRESS DIREC SPD CWD
JAN 9.4 1 30.2 21.4 25 50 2. IF 73 1013. ,,, 4 4 0 0FEB 1.7 1 30.9 21.3 2.1 26.0 22.2 21 72 1010.5 EN 4 3 0 0MAR 6. 2 32.1 21.8 269 26.9 23.2 22 73 1012.0 am 3 3 1 2APR 55.4 5 33.6 23.1 26.3 26.2 24.2 23 72 1010.3 a 3 3 9 11MAY 8. 10 35.0 2.8 29.4 2*9 24.8 23 72 1006.5 a 2 S 15 16JUN 386.3 18 32.6 23.6 28.1 27.7 25.0 24 80 1006.7 VRBL 2 6 12 13JUL 299.6 19 31.9 23.4 27*. 27.1 24.9 24 84 1007.4 3 2 6 14 13AUG 466.2 25 30.6 232 26.9 26.3 24.3 24 86 1006.3 5 2 7 11 7SEP 25L7 18 31.7 2&.1 27.4 27.0 24A 34 84 100o.s 5/DIE 2 6 13 14OCT 169.7 15 31A 22.2 27.0 26.7 24.3 34 82 1006.0o 6 6 9NOV 90.6 6 31.6 21.9 26.7 26.4 232 22 7T 100.9 NE 3 5 2 2DEC 16.6 2 30.9 21.1 26.0 25.6 21.7 20 71 1011.9 NZ 3 4 2 1ANN 1849.6 122 31.9 22. 27.2 26* 3.7 77 1000.5 ES 3 5 a S9
Stadiow PAGASA PALAWAN Posit.- 0700ON 11805'E EleFv. Unk. Per. of records: 1974-19865
RAI- TEMPERATURe (-C) MN. SZA REvALINGMO. FALL RAIN LamV WIND DAYS WITH
(m) DAYS MAX MW MEAN DRY WET DEW RE PRRSS DIREC SPD CLDBULB IULB PT. 3 ma TO (u) (cs R LGTN
JAN 127.3 11 5.9 23.0 26. 25.6 24.4 24 83 11. IE 4 50 0m 2L2 3 20.5 22.6 2.0 26.3 24J 23 84 1011.1 NE , 4 0 aMAR 25.0 3 32.0 24.7 26.3 27. 35.2 24 6o 1010.0 NE 3 3 1 1APR 36.8 5 33.2 25.5 20.3 28.* 25.9 25 79 1006.7 ENm 3 4 2 3MY 1184 12 33.0 25. 2.4 20.2 26.4 2, 8o 10.7 sw 4 a 6JUN 315.7 17 1.1 25.3 2.2 26.4 2.2 2 84 1007.0 sw 6 7UL 200.5 16 31.4 2.0 20.2 26.1 25.0 25 as 1007.4 sw 5 6 5 6
AUG 262* 1S 30.9 25.0 27.* 26.2 25.0 25 84 1007.3 SW6 6 4 4SP 25.8 17 32.1 24 2•. 2. 26.0 25 8 lo02 s 4 6 6 11OCT 369.0 20 31.2 24.4 27.8 27.7 25.7 23 86 1007.8 NE 4 6 6 11NOV 28.9 17 30o 24.7 27.7 27.7 25.5 25 84 1o006 NE/,N 4 6 5 &DEC 303.4 17 29.5 23.7 26.6 26.9 24.9 24 6s 1010.3 NNE S 6 3 3SH613 1 31.2 24.3 27. 27. 2..5 2s ss 10 NZIW 4 5 4
C-13
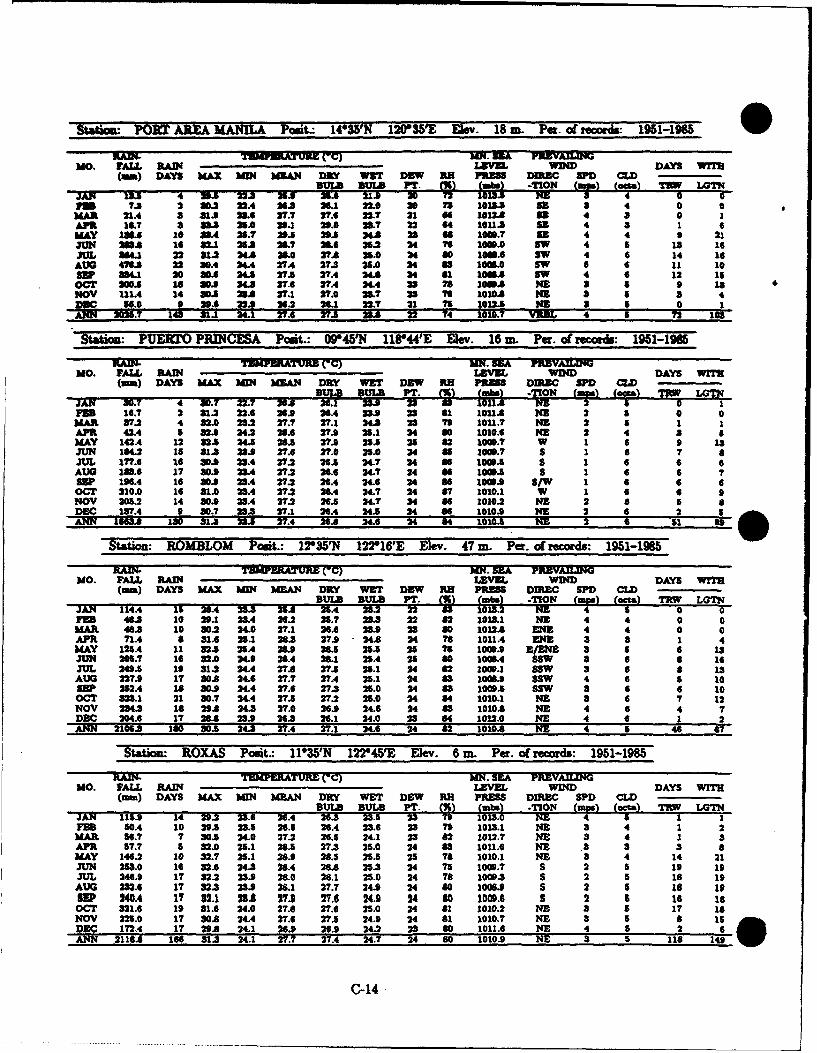
Sta"om- PORT ARXA MANqILA Pcoit- 14036N 12003'E Ekev. 18 m. Per. o records: 1951-1985 0MAUI UA V E G MR. Eam PEVAIUMI
MO. FALL RAW LEVEL WIND DAYS Wrlz(am) DAYS MAX MW. MEAN DRY VW2 DEW AN PRE1S DIR4C MPP CX
JTAN 13.3 4 =J. 223a a," 25. 23m 7.3 220 . 22. 26.3 26.1 22.0 20 73 1018.3 a3 3 4 0 0
MAR 21A4 3 319 2.6 27.7 27.6 22.7 21 6 10123 MR 4 3 a IAPR 13.7 3 333 25.0 20.1 29.0 2.7 22 64 IOU1 , 4 3 1I 0MAY 10. 10 24 25.7 23. 29.5 24. 23 a8 1000.7 11 4 4 9 21JNm UA 14 32.1 25.3 26.7 24.4 25.2 24 76 1000.0 SW 4 13 16JVL 9 22 51.2 4.8 2A6.0 273. 2.0 24 8s 1000.6 SW 4 6 14 16A08 4763 22 30A 24.4 274 27.2 25.0 24 43 1000. sw 6 6 it 10SE 354.1 20 20.6 24. 27.5 27A4 24A8 24 61 10008 SW 4 6 12 i5OCT 200.6 i 3320 23- 27.6 27A 243 78 vs 0io.8 NE 3 5 13NO0V 111.4 14 20.5 2". 27.1 27.0 23.7 23 76 1010.8 Ni 3 s 4
D9 4. 20.4 a29_ 26.2 26.1 22.7 21 75 1023. NIZ 3 5 0 1ANN 5.7 1443 31 24.1 27.6 273 2,.8 22 74 i010.7 ViaL 4 s 7 102
Statio: PUERTO PRINCESA Pasit.: 09"45N 118"44'E EIev. 16 m Per. of records: 1951-1986KRAIN T'MPERATURE (-C) MN. SEA PMRVAIn
MO. FALL RAIN LEVEL WIND DAYS WETS(mm) DAYS MAX MW MEAN DRY W2T D.W RE PRESS DIREC SWD CLDDUILl RULEB T (1 tona) -T N (mp.) TIm. 7 e T
JAN 30.7 4 30.7 22.7 264 26.1 23 2" 1 1
I= 16.7 2 21.2 22.6 26.9 26.4 239 23 61 1011. NE 2 5 0 0MAR 37.2 4 32.0 2.2 27.7 27.1 24.3 2 7T9 1011.7 Ni 2 5 1 1APR 42.4 5 22 .43 26.6 27.9 23.1 34 80 1010.6 NE 2 4 S 6MAY 142A 12 32.5 24.5 28.5 27.9 25.5 23 82 1000.7 W 1 6 • 13JUN 184.2 15 31.3 23. 27.6 27.0 25.0 24 so 100..7 S 1 6 7 aJUL 177.6 I 30.9 22.4 27.2 26.5 24.7 24 86 1003. S 1 6 6 6AUG 182.6 17 20.9 2.4 27.2 26.6 24.7 24 86 1009.5 S 1 6 6 7SaP 16.4 16 20.9 23.4 27.2 26A 24.6 24 66 100.3 S/W 1 6 6 6OCT 210.0 16 31.0 28.4 27.2 26.4 24.7 24 87 1010.1 W 1 6 6 3NOV 205.2 14 20.9 22.4 27.2 26.5 24.7 34 so 1010.2 NZ 2 • 5DEC 137.4 9 20.7 2383 27.1 26A 24.5 24 86 1010.9 NE 2 6 2ANN 166.8 130 31.3 2.5 27.4 26.0 24.6 24 84 10104 NE 2 6 51
Station: RB MBLOM Poit.: 1035'N 122°16'E Elev. 47 m. Pa. of records: 1951-1985
RAMn. TMIPMETK (0C) MW. SEA PREVAILMGMO. PALL RAM ZLVL wIND DAYS WITH
(mm) DAYS MA" MWN MEAN DRY WET DEW RB PRESS DIR= SPD CWEULE SULZ P. m2) rnk) -IO m.) (c. TRW LOTS
JAN 114.4 15 26.4 2373 3.8 S923 23.2 22 83 1013.2 NE 4 0 0PU 463 10 23.1 22.4 26.2 25.7 23.3 22 82 1013.1 Ni 4 4 0 0MAR 463 10 20.2 34.0 27.1 26.6 23.9 28 80 1012.2 ENE 4 4 0 0APR 71.4 8 31.0 23.1 26.8 27.9 24.8 24 78 1011.4 iNE 3 a 1 4MAY 125.4 11 32.5 25A 28.9 26.5 25.5 26 78 1003.9 Zi/Nr 3 5 6 13JUN 205.7 16 32.0 240 284 26.1 25.4 26 80 10.SA SSW 3 6 8 16JUL 249.5 10 31.2 24.4 27.8 27.5 26.1 24 82 1003.1 SSW 3 6 8 13AUG 227.9 17 204 24.6 27.7 27.4 25.1 24 83 1003L SSW 4 6 5 10SEP 22.4 18 30.9 24.4 27.6 27.3 25.0 24 83 1003* SSW 3 6 6 10OCT 223.1 21 20.7 24.4 27.5 27.2 23.0 24 84 1010.1 NE 3 6 7 12NOV 234.3 182 2. 24.3 27.0 26.9 24.6 24 83 1010.* Ni 4 6 4 7DBC 204.6 17 28.8 23.9 26.3 26.1 24.0 28 84 1012.0 NE 4 6 1 2ANN 210.3 120 0.5 243 27.4 27.1 34.6 24 82 1010.6 NE 4 & 46 V7
Station: ROXAS Posit- 1135'N 122645'E Elev. 6 m. Per. of records: 1951-1985
Rm TEMPERATURE (C) MN. SEA PREVAILINGMO. FALL RAIN LEVEL WIND DAYS WIT
(mm) DAYS MAX MIN MXAN DRY WET DEW 31 PRESS DIRC SPD CLBUEZ E E( (BbUL -.N (aPI) (Vct) TRW LO
JAN 1s.9 14 29.2 26 26.4 263 2.5 2 7 1o. " 4 5 1 1PU SO.4 10 20.5 22.5 26.5 26.4 25.6 23 70 1023.1 NE 3 4 1 2
MAR 56.7 7 30.5 24.0 27.2 26.6 24.1 23 82 1012.7 NX 3 4 1 3APR. 57.7 5 32.0 23.1 28.5 27.3 25.0 24 as 1011.6 NE .3 3 3 8MAY 146.2 10 32.7 23.1 28.0 28.3 25.5 25 78 1010.1 NE 3 4 14 21JN 253.0 16 32.6 24.3 28.4 28. 25.3 24 75 1009.7 S 2 5 19 1:JUL 246.0 17 32.2 23.9 26.0 26.1 25.0 24 78 1009.3 S 2 5 1s 19AUG 232.6 17 23 23.9 26.1 27.7 24.9 24 80 1003s S 2 G 18 19SOP 240.4 IT 2.1 "A5 2739 27.6 24.9 24 80 1000.6 S 2 5 16 IsOCT 321.6 19 31.6 24.0 27.8 27.6 25.0 24 81 1010.2 NE 3 5 17 18NOV 225.0 17 30A 24.4 27.6 27.3 24.9 24 81 1010.7 NE 3 5 8 1sDEC 172.4 17 2.8 24.1 26.9 26.9 24.2 28 80 1011.6 NE 4 5 2 1ANN 2114.8 166 313 24.1 27.7 27.4 24.7 24 80 1010.9 NE 3 5 118 149
C-14
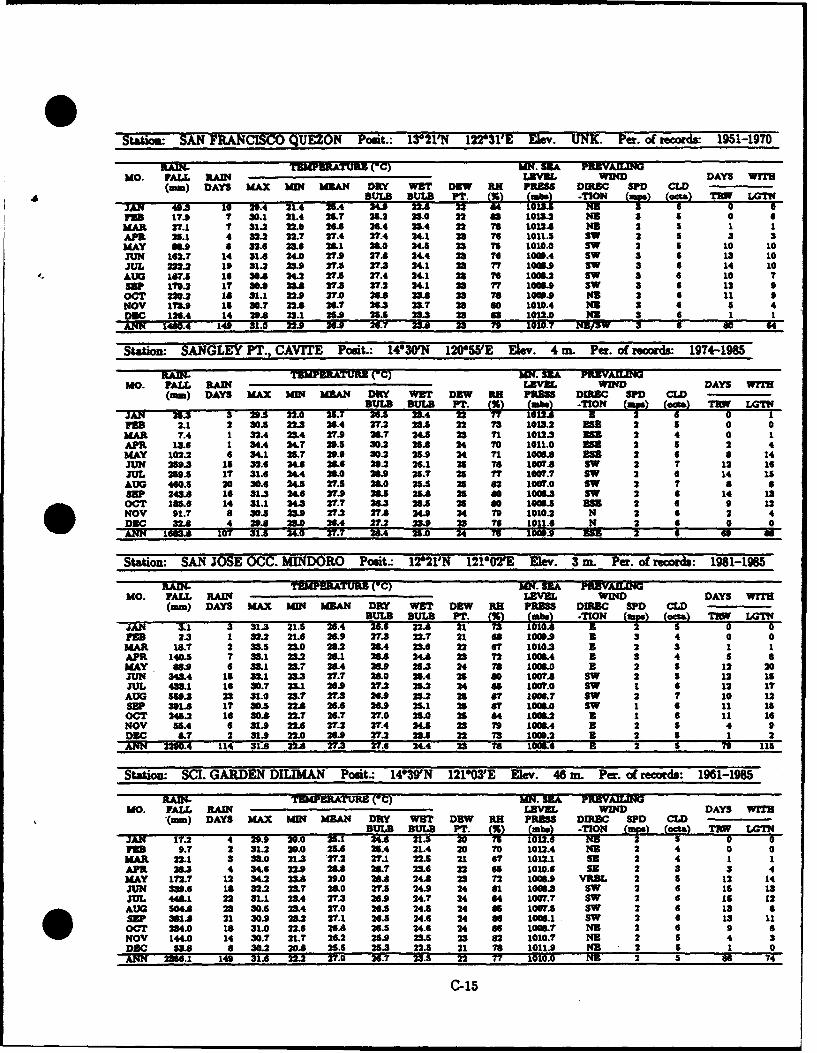
0Station: SAN FRANCISCO QUEZON Posit.: 10211N 12231'E Elev. UNK. Per. of record- 1951-1970
RAU#& TOUEMPEAT (OC) UN. SEA PREVAILINGMO. TAL RAW LEVL WoND DAYS WrrH
() DAYS MAX MW MAN DRY WET D8W RH PRBSS DIREC SPD CLD
"" JAN 43.3 10 29.4 21.4 25x4 BU.9 BUL- 1. (INS17. 7 30.1 21.4 25.T 2.2 23.0 22 83 101L2 NE 3 S 0 0
MAR 27.1 7 31.2 22.0 26.6 26.4 23.4 22 T7 1012* NE 2 S 1 1APR 25.1 4 32.2 22.7 27.4 27.4 2.LI 23 76 1011.5 SW 2 5 3 aMAY 69 4 32.6 23.6 2618 21L0 24.5 23 Ts 1010.0 SW 2 S 10 10JUN 162.7 14 31.8 24.0 27.9 27.6 24.4 23 76 1000.4 SW 3 6 13 10JUL 222.2 19 31.2 23 27.5 273 24.1 23 77 1006.3 SW 3 6 14 10AUG I47.9 16 30. 34.2 27.5 27.4 24.1 23 76 1008.2 SW 3 6 10 7SEP 179.2 17 30.9 23. 27.3 27.2 34.1 25 77 106.3. SW 3 6 12 9OCT 220.a 18 31.1 22.9 27.0 26.8 23. 23 78 106.9 NE 2 6 11 9NOV 171.9 15 30.7 22A 26.7 26.3 23.7 28 60 1010.4 Nis 3 6 5 4DEC 126.4 14 29.8 22.1 25.9 25. 23.3 23 as 1012.0 NB 3 6 1 1ANN 14d0.4 149 31.0 2 2 24.7 n 2 79 1010.7 N'ISw 3 9 so 64
Staton: SANGLEY PT., CAVITE Posit.: 141301N 12055'E Elev. 4 m. Per. of records: 1974-1985
RA - TEMER'ATURE (-C) MN. SKA PRWVAILnMO. PAUL RAW L•EL WND DAYS WITH
(m) DAYS MAX MW MEAN DRY WET DEW RH PR3M5 DIRC SPD CLDB'ULB BULB PT. CIA 2Fh. -TIO IV 33;. 2 L21"
JAN 25.3 3 29.5 22.0 25.7 26.5 23.4 1 - - U _ U1FE 2.1 2 30.5 22.3 26.4 27.2 23.5 22 73 1013.2 En 2 5 0 0
MAR 7.4 1 32.4 23.4 27.9 28.7 24.8 23 71 1012.3 I 2 4 0 1APR 13.6 1 34.4 24.T 29.5 30.2 25* 24 TO 1011.0 3 2 5 2 4MAY 102.2 6 34.1 25.7 29.9 30.2 25.9 24 71 1003* us 2 6 6 14JUN 219.3 15 32.6 24.6 28.6 29.2 26.1 25 71 1007.8 SW 2 7 12 isJUL 259.5 17 31.6 24.4 26.0 26.9 25.7 26 77 1007.7 SW 2 6 14 15AUG 460.5 20 30.6 24.5 273. 26.0 25.5 25 62 1007.0 SW 2 7 a 6SEP 243.8 16 31.3 24.6 27.9 26 236. 26 s0 1001.3 SW 2 6 14 13OCT 185.6 14 31.1 24.3 27.7 26.3 2 26 60 100s.5 E 2 6 9 12NOV 91.7 8 30.5 29 27.2 274 24.9 24 79 1010.2 N 2 6 2 4DOC 32.8 4 2.A 20 26.4 27.2 23. 23 76 1011.6 N 2 6 0 0ANN 1683A 107 31.5 24.0 27.7 23.4 23.0 S4 76 1009.9 2E 2 6 -s as
Station: SAN JOSE OCC. MINDORO Posit.: 1021'N 121*02'E EMev. 3 m. Per. of records: 1981-1985
RAIN- TEMPERATURE (-C) YN. SEA PRE9VAILINMO. FALL RAIN LEVEL WIND DAYS w
(mm) DAYS MAX MW MEAN DRY WET DEW RB PRESS DiREC SPD CLDJAN 3.1 3 1.3 21.5 26.4 26.6 22.8 PN
FE 23 1 32.2 21.6 26.9 27.3 22.7 21 so 1000.9 E 3 4 0 0MAR 16.7 2 33.5 23.0 28.2 28.4 23.6 22 67 1010.3 E 2 3 1 1APR 140.5 7 33.1 232 21.1 28.8 24. 23 72 1000.4 E 3 4 5 6MAY 6S.9 6 33.1 23.7 26.4 28.9 25.3 24 78 100.0 E 2 S 12 20JUN 343.4 15 32.1 23.3 27.7 26.0 26.4 25 80 1007 SW 2 5 12 15JUL 435.1 16 30.7 3.1 26.9 27.2 25.2 24 85 1007.0 SW 1 6 12 17AUG 559.3 23 31.0 23.7 27.3 26.9 25.2 29 8 1006.7 SW 2 7 10 12SEP 391.8 IT 30.5 22A 26.6 26.9 25.1 25 67 1006.0 SW 1 6 11 15OCT 245.2 16 30A 22.7 26.7 27.0 25.0 25 64 1000.2 3 1 6 it 16NOV u.4 6 31.9 22* 2'.2 27.4 45 23 79 1006.4 E 2 S 4 9DEC S.7 2 31.9 =20 26.9 27.2 23.5 22 73 100.2 3 2 S 1 2-ANN 2290.4 114 31.8 322.A 27.3 M7. 24.4 23 i6 1006. U 2 S 79 11a
Statiom- SCI. GARDEN DIIWMAN Posit.: 14039N 12103'E Elev. 46 n. Per. of records: 1961-1985
RAIN- T~ERPEaTun ( C) UN. SEA PREVAILINMO. FALL RAIN LEV1L WIND DAYS W
(mm) DAYS MAX MIN MBAN DRY WET DEW RB PRRSS DIROC SPD CLDBULB BULBO P. () 0.mb.) -TON PT_) Ioci) TRW LGTN0
JAN 17.2 4 29.9 20.0 25.1 34A 21.5 207r026 aFE 9.7 2 31.2 20.0 25.6 26.4 21.4 20 To 1012.4 NE 2 4 0 0MAR 22.1 3 33.0 21.3 27.2 27.1 22.5 21 67 1012.1 SE 2 4 1 1APR 26.3 4 34.6 22.9 28. 28.7 23.6 22 65 1010.6 SE 2 3 3 4MAY 172.7 12 34.2 23. 29.0 26A 24* 23 72 1006.9 VRBL 2 5 12 14JUN 339.6 16 32.2 23.7 28.0 27.5 24.9 24 61 1003.3 SW 2 6 is 13JUL 448.1 22 31.1 23.4 27.3 26.9 24.7 24 64 1007.7 SW 2 6 is 12AUG 504A 23 30.5 23.4 27.0 26.5 24.5 24 65 1007.5 SW 2 6 13 aSEP 31*.8 21 30.9 2&2 27.1 26.S 24.6 24 s6 1008.1 SW 2 6 13 11OCT 234.0 1 31.0 22.6 26A 26.5 24.6 24 s6 1006.1." 2 6 9 _
NOV 144.0 14 30.7 21.7 26.2 25.9 23.5 23 62 1010.7 NE 2 S 4 3DEC 33.8 S 30.2 20.8 25.5 25.3 22.S 21 76 1011.9 NE 2 5 1 0ANN 2356.1 149 31.6 2.2 27.0 26.7 23.5 22 77 1010.0 m 2 5 s6 74
C-15
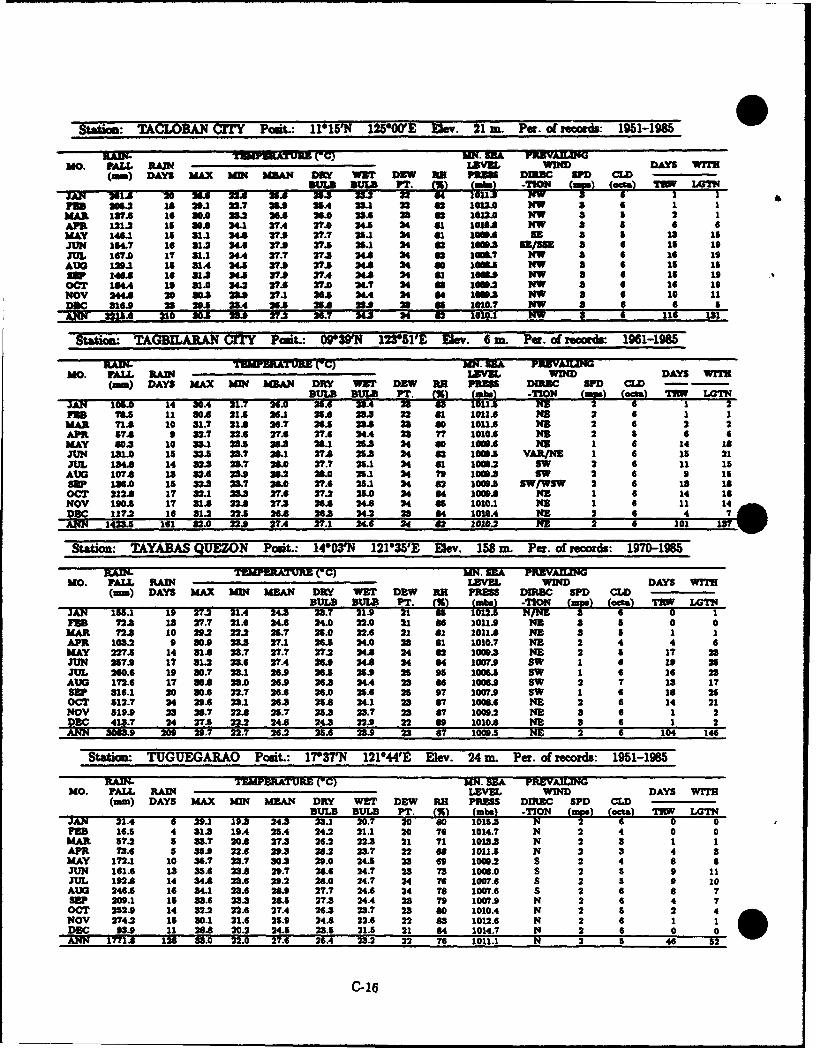
Statisn: TACLOBAW CMiY Posit.: 11"15N 125000'E Elev. 21 m. Per. of records: 1951-1965
RADn - TIP U TE M5) MR. SEA PrIVUAINGMO. PALU RAIN I WUND DAYS WITH
(m) DAYS MAX MI M1AN DKY WET D3W MR PRESS DIREC SPD, CLDDUL" IUWA PT. (3) (m3i -TCtap)o"s~
JAN 2]1. 20 6 A 2. 2 22" 36 2 =PUS 3063 18i .1 22.7 25* 25A 23.1 22 a 1612. NW 3 6 1 1MAR 187.6 16 20.0 28.2 36.5 26. 28.6 3 2 8 10322. NW 3 a 2 1APR 121.2 1 30A 24.1 27.4 27.0 24.5 24 at lei". NW a 5 4MAY 146.1 15 31.1 54* 27* 27.7 21.1 34 at 1000* 93 3 5 13 1sJUN 154.7 16 51.2 24.6 27.9 27.5 214 24 82 1603 53/13 3 6 is 13JUL I6TA 17 31.1 24.4 271. 27.3 24. 24 2 1600.7 NW a 6s 16 1AUG 129.1 15 21A 24.35 7 274 24 24 so 1006.5 Nw 3 s 1:Sw 1461* s U 161 3 "2. 27.0 27.4 24* 24 61 1600.9 NW 3 61: 19OCT 164. 19381.0234.2 27.6 27.0 24.7 34 a 1600. NW 3 16 isNOV 244* 2620.5 23* 27.1 6.5 24.4 24 64 1600.3 NW 2 6 10 11DDC 216.9 28 21.5 28.4 26* 21* 232 28 60 0180.7 NW 3 6 6 5ANNM 215.* 210 Sol5 28. 27.2 26.7 V".3 24 C2 1010.1 NW 3 T 116H 131
Statics TAGBILARAN CITY Posit.: 09"3N 123*51'E Elev. 6 m. Par. of reac&ds 1961-1985
RAIN- TEZRM ATUR (-C) Jd. SEA PlbVAJIWNMO. FAIL RAIN LEVEL WIND DAYS WITH
(ma) DAYS MAX M[N ULAN DRY WIT DEW 33 PRESS DO= SPD CLD -BULB BULB PT 3 .( TC aps (cci. x 1W 11.0Th
JANf 105.0 14 30.4 21.T 26.0 25.6 23.4 2 ~ 11* NPZB 76.5 11 30A 21.5 26.1 2A 23.3 22 82 10216 NE 2 6 1
MAR 71.8 10 31.7 21. 26.7 26.5 218 23 60 1011. NE 2 6 2 2APR 57. 9 32.7 22.6 27.6 27. 4.4 24A 7? 1010. NE 2 5 6 6MAY 80.3 10 33. 28.6 23 26.1 21.3 34 s0 1000* A NE 6 14 18JUN 131.0 15 32.5 28.7 28.1 27.* 21.3 24 C 1000.5 VARfNE 1 6 iS 21JUL 134 14 32.3 28.7 26.0 27.7 21.1 24 8 1000.2 SW 2 6 11 15AUG 107* 13 32*. 2•3 26 2.0 25.1 34 79 100.3 SW 2 6 I 1sSEP 136. 15 32.3 23.,7 26.0 27.6 21.1 24 C2 1009.3 SWjWSW 2 6193 18OCT 212A 17 324 283 27.6 27.2 25.0 24 64 1000* NE 1 6 14 18NOV 190.5 17 31* 22* 27.3 26.8 24.8 24 8 1010. 1 6 11 14 IDEC 117.2 16 31.2 22.5 26* 26.3 24.2 23 64 1010.4 NE 2 6 4WY 142 .5 161 32.0 22.9 2.4 27.1 24.6 N 82 20101 NE 2 6 101
Statio: TAYABAS QUEZON Posit.: 14"03'N 12103W'E Elev. 158 m. Pa. of records: 1970-1985
RAIN- TEMPERATURE CC) MIN. SEA PREVAILINGMO. PALL RAI LEVEL WIND DAYS WITH
(rm) DAYS MAX MIN MEAN DRY WY DEW RH PRESS DIREC SPD CLDBOULB 15ULB Im 3 ms) -IK (p,) (cci. n LGOTH
JAN 155.1 19 27.2 21.4 243 23.7 21. 1 6 01. IEno 72. 13 27.7 21.6 24. 24.0 22.0 21 96 1011.9 NE 3 1 0 0
MAR 72.3 10 23.2 22.2 26.7 25.0 22* 21 81 1011.8 N 3 5 1 1APR 103.2 9 SOS 23.3 27.1 26.5 24.0 28 81 1010.7 NE 2 4 4 6MAY 227. 14 31.8 23.7 27.7 27.2 24*t 24 82 1000.3 NE 2 5 17 28JUN 257.9 17 31.2 23.6 27.4 26. 24* 24 64 1007. SW 1 6 13 28JUL 260. 19 0.7 28.1 26*.9 26. 25. 21 95 10063 SW 1 6 16 28AUG 172.6 17 SO2 28.0 26.9 26.5 24.4 28 86 1006.9 SW 2 7 I3 17SUP 316.1 20 20.6 22.7 26. 26.0 25.6 21 97 1007.9 SW 1 6 18 21OCT 512.7 24 29.6 2.1 26.3 25* 24.1 22 67 100.6 NE 2 6 14 21NOV 51"* 28 26.7 22*8 25.7 25.3 23.7 23 87 1006.2 NED 3 6 1 2DEC 413.7 24 27. 22.2 24.8 24 22.9 22 89 1010.6 NE 3 6 2ANN 3063.9 203 29.7 22.7 26.2 25.* 23.9 22 87 1000.* NE 2 6 104 146
Statio: TUGUEGARAO Posit.: 17"37N 121"44'E Elev. 24 m. Per. of records: 1951-1985
RAIN. TEMPMATURE (1C) MN. SEA PREVAILINGMO. FALL RAIN LEVEL WIND DAYS WIT
(mm) DAYS MAX MEN MEAN DRY WET DEW RH PRESS DIRC SPD CLD
JAN 21.4 6 23.1 19.3 24.3 23. 20. 20N 80 105 N 2 6"" 16.5 4 31.3 19.4 26.4 24.2 21.1 20 76 1014.7 N 2 4 0 0MAUR 7.2 5 33.7 20* 27.3 26.2 22.3 21 71 10133 N 2 S 1 1APR 73.6 5 35* 22.6 29.3 28.2 23.7 22 O8 1011.5 N 2 3 4 3MAY 172.1 10 36.7 23.7 30.3 23.0 24.5 23 6a 1006.2 S 2 4 8 8JUN 161.6 13 35.6 2.* 23.7 26.6 24.7 23 73 1008.0 S 2 S 9 11JUL 192.8 14 34A 28.6 29.2 26.0 24.7 24 76 1007.6 S 2 5 9 10AUG 246.5 16 34.1 23.6 3S26 27.7 24.6 24 78 1007.6 S 2 6 8 7SEP 209.1 15 33.6 23.3 28.5 27.3 24.4 23 79 1007.9 N 2 6 4 7OCT 252.9 14 32.2 22.6 27.4 26.3 23.7 23 s0 1010.4 N 2 5 2 4NOV 274.2 15 30.1 21.6 25.9 24.* 22.6 22 83 1012.6 N 2 6 1 1DEC 33.9 11 286 20.2 24.5 23.5 21.5 21 84 1014.7 N 2 4 0 0ANN 1771* 126 33.0 22.0 27.6 26.4 23.2 22 76 1011.1 N 2 1 46 52
0-16
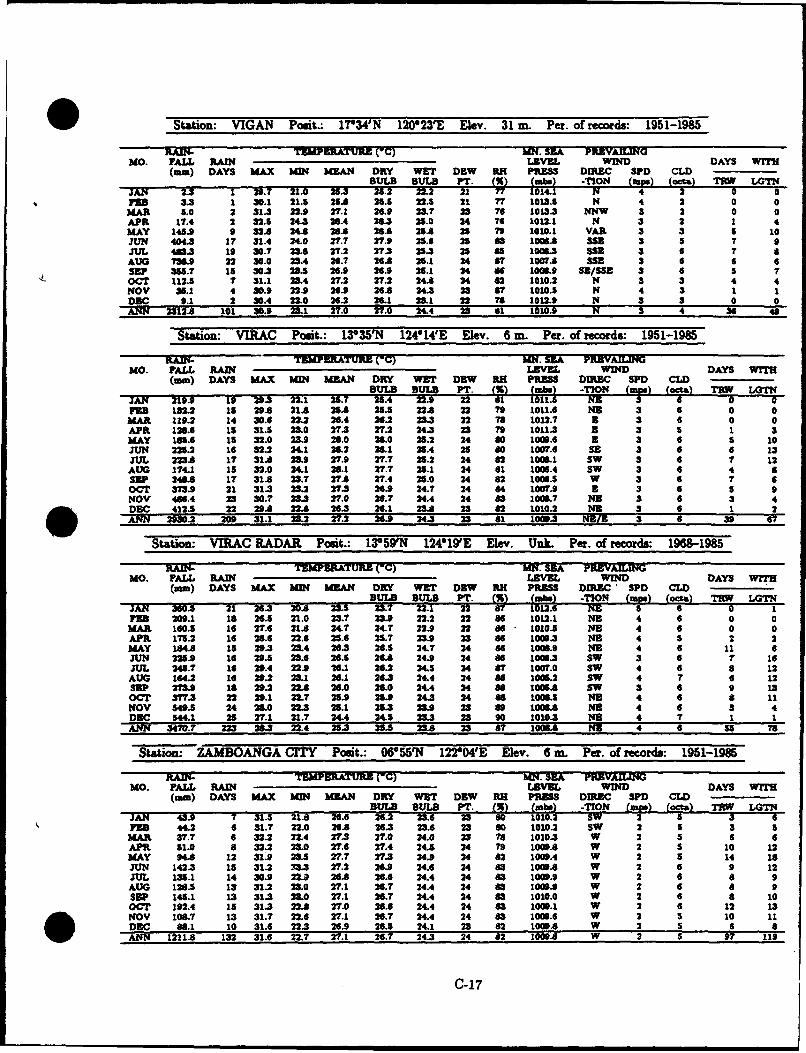
Station: VIGAN Posit- 17'34'N 12023'E Elev. 31 m. Per. of records: 1951-1985
RAIN- TEMERATURE (-C) MN. SEA PEUVAILINGMO. PALL RAIN LEVEL WIND DAYS WITH
(am) DAYS MAX bM MAN DRY WET DEW R. PRESS DU= SF0 CLD______r.BULB U P ._ (BULB) -ToT(,Wy,.)_ (2p) T LGTN
JA 23 1 29. . 213 1.2 22.2 21 77 1•.1 N 4 2 0 0FE 3.3 1 30.1 21.5 25A 25.1 22.5 21 77 1013.5 N 4 2 0 0
MAR 5.0 2 31. 22.9 27.1 25.9 23?7 23 76 1013.3 NNW 3 2 0 0APR 17.4 2 32.5 24.3 26.4 263 25.0 24 76 1012.1 N 3 2 1 4MAY 145.9 9 32. 24.8 26 26 25A 25 79 1010.1 VAR 3 3 5 10JUN 404.3 1 31.4 24.0 27.7 27.9 25.6 25 83 10=; SS 3 5 7 9JUL 483.3 19 30.7 23.* 27.2 27.3 25.3 25 85 1006.3 55E 3 6 7AUG 736.9 22 30.0 23.4 26.7 26A 25.1 24 87 1007.•8 5 3 6SEP 365.7 15 30.3 23.5 26.* 25.9 26.1 24 86 1006.9 SE/ISE 3 6 5 7OCT 112.3 7 31.1 23.4 27.2 27.3 24* 24 82 1010.2 N 3 3 4 4NOV 36.1 4 30.9 22.9 26.9 26* 24.3 23 87 1010.5 N 4 3 1 1DEC 9.1 2 30.4 22.0 26.2 26.1 23.1 22 7s 1012.9 N 3 3 0 0ANN 2312A 101 30.9 21 2".0 27.0 24.4 23 61 1010.9 N 3 4 m 49
Station: VIRAC Poit.: 13635'N 124°14'E Elev. 6 m. Per. of records: 1951-1985
RN- TEumPRATUUE (C) MN. SEA PREVAXLINGMO. PALL RAIN LE WIND DAYS WrTH
(mm) DAYS MAX 1SWN MEAN DRY WET DEW RH PRESS DI]RC SPD CLDBULB BULB PT. CRW Vma TIN ( ) (oct& TRW LOTN
JAN 2199 19 29.3 221 25.7 25.4 22. 0 N " aFEB 132.2 15 29* 21A 25A 25.5 224 22 79 1011.6 NE 3 6 0 0MAR 119.2 14 30.6 22.2 26.4 26.2 23.3 22 78 1012.? B 3 6 0 0APR 132.6 15 31.5 23.0 27.3 27.2 24.3 23 79 101113 E 3 5 1 3MAY 185.6 15 32.0 23.9 2.0 28.0 25.2 24 80 1006.6 E 3 6 5 10JUN 22.2 16 32.2 24.1 26.2 26.1 25.4 25 s0 1007.6 S3 3 6 6 13JUL =.8 17 31A 23.9 27.9 27.7 25.2 24 82 106.I SW 3 6 7 12
AUG 174.1 15 32.0 24.1 28.1 27.7 25.1 24 61 1006.4 SW 3 6 4 5SEP 246 17 31* 2.7 27*. 27.4 2S.0 24 82 1006.5 W 3 6 7 6OCT 373.9 21 31.3 23.2 27.3 26.9 24.7 24 64 1007.9 E 3 6 5 9NOV 4W6.4 23 30.7 233 27.0 2$.7 24.4 24 83 100.7 NE 3 6 3 4DEC 412. 22 29A 22A 2.3 25.1 23.6 23 82 1010.2 NE 3 6 1 2
AM 23.2 209 31.1 23.2 2.2 ro5* 24.3 23 6-1- 1000.3 ME 3 6 39 67
Station: VIRAC RADAR Poit.: 13*59N 124019E Elev. Unk. Per. of record&: 1968-1985
ER- TEMPERATURE (WC) MN. SEA PREVAILEMMO. PALL RAIN LEVEL WIND DAYS WITH
(mm) DAYS MAX KIN MEIAN DRY WIET DEW RH PRESS DIREC SPD CLDBULB BULB PT. LR mb) TIN ( qL .. TR 1 rLnVil :Ws(b. (,T,) c!% TW G7
JAN 360.5 21 25.3 20A 23. 23.7 22.1 22 8 o 16 N 1FEE 209.1 16 2.s 21.0 23.7 23.9 22.2 22 1012.1 NE 4 6 0 0MAR 160.5 16 27.6 21A 24.7 24.7 22.9 22 86 1010.5 NE 4 6 0 0APR 17.2 16 28.6 22.6 25. 25.7 23.9 23 86 1009.3 NE 4 s 2 2MAY 1IS" 15 29.3 23.4 25.3 25.5 24.7 24 66 1006.9 NE 4 6 11 6JUN 225.9 16 29.5 23.6 26.5 26. 24.9 24 86 1006.3 SW 3 6 1' 16JUL 245.7 16 29.4 22.9 26.1 25.2 24.5 24 87 1007.0 SW 4 6 8 12AUG 16-•2 16 29.2 23.1 25.1 26.3 24.4 24 86 1005.2 SW 4 T 6 12SEP 273.9 15 29.2 22* 25.0 25.0 24.4 24 86 I005* SW 3 6 9 13OCT 317.3 22 29.1 22.7 25.9 259 24.3 24 86 1006.5 q NE 4 6 8 11NOV 549.5 24 28.0 22.3 25.1 2S.3 23.9 23 89 t00*S NE 4 6 3 4DEC 544.1 25 27.1 21.7 24.4 24.5 23.3 23 90 1010.3 NE 4 7 1 IANN 3470.7 223 26.3 22.4 25.3 25.5 23.8 23 87 10084 NE 4 6 55 78
Staion: ZAMBOANGA CITY Poit.: 0 55IN 122004'E Elev. 6 m. Per. of records: 1951-1985
RA' M- TEMPEAMURE (-c) MN. SEA REvAMO. FALL RAIN LEVEL WIND DAYS WITH
(mm) DAYS MAX MW MEAN DRY WET DEW RH PRESS DIREC SPD CLDBULB BULB PT. (1) mb) -O W leap) c, ) TRW LGTN
JA.N 43 7 31.5 21A 25.6 25.2 23.6 23 0 10.. sw 2 3FEB 44.2 6 31.7 22.0 2.* 25.3 23.6 23 so 1010.2 Sw 2 5 3 5MAR 37.7 6 32.2 22.4 27.3 27.0 24.0 23 78 1010.3 w 2 5 6 6APR 51.0 8 32.2 23.0 27.6 27.4 24.5 24 79 1006. w 2 s 10 12MAY 94A 12 31.9 23.3 27.7 27.3 24.9 24 82 1009.4 W 2 5 14 1iJUN 142.3 15 31.2 3. 27.2 26.9 24.6 24 83 100.8 W 2 6 9 12JUL 135.1 14 30.9 22.9 26.8 26.6 24.4 24 83 1009.9 W 2 6 6 9AUG 126. 13 31.2 23.0 27.1 26.7 24.4 24 83 1006.* W 2 6 8 9Sap 145.1 13 31.3 23.0 27.1 26.7 24.4 24 83 1010.0 W 2 6 8 10OCT 192.4 15 31.3 22.8 27.0 25.6 24.4 24 83 1006.1 W 2 6 12 13NOV 106.7 13 31.7 22.6 27.1 25.7 24.4 24 83 1005.6 W 2 5 10 11DEC 86.1 10 31.6 22.3 26.9 26.5 24.1 23 82 1006.8 W 2 S 6 8ANN 1211.8 132 31.6 22.7 2T.1 26.7 24.3 24 82 1009.8 W 2 5 97 119
C-17

Appendix D
Percent Frequencies of Wave Heights(CNOC 1989)
This Appendix is made available to assist in operational planning. As defined on the legends on the upper-left portion of each figure, percent frequency of Ž3-foot (solid) and >8-foot (dashed) wave heights are shownfor each month. (The wave height used is the higher of sea or swell for observations containing both wavetrains.) The analyses were produced by the National Climatic Data Center using data from the period(1948-1987).
Wave observations are one of the least commonly obherved elements. In earlier years, many observerswere reluctant to take wave observations, due to the difficulty in estimating waves, especially in confusedseas.
The observations were subject to biases, generally with heights too low, periods too short and poor sea-swell discrimination. The observations were not adjusted for the suspected biases, but were subjected to aquality control procedure, where an internal check was made between wind speed and sea height (CNOC1989).
D-1
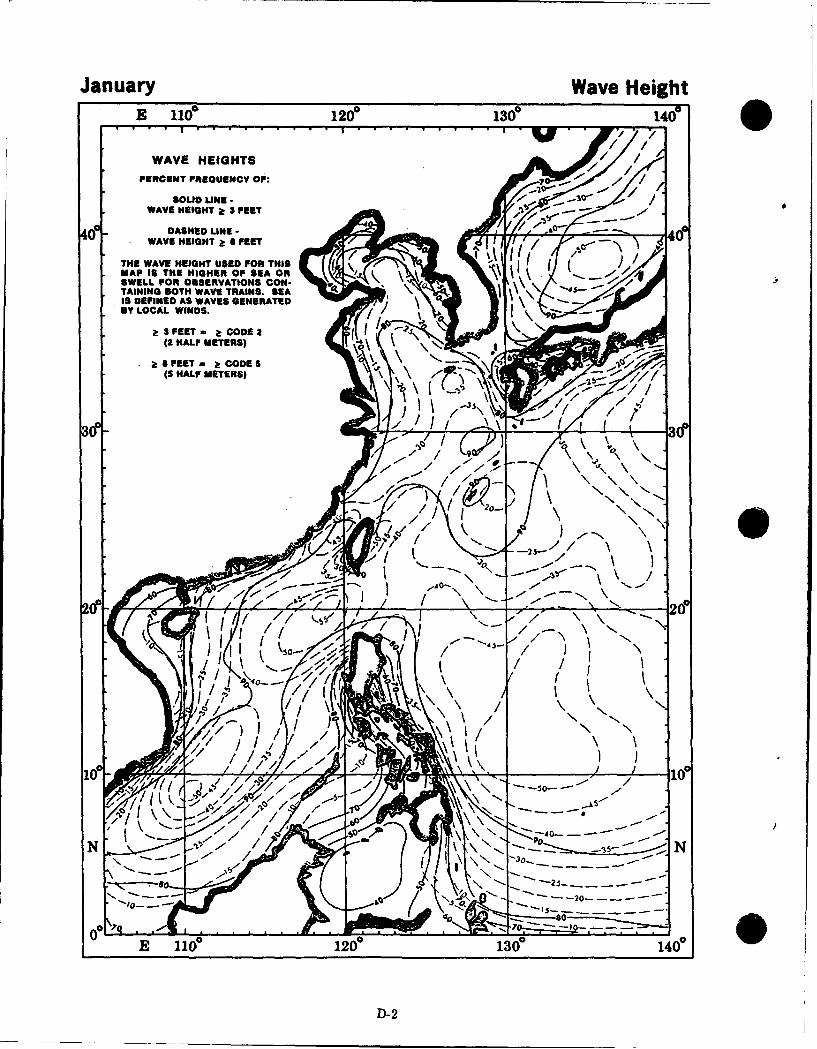
January Wave HeightE 1100 120" 1300 140e
WAVE HEIGHTS// /PERCENT PREGUENCY OF:
SOLID LINE -_0-.
WAVE HEIGHT k 3 FEET
DASHED LINE-WAVE HEIGHT a S FEET41
THE WAVE HEIGHT USED FOR THISMAP IS THE HIGHER OF SEA OR - 4SWELL FOR OBSERVATIONS CON- I /•TAINING BOTH WAVE TRAINS. SEA ' "1S DEFINED AS WAVES GENERATED "By LOCAL WINDS. /
(2 HALF METERS) J
D-33
•r - -3(-f", "• .i i•'.;/-?• 'I •. • +.I. IN,
• _• • •"/_•f .• +•_ i -- •. 0-,._..i,,-•
j'x•( A_5d ,"•"." .# -1• • \'"--0---" .,
S 110°120° 10° 240
I)-2
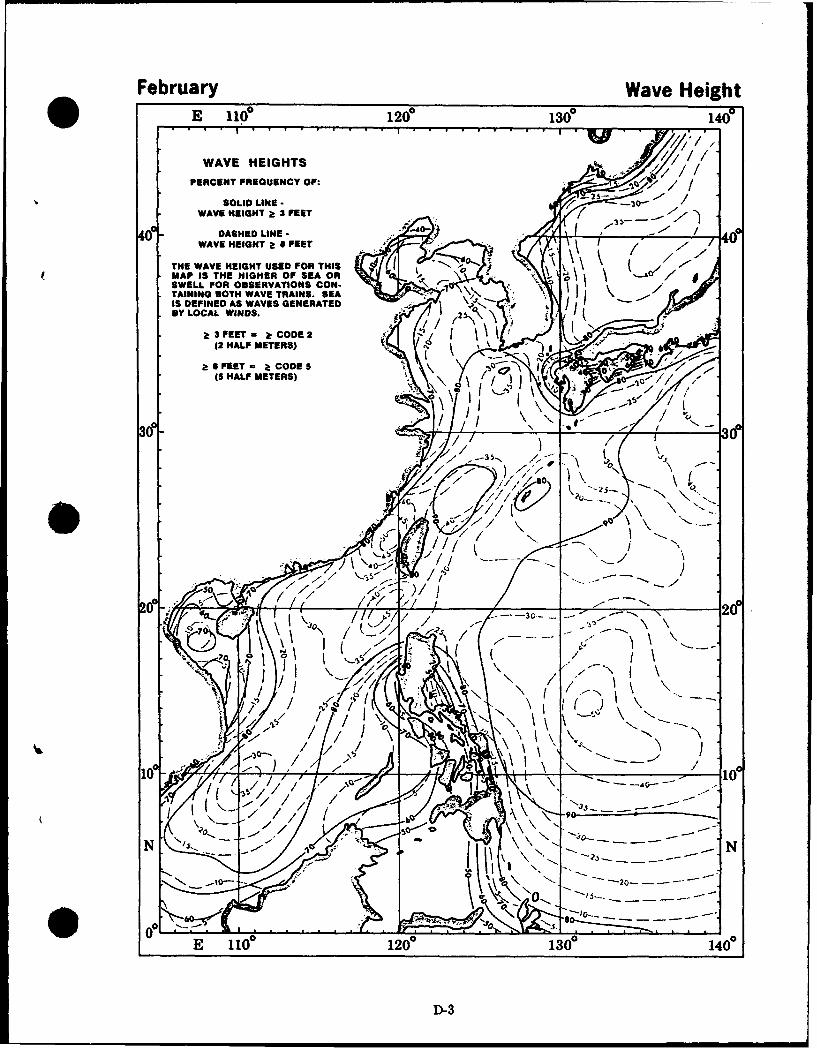
February Wave HeightE 110 1200 1300 1401
WAVE HEIGHTS
PERCENT FREQUENCY OF: . / .
SOLID LINE- /WAVE HEIGHT i 3 FEET (
4o,- DASHED LINE --WAVE HEIGHT 4 FEET 0
THE WAVE HEIGHT USED FOR THIS l " • ° t -MAP IS THE HIGHER OF SEA OR - '-~
SWELL FOR OBSERVATIONS CON- " J *- " ITAINING BOTH WAVE TRAINS. SEA " * " ' " j .IS DEFINED AS WAVES GENERATEDBY LOCAL WINDS. /
S3FEET- kCODE 2(2 HALF METERS) No'
I FEET= - )CODE 5(5 HALF METERS)
0
0ET_ _ _ _ _
E 10 1201354
D-3c
""A! -- i t J. ./ .•4 . 0-- • . . .. ý -
E kk 1 6
12
1 3 6
1460fZ
'; •
" 7 X k
,,,!,',"I " ,'t: I- ',< D-3"•."- .' ttU')\ --.
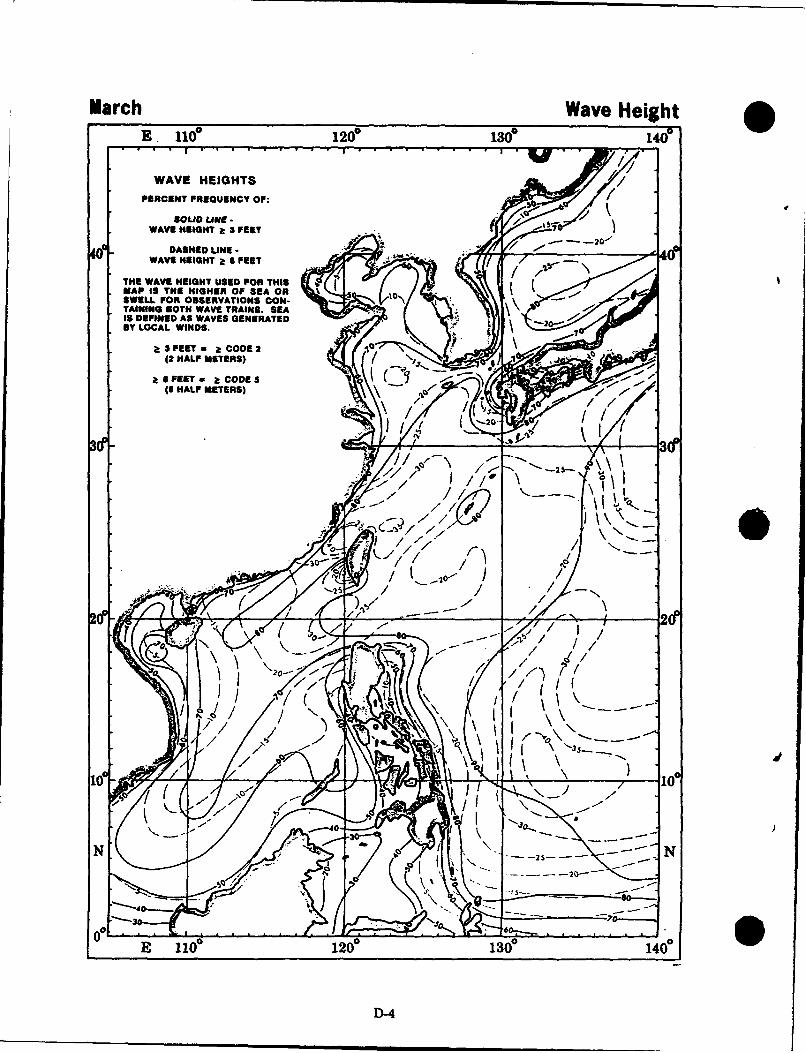
March Wave HeightE, Ile° 20° ise) 141f-
WAVE HEIGHTSPERCENT FREQUENCY OF:
SOLID LINE -WAVE HEIGHT i S FEET
4eDASHED UNE -f;:* /WAVE HEIGHT z " FEET
THE WAVE HEIGHT USED FOR THIS rMAP IS THE HIGHER OF SEA OR 10"\SWELL FOR OBSERVATIONS CON- -.TAUKINIG BOTH WAVE TRAINS. SEA ..IS DEFINED AS WAVES GENERATEDmY LOCAL WINDS. I~
a 3PFEET - L CODE2(2 HALF METERS)
4 FEETW aZ CODES5(6 HALF METERS)
~2(
1111 140
0-
N0 -25 N "- 0
'. . .° .- . . ...
He10 12e° 130e 140°_
D-4
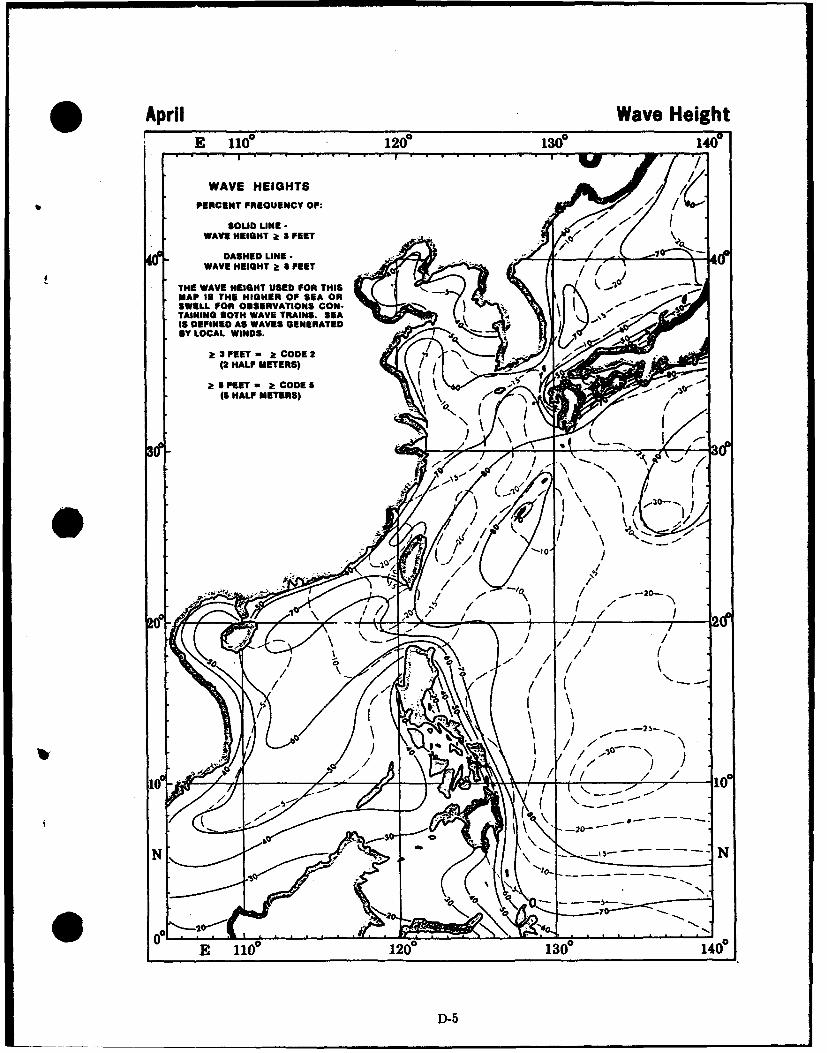
* April Wave HeightE 1100 1200 130* 1401
I.
WAVE HEIGHTS
PERCENT FREQUENCY OF:
SOLID LINE -WAVE HEIGHT a 3 FEET
DASHED UNE " -WAVE HEIGHT a! FEET 0
THE WAVE HEIGHT USED FOR THISMAP IS THE HIGHER OF SEA ORSWILL FOR OBSERVATIONS CON-
( Z H A L F M E T E R S ) t t \ -" " " , l , ' i i t W -. ' - / " /TAINING 30TH WAVE TRAINS./ SEA
G "FEET- CODE 5
020
D-20
IV'/,/ '7,o * . 0IE•, _12. / ,.' 14 I
•Y /d•,,•[ l+' ~~D-5 I / -" "
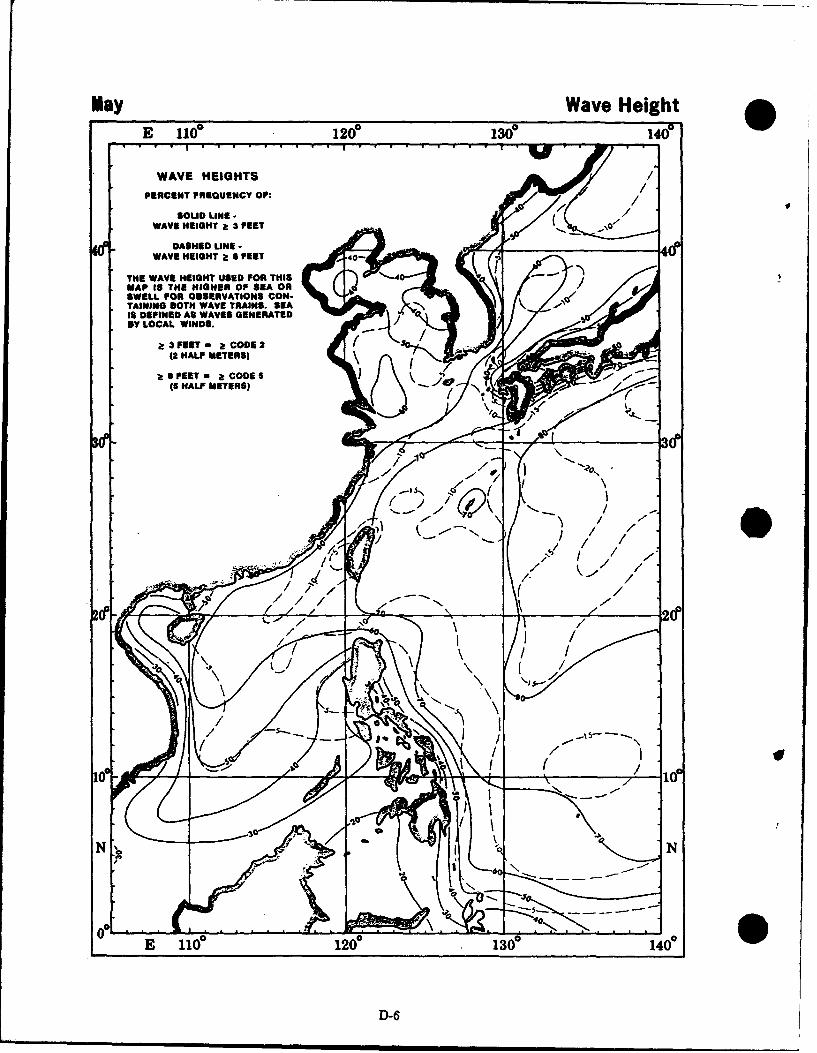
.may Wave Height
WAVE HEIGHTS
PERCENT FREQUENCY OF:
SOLID LiNE -WAVE HEIGHT a 3 FEET
DASHED LINE -WAVE HEIGHT 1- 5 FEET 0- 4(f
THE WAVE HEIGHT USED FOR THISMAP IS THE HIGHER OF SEA ORSWELL FOR OBSERVATIONS CON-TAINING BOTH WAVE TRAINS. SEAIS DEFINED AS WAVES GENERATEDBY LOCAL WINDS.
k 3FEET - kCODE 2(2 HALF METERS)
k 8FEET= - :CODE 5(5 HALF METERS)
si -- 3CF
AE
N N
e . ..... ... _ / .d •i• /
E 110! 120 130 1400
D-6
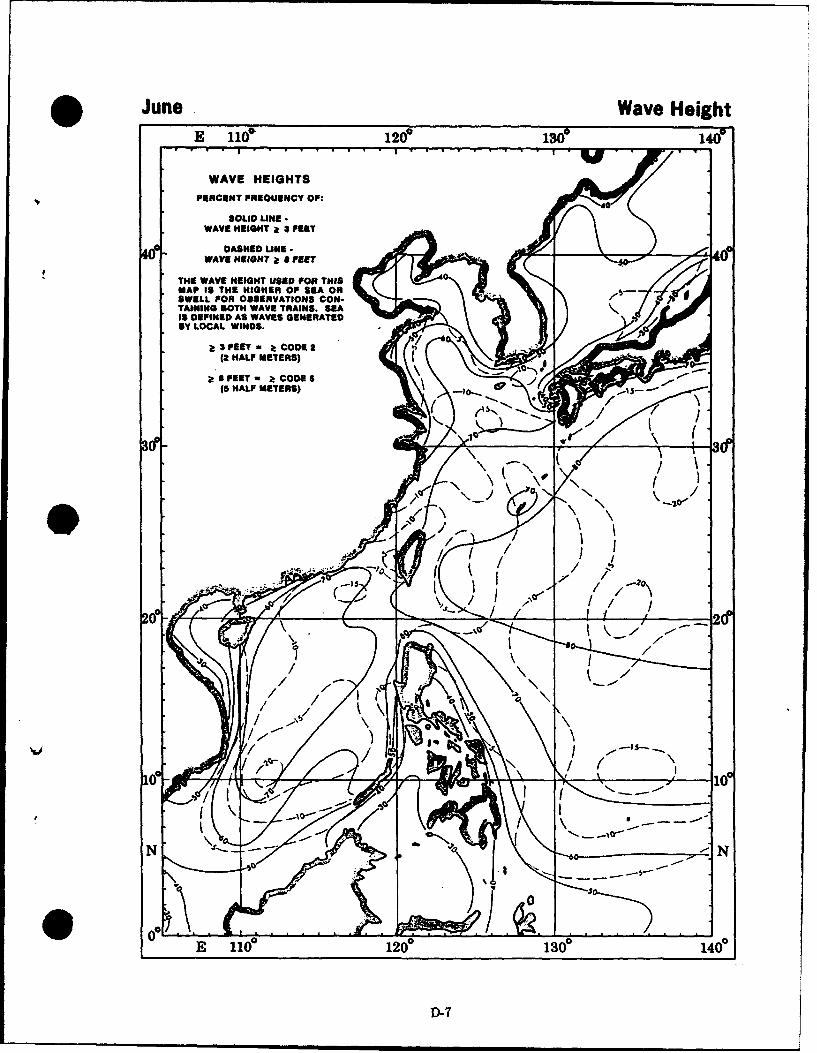
. June Wave HeightE 0i 120* 130m 140°
WAVE HEIGHTSPERCENT FREQUENCY or:
SOLID LINE .WAVE HEIGHT & 3 FEET
4(f -DASHED LINE -0 WAVE HEIGHT a 8 FEET -dO
THE WAVE HEIGHT USED FOR THISMAP IS THE HIGHER OF SEA ONSWELL FOR OBSERVATIONS CON-TAINING BOTH WAVE TRAINS. SEAIS DEFINED AS WAVES GENERATEDBY LOCAL WINDS.
Z 3SFElT- ;tCODE 2(2 HALF METERS)
a* 0 EET - 2! CODES5lo(5 HALF METERS). - 10,
00
-- N
E 110° 120 130 140°
D-7
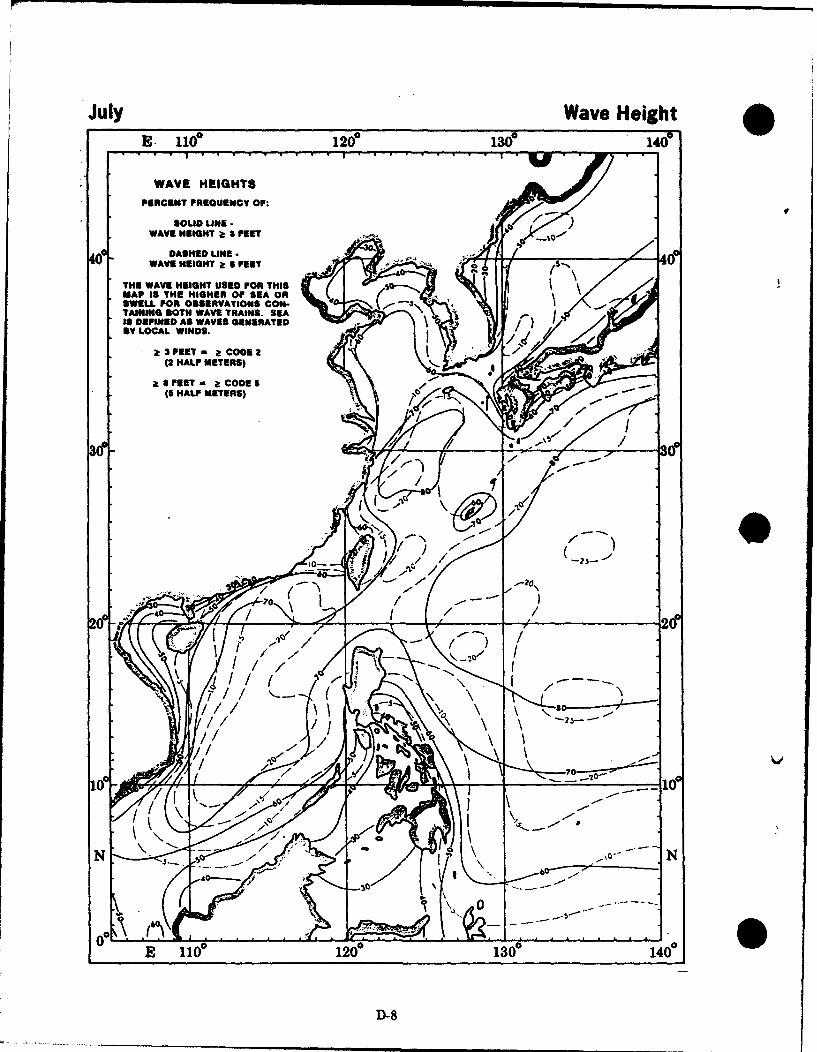
July Wave HeightE l1e 1200 131? 140'
WAVE HEIGHTS
PERCENT FREQUENCY OF:
i SOLID LINE. )WAVE HEIGHT t 3 FEET ,-10
DASHED UE -o WAVE HEIGH4T a I FEET a.'0
THE WAVE HEIGHT USED FOR THISMAP IS THE HIGHER OF SEA ORSWELL FOR OSERVATIONS CON- - . -sTAINING 30TH WAVE TRAINS. SEA ,
Is DEFINED AS WAVES GENERATEDSY LOCAL WINDS.
Z 3 FET" - !CODEi 2•r:
* (2 HALF METERS)
ý20 0
N N_
....., ..... ,. . . ....i
E 110* 120 130 140,
D-8
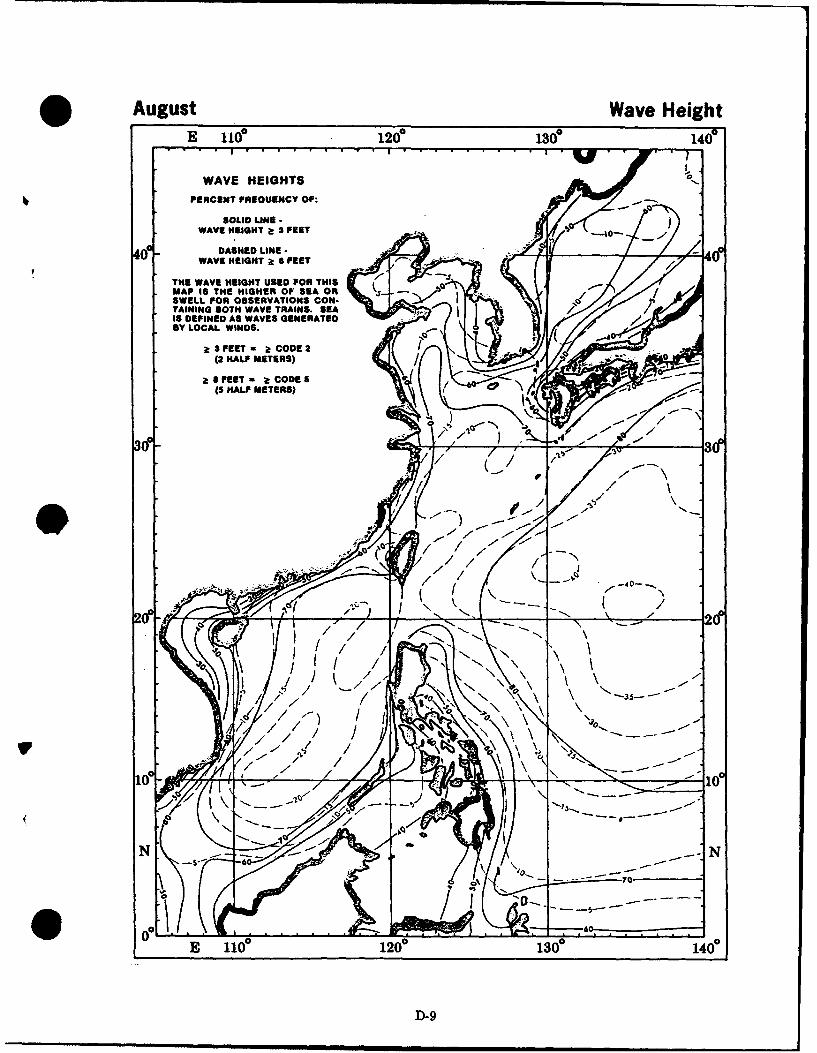
O August Wave HeightE 110 1200 130 140He
WAVE HEIGHTS
PERCENT PREQUENCY OF:
SOLID LINE -WAVE HEIGHT Z 3 FEET
DASHED LINE-WAVE HEIGHT 2: S FEET
THE WAVE HEIGHT USED FOR THISMAP IS THE HIGHER OF SEA OR ( -SWELL FOR 096ERVATIONS CoN.-TAINING BOTH WAVE TRAIN&S. AIS DEFPINED AS WAVES GENERATEDBY LOCAL WINDS.
F3 EET ;CODE 2(2 HALF METERS)
at IFEET a 2: CODES5(5 HALF METERS)
3( -- •/ 3,- (f
040E /110 120 130 140
"", ---------- -E 11°120° 130e 140e
D)-9
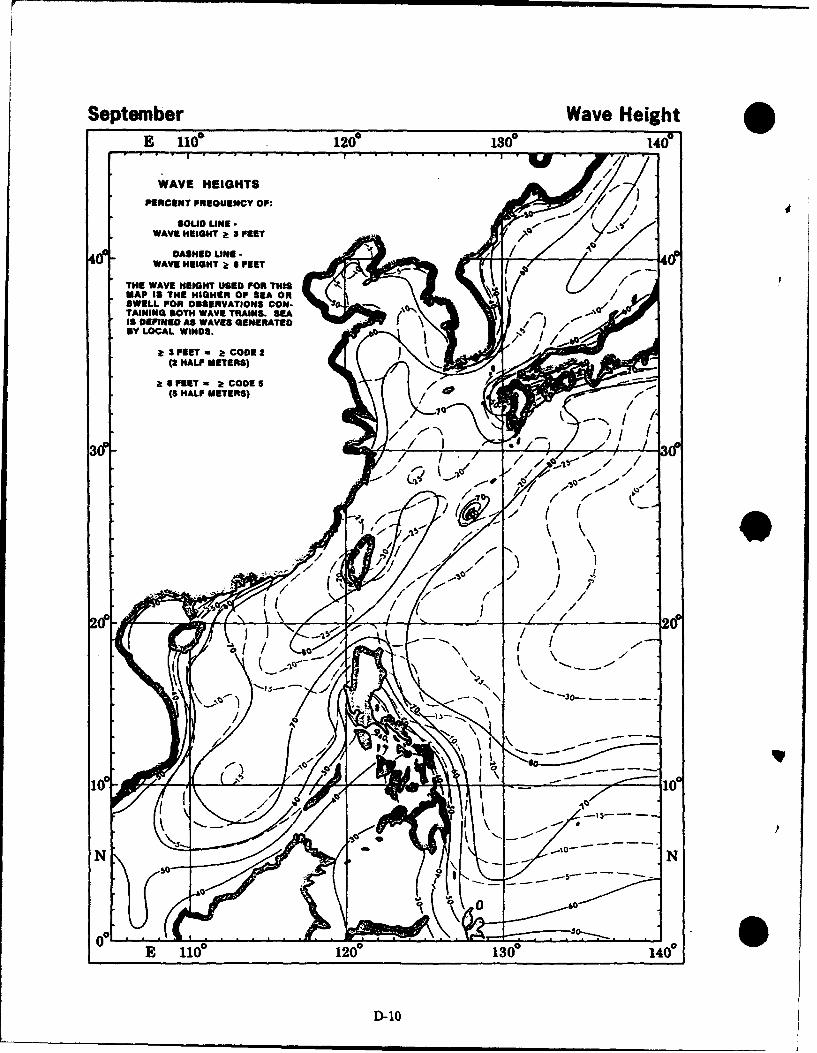
September Wave HeightE• i 0 120° 130 41?
WAVE HEIGHTS
PERCENT FREQUENCY OF:
SOUD LINE -WAVE HEIGHT 3 FE IT
DASHED UNE-WAVE HEIGHT k 0 FEET 4(f
THE WAVE HEIGHT USED FOR THISMAP IS THE HIGHER OF SEA ORSWELL FOR OBSERVATIONS CON- S.ITAINING 0BOTH WAVE TRAINS. SEAIS DEFINED AS WAVES GENERATED . \BY LOCAL WINDS.
Z 3 FEET a2COOE2(I HALF METERS)
Z 4 FEET,- ZCODES(5 HALF METERS)
1 120 130 H40
D-10
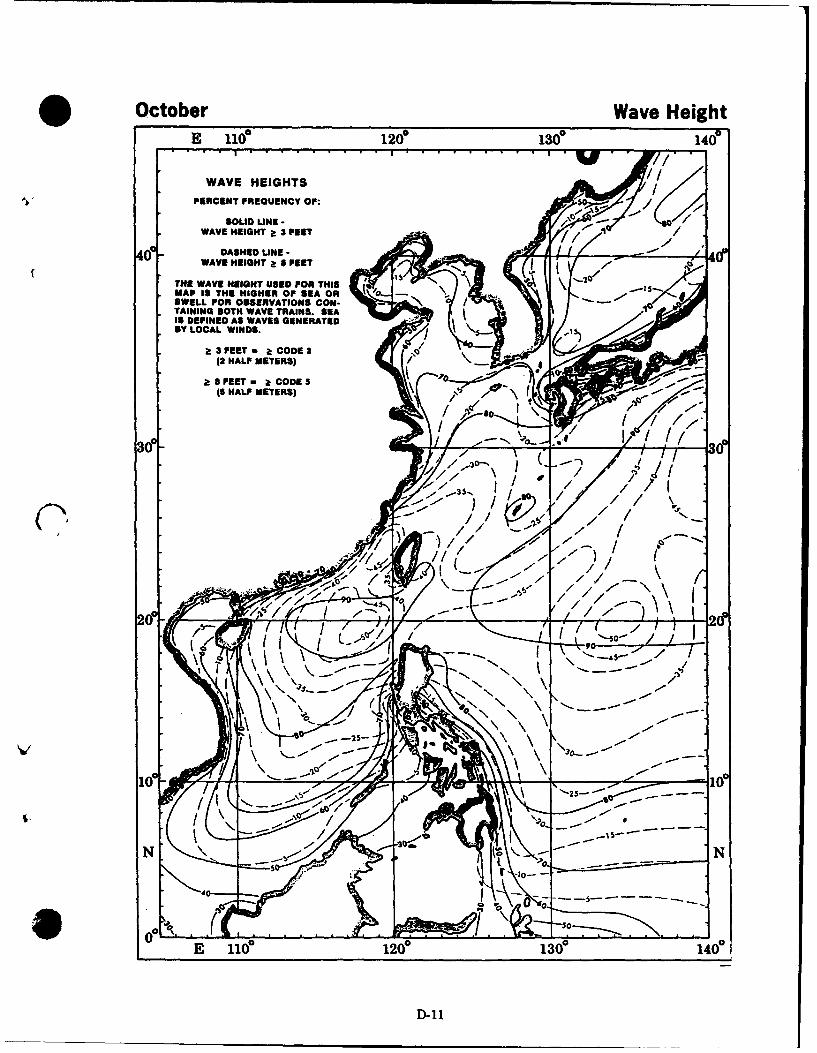
* October Wave HeightE lie 120° 130 140P./
WAVE HEIGHTSPERCENT FREQUENCY OF:
SOLID LINE; PEWAVE HEIGHT 2 3 FELT
0 WAV HEIGTafPR
THE WAVE HEIGHT USED FOR THIS
MAP IS THE HIGHEN OF SEA OR 5SWELL FOR OBSERVATIONS CON.- NTAINING BOTH WAVE TRAINS. SEAIS DEFINED AS WAVES GENERATEDBy LOCAL WINDS.
ZS 3FEET - a CODE2(2 HALF METERS)
a. &FEET -s a CODES5
(S HALF METERS)
30o
3 e- 11012013
D ,' 2'f
p~~ / •/ / -.
, - // \3---
k. 0-------• ,-
6-0' . . . . . .. .• °I... . . - ,
E He0 12e° 130° 1l0e
D-11
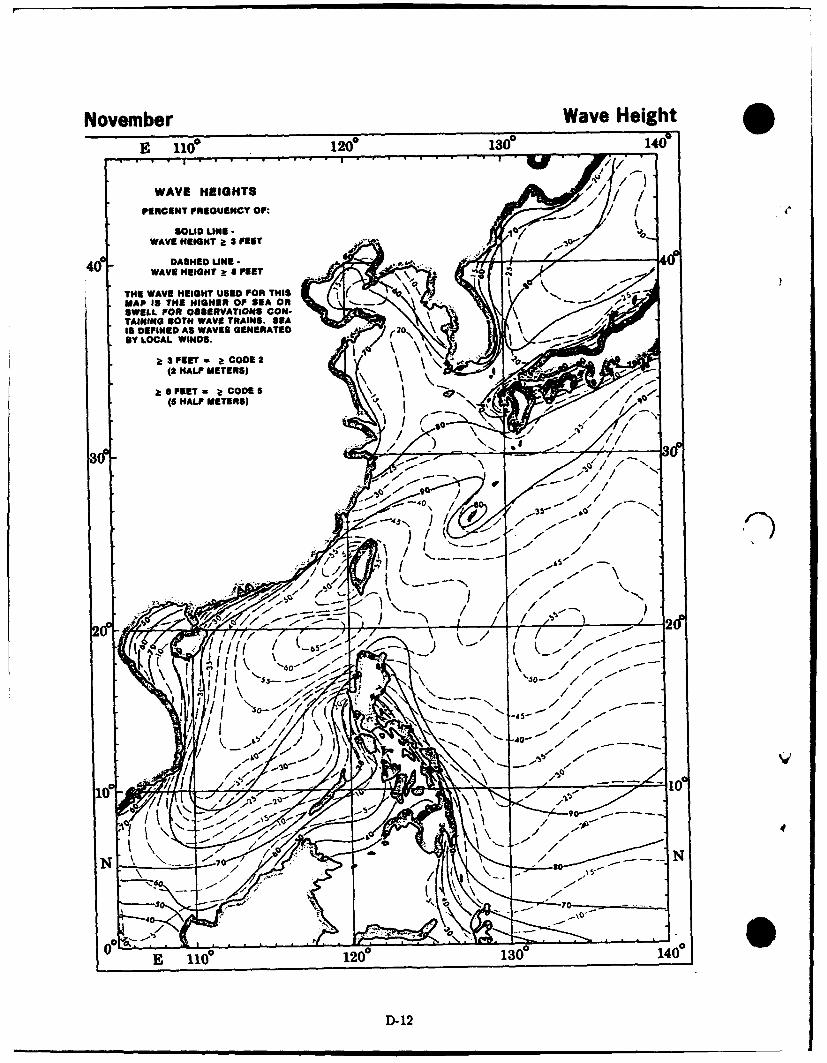
November Wave Height
E 110 120e 1300 1401
WAVE HEIGHTS
PERCENT FREGUENCY OF:'
lOUD LINE -WAVE HEIGHT p. 3 FEET
40? WAVE 0EGTa8FE
THE WAVE HEIGHT USED FOR THISMAP IS THE HIGHER OF SEA ORSWELL FOR OBSERVATIONS CON-TAINING BOTH WAVE TRAINS. SEAIS DEFINED AS WAVES GENERATED 2BY LOCAL WINDS.
3 aFEET a a: CODE 2(2 HALF METERS)
SSPEET- a CODES -(5 HALF METERS)
3dl
0 -\ I/<b -L-y / // . FA lop .. .. .- f
0E 1101
D-12
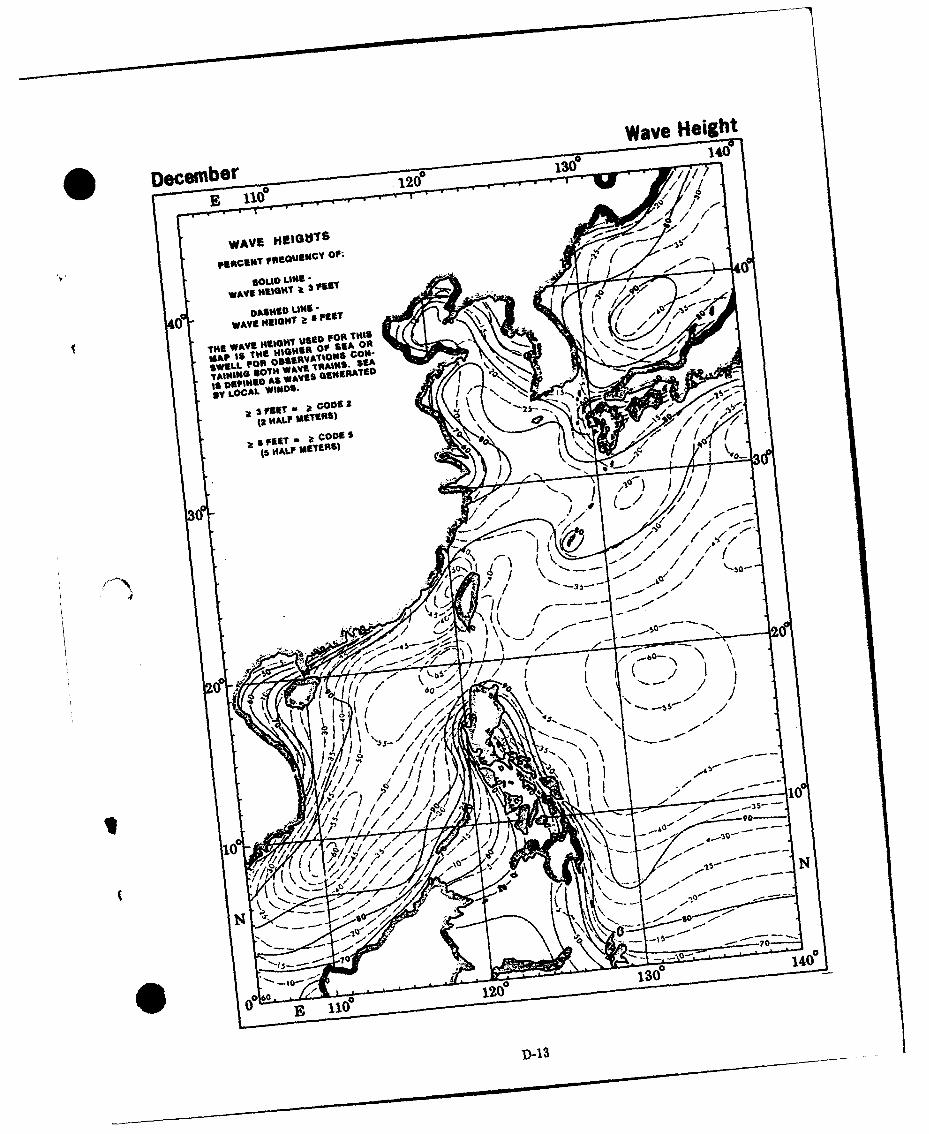
Wave Height
VVVUV 4Ij% ?~ ~ 3 FS
D Ijs / 11 I
10 , (~&7/ ~7 /
(JV tl~raap
14alow s&* Fo
DISTRIBUTION LIST
O CINCPACFLT COMMANDING OFFICER COMMANDING OFFICERATrN CODE 02M ATTN MEFEORO OFFICER ATTN OA DIVISIONPEARL HARBOR HI 96860-7000 USS CARL VINSON (CVN 70) USS CORONADO (AGF 11)
FPO AP 96629-2840 FPO AP 96662-3330COMMANDERATTN FLT METEOROLOGIST COMMANDING OFFICER IST MARINE AIRCRAFT WINGSEVENTH FLEET ATTN METEORO OFFICER UNIT 37101FPO AP 96601-603 USS CONSTELLATION (CV 64) FPO AP 96603-7101
FPO AP 96635-2780COMMANDER COMMANDER IN CHIEFATTN FLT METEOROLOGIST COMMANDING OFFICER U S PACIFIC COMMANDTHIRD FLEET ATTN METEORO OFFICER BOX 28FPO AP 96601-6001 USS INDEPENDENCE (CV 62) CAMP H M SMITH HI 96861-5025
FPO AP 96618-2760COMMANDER CHIEF OF NAVAL OPERATIONSU S NAVAL FORCES COMMANDING OFFICER ATTN OP 987PSC 473 BOX 12 ATTN METEORO OFFICER WASHINGTON DC 20350-2000FPO AP 96349-0051 USS KTITY HAWK (CV 63)
FPO AP 96634-2770 DEFENSE TECH INFO CENTER 2COMMANDER CODE DlIC-FD DOC PROC DIVUS NAVAL FORCES KOREA COMMANDING OFFICER BLDG 5 CAMERON STATIONUNIT 15250 ATTN METEORO OFFICER ALEXANDRIA VA 22304-6145APO AP 96301-0023 USS NIMITZ (CVN 68)
FPO AP 98780-2820 COMMANDING OFFICER 12COMMANDER ATIN CODE 5227 DOCS SECUS NAVFOR MARIANAS COMMANDING OFFICER NAVRSCHLABPSC 455 BOX 14 ATTN METEORO OFFICER WASHINGTON DC 20375-5000FPO AP 96540-0051 USS BLUE RIDGE (LCC 19)
FP0 AP 96628-3300 COMMANDING OFFICER1 COMNAVAIRPAC ATTN CODE 1221 CLASSIF MOT
NAS NORTH ISLAND COMMANDING OFFICER NAVRSCHLABPO BOX 357051 ATTN METEORO OFFICER WASHINGTON DC 20375-5000SAN DIEGO CA 92135-705 USS BELLEAU WOOD (LHA 3)
FPO AP 96623-1610 NAVRSCHLABCOMNAVSURFPAC ATTN CODE 70353 LIBRARY2421 VELLA LAVELLA RD COMMANDING OFFICER JCSSC MS 39529-5004SAN DIEGO CA 92155-5490 ATTN METEORO OFFICER
USS NEW ORLEANS (LPH 11) OFFICER IN CHARGECOMSUBFORPAC FPO AP 96627-1650 US NAVOCEANCOMDETATTN CODE N216 PSC 456 BOX 81PEARL HARBOR HI 96860-6550 COMMANDING OFFICER FPO AP 96540-1281
ATTN METEORO OFFICERCOMPHIBGRU ONE USS TARAWA (LHA 1) OFFICER IN CHARGEATTN METEORO OFFICER FPO AP 96622-1600 US NAVOCEANCOMDETUNIT 25093 FLEET ACTIVITIESFPO AP 96601-6006 COMMANDING OFFICER FPO AP 96370-0051
USS PELELIU (LHA 5)DEPCOMOPTEVFOR PAC FPO AP 96624-1620 OFFICER IN CHARGENAS NORTH ISLAND US NAVOCEANCOMDETPO BOX 357061 COMMANDING OFFICER UNIT 5052SAN DIEGO CA 92135-7061 ATTN METEORO OFFICER APO AP 96319-5000
USS TRIPOLI (LPH 10)COMMANDING OFFICER FPO AP 96626-1645 OFFICER IN CHARGEATTN METEORO OFFICER NAVOCEANCOMDETUSS A LINCOLN (CVN 72) 686 CUSHING ROADFPO AP 96612-2872 NEWPORT RI 02841-1207
Dist-1
NAVAL OCEANOGRAPHIC OFFICE HQ IST WEATHER WING DN DIRECTOR JTWC
ATTN CODE HBAC HICKAM AFB HI 96853 BOX 171002 BALCH BOULEVARD FPO AP 96630JCSSC MS 39529-5001 USAFETAC TS 10
ATTN TECH LIBRARY COLORADO STATE UNIVERSITYCOMMANDING OFFICER SCOTT AFB IL 62225 ATTN DR WILLIAM GRAY
NAVEASTOCEANCEN ATMOSPHERIC SCIENCES DEPT9141 THIRD AVE 20 VS DON FT COLLINS CO 80523NORFOLK VA 23511-2394 APO AP 96328 5000
UNIVERSITY OF HAWAIICOMMANDING OFFICER DET 8 20 VS ATTN ME'OROLOGY DEPT
NAVWSITOCEANCEN APO AP 96239 2525 CORREA ROADBOX 113 HONOLULU HI 9682PEARL HARBOR HI 96860-5050 USAF ETAC
ATTN KENNETH WALTERS SCrENCE APPLICATIONSUS NAVAL ACADEM Y SCOTT AFB IL 92225-5483 INTERNATIONAL CORP
ATTN LIBRARY REPORTS 205 MONTECITO AVE
121 BLAKE RD COMMANDANT MONTEREY CA 93940ANNAPOLIS MD 21405000 US COAST GUARD
WASHINGTON DC 20226 MARITIME METEOROLOGY DIVUS NAVAL ACADEMY JAPAN METEOROL AGENCY
ATTN OCEANOGRAPHY DEPT NOAA NESDIS LIAISON OTE MACHI 13 4 CHIYODA KU121 BLAKE RD ATTN CODE SC2 TOKYO JAPANANNAPOLIS MD 21402-5000 NASA JOHNSON SPACE CENTER
HOUSTON TX 77058 COORDINATOR NATIONAL
NAVPGSCOL 20 ATMOS RESEARCH PROGRAM
ATTN CODE MR CHIEF SCIENTIFIC SERVICES INSTITUTE OF PHYSICS
MONTEREY CA 93943-5000 NWS PACIFIC REGION NOAA ACADEMIA SINICAPO BOX 50027 TAIPEI TAIWAN
NAVPGSCOL HONOLULU HI 96850-4993ATTN CODE OC CENTRAL WX BUREAU
MONTEREY CA 93943-5000 DIRECTOR NMC 64 KUNG YUAN RDNWS NOAA TAIPEI TAIWAN 100
NAVPGSCOL WWB W32 RM 204ATIN CODE MR WF WASHINGTON DC 20233 DIRECTOR PAGASA 5
MONTEREY CA 93943-5000 ASIATRUST BANK BLDGNATIONAL WEATHER SERVICE 1424 QUEZON AVE
NAVPGSCOL WORLD WEATHER BLDG RM 307 QUEZON CITY 1104 PHILIPPINES
ATTN LIBRARY CODE 524 5200 AUTH ROAD
MONTEREY CA 93943-5000 CAMP SPRINGS MD 20023
0J
Dist-2
Related Documents