1 How much tenure mix is there in England? How has this changed 1981- 2001? What are the implications for past and future policy? ENHR conference Toulouse, July 5-7th 2011 Dr Rebecca Tunstall London School of Economics [email protected]

1 How much tenure mix is there in England? How has this changed 1981-2001? What are the implications for past and future policy? ENHR conference Toulouse,
Dec 28, 2015
Welcome message from author
This document is posted to help you gain knowledge. Please leave a comment to let me know what you think about it! Share it to your friends and learn new things together.
Transcript

1
How much tenure mix is there in England? How has this changed 1981-2001?
What are the implications for past and future policy?
ENHR conferenceToulouse, July 5-7th 2011
Dr Rebecca TunstallLondon School of Economics

2
Introduction
Policies to encourage (more) ‘mixed tenure’ at neighbourhood scale have been an important element of policies to encourage la mixite sociale in many countries over several decades.
However, what policy makers or researchers mean by ‘mixed tenure’ or ‘more mixed tenure’ is not always clear.
This makes it difficult to:• Evaluate the impact of policy intended to create more mixed
tenure;• Assess the extent of ‘unmixed tenure’ and the remaining task for
mixed tenure policy;• Compare and/or synthesise the results of different policies and
research project to evaluate the impact of mixed tenure itself on ultimate goals; and to
• Plan future mixed tenure policy.
3
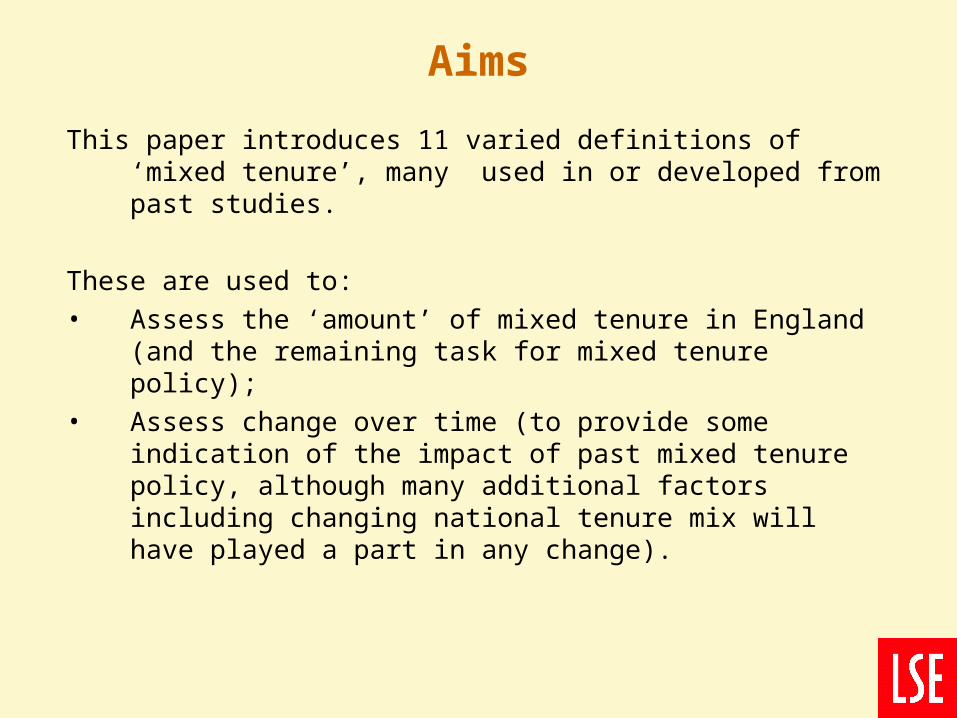
Aims
This paper introduces 11 varied definitions of ‘mixed tenure’, many used in or developed from past studies.
These are used to:• Assess the ‘amount’ of mixed tenure in England (and the
remaining task for mixed tenure policy); • Assess change over time (to provide some indication of the
impact of past mixed tenure policy, although many additional factors including changing national tenure mix will have played a part in any change).
4
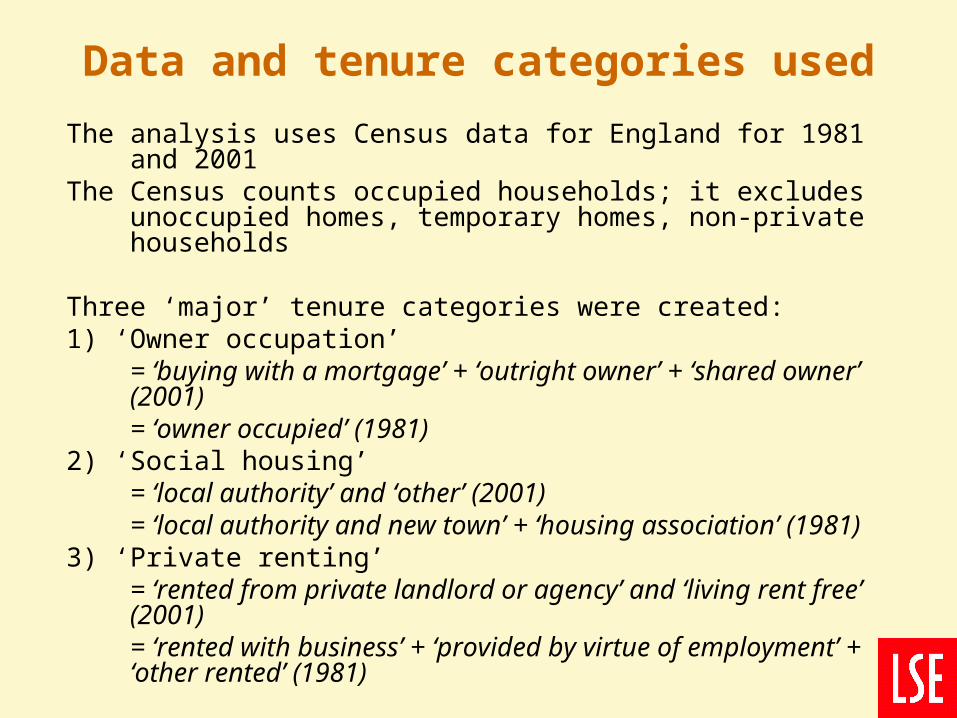
Data and tenure categories used
The analysis uses Census data for England for 1981 and 2001The Census counts occupied households; it excludes unoccupied
homes, temporary homes, non-private households
Three ‘major’ tenure categories were created:1) ‘Owner occupation’
= ‘buying with a mortgage’ + ‘outright owner’ + ‘shared owner’ (2001)= ‘owner occupied’ (1981)
2) ‘Social housing’ = ‘local authority’ and ‘other’ (2001)= ‘local authority and new town’ + ‘housing association’ (1981)
3) ‘Private renting’ = ‘rented from private landlord or agency’ and ‘living rent free’ (2001)= ‘rented with business’ + ‘provided by virtue of employment’ + ‘other rented’ (1981)
5
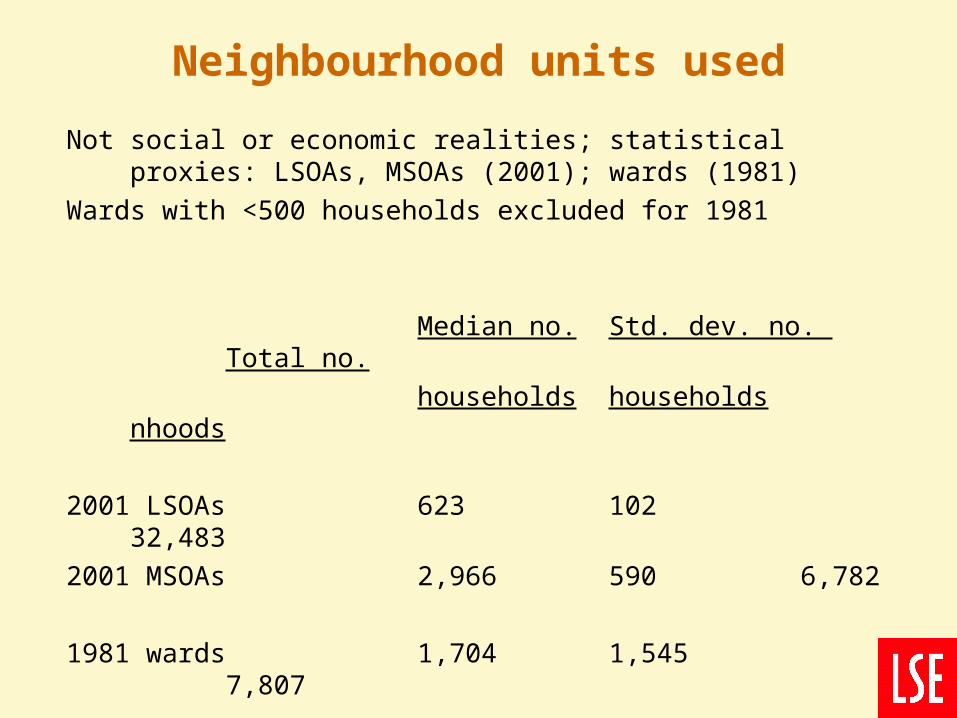
Neighbourhood units used
Not social or economic realities; statistical proxies: LSOAs, MSOAs (2001); wards (1981)
Wards with <500 households excluded for 1981
Median no. Std. dev. no. Total no.
households households nhoods
2001 LSOAs 623 102 32,483
2001 MSOAs 2,966 590 6,782
1981 wards 1,704 1,545 7,807
6
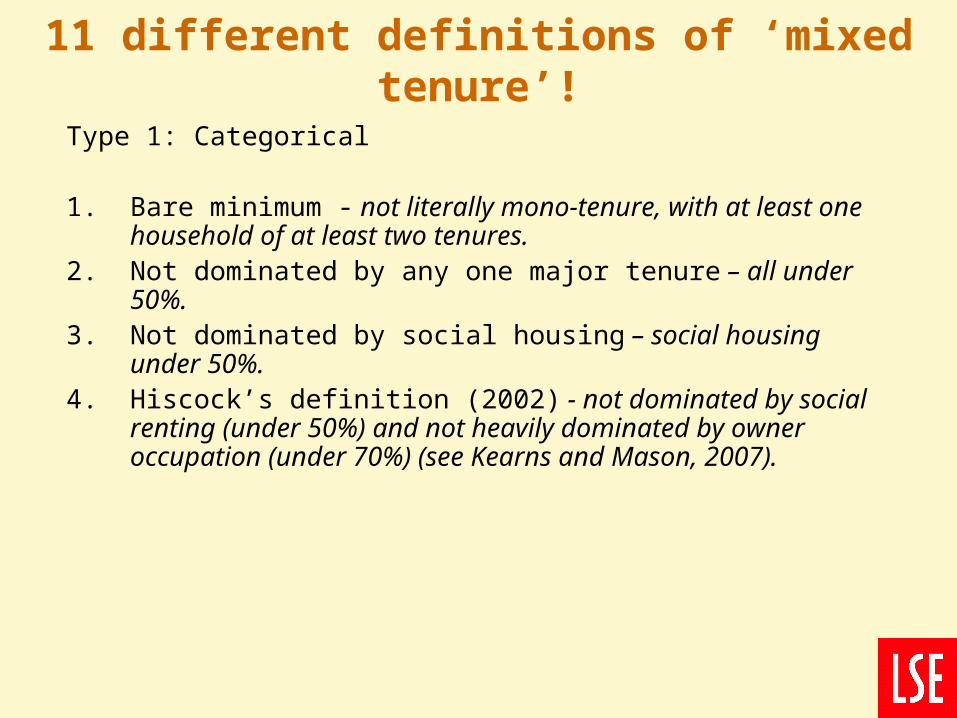
11 different definitions of ‘mixed tenure’!
Type 1: Categorical
1. Bare minimum - not literally mono-tenure, with at least one household of at least two tenures.
2. Not dominated by any one major tenure – all under 50%. 3. Not dominated by social housing – social housing under 50%. 4. Hiscock’s definition (2002) - not dominated by social renting
(under 50%) and not heavily dominated by owner occupation (under 70%) (see Kearns and Mason, 2007).
7
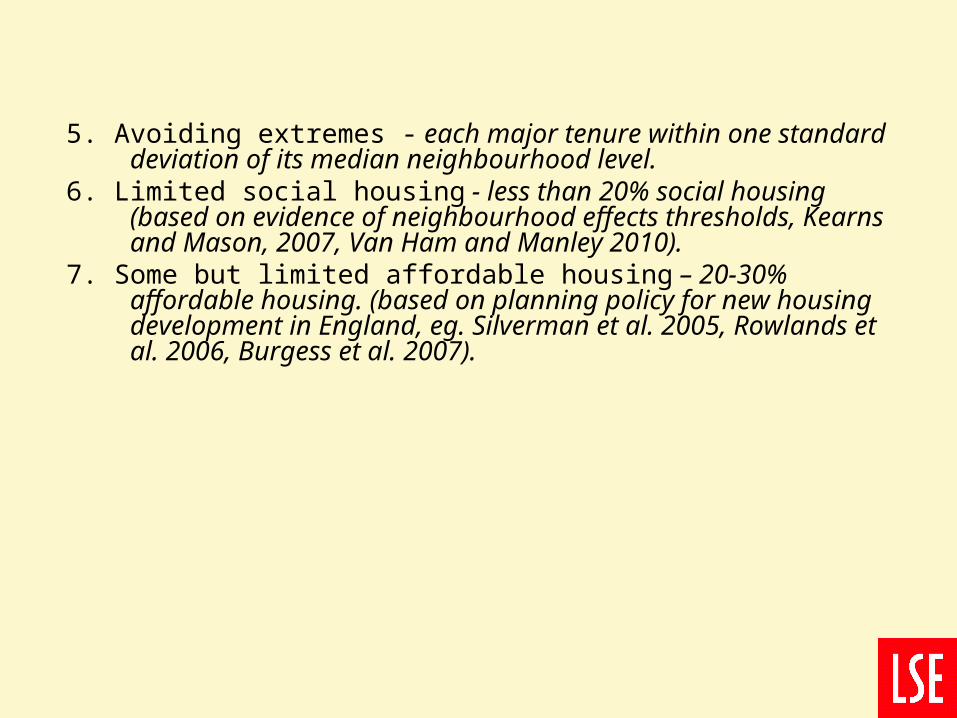
5. Avoiding extremes - each major tenure within one standard deviation of its median neighbourhood level.
6. Limited social housing - less than 20% social housing (based on evidence of neighbourhood effects thresholds, Kearns and Mason, 2007, Van Ham and Manley 2010).
7. Some but limited affordable housing – 20-30% affordable housing. (based on planning policy for new housing development in England, eg. Silverman et al. 2005, Rowlands et al. 2006, Burgess et al. 2007).

8
Type 2: Systemic
8. Index of isolation – exposure of tenure of interest to all other tenures
9. Index of dissimilarity – ditto10. Index of exposure/interaction – ditto11. ‘Role model’ exposure – exposure of social renters to owner
occupiers.

9
Note:6 and 7 are mutually exclusive2 and 6 are likely to be exclusiveAll but 9 are affected by the national tenure mix11 can go no higher than the % the tenure of interest in the national
mix

10
Results for the 11 definitions, England 2001
Type 1: What proportion of neighbourhoods are ‘mixed tenure’? (Large neighbourhoods (MSOAs) shown first, small (LSOAs) second)
1) 100%, 100% - Not literally mono-tenure2) 95%, 91% - Not dominated by social housing – less than 50%3) 63%, 65% - Limited social housing - less than 20% 4) 58%, 55% - Each major tenure within one std. dev. of median5) 38%, 34% - Not dominated by social renting or heavily
dominated by owner occupation 6) 16%, 12% - Some but limited affordable housing – 20-30%7) 9%, 9% - Not dominated by any one major tenure.

11
Type 2: Systemic How are tenures spread between neighbourhoods across England?(Large neighbourhoods (MSOAs) shown first, small (LSOAs) second)
8) Isolation in certain neighbourhoods• Owner occupiers – 73, 75• Social renters – 31, 38• Private renters – 17, 22
9) Dissimilarity from all other tenures• Social renters – 39, 49• Owner occupiers – 32, 40• Private renters – 27, 42
ie. 39% of social rented homes or 30% of owner occupied homes would need to move between MSOAs to create an even mix.

12
10) Exposure to all other tenures• Private renters – 81• Social renters – 53, 62• Owner occupiers – 34, 25
11) ‘Role model’ exposure of social renters to owner occupiers• 56, 50 (compared to eg. owner occupiers’ exposure to social
renters: 16, 14)
ie. 56% of other residents in the typical social renter’s MSOA were owners and 16% of other residents in the typical owners MSOA were social renters.

13
Summary, 2001
The number of mixed tenure neighbourhoods in England in 2001 varied wildly according to the definition used, from 9% to 100%.
The segregation of tenures also varied dramatically according to the index used, and the tenure of focus.
• Owner occupiers were the most isolated and least exposed to other tenures, but had intermediate indices of dissimilarity.
• Social renters were less isolated than owner occupiers and more exposed to other tenures, but had higher indices of dissimilarity.
• Private renters were the least segregated by all measures.
The size of neighbourhood (median 623 households vs 2,966) made little difference for type 1 definitions; but some difference for type 2 definitions.

14
Implications
Different definitions have dramatically varying implications for the potential task of mixed tenure policy -
Should policy address the majority of neighbourhoods (91% dominated by one tenure), or is the task complete (0% literally monotenure)?
If ‘mixed tenure’ means avoiding social housing domination (definition 2), in 2001 policy had little left to do: only 5% (343) large neighbourhoods and 9% (3,033) small neighbourhoods were ‘unmixed’.
If it means limited social housing (definition 6), policy had much left to do: 37% (2,495) large neighbourhoods and 35% (11,495) small neighbourhoods were ‘unmixed’.

15
If mixed tenure is low isolation or high exposure to other tenures (definitions 8, 9, 11), owner occupation not social renting is the outlier tenure and perhaps should be the target of policy.
If mixed tenure is about low dissimilarity (definition 10), social renting is not much different from owner occupation, but should have some priority.
If it is about maximising exposure of social renters to owner occupiers, for large neighbourhoods, at 56 it is already 83% of maximum given national mix, and compares to owner occupiers’ exposure to social renters of 16.

16
Change in mixed tenure, for larger neighbourhoods, England, 1981-2001
This compares results for 2001 MSOAs (larger neighbourhoods) with 1981 wards (large neighbourhoods)
There are some problems of comparability 1981-2001:• Different neighbourhood boundaries: 1981 neighbourhoods
smaller, more varied in size; appears to affect type 2 definitions (8, 9, 10, 11) more
• Different national tenure mix with more owner occupation and private renting and less social renting: Affects all definitions except 9.
• Slightly different tenure definitions; very small effect.

17
Results, 1981-2001
Has the proportion of larger neighbourhoods that are ‘mixed tenure’ increased?
Yes:Not dominated by social housing - 85% -> 95% (+10%) Limited social housing - less than 20% - 45% -> 63% (+18%) Each major tenure within one std. dev. of median - 54% -> 58%
(+4%) - (possibly artefactual?)
No:Not literally mono-tenure - 100% ->100% Not dominated by social renting or heavily dominated by owner
occupation - 48% -> 38% (-10%) Some but limited affordable housing – 20% -> 16% (-4%)Not dominated by any one major tenure - 10% -> 9% (-1%)

18
Has segregation of tenures decreased? (large neighbourhoods)(Note: isolation and exposure affected by change in national tenure
system; all these definitions may be more affected by boundary changes)
Yes:Isolation of social renters – 47 -> 31 (-16)Isolation of private renters – 19 -> 17 (-2)Dissimilarity of owner occupiers - 35 -> 32 (-3)Dissimilarity of social renters – 42 -> 39 (-3)Exposure of private renters – 81 -> 83 (+2)Exposure of social renters – 53 -> 67 (+14)Exposure of social renters to owner occupiers – 56 -> 57 (+1)
No:Isolation of owner occupiers – 66 -> 73 (+7)Dissimilarity of private renters – 15 ->27 (+12)Exposure of owner occupiers – 34 -> 27 (-7)
19
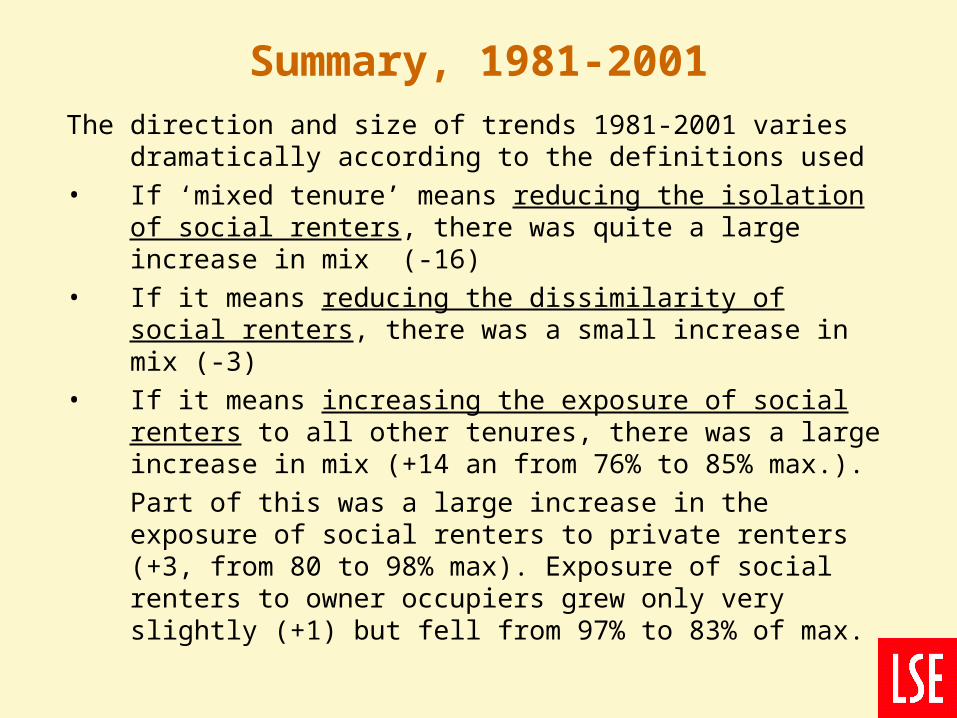
Summary, 1981-2001The direction and size of trends 1981-2001 varies dramatically
according to the definitions used• If ‘mixed tenure’ means reducing the isolation of social renters,
there was quite a large increase in mix (-16)• If it means reducing the dissimilarity of social renters, there was
a small increase in mix (-3)• If it means increasing the exposure of social renters to all other
tenures, there was a large increase in mix (+14 an from 76% to 85% max.).
Part of this was a large increase in the exposure of social renters to private renters (+3, from 80 to 98% max). Exposure of social renters to owner occupiers grew only very slightly (+1) but fell from 97% to 83% of max.

20
Policy evaluation, 1981-2001
All definitions except 9 are affected by changes in national tenure mix.Changes in national tenure mix, rather than mixed tenure policy,
appear to be the main explanation for changes in tenure mix 1981-2001
Did ‘mixed tenure policy’ have any effect? • If the Right to Buy can be described as a ‘mixed tenure’ policy, it
appears to be the most important one. It seems likely to have played a role in the reduction in areas dominated by social housing (definitions 2, 3), increase in areas with limited social housing (definition 6) and in areas heavily dominated by owner occupation (definition 4)
• Neighbourhood or estate regeneration policy may have played an additional role (definitions 2, 3, 4, 6)
• Policy to encourage affordable housing in new developments 1990- did not prevent a decline in neighbourhoods with 20-30% affordable housing (definition 7) 1981-2001.

21
Next steps for analysis…
The extent of mixed tenure in very small neighbourhoods (OAs) for 2001
Differences in tenure mix between regions, cities and area types
The extent to which mixed tenure research case study neighbourhoods fit the 11 definitions
The extent to which mixed tenure policy caused case study neighbourhoods to move from ‘unmixed’ to ‘mixed’ categories according to the 11 definitions
Change in mixed tenure for large, small and very small neighbourhoods 2001-2011
22
References
Burgess, G; Monk, S, and Whitehead, C (2007) The provision of affordable housing through s106: The situation in 2007, RICS Research paper series 7(14), London: RICS
Hiscock, R (2002) Mixing tenure: Is it good for wellbeing? Paper presented to the European Network for Housing Research, Vienna, 1st-3rd July, referred to in Kearns and Mason, 2007
Kearns, A and Mason, P (2007) Mixed communities and neighbourhood quality, Housing Studies 22(5) pp661-691
Rowlands, R, Tice, A and Murie, A (2006) More than tenure mix: Developer and purchaser attitudes to new housing estates Coventry: CIH
van Ham, M and Manley, D (2010) ‘The effect of neighbourhood housing tenure mix on labour market outcomes: a longitudinal investigation of neighbourhood effects’ Journal of Economic Geography, 10, 257-282.
Related Documents