1 Graphing Functions by Plotting Points A function f of the form f (x) = mx + b is called a linear function because its graph is the graph of the equation y = mx + b, which represents a line with slope m and y-intercept b. A special case of a linear function occurs when the slope is m = 0. The function f (x) = b, where b is a given number, is called a constant function because all its values are the same number, namely, b. Its graph is the horizontal line y = b.

Welcome message from author
This document is posted to help you gain knowledge. Please leave a comment to let me know what you think about it! Share it to your friends and learn new things together.
Transcript

1
Graphing Functions by Plotting Points
A function f of the form f (x) = mx + b is called a linear function because its graph is the graph of the equation y = mx + b, which represents a line with slope m andy-intercept b.
A special case of a linear function occurs when the slope is m = 0.
The function f (x) = b, where b is a given number, is called a constant function because all its values are the same number, namely, b. Its graph is the horizontal line y = b.
2
Graphing Functions by Plotting Points
Figure 2 shows the graphs of the constant function f (x) = 3 and the linear function f (x) = 2x + 1.
The linear function f (x) = 2x + 1The constant function f (x) = 3
Figure 2

3
Sketch graphs (a) f (x) = x2 (b) g (x) = x3 (c) h (x) =
Example 1 – Graphing Functions by Plotting Points
Solution:We first make a table of values. Then we plot the pointsgiven by the table and join them by a smooth curve to obtain the graph.
4
Example 1 – Solution
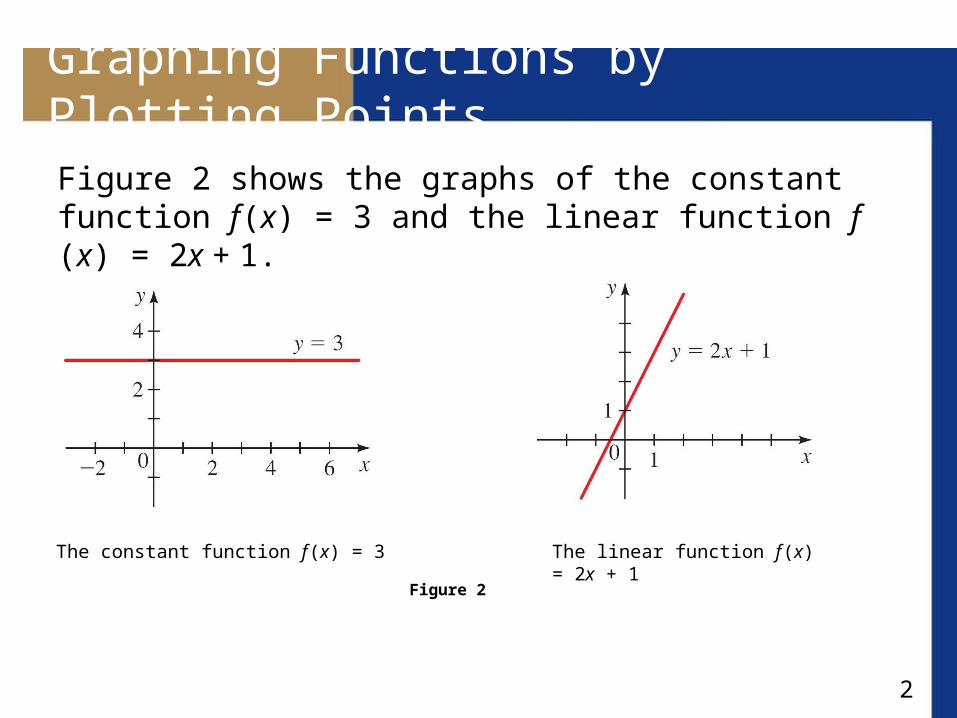
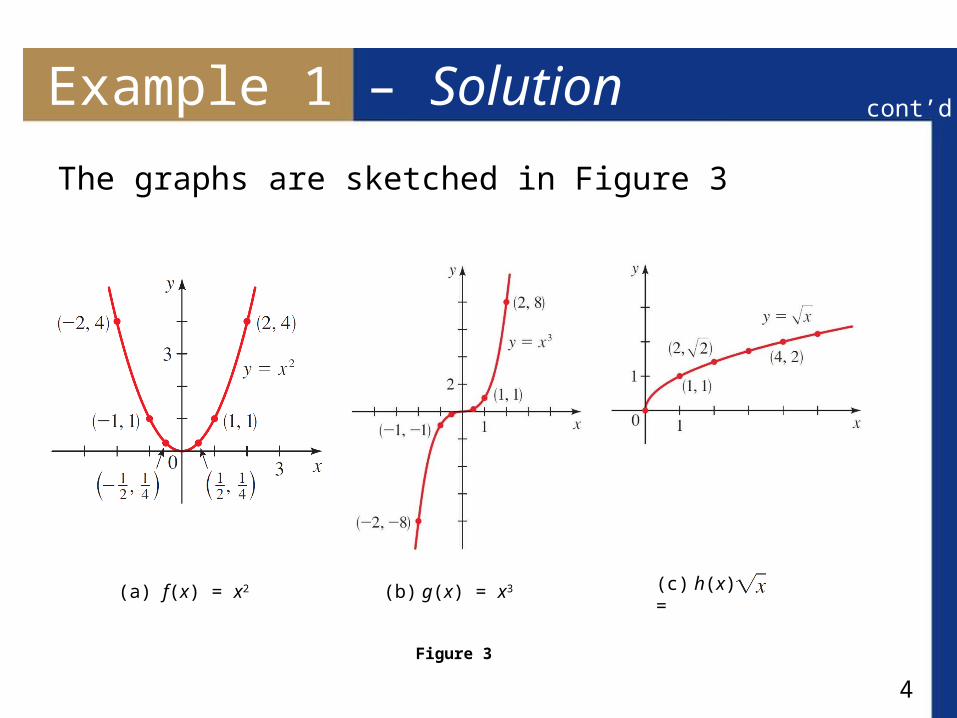
The graphs are sketched in Figure 3
(b) g(x) = x3(a) f(x) = x2 (c) h(x) =
Figure 3
cont’d
5
Graphing Piecewise Defined Functions
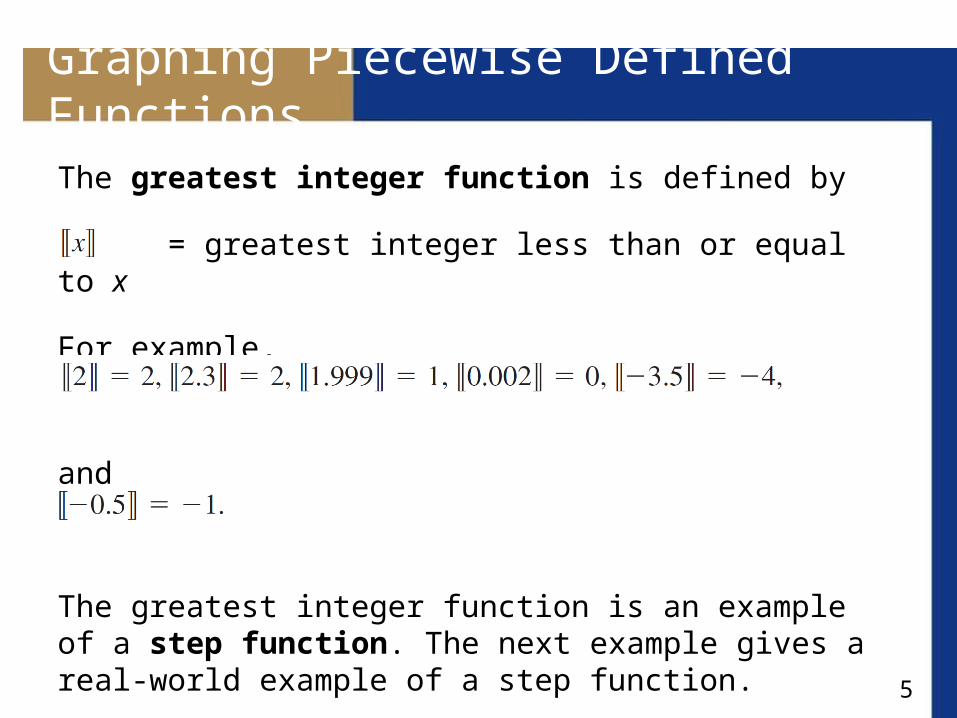
The greatest integer function is defined by
= greatest integer less than or equal to x
For example,
and
The greatest integer function is an example of a step function. The next example gives a real-world example of a step function.
6
Example 7 – The Cost Function for Long-Distance Phone Calls
The cost of a long-distance daytime phone call from Toronto, Canada, to Mumbai, India, is 69 cents for the first minute and 58 cents for each additional minute (or part of aminute).
Draw the graph of the cost C (in dollars) of the phone call as a function of time t (in minutes).
Solution:Let C (t) be the cost for t minutes. Since t > 0, the domain of the function is (0, ).

7
Example 7 – Solution
From the given information we have
C (t) = 0.69 if 0 < t 1
C (t) = 0.69 + 0.58 = 1.27 if 1 < t 2
C (t) = 0.69 + 2(0.58) = 1.85 if 2 < t 3
C (t) = 0.69 + 3(0.58) = 2.43 if 3 < t 4
and so on.
cont’d

8
Example 7 – Solution
The graph is shown in figure 9.
Cost of a long-distance call
Figure 9
cont’d

9
Continuous graphs
A function is called continuous if its graph has no “breaks” or “holes.”
The functions in Examples 1, 2 and 3 are continuous; the function in Examples 7 is not continuous.
10
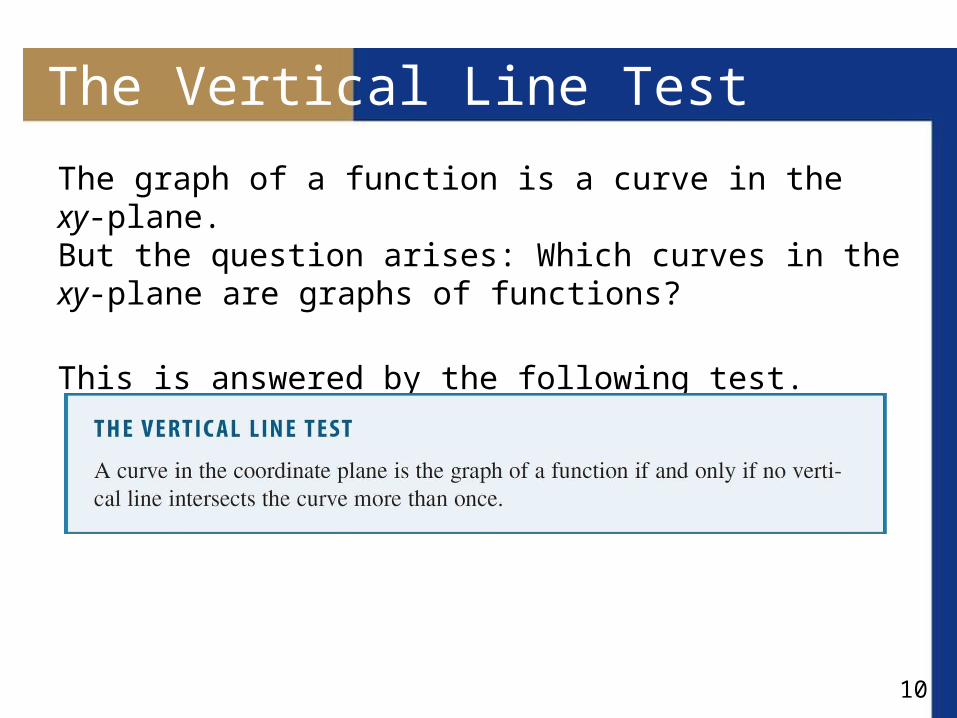
The Vertical Line Test
The graph of a function is a curve in the xy-plane. But the question arises: Which curves in the xy-plane are graphs of functions?
This is answered by the following test.

11
The Vertical Line Test
We can see from Figure 10 why the Vertical Line Test is true.
Not a graph of a functionGraph of a function
Figure 10
Vertical Line Test

12
The Vertical Line Test
If each vertical line x = a intersects a curve only once at (a, b), then exactly one functional value is defined byf (a) = b.
But if a line x = a intersects the curve twice, at (a, b) and at (a, c), then the curve cannot represent a function because a function cannot assign two different values to a.

13
Example 8 – Using the Vertical Line Test
Using the Vertical Line Test, we see that the curves in parts (b) and (c) of Figure 11 represent functions, whereas those in parts (a) and (d) do not.
(a) (d)(c)(b)
Figure 11

14
Equations That Define Functions
Any equation in the variables x and y defines a relationship between these variables. For example, the equation
y – x2 = 0
defines a relationship between y and x. Does this equation define y as a function of x? Solve for y
y = x2
We see that the equation defines a rule, or function, that gives one value of y for each value of x. We can express this rule in function notation as f (x) = x2

15
Example 9 –Does the equation Define y as a Function of x?
(a) y – x2 = 2 (b) x2 + y2 = 4
Solution:(a) Solving for y in terms of x gives y = x2 + 2
Which gives 1 value of y for each value of x, it defines y as a function of x. We can write as f (x) = x2 + 2.
(b) x2 + y2 = 4 Solve for y in terms of x; y2 = 4 – x2
y =
This gives two values of y for a given value of x. The equation does not define y as a function of x.

16
Equations That Define Functions
The graphs of the equations in Example 9 are shown in Figure 12.
The Vertical Line Test shows graphically that the equation in Example 9(a) defines a function but the equation in Example 9(b) does not.
(a) (b)Figure 12
17
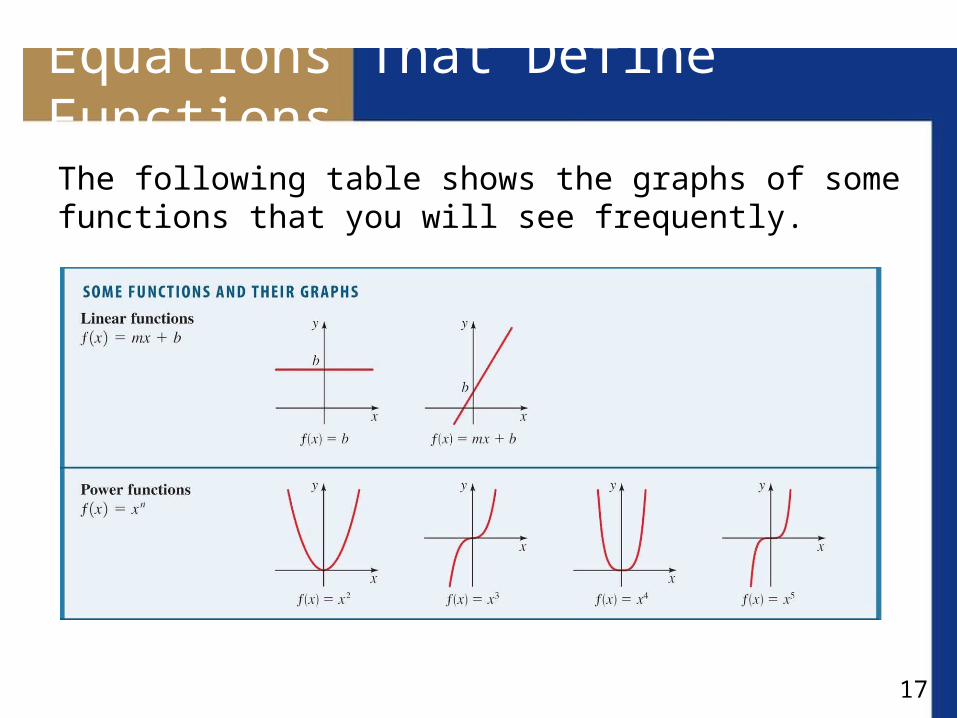
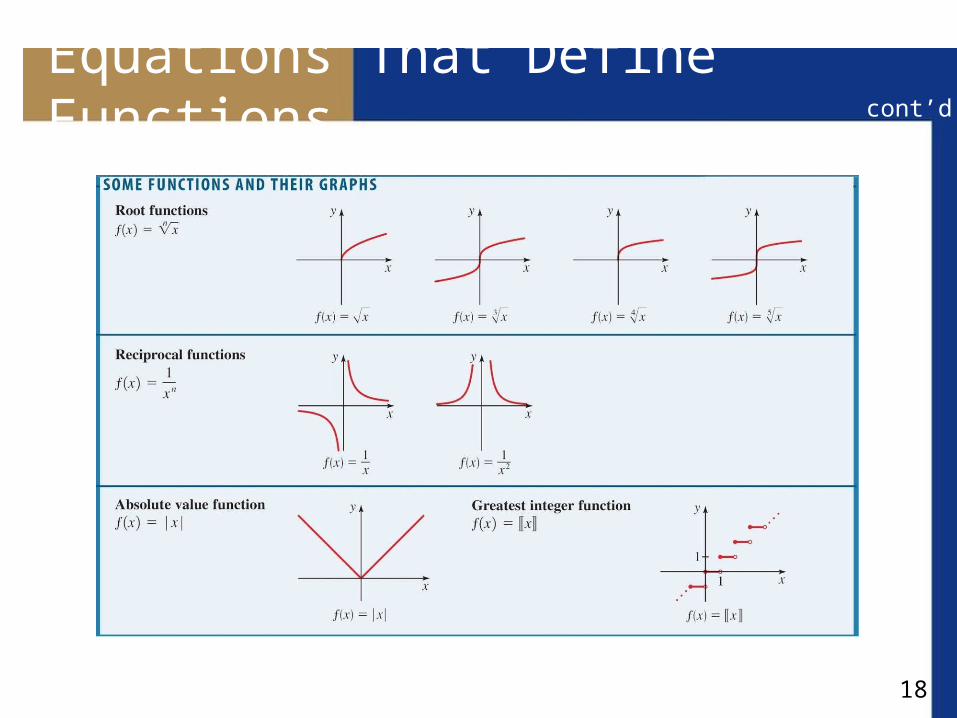
Equations That Define Functions
The following table shows the graphs of some functions that you will see frequently.
18
Equations That Define Functions
cont’d
Related Documents