UNIT 9 REVIEW

1. Gold 2. Green 3. Purple 4. Pink 5. Gray 1. 48 2. 15 3. 65 4. 33.
Dec 13, 2015
Welcome message from author
This document is posted to help you gain knowledge. Please leave a comment to let me know what you think about it! Share it to your friends and learn new things together.
Transcript

UNIT 9 REVIEW

Please select a Team.
1 2 3 4 5
0% 0% 0%0%0%
1. Gold2. Green3. Purple4. Pink5. Gray

Angela and Carl sell computers at a computer store. The box plots in Figure 2 summarize
the computers sold by each employee during each of the last 12 months. What is Carl’s
interquartile range?
1 2 3 4
0% 0%0%0%
1. 482. 153. 654. 33

The golf scores of the members of a golf team for 18 holes were 89, 90, 87, 95, 86, 102, 79, and 108. What is the
mean absolute deviation of the scores?
1. 2. 3. 4
0% 0%0%0%
1. 7.252. 9.23. 72.54. 92

Representative samples of populations can BEST be obtained through…
1 2 3 4
0% 0%0%0%
1. Convenience Sampling2. Systematic Sampling3. Voluntary-Response 4. Random Sampling

In a random sample, 300 students are surveyed from a school population of 1,500 students to determine how many students would buy a slice of pizza on pizza day in the cafeteria. 200 of the 300 students sampled said
that they would buy a slice of pizza on pizza day. Based on this information, about how many slices of pizza will the cafeteria need to have enough slices of pizza for the total school population of students on
pizza day?
1 2 3 4
0% 0%0%0%
1. 12002. 10003. 8004. 600

Team Scores
4 Purple
4 Pink
3.75 Gray
3.67 Gold
3.57 Green

What percentage of your current points would you like
to wager on the next question?
1. 0%2. 25%3. 50%4. 75%5. 100%

Which data set has a mean absolute deviation of 9.2?
1 2 3 4
0% 0%0%0%
1. 90, 75, 85, 100, 80
2. 100, 90, 65, 90, 100
3. 70, 80, 95, 100, 85
4. 95, 100, 75, 80, 75

Team Scores
8.83 Purple
8.33 Gold
7.5 Gray
5.93 Green
5.67 Pink

7th graders at CCMS conducted a survey of all teachers in their school to determine their ages. The mean age for the teacher group was found to be 32 years old with a mean
absolute deviation of 4. Which of the following statements is true about the
teacher ages?
1 2 3
0% 0%0%
1. Most of the teachers are 32, but some are 28 and 36 years old.
2. The average age of the teachers is 32 and the average of all the differences is between each teacher’s age and the mean is 4 years.
3. The range in age is from 28 to 36 years old.
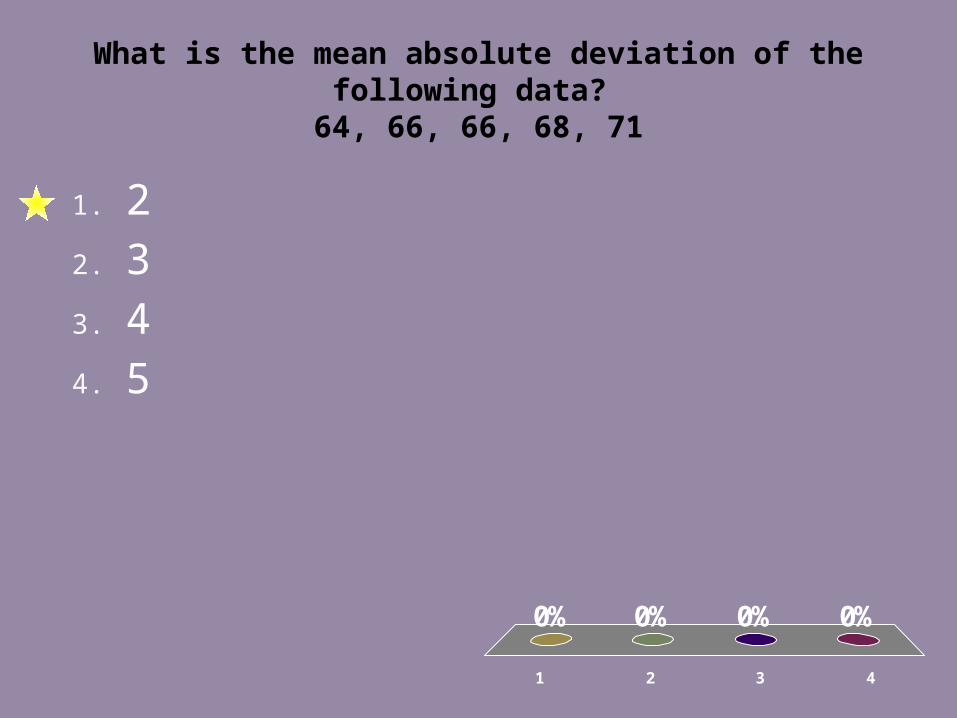
What is the mean absolute deviation of the following data?
64, 66, 66, 68, 71
1 2 3 4
0% 0%0%0%
1. 22. 33. 44. 5

What is the IQR of the following data set?
$8.50, $8.50, $10.00, $5.50, $7.40, $8.00
1. 2. 3. 4
0% 0%0%0%
1. 4.52. 1.13. 6.94. 2

What is the differences of the means of the two data sets?
Set A: 10, 10, 11, 11, 11, 12, 12, 12, 13, 13
Set B: 7, 9, 10, 11, 11, 12, 12, 13, 14, 16
1. 2. 3 4
0% 0%0%0%
1. 1.62. 1.93. 04. 2

Describe the overlap.
1 2 3
0% 0%0%
1. Almost Complete Overlap
2. Little Overlap3. No Overlap

Team Scores
12.83 Purple
12.33 Gold
11.63 Gray
9.79 Green
9.24 Pink

What percentage of your current points would you like
to wager on the next question?
1. 0%2. 25%3. 50%4. 75%5. 100%

Set A: 15, 16, 17, 18, 20, 20, 21Set B: 10, 10, 11, 12, 12, 13, 14, 14
About how many times greater is the mean absolute deviation of data set A?
1 2 3 4
0% 0%0%0%
1. 1 times2. 1.5 times3. 2.0 times4. 2.5 times

Team Scores
18.67 Gold
17.67 Purple
16.99 Pink
16.25 Gray
14.32 Green

Fastest Responders (in seconds)
89.37 Participant 10
134.29 Participant 31
172.38 Participant 18
208.15 Participant 2
209.09 Participant 14

Participant Scores
29 Participant 19
29 Participant 4
29 Participant 9
29 Participant 29
29 Participant 3
Related Documents