1 GEM IWG INTERNATIONAL CONFERENCE 2009 `` PRECARIOUS WORK, PRECARIOUS LIFE: INTERACTIONS BETWEEN PAID AND UNPAID WORK FOR WOMEN IN ECUADOR BEFORE AND DURING RECENT ECONOMIC CRISIS Alison Vásconez Rodríguez

1 GEM IWG INTERNATIONAL CONFERENCE 2009 `` PRECARIOUS WORK, PRECARIOUS LIFE: INTERACTIONS BETWEEN PAID AND UNPAID WORK FOR WOMEN IN ECUADOR BEFORE AND.
Dec 14, 2015
Welcome message from author
This document is posted to help you gain knowledge. Please leave a comment to let me know what you think about it! Share it to your friends and learn new things together.
Transcript

1
GEM IWG INTERNATIONAL CONFERENCE 2009
``
PRECARIOUS WORK, PRECARIOUS LIFE:
INTERACTIONS BETWEEN PAID AND UNPAID WORK
FOR WOMEN IN ECUADOR BEFORE AND
DURING RECENT ECONOMIC CRISISAlison Vásconez
Rodríguez

2
Feminist economics describes the relationship between Feminist economics describes the relationship between labour precariousness and the accumulation regime as a labour precariousness and the accumulation regime as a conflictive process between production and reproduction conflictive process between production and reproduction
spheres. spheres.
CONCEPTUAL FRAMEWORKCONCEPTUAL FRAMEWORK
Reproduction of the labour force
- Sexual division of work
- Time poverty
- Unequal decisions
- Unequal power/entitlements
Reproduction of the labour force
- Sexual division of work
- Time poverty
- Unequal decisions
- Unequal power/entitlements
Labour Force(includes unpaid
transferred value)
Labour Force(includes unpaid
transferred value)
Longer unemployment spells
Longer unemployment spellsHigher mobilityHigher mobility
< Op. Cost< Op. Cost
Expensive demands on employers
Expensive demands on employers
SubsistenceWage under its real value
No labour supply of domestic workers
No labour supply of domestic workers
“Non-active” in lab. market
- Entrance barriers-Precarious conditions-Discrimination
Transferred assumed roles
Transferred assumed roles

3
HISTORIAL FACTSHISTORIAL FACTS
WomenWomen’’s s participatiparticipati
on and on and employmeemployme
nt nt variations variations
more more unstableunstable
Ecuador: Participación laboral
30%
40%
50%
60%
70%
80%
90%1988
1989
1990
1991
1992
1993
1994
1995
1996
1997
1998
1999
2000
2001
2002
2003
2004
2005
2006
2007
Tasa g
lob
al
MUJERES HOMBRES
Ecuador: Evolución de la Participación Laboral
-15%
-10%
-5%
0%
5%
10%
15%
20%
1989
1990
1991
1992
1993
1994
1995
1996
1997
1998
1999
2000
2001
2002
2003
2004
2005
2006
Cre
cim
ien
to p
arit
icip
ació
n
-8%
-6%
-4%
-2%
0%
2%
4%
6%
Cre
cim
ien
to P
IB
MUJERES HOMBRES PIB

4
HISTORICAL FACTSHISTORICAL FACTS
Underemployment Underemployment raised on crisis. It raised on crisis. It differs between differs between women and men women and men since then.since then.Economic Economic stabilization via stabilization via precarious precarious employmentemployment
Ecuador: Subempleo
35%
40%
45%
50%
55%
60%
65%
Mujeres Hombres
Ecuador: Unemployment
0%
5%
10%
15%
20%
25%Ta
sa d
esem
pleo
0
0,5
1
1,5
2
2,5
3
Des
empl
eo M
/H
MUJERES HOMBRES brecha

5
Ecuador: unemployment
0,0%
2,0%
4,0%
6,0%
8,0%
10,0%
12,0%
dec_07 mar_08 jun_08 sep_08 dic_08 mar_09
Unemployment Men
Unemployment Women
CRISIS PERIODCRISIS PERIOD
Ecuador: labour supply
0,0%10,0%20,0%30,0%40,0%50,0%60,0%70,0%80,0%90,0%
100,0%
dec_07 mar_08 jun_08 sep_08 dic_08 mar_09
Supply Men
Supply Women
Ecuador: Underemployment
0,0%
10,0%
20,0%
30,0%
40,0%
50,0%
60,0%
70,0%
dec_07 mar_08 jun_08 sep_08 dic_08 mar_09
Underemployment Men
Underemployment Women
Gapwidens

6
FACTSFACTSDOMESTIC UNPAID CARE WORKDOMESTIC UNPAID CARE WORK
•97% are women, 60% >15 is also involved in market labour. •hours-per week: women’s domestic care work is 3 times that of men.•Women dedicate more time to work (paid and unpaid domestic) during their whole lifetime.
•97% are women, 60% >15 is also involved in market labour. •hours-per week: women’s domestic care work is 3 times that of men.•Women dedicate more time to work (paid and unpaid domestic) during their whole lifetime.
Ecuador: Dedication to domestic unpaid care work
05
101520
2530
3540
2005 Dec_07 Jun_08 Dec_08 Mar_09
ho
urs
pe
r w
ee
k
Men
Women
Ecuador: Dedication to market labour
32
34
36
38
40
42
44
46
2005 Dec_07 Jun_08 Dec_08 Mar_09
ho
urs
per
wee
k
Men
Women
2005 Dec_07 Jun_08 Dec_08 Mar_09Exclusive
care work>15Exclusive care work/
inactive
Exclusive care work>15
Exclusive care work/
inactive
Exclusive care work>15
Exclusive care work/
inactive
Exclusive care work>15
Exclusive care work/
inactive
Exclusive care work>15
Exclusive care work/
inactiveMen 0% 1% 0,23% 1,35% 0,09% 0,56% 0,11% 0,58% 0,08% 0,34%women 32% 63% 30,63% 66,11% 27,81% 62,86% 27,63% 63,51% 28,03% 56,80%

7
Ecuador: Dedicación al trabajo no pagado (no exclusivo) por carga de
trabajo mercantil
0
5
10
15
20
25
30
35
40
Menos de 20 20-40 horas 40-50 horas Mas de 50horas
Horas por semana (Mencantil)
Ho
ras
po
r se
man
a (T
NP
)
Mujeres
Hombres
Not clear trade-off
Not clear trade-off
FACTSFACTSDOMESTIC UNPAID CARE WORKDOMESTIC UNPAID CARE WORK
Ecuador: Dedicación al trabajo por nivel de ingreso del hogar
05
101520253035404550
1 2 3 4 5 1 2 3 4 5
Doméstico no remunerado Del mercado
Quintil de ingreso
Ho
ras p
or
sem
an
a
Hombres
Mujeres
Ecuador: Dedication to work per income level
Income QuintilesMarket work
Unpaid domestic
Hou
rs p
er
week
Relation with poverty
Relation with poverty

8
Determinants of domestic work load (1)Determinants of domestic work load (1)
2 Models (dependent):1. Distribution of work load: gap carer /others2. Own time restriction: work load/disposable time
Especification 1 Especification 2 Especification 3Labour and income With human capital With demographic
unemploy_carer unemploy_carer unemploy_carerformal_carer formal_carer formal_carerformal_head formal_head formal_headunder_carer under_carer under_carerunder_head under_head under_heademployment_child_16 employment_child_16 employment_child_16Quintil1_Y_hh Quintil1_Y_hh Quintil1_Y_hhQuintil2_Y_hh Quintil2_Y_hh Quintil2_Y_hhQuintil5_Y_hh Quintil5_Y_hh Quintil5_Y_hhIncome_carer Income_carer Income_careragriculture_head agriculture_head agriculture_headagriculture_carer agriculture_carer agriculture_carerindustry_carer industry_carer industry_carercommerce_carer commerce_carer commerce_carerpers_service_carer pers_service_carer pers_service_carerhouse_worker_carer house_worker_carer house_worker_carernoplace_worker_carer noplace_worker_carer noplace_worker_carerhouse_worker_head house_worker_head house_worker_headnoplace_worker_head noplace_worker_head noplace_worker_head
high_educ_carer high_educ_carerhigh_educ_head high_educ_head
Age_carerage2_carermenor_5_summonoparentalurbancoastindigenous
9
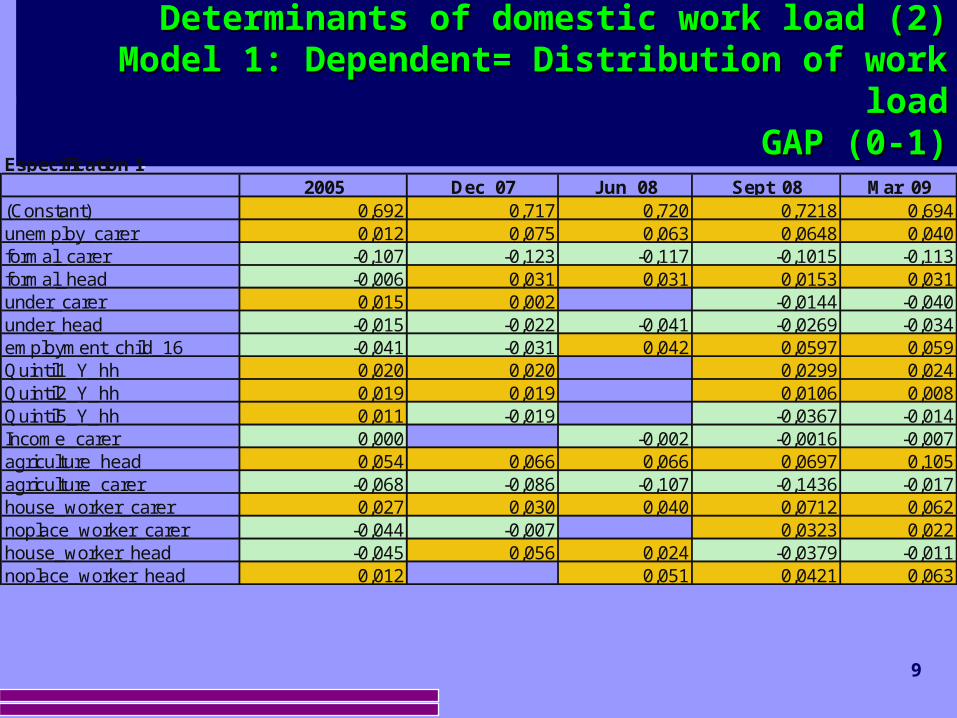
Determinants of domestic work load (2)Determinants of domestic work load (2)Model 1: Dependent= Distribution of work Model 1: Dependent= Distribution of work
loadloadGAP (0-1)GAP (0-1)
Especification 12005 Dec_07 Jun_08 Sept_08 Mar_09
(Constant) 0,692 0,717 0,720 0,7218 0,694unemploy_carer 0,012 0,075 0,063 0,0648 0,040formal_carer -0,107 -0,123 -0,117 -0,1015 -0,113formal_head -0,006 0,031 0,031 0,0153 0,031under_carer 0,015 0,002 -0,0144 -0,040under_head -0,015 -0,022 -0,041 -0,0269 -0,034employment_child_16 -0,041 -0,031 0,042 0,0597 0,059Quintil1_Y_hh 0,020 0,020 0,0299 0,024Quintil2_Y_hh 0,019 0,019 0,0106 0,008Quintil5_Y_hh 0,011 -0,019 -0,0367 -0,014Income_carer 0,000 -0,002 -0,0016 -0,007agriculture_head 0,054 0,066 0,066 0,0697 0,105agriculture_carer -0,068 -0,086 -0,107 -0,1436 -0,017house_worker_carer 0,027 0,030 0,040 0,0712 0,062noplace_worker_carer -0,044 -0,007 0,0323 0,022house_worker_head -0,045 0,056 0,024 -0,0379 -0,011noplace_worker_head 0,012 0,051 0,0421 0,063

10
Determinants of domestic work load (2)Determinants of domestic work load (2)Model 1: Dependent= Distribution of work Model 1: Dependent= Distribution of work
loadloadGAP (0-1)GAP (0-1)
• Women unemployment 1,2% - 4% peak September 6,5%• Formality of men: reduced gap in 2005, increases after,
deepen in crisis• Employment children (16-17): entering as substitute labour
force, increases gap: 5,9% (due to absence)• Underemployment: 3 – 4%
• Income: 2005, no differentiation, during crisis: reduction in 5th quintile (1,4%)
• Own income: reduces gap, consistent but low, 0,2-0,7%
• Agriculture head: increases in 10%(growing) – related with rural families and to precarious jobs of men
• Agriculture carer: decreases (but less in crisis)
• House work (woman): increases, consistently: 2 6%• No place: increases consistently
11
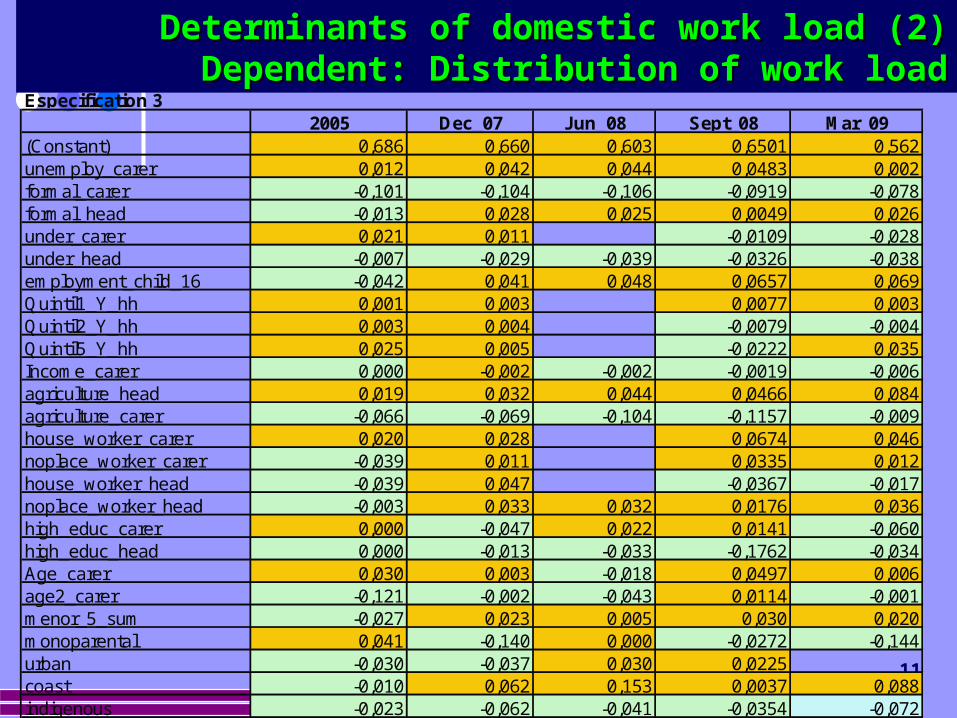
Determinants of domestic work load (2)Determinants of domestic work load (2)Dependent: Distribution of work loadDependent: Distribution of work load
Especification 32005 Dec_07 Jun_08 Sept_08 Mar_09
(Constant) 0,686 0,660 0,603 0,6501 0,562unemploy_carer 0,012 0,042 0,044 0,0483 0,002formal_carer -0,101 -0,104 -0,106 -0,0919 -0,078formal_head -0,013 0,028 0,025 0,0049 0,026under_carer 0,021 0,011 -0,0109 -0,028under_head -0,007 -0,029 -0,039 -0,0326 -0,038employment_child_16 -0,042 0,041 0,048 0,0657 0,069Quintil1_Y_hh 0,001 0,003 0,0077 0,003Quintil2_Y_hh 0,003 0,004 -0,0079 -0,004Quintil5_Y_hh 0,025 0,005 -0,0222 0,035Income_carer 0,000 -0,002 -0,002 -0,0019 -0,006agriculture_head 0,019 0,032 0,044 0,0466 0,084agriculture_carer -0,066 -0,069 -0,104 -0,1157 -0,009house_worker_carer 0,020 0,028 0,0674 0,046noplace_worker_carer -0,039 0,011 0,0335 0,012house_worker_head -0,039 0,047 -0,0367 -0,017noplace_worker_head -0,003 0,033 0,032 0,0176 0,036high_educ_carer 0,000 -0,047 0,022 0,0141 -0,060high_educ_head 0,000 -0,013 -0,033 -0,1762 -0,034Age_carer 0,030 0,003 -0,018 0,0497 0,006age2_carer -0,121 -0,002 -0,043 0,0114 -0,001menor_5_sum -0,027 0,023 0,005 0,030 0,020monoparental 0,041 -0,140 0,000 -0,0272 -0,144urban -0,030 -0,037 0,030 0,0225coast -0,010 0,062 0,153 0,0037 0,088indigenous -0,023 -0,062 -0,041 -0,0354 -0,072

12
Determinants of domestic work load (2)Determinants of domestic work load (2)Dependent: Distribution of work loadDependent: Distribution of work load
Adding cultural, location and demographic reduces impact but significance remains
• Women unemployment 1,2% - 4% peak September 5%• Formality of men: trends are the same, but effect reduces to
half• Employment children (16-17): entering as substitute labour
force, increases gap: 6,9% (due to absence), major effect when controlling for other situation variables (shows substitution and sharing)
• Income and Own income: reduces gap, consistent and effect are the same
• Agriculture head: increases in 10%(growing) – labour intensification
• Agriculture carer: decreases (but less in crisis)• Children under 5: same as in 2005 (structural factor
remains, services haven’t changed)• Coast: increases and growing (cultural factor, crisis-related?)• Indigenous: reduces and decreasing (communitary, time-
vision, data?)

13
Determinants of domestic work load (3)Determinants of domestic work load (3)Model 2: Dependent= Own time restriction (%)Model 2: Dependent= Own time restriction (%)
Especification 12005 Dec_07 Jun_08 Sept_08 Mar_09
(Constant) 0,330 0,305 0,337 0,319 0,325unemploy_carer 0,007 0,024 0,011 0,014 0,023formal_carer -0,035 -0,032 -0,051 -0,039 -0,040formal_head 0,020 0,044 0,025 0,021 0,026under_carer 0,016 0,006 0,002 -0,009 -0,012under_head -0,019 0,002 0,005 0,012 0,002employment_child_16 -0,001 -0,015 -0,017 -0,016 -0,018Quintil1_Y_hh 0,043 0,044 0,033 0,075 0,051Quintil2_Y_hh 0,029 0,033 0,031 0,052 0,035Quintil5_Y_hh -0,046 -0,070 -0,053 -0,061 -0,065ingreso_cuidadora_sum 0,000 -0,003 -0,004 -0,008agriculture_head 0,022 0,015 0,002 0,019 -0,005agriculture_carer -0,051 -0,045 -0,065 -0,059 -0,050house_worker_carer 0,006 0,014 0,018 0,019 0,012noplace_worker_carer 0,006 0,000 0,012 0,020 0,017house_worker_head -0,042 -0,020 -0,017 0,004 -0,006noplace_worker_head 0,022 0,019 0,018 0,039 0,014

14
Determinants of domestic work load (3)Determinants of domestic work load (3)Model 2: Dependent= Own time restriction (%)Model 2: Dependent= Own time restriction (%)
• In general: gap is more sensible to variables, own time restriction varies less (basic care load needed, assumed by women): they do not “switch” their time use easily, even other share it (hypothesis)
Major differences:• Income variables become more important: 5% increase by
being in a poor household, 0.8% increase for own income• Working of children reduces load (support for the mother?)• Head/spouse working at home increases load (before it was
ambiguous)

15
Determinants of domestic work load (3)Determinants of domestic work load (3)Model 2: Dependent= Own time restrictionModel 2: Dependent= Own time restriction
Especification 32005 Dec_07 Jun_08 Sept_08 Mar_09
(Constant) 0,301 0,301 0,291 0,280 0,263unemploy_carer 0,006 0,022 0,030 0,026formal_carer -0,035 -0,036 -0,050 -0,036 -0,039formal_head 0,011 0,028 0,012 0,013 0,012under_carer 0,016 0,010 -0,007 -0,006under_head -0,008 0,003 0,007 -0,001employment_child_16 0,005 -0,009 -0,012 -0,016 -0,017Quintil1_Y_hh 0,021 0,016 0,034 0,021Quintil2_Y_hh 0,012 0,017 0,011 0,025 0,015Quintil5_Y_hh -0,027 -0,047 -0,029 -0,035 -0,040ingreso_cuidadora_sum 0,000 -0,007 -0,008 -0,008agriculture_head 0,009 0,011 -0,013 0,010 -0,005agriculture_carer -0,040 -0,046 -0,050 -0,016 -0,033house_worker_carer 0,006 0,022 0,019 -0,050 0,011noplace_worker_carer 0,004 -0,002 0,017 0,012 0,004house_worker_head -0,026 -0,010 0,014 0,000noplace_worker_head 0,011 0,013 0,002 0,001edad_cuidadora_first 0,002 0,001 0,028age2_carer 0,000 0,000 -0,011 0,002menor_5_sum 0,042 0,046 0,033 0,045 0,057monoparental -0,017 -0,037 0,000 0,046 -0,029urban 0,013 0,003 0,045 -0,026coast 0,019 0,004 -0,032 0,071indigenous -0,021 -0,035 -0,012 -0,038 -0,024high_educ_carer -0,016 -0,018 -0,049 -0,014 -0,015high_educ_head -0,005 -0,023 -0,019

16
Determinants of domestic work load (3)Determinants of domestic work load (3)Model 2: Dependent= Own time restrictionModel 2: Dependent= Own time restriction
• Major differences:Urban and coast become irrelevant (effect of crisis)Income becomes more important 0.8% (own income), and
differences with rich women deepenHead/spouse Underemployment appears as important,
increasing load
In Crisis period:
• Unemployment highly associated with intrahousehold gaps and time restriction (transmission of market crisis): more intensity but less people dedicated (systemic crisis is a care crisis as well)
• Important poverty at household level (even more than own income).
• Domestic own load (in favor of disposable time) is hard to be reduced in critical periods. Cultural factors important for gaps mostly
Income related crisis, pollarization, potential precariousness circle (care crisis)

17
Thank youThank you
Related Documents