1/f Neural Noise Reduction and Spike Feature Extraction Using a Subset of Informative Samples ZHI YANG, 1,2 LINH HOANG, 1 QI ZHAO, 3 EDWARD KEEFER, 4 and WENTAI LIU 1 1 Department of Electrical Engineering, University of California at Santa Cruz, Santa Cruz, CA, USA; 2 Department of Electrical and Computer Engineering, National University of Singapore, Singapore, Singapore; 3 Division of Biology, California Institute of Technology, Pasadena, CA, USA; and 4 Plexon Inc., Dallas, TX, USA (Received 1 September 2010; accepted 3 November 2010; published online 18 November 2010) Associate Editor Angelique Louie oversaw the review of this article. Abstract—This article describes a study on neural noise and neural signal feature extraction, targeting real-time spike sorting with miniaturized microchip implementation. Neuro- nal signature, noise shaping, and adaptive bandpass filtering are reported as the techniques to enhance the signal-to-noise ratio (SNR). A subset of informative samples of the wave- forms is extracted as features for classification. Quantitative and comparative experiments with both synthesized and animal data are included to evaluate different feature extraction approaches. In addition, a preliminary hardware implementation has been realized using an integrated circuit. Keywords—Spike sorting, Spike feature extraction, Cluster- ing, Action potential. INTRODUCTION Real-time extraction of information from composite neural recordings is a significant challenge in neural interfacing. Developing integrated circuit (IC) to enable portable and implantable systems is important to allow the study of complex behavior in neuroscience experiments, closed loop deep brain stimulation and cortical controlled neuromuscular prostheses. In order for a spike feature extraction algorithm to be func- tional as a small device with real-time low-latency processing and low-power operation, it must be effi- cient in both computation and IC implementation. Implementing spike sorting before data telemetry offers many significant advantages. Spike feature extraction provides the necessary information required to sort spikes from raw sampled data. With this information, each spike event can be represented by its unique features and firing time, resulting in significant data compression. A data transceiver designed with the current semiconductor technology can simultaneously support a large number of recording channels for a microchip implementation to extract the spike fea- ture. 4,15 System integration using wireless power telemetry or a rechargeable battery as well as wireless data telemetry removes the need for tethering wires. As a result, a fully wireless operation would relieve the subjects’ overall stress factor and allow them to move freely in their natural environment. Frequently used spike feature extraction algorithms include Principal Components Analysis (PCA), 40,50 Bayesian algorithm, 24 template matching, 25,43,44,49 wavelets, 23,30,31 Independent Component Analy- sis 28,35,37–39 (ICA), and inter-spike interval-based algorithms. 10,26,27 These all demand significant com- putation. Efforts to improve the efficiency of these algorithms have been reported; however, these approaches either rely on an over simplified function- ality or use a hardware system that consumes too much power and space. In part, complex algorithm procedures 1,20,34 are applied to mediate the effects of noise and distortion in the recording process. Noise sources include ion channel noise, 11 activity from distant neurons, low- frequency field potentials, 36 thermal noise and circuit noise. Significant sampling distortion is also present since it is unrealistic to synchronize the sampling clock with individual spikes. This article reports a new spike feature extraction algorithm which is suitable for real-time, low-latency spike sorting and enables IC implementation. ‘‘Over- view of the Work’’ section gives overview of the work. ‘‘Similar Neurons, Noise, and Sampling Distortion’’ section describes spike waveform difference, noise, and distortion. ‘‘Sample Information’’ and ‘‘Enhancing SNR Using Noise Shaping Filter’’ sections focus on the selection of ‘‘informative samples.’’ ‘‘Experiments’’ Address correspondence to Zhi Yang, Department of Electrical Engineering, University of California at Santa Cruz, Santa Cruz, CA, USA. Electronic mail: [email protected] Annals of Biomedical Engineering, Vol. 39, No. 4, April 2011 (ȑ 2010) pp. 1264–1277 DOI: 10.1007/s10439-010-0201-5 0090-6964/11/0400-1264/0 ȑ 2010 Biomedical Engineering Society 1264

Welcome message from author
This document is posted to help you gain knowledge. Please leave a comment to let me know what you think about it! Share it to your friends and learn new things together.
Transcript
1/f Neural Noise Reduction and Spike Feature Extraction
Using a Subset of Informative Samples
ZHI YANG,1,2 LINH HOANG,1 QI ZHAO,3 EDWARD KEEFER,4 and WENTAI LIU1
1Department of Electrical Engineering, University of California at Santa Cruz, Santa Cruz, CA, USA; 2Department of Electricaland Computer Engineering, National University of Singapore, Singapore, Singapore; 3Division of Biology, California Institute
of Technology, Pasadena, CA, USA; and 4Plexon Inc., Dallas, TX, USA
(Received 1 September 2010; accepted 3 November 2010; published online 18 November 2010)
Associate Editor Angelique Louie oversaw the review of this article.
Abstract—This article describes a study on neural noise andneural signal feature extraction, targeting real-time spikesorting with miniaturized microchip implementation. Neuro-nal signature, noise shaping, and adaptive bandpass filteringare reported as the techniques to enhance the signal-to-noiseratio (SNR). A subset of informative samples of the wave-forms is extracted as features for classification. Quantitativeand comparative experiments with both synthesized andanimal data are included to evaluate different featureextraction approaches. In addition, a preliminary hardwareimplementation has been realized using an integrated circuit.
Keywords—Spike sorting, Spike feature extraction, Cluster-
ing, Action potential.
INTRODUCTION
Real-time extraction of information from compositeneural recordings is a significant challenge in neuralinterfacing. Developing integrated circuit (IC) toenable portable and implantable systems is importantto allow the study of complex behavior in neuroscienceexperiments, closed loop deep brain stimulation andcortical controlled neuromuscular prostheses. In orderfor a spike feature extraction algorithm to be func-tional as a small device with real-time low-latencyprocessing and low-power operation, it must be effi-cient in both computation and IC implementation.
Implementing spike sorting before data telemetryoffers many significant advantages. Spike featureextraction provides the necessary information requiredto sort spikes from raw sampled data. With thisinformation, each spike event can be represented by itsunique features and firing time, resulting in significant
data compression. A data transceiver designed with thecurrent semiconductor technology can simultaneouslysupport a large number of recording channels for amicrochip implementation to extract the spike fea-ture.4,15 System integration using wireless powertelemetry or a rechargeable battery as well as wirelessdata telemetry removes the need for tethering wires. Asa result, a fully wireless operation would relieve thesubjects’ overall stress factor and allow them to movefreely in their natural environment.
Frequently used spike feature extraction algorithmsinclude Principal Components Analysis (PCA),40,50
Bayesian algorithm,24 template matching,25,43,44,49
wavelets,23,30,31 Independent Component Analy-sis28,35,37–39 (ICA), and inter-spike interval-basedalgorithms.10,26,27 These all demand significant com-putation. Efforts to improve the efficiency of thesealgorithms have been reported; however, theseapproaches either rely on an over simplified function-ality or use a hardware system that consumes too muchpower and space.
In part, complex algorithm procedures1,20,34 areapplied to mediate the effects of noise and distortion inthe recording process. Noise sources include ionchannel noise,11 activity from distant neurons, low-frequency field potentials,36 thermal noise and circuitnoise. Significant sampling distortion is also presentsince it is unrealistic to synchronize the sampling clockwith individual spikes.
This article reports a new spike feature extractionalgorithm which is suitable for real-time, low-latencyspike sorting and enables IC implementation. ‘‘Over-view of the Work’’ section gives overview of the work.‘‘Similar Neurons, Noise, and Sampling Distortion’’section describes spike waveform difference, noise, anddistortion. ‘‘Sample Information’’ and ‘‘EnhancingSNR Using Noise Shaping Filter’’ sections focus onthe selection of ‘‘informative samples.’’ ‘‘Experiments’’
Address correspondence to Zhi Yang, Department of Electrical
Engineering, University of California at Santa Cruz, Santa Cruz,
CA, USA. Electronic mail: [email protected]
Annals of Biomedical Engineering, Vol. 39, No. 4, April 2011 (� 2010) pp. 1264–1277
DOI: 10.1007/s10439-010-0201-5
0090-6964/11/0400-1264/0 � 2010 Biomedical Engineering Society
1264
section presents experimental results. ‘‘Conclusion’’section concludes the work.
OVERVIEW OF THE WORK
Variable Selection Techniques
As a complementary approach to dimensionalityreduction algorithms, Jolliffe discussed a general fea-ture extraction algorithm based on a subset of samplesin a classic work.19 This concept requires only a subsetof samples containing the necessary information tocluster the data, as opposed to using all of the samples.These informative samples are especially useful in thepresence of single prominent sample set.
There are two challenges facing a sample selectionalgorithm. The first challenge is the computationalburden to select informative samples. If the trainingprocedure is as complicated as suggested in Jolliffe,19 itwould prohibit microchip implementation for implantpurposes. The power and area are the primary prob-lems with the microchip implementation of other spikefeature extraction algorithms. The second challenge isthe availability of localized features. Improved per-formance compared to PCA is unlikely if localizedfeatures are not prominent.
Our Approach
We have developed a spike feature extractionalgorithm based on informative samples.48 The theo-retical framework includes neuronal signature, noiseshaping, and informative sample selection. By evalu-ating neuronal geometry signatures with the com-partment model, we find that improved differentiationamong similar spikes can be achieved by appropri-ately emphasizing signal spectrum.47 Studying thenoise properties has revealed that a frequency shapingfilter can be used to boost the signal-to-noise ratio(SNR).46 The sample selection technique using esti-mated entropy identifies informative samples forsorting spikes. In addition, a preliminary IC imple-mentation of the algorithm has been recently fabri-cated6 and being integrated onto a multi-channelneural recording IC.5
SIMILAR NEURONS, NOISE,
AND SAMPLING DISTORTION
Neuronal Signature
In this section, we briefly describe an analyticalmodel for extracellular spike, based on which we studythe spike waveform difference.
Assume that both the intra- and extra-fluids areneutral, the induced voltage waveform is18
V r0!; t� �
¼Z
jm r!; t� �
4pre r!� r0!�� ��dr; ð1Þ
where jm is the transmembrane current and re is theconductivity of the tissue environment; r0
! and r!represent the locations of the point electrode and theactive membrane segment, respectively.
Since action potentials propagate along the axonalbranches (averaged 0.5–2 ms21 3,16,17), the recordedactive membranes usually do not fire simultaneously.As a result, the detailed geometry of the underlyingneuron may influence the shape of spikes. Followingthe computational model described in Greenberget al.,12 Rattay et al.,32 Traub et al.,41 Tuckwell,42 aneuron is modeled as compartment elements. Anextracellular electrode only records those membranesegments within the recording radius (measured to betens of micrometers2) and can be modeled as one orfew compartments with uniform ion channel densities.Derived from Eq. (1), the spike waveform is expressedas the convolution of the transmembrane currentprofile and an implicit geometry kernel function
VðtÞ ¼Z1
�1
jmðsÞWðt� sÞds; ð2Þ
where W(t) is the geometry kernel function determinedby geometry properties of the recorded membranesegments.
According to Eq. (2), the difference between twospikes is
DVðtÞ ¼Z1
�1
½jm1ðsÞ � jm2
ðsÞ�W1ðt� sÞds
þZ1
�1
jm2ðsÞ½W1ðt� sÞ �W2ðt� sÞ�ds: ð3Þ
Equations (1)–(3) can be used to evaluate the spec-trum properties of DV(t), which is helpful for designingan appropriate filter passing band. In the cases the ionchannel populations are similar, DV(t) can have auseful spectrum at a higher frequency point, whichhelps to differentiate similar spike waveforms. In‘‘Appendix’’ section, an analytical approach ofexploring the spectrum of DV(t) is included.
Noise
The recorded neural spikes are superimposed withnoise that exhibits non-Gaussian characteristics.
1/f Neural Noise Reduction and Spike Feature Extraction 1265
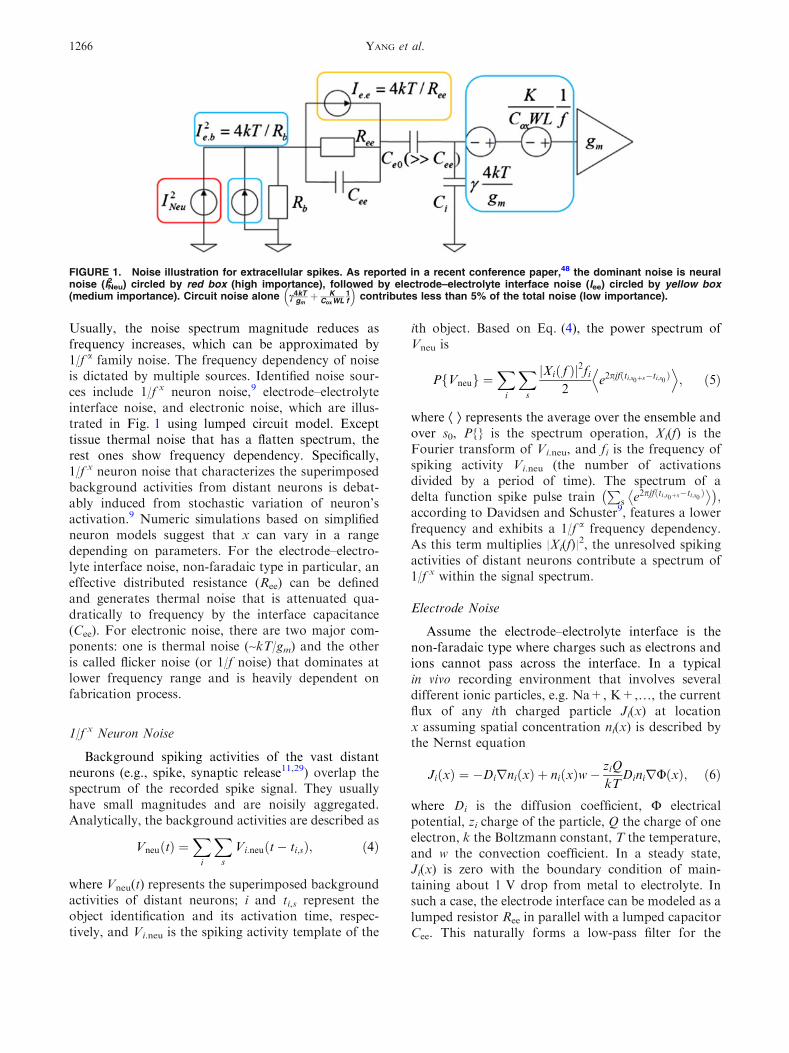
Usually, the noise spectrum magnitude reduces asfrequency increases, which can be approximated by1/f a family noise. The frequency dependency of noiseis dictated by multiple sources. Identified noise sour-ces include 1/f x neuron noise,9 electrode–electrolyteinterface noise, and electronic noise, which are illus-trated in Fig. 1 using lumped circuit model. Excepttissue thermal noise that has a flatten spectrum, therest ones show frequency dependency. Specifically,1/f x neuron noise that characterizes the superimposedbackground activities from distant neurons is debat-ably induced from stochastic variation of neuron’sactivation.9 Numeric simulations based on simplifiedneuron models suggest that x can vary in a rangedepending on parameters. For the electrode–electro-lyte interface noise, non-faradaic type in particular, aneffective distributed resistance (Ree) can be definedand generates thermal noise that is attenuated qua-dratically to frequency by the interface capacitance(Cee). For electronic noise, there are two major com-ponents: one is thermal noise (~kT/gm) and the otheris called flicker noise (or 1/f noise) that dominates atlower frequency range and is heavily dependent onfabrication process.
1/f x Neuron Noise
Background spiking activities of the vast distantneurons (e.g., spike, synaptic release11,29) overlap thespectrum of the recorded spike signal. They usuallyhave small magnitudes and are noisily aggregated.Analytically, the background activities are described as
VneuðtÞ ¼X
i
X
s
Vi:neuðt� ti;sÞ; ð4Þ
where Vneu(t) represents the superimposed backgroundactivities of distant neurons; i and ti,s represent theobject identification and its activation time, respec-tively, and Vi.neu is the spiking activity template of the
ith object. Based on Eq. (4), the power spectrum ofVneu is
PfVneug ¼X
i
X
s
jXið f Þj2fi2
e2pjfðti;s0þs�ti;s0 ÞED; ð5Þ
where Æ æ represents the average over the ensemble andover s0, P{} is the spectrum operation, Xi(f) is theFourier transform of Vi.neu, and fi is the frequency ofspiking activity Vi.neu (the number of activationsdivided by a period of time). The spectrum of adelta function spike pulse train
Ps e2pjfðti;s0þs�ti;s0 Þ
��� �;
according to Davidsen and Schuster9, features a lowerfrequency and exhibits a 1/f a frequency dependency.As this term multiplies |Xi(f)|
2, the unresolved spikingactivities of distant neurons contribute a spectrum of1/f x within the signal spectrum.
Electrode Noise
Assume the electrode–electrolyte interface is thenon-faradaic type where charges such as electrons andions cannot pass across the interface. In a typicalin vivo recording environment that involves severaldifferent ionic particles, e.g. Na+, K+,…, the currentflux of any ith charged particle Ji(x) at locationx assuming spatial concentration ni(x) is described bythe Nernst equation
JiðxÞ ¼ �DirniðxÞ þ niðxÞw�ziQ
kTDinirUðxÞ; ð6Þ
where Di is the diffusion coefficient, F electricalpotential, zi charge of the particle, Q the charge of oneelectron, k the Boltzmann constant, T the temperature,and w the convection coefficient. In a steady state,Ji(x) is zero with the boundary condition of main-taining about 1 V drop from metal to electrolyte. Insuch a case, the electrode interface can be modeled as alumped resistor Ree in parallel with a lumped capacitorCee. This naturally forms a low-pass filter for the
FIGURE 1. Noise illustration for extracellular spikes. As reported in a recent conference paper,48 the dominant noise is neuralnoise (INeu
2 ) circled by red box (high importance), followed by electrode–electrolyte interface noise (Iee) circled by yellow box(medium importance). Circuit noise alone c4kT
gmþ K
CoxWL1f
� �contributes less than 5% of the total noise (low importance).
YANG et al.1266
interface noise. As a result, the induced noise from Ree
at the input of the amplifier is
Nee ¼4kT
ReejReej
1
jxCee
����
���� ðRb þ jxCiÞj j2
¼ 4kT
Ree
1
1=Ree þ jxCee þ 1=ðRb þ 1=jxCiÞ
����
����
2
: ð7Þ
Referring to the hypothesis that the amplifier inputcapacitance (Ci) is sufficiently small, introducing neg-ligible waveform distortion, the integrated noise byelectrode interface satisfies
Zfc2
fc1
Needf �Zfc2
fc1
4kTNee
j1þ 2pjfReeCeejdf<
kT
Cee: ð8Þ
Equation (8) suggests reducing electrode interfacenoise by increasing double layer capacitance (Cee).Without increasing the size of electrodes, carbon-nanotube (CNT) coating21 can dramatically increaseelectrode surface area, thus, reducing the interfacenoise. ‘‘Enhancing SNR Using Noise Shaping Filter’’section will compare conventional electrodes andCNT-coated electrodes from a noise point of view.
In regions away from the interface boundary,�ni(x) = 0 results in a flattened noise spectrum. Here,we use a lumped bulk resistance Rb in series with thedouble-layer interface for modeling noise
Neb ¼ 4kTRb ¼ 4kTvqtissue
prs; ð9Þ
where Rb is the bulk resistance, qtissue is the electrolyteresistivity, rs is the radius of the electrode, and v is aconstant that relates to the electrode geometry. Asgiven in Wiley and Webster45, v � 0.5 for a plateelectrode.
Electronic Noise
Noise generated by electronics can be predicted bycircuit design tools and validated through measure-ments. At the frequency of interest, there are twomajor components: thermal noise of transistors andflicker noise
Nelectronic ¼ Ncthermal þNcflickter ¼ c4kT
gmþ K
CoxWL
1
f;
ð10Þ
where Ncthermal is the circuit thermal noise, Ncflicker theflicker noise, gm the transconductance of the amplifier(¶iout/¶vin), c a circuit architecture-dependent constanttypically <4, K a process-dependent constant on theorder of 10225 V2,33 Cox the transistor gate capacitancedensity, and W and L the transistor width and length,
respectively. Thermal noise can be reduced byincreasing transconductance (gm), which is linearlyproportional to power consumption. Flicker noise canbe reduced using design techniques such as large sizeinput transistors and chopper modulations. In a sense,circuit noise can be used to trade off circuit power andarea.
Total Noise
The noise sources as shown in Fig. 1 include unre-solved neuron activities (Nneu), electrode–electrolyteinterface noise (Nee), thermal noise from the electrolytebulk (Neb) and active circuitry (Ncthermal), and flickernoise (Ncflicker). The noise spectrum is empirically fittedby
NðfÞ ¼Nneu þNee þNeb þNcthermal
þNcflicker �N1
fxþN0 ð11Þ
where N1/fx and N0 represent the frequency dependent
and flat terms, respectively. Equation (11) describes acombination of both colored noise (1/f x) and broadband noise.
Sampling Distortion
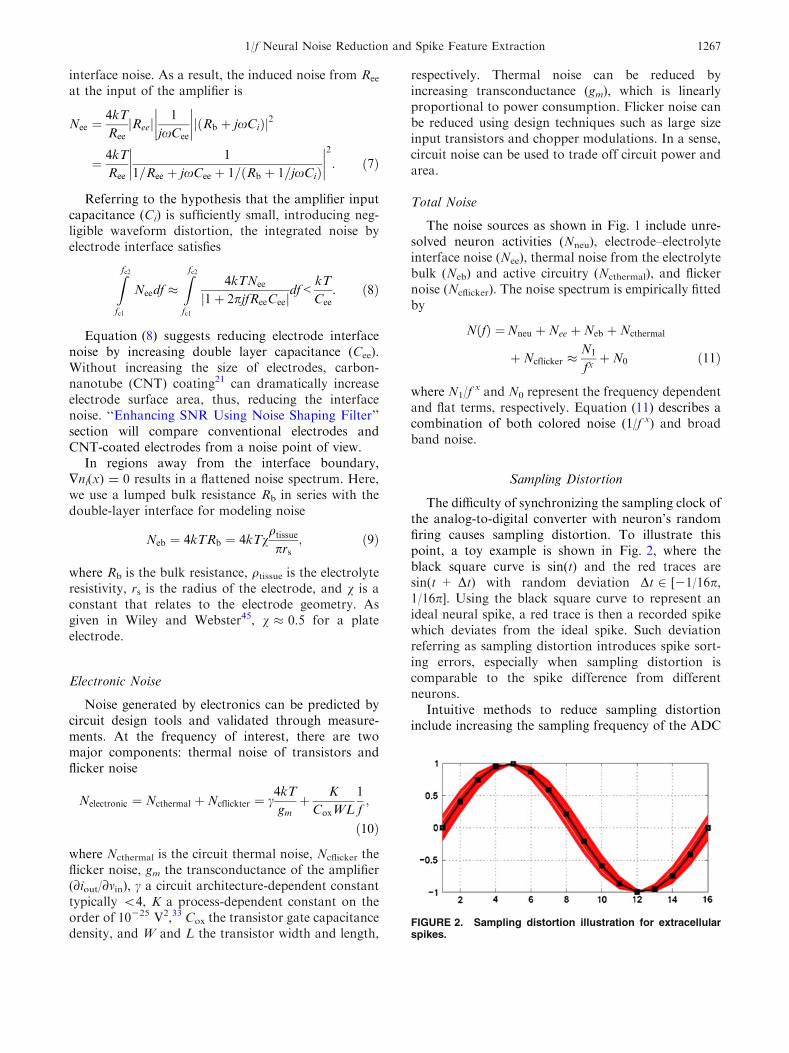
The difficulty of synchronizing the sampling clock ofthe analog-to-digital converter with neuron’s randomfiring causes sampling distortion. To illustrate thispoint, a toy example is shown in Fig. 2, where theblack square curve is sin(t) and the red traces aresin(t + Dt) with random deviation Dt 2 [21/16p,1/16p]. Using the black square curve to represent anideal neural spike, a red trace is then a recorded spikewhich deviates from the ideal spike. Such deviationreferring as sampling distortion introduces spike sort-ing errors, especially when sampling distortion iscomparable to the spike difference from differentneurons.
Intuitive methods to reduce sampling distortioninclude increasing the sampling frequency of the ADC
FIGURE 2. Sampling distortion illustration for extracellularspikes.
1/f Neural Noise Reduction and Spike Feature Extraction 1267

or performing interpolation and template matching inthe digital domain.
Both approaches require additional power, compu-tation, and storage space, which are not favorable tomicrochip implementation. As shown in Fig. 2, theamount of distortion varies at different samples, whichis intuitive since sampling distortion is related to thewaveform slope. Inspired by this property, we use adensity function-based procedure to select good sam-ples, from which the spike features are derived. Thealgorithm for selecting samples is efficient in bothcomputation and storage space, and targeting hard-ware implementation. The details are shown in sections‘‘Sample Information’’ and ‘‘Enhancing SNR UsingNoise Shaping Filter.’’
SAMPLE INFORMATION
Methods to quantify information carried by indi-vidual spike samples are discussed in this section.Intuitively, a sample is considered to be informative ifthe superimposed spikes can be classified into multipleclusters by evaluating that sample alone. The methodused to quantify the sample information is outlinedbelow.
Algorithm Sample Information EstimationInput: M peak aligned spike segments {vi,
i = (1,2,…,M)} with N samples for eachsegment
Output: Information infoj carried by spike samples{vi(j), i = (1,2,…,M)}
– j = 1, construct one-dimensional data setX = {vi(j), i = (1,2,…,M)}
– Obtain a nested cluster configurationbased on X
– Estimate the probability pq that asample being partitioned into the qthcluster. Use the entropy to estimate the
information infoj = 2Rpq > p0 pqln(pq),where p0 is a threshold of the cluster size.
– Repeat the procedures to a differentsample, e.g. j = j + 1.
As illustrated in Fig. 3, sample information is cal-culated based on histograms. Some histograms (e.g.,Figs. 3a–e) are similar to Gaussian distributions, whilesome other histograms (e.g., Figs. 3f–j) exhibit multi-ple peaks and valleys, which are useful for groupingwaveforms. The principle of sample selection isto identify those informative samples (histograms ofmultiple peaks and valleys), based on which to con-struct feature space for classification. In the next sec-tion, emphasis is made on sample informationcalculation.
Probability Function Estimation
The probability that a sample being partitioned intothe qth cluster, pq, is obtained by locating peaks andvalleys of an estimated density function of variable vi.In this section, a density function estimation methodusing convex kernels is introduced.
Kernel density estimation is a non-parametric wayof estimating the probability density function of arandom variable.7 Given x1,x2,…,xM are independentand identically distributed samples of a random vari-able, the kernel density estimate to approximate theprobability density function is
fðxÞ ¼ 1
hd
XG
x� xjh
� �; ð12Þ
where G(x) is an arbitrary isotropic kernel with aconvex profile g(x), i.e., it satisfies G(x) = g(|x|2) andg(xi) 2 g(xj) ‡ g¢(xj)(xi 2 xj), d is the dimension of thedata (‘‘1’’ here), h is the kernel bandwidth, and d isthe dimension of the data space. Compared with thehistogram that also approximates a probability den-sity function, the kernel density estimate defined inEq. (12) is a smoothed one avoiding artificial peaks/
FIGURE 3. (a), (b) The histogram and estimated density function at sample (#8) and (#27). As comparisons, (c), (d) display thehistogram and estimated density function of the waveform derivative at sample (#8) and (#27). Sample (#8) is recognized as a non-informative sample in original waveform, but it is an informative sample in the waveform derivative; sample (#27) is a relativeinformative sample in original waveform, however, it is non-informative in the waveform derivative.
YANG et al.1268
valleys due to insufficient samples. As an example,density functions of spike samples approximated bythe histogram and convex kernels are displayed inFig. 3. It is intuitive to see that kernel scope h is asensitive parameter that affects the estimated densityfunction. In this study, we use the local kernel band-width scheme, which is reported to be robust by manyauthors.8,13
Discussions on Sample Selection
The computation required to accurately quantifythe entropy of an underlying data set is typically high.However, only a rough estimation is required to selectinformative samples. Therefore, the amount of spikesto compute information can be reduced to a relativelysmall number, which should allow hardware imple-mentation in terms of storage space and computationcomplexity. With the synthesized spike data we used,each sequence contains three neuronal sources withsimilar firing rate. As a result, the possible informationscores should be 0, 1
3 ln 3þ 23 ln 1:5; or ln 3. When we
increase the amount of training events to M = 300,the information scores approximately settle to theexpected values, as shown in Fig. 4.
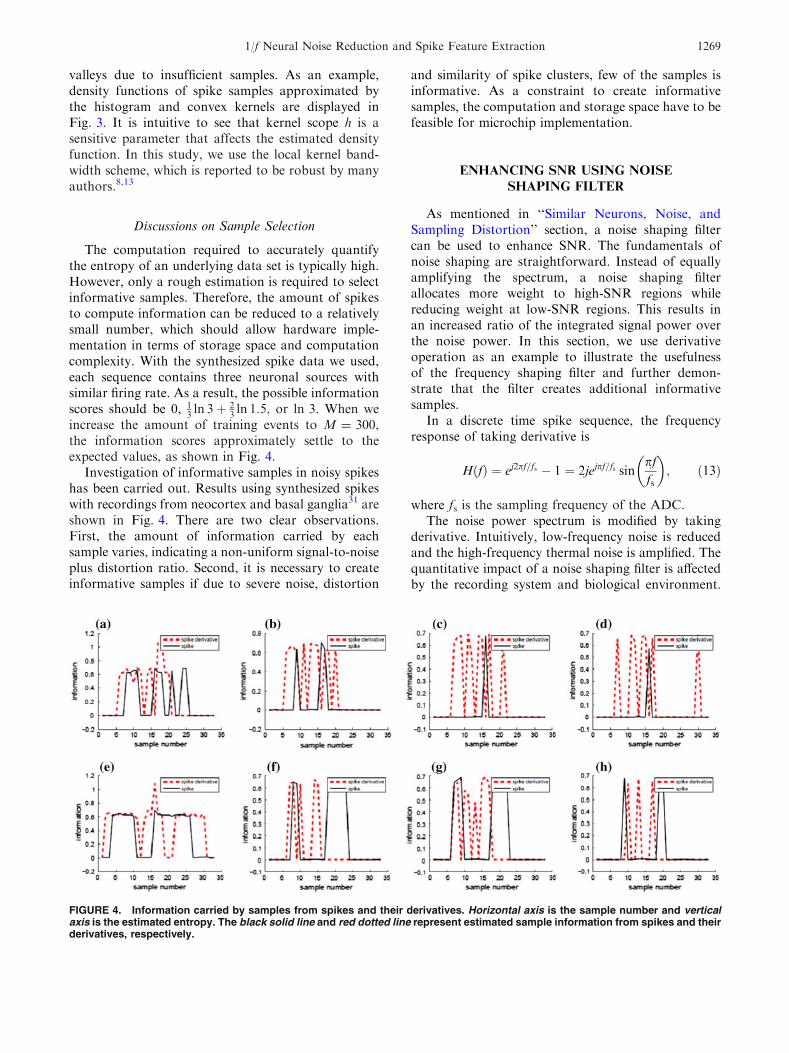
Investigation of informative samples in noisy spikeshas been carried out. Results using synthesized spikeswith recordings from neocortex and basal ganglia31 areshown in Fig. 4. There are two clear observations.First, the amount of information carried by eachsample varies, indicating a non-uniform signal-to-noiseplus distortion ratio. Second, it is necessary to createinformative samples if due to severe noise, distortion
and similarity of spike clusters, few of the samples isinformative. As a constraint to create informativesamples, the computation and storage space have to befeasible for microchip implementation.
ENHANCING SNR USING NOISE
SHAPING FILTER
As mentioned in ‘‘Similar Neurons, Noise, andSampling Distortion’’ section, a noise shaping filtercan be used to enhance SNR. The fundamentals ofnoise shaping are straightforward. Instead of equallyamplifying the spectrum, a noise shaping filterallocates more weight to high-SNR regions whilereducing weight at low-SNR regions. This results inan increased ratio of the integrated signal power overthe noise power. In this section, we use derivativeoperation as an example to illustrate the usefulnessof the frequency shaping filter and further demon-strate that the filter creates additional informativesamples.
In a discrete time spike sequence, the frequencyresponse of taking derivative is
HðfÞ ¼ ej2pf=fs � 1 ¼ 2jejpf=fs sinpffs
; ð13Þ
where fs is the sampling frequency of the ADC.The noise power spectrum is modified by taking
derivative. Intuitively, low-frequency noise is reducedand the high-frequency thermal noise is amplified. Thequantitative impact of a noise shaping filter is affectedby the recording system and biological environment.
FIGURE 4. Information carried by samples from spikes and their derivatives. Horizontal axis is the sample number and verticalaxis is the estimated entropy. The black solid line and red dotted line represent estimated sample information from spikes and theirderivatives, respectively.
1/f Neural Noise Reduction and Spike Feature Extraction 1269
To use f22 noise profile for illustration, the filter’sinfluence on noise could be quantified by k
k � fc1fc2
2f2spike� 1
2; ð14Þ
where fc1 and fc2 are the lower and higher corner fre-quencies of the digital filter, respectively. In case k isless than 1, SNR further increases, which favors spikesorting from the noise perspective.
The sampling distortion distribution among samplesis altered after taking the derivative. In the originalwaveforms, samples close to peaks suffer less distortioncompared with those in transition. After taking thederivative, samples initially suffering from large dis-tortion become less distorted, because V¢¢(t) has at leastone zero crossing point during the transition. Quanti-tative experiments to demonstrate the creation ofinformative samples have been carried out and shownin Fig. 4. In these data, the black solid lines representinformation carried by the samples from spikes and thedotted red lines represent the derivatives. The spikedata are eight challenging sequences from Quian Qui-roga et al.31 They are compiled from recordings in theneocortex and basal ganglia with superimposed noise.All eight sequences contain three neuronal sources.
The corresponding feature extraction results usingthe most informative samples from spikes as well astheir derivatives are shown in Figs. 6a–h, which clearlypresents a 3-cluster configuration.
SPIKE DETECTION AND FEATURE
EXTRACTION HARDWARE IMPLEMENTATION
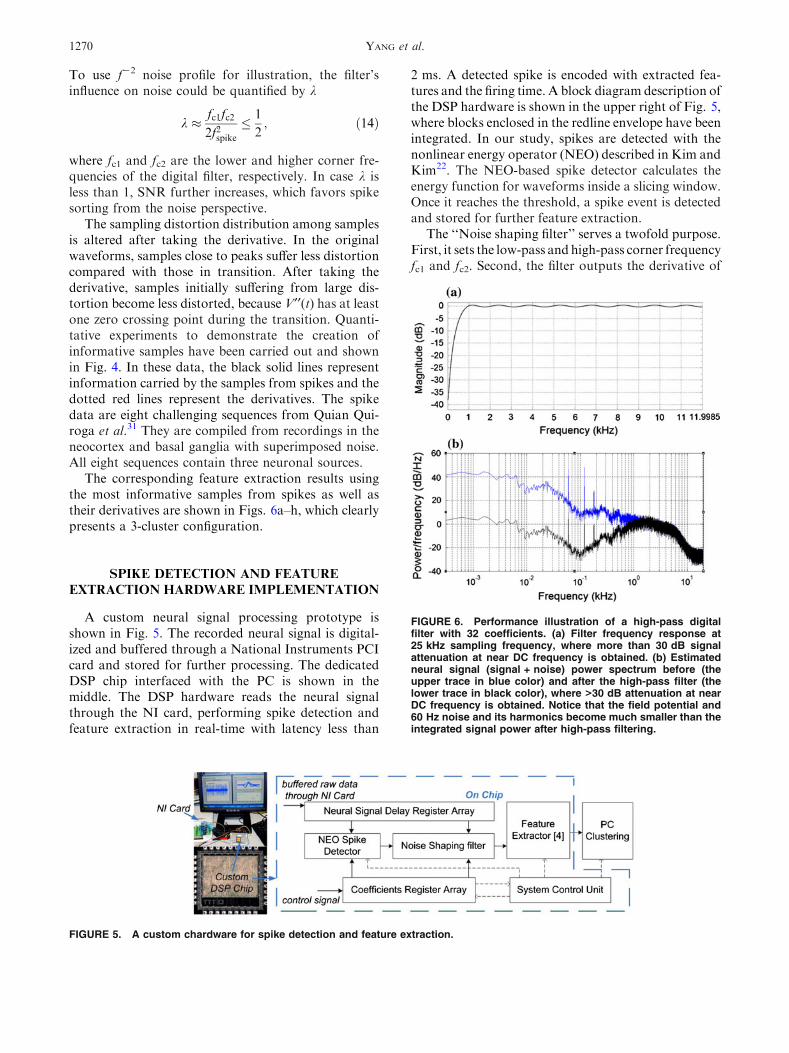
A custom neural signal processing prototype isshown in Fig. 5. The recorded neural signal is digital-ized and buffered through a National Instruments PCIcard and stored for further processing. The dedicatedDSP chip interfaced with the PC is shown in themiddle. The DSP hardware reads the neural signalthrough the NI card, performing spike detection andfeature extraction in real-time with latency less than
2 ms. A detected spike is encoded with extracted fea-tures and the firing time. A block diagram description ofthe DSP hardware is shown in the upper right of Fig. 5,where blocks enclosed in the redline envelope have beenintegrated. In our study, spikes are detected with thenonlinear energy operator (NEO) described in Kim andKim22. The NEO-based spike detector calculates theenergy function for waveforms inside a slicing window.Once it reaches the threshold, a spike event is detectedand stored for further feature extraction.
The ‘‘Noise shaping filter’’ serves a twofold purpose.First, it sets the low-pass and high-pass corner frequencyfc1 and fc2. Second, the filter outputs the derivative of
FIGURE 5. A custom chardware for spike detection and feature extraction.
FIGURE 6. Performance illustration of a high-pass digitalfilter with 32 coefficients. (a) Filter frequency response at25 kHz sampling frequency, where more than 30 dB signalattenuation at near DC frequency is obtained. (b) Estimatedneural signal (signal + noise) power spectrum before (theupper trace in blue color) and after the high-pass filter (thelower trace in black color), where >30 dB attenuation at nearDC frequency is obtained. Notice that the field potential and60 Hz noise and its harmonics become much smaller than theintegrated signal power after high-pass filtering.
YANG et al.1270
the spike waveforms to identify neurons’ kernel signa-tures. To handle a variety of noise profiles and spikewidths, 32 filter coefficients are programmable to per-form different orders of noise shaping (>30 dB atten-uation of low-frequency field potential and 60 Hz noise)and achieve a flexible fc2 in kHz range. When samplingfrequency is below 25 kHz, the filter can induce addi-tional 30 dB out-of-band rejection at frequency close toDC through high-pass filtering. As shown in Fig. 6a,fs = 25 kHz, fc1 � 600 Hz, and in band ripple <1 dB.It is worth mentioning that an increase of the samplingfrequency fs would increase fc1 proportionally (unlessusing a higher order filter). An example of applying thefilter to a spike sequence recorded at 40 kHz is shown inFig. 6b, where near-DC field potentials, 60 Hz noise,and its harmonics are severely attenuated to be less thanthe integrated signal power.
In this implementation, samples including the posi-tive and negative peaks of the spike derivative and
spike heights are the features chosen for classification.The choice of this subset is made due to the small coston computation and storage space. A NEO-basedspike detector, noise shaping filter, feature extractor,the corresponding storing device, and control unitsdescribed in Fig. 5 are implemented with a customdigital IC with 0.35 lm CMOS process, which con-sumes 1.62 9 1.62 mm2 and 93 lW.
EXPERIMENTS
Comparative Results on Synthesized Data
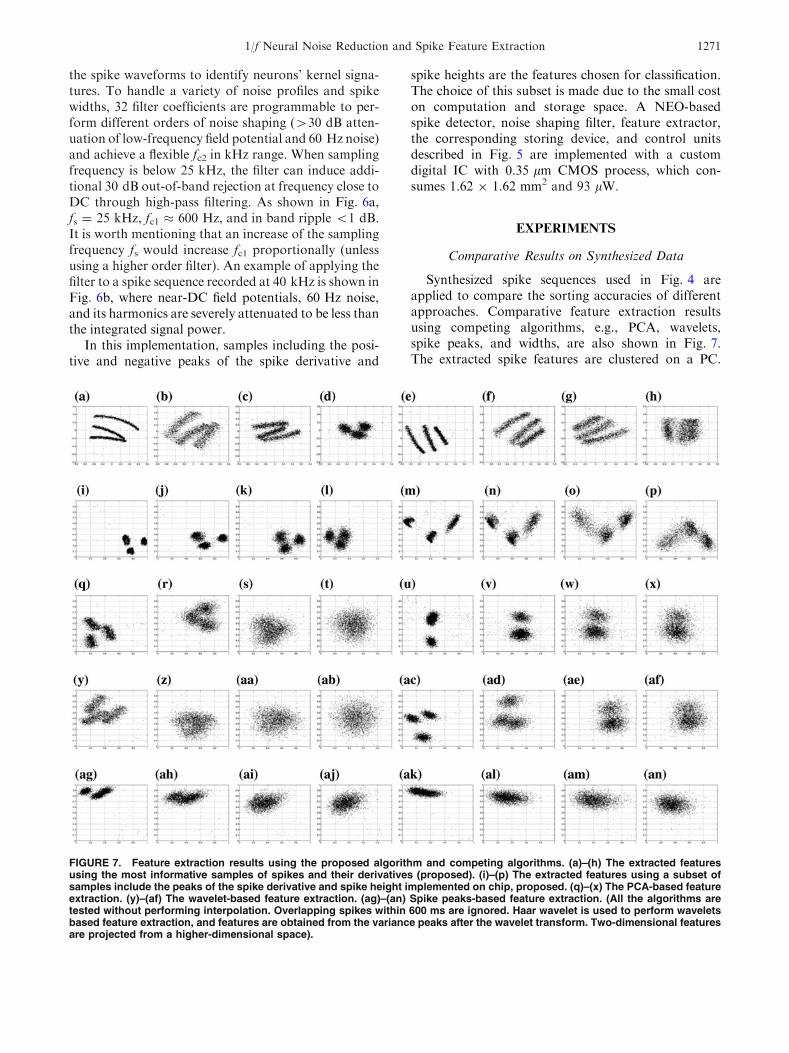
Synthesized spike sequences used in Fig. 4 areapplied to compare the sorting accuracies of differentapproaches. Comparative feature extraction resultsusing competing algorithms, e.g., PCA, wavelets,spike peaks, and widths, are also shown in Fig. 7.The extracted spike features are clustered on a PC.
FIGURE 7. Feature extraction results using the proposed algorithm and competing algorithms. (a)–(h) The extracted featuresusing the most informative samples of spikes and their derivatives (proposed). (i)–(p) The extracted features using a subset ofsamples include the peaks of the spike derivative and spike height implemented on chip, proposed. (q)–(x) The PCA-based featureextraction. (y)–(af) The wavelet-based feature extraction. (ag)–(an) Spike peaks-based feature extraction. (All the algorithms aretested without performing interpolation. Overlapping spikes within 600 ms are ignored. Haar wavelet is used to perform waveletsbased feature extraction, and features are obtained from the variance peaks after the wavelet transform. Two-dimensional featuresare projected from a higher-dimensional space).
1/f Neural Noise Reduction and Spike Feature Extraction 1271
The proposed feature extraction algorithm includingthe most informative samples (corresponding to Figs.7a–h) achieves the highest average accuracy (97.0%).The hardware using the pre-specified subset (as men-tioned in ‘‘Spike Detection and Feature ExtractionHardware Implementation’’ section) gives similar accu-racy (96.1%), as shown in Figs. 7i–p. The counterpartalgorithms include PCA, wavelets and spike peaks andwidth give 78.4, 73.6, and 35.4%, respectively. Thesorting accuracy comparisons are listed in Table 1.
Comparative Results on In Vivo Data
In this subsection, data recorded from in vivopreparations are used to evaluate the performance ofPCA and the proposed algorithm.
In Vivo Data Testing A—From a Monkey Preparation
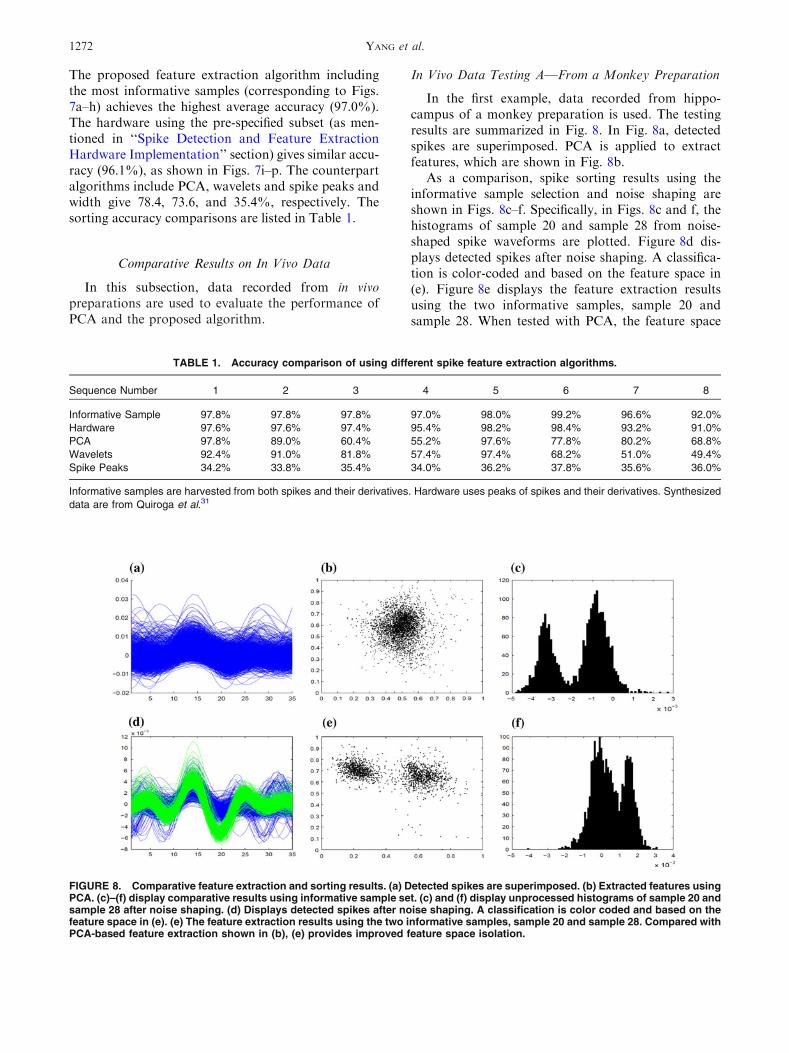
In the first example, data recorded from hippo-campus of a monkey preparation is used. The testingresults are summarized in Fig. 8. In Fig. 8a, detectedspikes are superimposed. PCA is applied to extractfeatures, which are shown in Fig. 8b.
As a comparison, spike sorting results using theinformative sample selection and noise shaping areshown in Figs. 8c–f. Specifically, in Figs. 8c and f, thehistograms of sample 20 and sample 28 from noise-shaped spike waveforms are plotted. Figure 8d dis-plays detected spikes after noise shaping. A classifica-tion is color-coded and based on the feature space in(e). Figure 8e displays the feature extraction resultsusing the two informative samples, sample 20 andsample 28. When tested with PCA, the feature space
TABLE 1. Accuracy comparison of using different spike feature extraction algorithms.
Sequence Number 1 2 3 4 5 6 7 8
Informative Sample 97.8% 97.8% 97.8% 97.0% 98.0% 99.2% 96.6% 92.0%
Hardware 97.6% 97.6% 97.4% 95.4% 98.2% 98.4% 93.2% 91.0%
PCA 97.8% 89.0% 60.4% 55.2% 97.6% 77.8% 80.2% 68.8%
Wavelets 92.4% 91.0% 81.8% 57.4% 97.4% 68.2% 51.0% 49.4%
Spike Peaks 34.2% 33.8% 35.4% 34.0% 36.2% 37.8% 35.6% 36.0%
Informative samples are harvested from both spikes and their derivatives. Hardware uses peaks of spikes and their derivatives. Synthesized
data are from Quiroga et al.31
FIGURE 8. Comparative feature extraction and sorting results. (a) Detected spikes are superimposed. (b) Extracted features usingPCA. (c)–(f) display comparative results using informative sample set. (c) and (f) display unprocessed histograms of sample 20 andsample 28 after noise shaping. (d) Displays detected spikes after noise shaping. A classification is color coded and based on thefeature space in (e). (e) The feature extraction results using the two informative samples, sample 20 and sample 28. Compared withPCA-based feature extraction shown in (b), (e) provides improved feature space isolation.
YANG et al.1272
shows a one-cluster configuration (Fig. 8b). Whentested with the proposed algorithm, the feature spaceshows a two-clustering configuration (Fig. 8e), sug-gesting improved feature space isolation.
In Vivo Data Testing B—Simultaneous Intra-and Extra-Cellular Recording in Anesthetized Rats
A high-quality spike database containing simulta-neously intra- and extra- cellular recordings is madepublicly accessible at http://crcns.org/data-sets/hc/.The recording protocols of generating the database isdescribed in Harris et al.14 In this subsection, com-parative testing results on PCA and the proposedalgorithm are reported in Fig. 9.
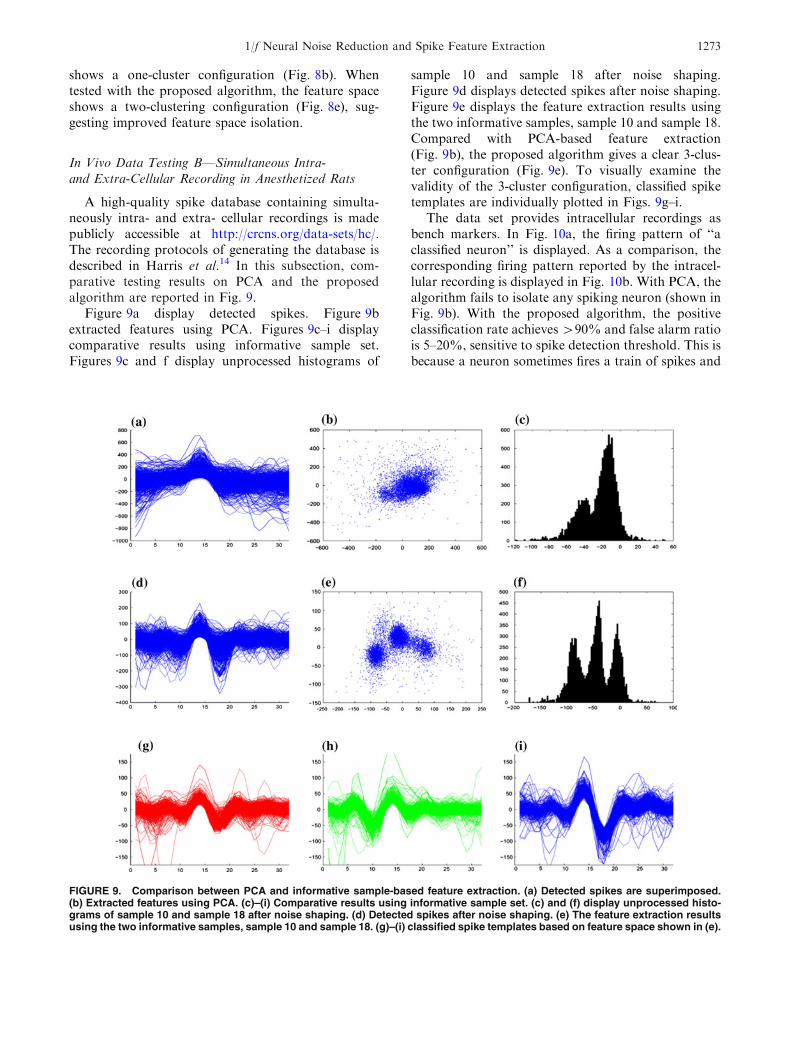
Figure 9a display detected spikes. Figure 9bextracted features using PCA. Figures 9c–i displaycomparative results using informative sample set.Figures 9c and f display unprocessed histograms of
sample 10 and sample 18 after noise shaping.Figure 9d displays detected spikes after noise shaping.Figure 9e displays the feature extraction results usingthe two informative samples, sample 10 and sample 18.Compared with PCA-based feature extraction(Fig. 9b), the proposed algorithm gives a clear 3-clus-ter configuration (Fig. 9e). To visually examine thevalidity of the 3-cluster configuration, classified spiketemplates are individually plotted in Figs. 9g–i.
The data set provides intracellular recordings asbench markers. In Fig. 10a, the firing pattern of ‘‘aclassified neuron’’ is displayed. As a comparison, thecorresponding firing pattern reported by the intracel-lular recording is displayed in Fig. 10b. With PCA, thealgorithm fails to isolate any spiking neuron (shown inFig. 9b). With the proposed algorithm, the positiveclassification rate achieves >90% and false alarm ratiois 5–20%, sensitive to spike detection threshold. This isbecause a neuron sometimes fires a train of spikes and
FIGURE 9. Comparison between PCA and informative sample-based feature extraction. (a) Detected spikes are superimposed.(b) Extracted features using PCA. (c)–(i) Comparative results using informative sample set. (c) and (f) display unprocessed histo-grams of sample 10 and sample 18 after noise shaping. (d) Detected spikes after noise shaping. (e) The feature extraction resultsusing the two informative samples, sample 10 and sample 18. (g)–(i) classified spike templates based on feature space shown in (e).
1/f Neural Noise Reduction and Spike Feature Extraction 1273

FIGURE 10. Comparison of intra- and extra-spike events.
FIGURE 11. (a) Recorded spikes from cat cerebral cortex are superimposed, (b) the extracted spike features consist of spikeheight and peaks of the spike derivative are plotted and grouped with a clustering algorithm implemented on PC. (c) The classifiedspike clusters are superimposed. (d)–(k) Individual spike clusters superimposed in (c) are displayed. Spike clusters in (d)–(g) areplotted in a smaller scale (20.3, 0.15) compared with (h)–(j) in (20.5, 0.3) and (k) in (20.5, 0.5).
YANG et al.1274
latter spikes have noticeably reduced amplitude(according to the intracellular recordings). An increasein spike detection threshold reduces the positive clas-sification rate (missing some small amplitude spike),while lowering the threshold increases the false alarmrate (bringing in a large amount of noise events).
In Vivo Data Testing C—From a Cat Preparation
Another example with overlapped spike clusters isselected for demonstration. The sequence is recordedfrom the cat cerebral cortex. The sorting results aredisplayed in Fig. 11. In Fig. 11a, the detected 1,210spikes are superimposed. Extracted spike featuresusing informative samples are shown in Fig. 11b. Thediscrete points in feature space are grouped into eightclusters with colors using off-line clustering. More than90% of the superimposed spike events in Fig. 11a areclassified and plotted in Fig. 11c. To further quantifythe validity of the classified spike clusters, superim-posed clusters in Fig. 11c are individually plotted inFigs. 11d–k. To clearly display the difference amongspike clusters, Figs. 11d–g are plotted using a smallerscale (20.3, 0.15), Figs. 11h–j are plotted in scale(20.5, 0.3), and Fig. 11i in scale (20.5, 0.5).
CONCLUSION
A sample selection-based spike feature extractionalgorithm is reported in this article. The theoreticalframework includes neuronal signature, frequencyshaping filter, and informative sample selection. UnlikePCA which uses correlated features, the sample selec-tion algorithm focuses on localized and uncorrelatedfeatures which are strengthened by the frequencyshaping filter. With simulated spike waveforms froma public database, the algorithm demonstrates animproved sorting accuracy compared with manycompeting algorithms. The algorithm is designed forintegrated microchip implementation and performsreal-time spike sorting. A preliminary hardwareimplementation has been realized using an IC chipinterfaced with a personal computer.
APPENDIX: SPIKE WAVEFORM FROM
SIMILAR NEURONS
It is possible that the recorded neurons have distin-guished spikes, which can be easily captured by a sortingalgorithm. It is also possible that the recorded neuronshave similar shape spikes, due to similar ion channeldensities. However, if the magnitudes of such spikes arealso similar, the differentiation becomes challenging.
A general spike sorting algorithm without using com-plex training procedures may fail to resolve such ambi-guity and will inaccurately report a single, large, spikecluster, which affects the reliability and accuracy of thedecoder. An approach of differentiating the associatedkernel functions could be used to sort the similar spikes.Assume W1(t) and W2(t) as the geometry kernel func-tions of two neurons with the same ion channel popu-lation, the difference between the two spikes is
DVðtÞ ¼Z1
�1
jmðsÞ½W1ðt� sÞ �W2ðt� sÞ�ds: ð15Þ
Small waveform difference appears ifR1�1W1 tð Þ�
W2 tð Þdt � 0. Intuitively, the condition means that thewaveforms are identical, ignoring the skew of theactivation of membranes.
Directly extracting the kernel functions fromwaveforms is difficult because of the uncertainties ofneurons’ geometry and transmembrane current profile.To differentiate the waveforms, we rewrite Eq. (15) inthe frequency domain as
FðDVÞ ¼ FðjmÞFðW1 �W2Þ; ð16Þ
where F() denotes the fourier transform. The condition ofR1�1W1ðtÞ �W2ðtÞdt � 0 is equivalent toF(W1 2 W2) �0|f=0 Hz, which implies that the waveform differencecaused by the geometry kernel functions has smallcontribution at lower frequency spectrum. A morequantitative explanation can be given by studying thederivative of F(DV) with respect to the frequency
@FðDVÞ@f
¼ @FðjmÞ@f
FðW1 �W2Þ þ FðjmÞ@FðW1 �W2Þ
@f;
ð17Þ
where f is frequency.Note that F(jm) is narrowly band limited signal,
F(W1 2 W2) serves as a notch frequency mask withrelatively wider spectrum. The first term in Eq. (17) isattenuated by F(W1 2 W2) within the dominantspectrum of F(jm). Otherwise, appreciable waveformdifference is expected according to Eq. (17).
The second term in Eq. (17), on the other hand,exhibits a strong frequency dependency within thedominant spectrum of F(jm). It can be expanded as
FðjmÞ@FðW1 �W2Þ
@f
� 2pFðjmÞZ1
�1
ðW1ðtÞ �W2ðtÞÞt sinð2pftÞdt; ð18Þ
where the approximation holds when kernel functionsWi are symmetrical.
1/f Neural Noise Reduction and Spike Feature Extraction 1275
As a summary, the waveform difference betweensimilar neurons caused by geometry functions satisfiesthe following conditions
FðDVÞ�0jf¼0Hz
@FðDVÞ@f
�4p2fFðjmÞZ1
�1
ðW1ðtÞ�W2ðtÞÞtsinð2pftÞ
2pfdt/f
0
BBB@:
ð19Þ
In Eq. (19), @FðDVÞ@f is linear to frequency f at low-
frequency region, as sinð2pftÞ2pf � 1: The strong emphasis
on frequency shows that F(DV) exhibits a higher fre-quency spectrum. As a result, a frequency-shaping fil-ter with an emphasis on high-frequency spectrum mayhelp to differentiates kernel functions.
ACKNOWLEDGMENTS
The authors acknowledge the founding providedby the USA National Science Foundation throughBMES-ERC and UC Lab Fee Program. The authorsacknowledge the start-up grant provided by NationalUniversity of Singapore. The authors are grateful toDr. Victor Pikov, Eric Basham, Plexon, and BMES-ERC Cortical Testbed for providing in vivo neural dataand suggestions. The authors acknowledge the in vivodatabase contributed by Gyorgy Buzsaki lab (http://crcns.org/data-sets/hc/) and synthesized databasecontributed by Quian Quiroga (http://www.vis.caltech.edu/~rodri/Wave_clus/Wave_clus_home.htm).
REFERENCES
1Blanche, T. J., and N. V. Swindale. Nyquist interpolationimproves neuron yield in multiunit recordings. J. Neurosci.Methods 155(1):207–216, 2006.2Buzsaki, G. Large-scale recording of neuronal ensembles.Nat. Neurosci. 7(5):446–451, 2004.3Buzsaki, G., M. Penttonen, Z. Nadasdy, and A. Bragin.Pattern and inhibition-dependent invasion of pyramidalcell dendrites by fast spikes in the hippocampus in vivo.Proc. Natl. Acad. Sci. USA 93(18):9921–9925, 1996.4Chae, M., W. Liu, Z. Yang, T. Chen, J. Kim,M. Sivaprakasam, and M. R. Yuce. A 128 channel 6mwwireless neural recording IC with on-the-fly spike sortingand UWB transmitter. IEEE ISSCC Dig. Tech. Papers7(6):241–261, 2008.5Chae, M., Z. Yang, M. R. Yuce, L. Hoang, and W. Liu. A128-channel 6mw wireless neural recording IC with spikefeature extraction and uwb transmitter. IEEE Trans.Neural. Syst. Rehabil. Eng. 17:312–321, 2009.6Chen, T., K. Chen, Z. Yang, K. Cockerham, and W. Liu.A biomedical multiprocessor soc for closed-loop neuro-prosthetic applications. IEEE ISSCC Dig. Tech. Papers25(4):434–435, 2009.
7Cheng, Y. Z.Mean shift, mode seeking, and clustering. IEEETrans. Pattern Anal. Mach. Intell. 17(8):790–799, 1995.8Comaniciu, D., V. Ramesh, and P. Meer. The variablebandwidth mean shift and data-driven scale selection.IEEE Int. Conf. Comput. Vis. I:438–445, 2001.9Davidsen, J. and H. Z. Schuster. Simple model for 1/fa
noise. Phys. Rev. Lett. E 65:026120, 2002.10Delescluse, M., and C. Pouzat. Efficient spike-sorting ofmultistate neurons using inter-spike intervals information.J. Neurosci. Methods 150(1):16–29, 2006.
11Fall, C., E. Marland, J. Wagner, and J. Tyson. Computa-tional Cell Biology. Berlin: Springer, 2002.
12Greenberg, R. J., T. J. Velte, M. S. Humanyun, G. N.Scarlatis, and E. De Juan, Jr. A computational model ofelectrical stimulation of the retinal ganglion cell. IEEETrans. Biomed. Eng. 46(5):505–514, 1999.
13Hall, P., T. C. Hui, and J. S. Marron. Improved variablewindow kernel estimate of probability densities. Ann. Stat.23(1):1–10, 1995.
14Harris, K. D., D. A. Henze, J. Csicsvari, H. Hirase, andG. Buzsaki. Accuracy of tetrode spike separation asdetermined by simultaneous intracellular and extracellularmeasurements. J. Neurophysiol. 84:401–414, 2000.
15Harrison, R. R. The design of integrated circuits to observebrain activity. Proc. IEEE 96:1203–1216, 2008.
16Hausser, N., G. Schiller, G. Stuart, and B. Sakmann.Activity dependent action potential invasion and calciuminflux into hippocampal CA1 dendrites. Science 268(5208):297–300, 1995.
17Hausser, M., N. Spruston, and G. Stuart. Diversity anddynamics of dendritic signaling. Science 290(5492):739–744,2000.
18Holt, G. R., and C. Koch. Electrical interactions via theextracellular potential near cell bodies. J. Comput. Neuro-sci. 6(2):169–184, 1999.
19Jolliffe, I. T. Principal Component Analysis. New York:Springer-Verlag, 2002.
20Jung, H. K., J. H. Choi, and T. Kim. Solving alignmentproblems in neural spike sorting using frequency domainPCA. Neurocomputing 69(7–9):975–978, 2006.
21Keefer, E. W., B. R. Botterman, M. I. Romero,A. F. Rossi, and G. W. Gross. Carbon nanotube-coatedelectrodes improve brain readouts. Nat. Nanotechnol.3:434–439, 2008.
22Kim, K. H., and J. K. Kim. Neural spike sorting undernearly 0-dB signal-to-noise ratio using nonlinear energyoperator and artificial neural-network classifier. IEEETrans. Biomed. Eng. 47(10):1406–1411, 2000.
23Letelier, J. C., and P. P. Weber. Spike sorting based ondiscrete wavelet transform coefficients. J. Neurosci. Meth-ods 101:93–106, 2000.
24Lewicki, M. S. Bayesian modeling and classification ofneural signals.Adv. Neural Inform. Process. Syst. 6:590–597,1994.
25Lewicki, M. S. Bayesian modeling and classification ofneural signals. Neural Comput. 6:1005–1030, 1994.
26Liu, X., D. B. McCreery, L. A. Bullara, and W. F. Agnew.Evaluation of the stability of intracortical microelectrodearrays. IEEE Trans. Neural. Syst. Rehabil. Eng. 14(1):91–100, 2006.
27Liu, X., D. B. McCreery, R. R. Carter, L. A. Bullara,T. G. H. Yuen, and W. F. Agnew. Stability of the interfacebetween neural tissue and chronically implanted intracor-tical microelectrodes. IEEE Trans. Neural Syst. Rehabil.Eng. 7(3):315–326, 1999.
YANG et al.1276
28Mamlouk, A. M., H. Sharp, K. M. L. Menne, U. G.Hofmann, and T. Martinetz. Unsupervised spike sortingwith ICA and its evaluation using genesis simulations.Neurocomputing 65–66:275–282, 2005.
29Manwani, A., P. N. Steinmetz, and C. Koch. Channel noisein excitable neural membranes. Adv. Neural Inform. Pro-cess. Syst. 12:142–149, 2000.
30Pavlov, A., V. A. Makarov, I. Makarova, and F. Panetsos.Sorting of neural spikes: when wavelet based methodsoutperform principal component analysis. Nat. Comput.6(3):269–281, 2007.
31Quian Quiroga, R., Z. Nadasdy, and Y. Ben-Shaul.Unsupervised spike detection and sorting with waveletsand superparamagnetic clustering. Neural Comput. 16(8):1661–1687, 2004.
32Rattay, F., P. Lutter, and H. Felix. A model of the elec-trically excited human cochlear neuron. I. Contribution ofneural substructures to the generation and propagation ofspikes. Hear. Res. 153:43–63, 2001.
33Razavi, B. Design of Analog CMOS Integrated Circuits.Boston, MA: McGraw-Hill, 2001.
34Sahani, M. Latent Variable Models for Neural DataAnalysis. Ph.D. Dissertation, California Institute of Tech-nology, 1999.
35Sakurai, Y., H. Tamura, and S. Takahashi. Dynamic syn-chrony of firing in the monkey prefrontal cortex duringworking-memory tasks. J. Neurosci. 26(40):10141–10153,2006.
36Scherberger, H., M. R. Jarvis, and R. A. Andersen. Cor-tical local field potential encodes movement intentions inthe posterior parietal cortex. Neuron 46:347–354, 2002.
37Snellings, A., D. Anderson, and J. Aldridge. Improvedsignal and reduced noise in neural recordings from close-spaced electrode arrays using independent componentanalysis as a preprocessor. J. Neurosci. Methods 150(2):254–264, 2006.
38Takahashi, S., and Y. Sakurai. Real-time and automaticsorting of multi-neuronal activity for sub-millisecondinteractions in vivo. Neuroscience 134:301–315, 2005.
39Takahashi, S., and Y. Sakurai. Coding of spatial infor-mation by soma and dendrite of pyramidal cells in the
hippocampal CA1 of behaving rats. Eur. J. Neurosci.Methods 26(7):2033–2045, 2007.
40Thakur, P. H., H. Lu, S. S. Hsiao, and K. O. Johnso.Automated optimal detection and classification of neuralaction potentials in extra-cellular recordings. J. Neurosci.Methods 162(1):364–376, 2007.
41Traub, R. D., R. K. S. Wong, R. Miles, and H. Michelson.A model of a CA3 hippocampal pyramidal neuron incor-porating voltage-clamp data on intrinsic conductances.J. Neurophysiol. 66(2):635–650, 1991.
42Tuckwell, H. C. Introduction to Theoretical Neurobiology.Cambridge: Cambridge University Press, 1988.
43Vargas-Irwin, C., and J. P. Donoghue. Automated spikesorting using density grid contour clustering and subtrac-tive waveform decomposition. J. Neurosci. Methods 164(1):1–18, 2007.
44Vollgraf, R., and K. Obermayer. Improved optimal linearfilters for the discrimination of multichannel waveformtemplates for spikesorting applications. IEEE SignalProcess. Lett. 13(3):121–124, 2006.
45Wiley, J. D., and J. G. Webster. Analysis and control of thecurrent distribution under circular dispersive. IEEE Trans.Biomed. Eng. 29:381–385, 1982.
46Yang, Z., Q. Zhao, E. Keefer, and W. Liu. Noise character-ization, modeling, and reduction for in vivo neural recording.Adv. Neural Inform. Process. Syst. 22:2160–2168, 2010.
47Yang, Z., Q. Zhao, and W. Liu. Improving spike separa-tion using waveform derivative. J. Neural Eng. 6(4):046006,2009.
48Yang, Z., Q. Zhao, and W. Liu. Spike feature extractionusing informative samples. Adv. Neural Inform. Process.Syst. 21:1865–1872, 2009.
49Zhang, P., J. Wu, Y. Zhou, P. Liang, and J. Yuan. Spikesorting based on automatic template reconstruction with apartial solution to the overlapping problem. J. Neurosci.Methods 7(5):446–451, 2004.
50Zumsteg, Z. S., C. Kemere, S. O’Driscoll, G. Santhanam,R. E. Ahmed, K. V. Shenoy, and T. H. Meng. Power fea-sibility of implantable digital spike sorting circuits forneural prosthetic systems. IEEE Trans. Neural Syst.Rehabil. Eng. 13(3):272–279, 2005.
1/f Neural Noise Reduction and Spike Feature Extraction 1277
Related Documents