1 EE40 Summer 2010 Hug EE40 Lecture 12 Josh Hug 7/21/201 0

Welcome message from author
This document is posted to help you gain knowledge. Please leave a comment to let me know what you think about it! Share it to your friends and learn new things together.
Transcript
1EE40 Summer 2010 Hug
EE40Lecture 12Josh Hug
7/21/2010

2EE40 Summer 2010 Hug
Logistical Things
• HW6 due Friday at 5PM (also short)
• Midterm next Wednesday 7/28– Focus is heavily on HW4, 5, 6, and Labs P1,
4, 5– Will reuse concepts from HW 1,2,3
3EE40 Summer 2010 Hug
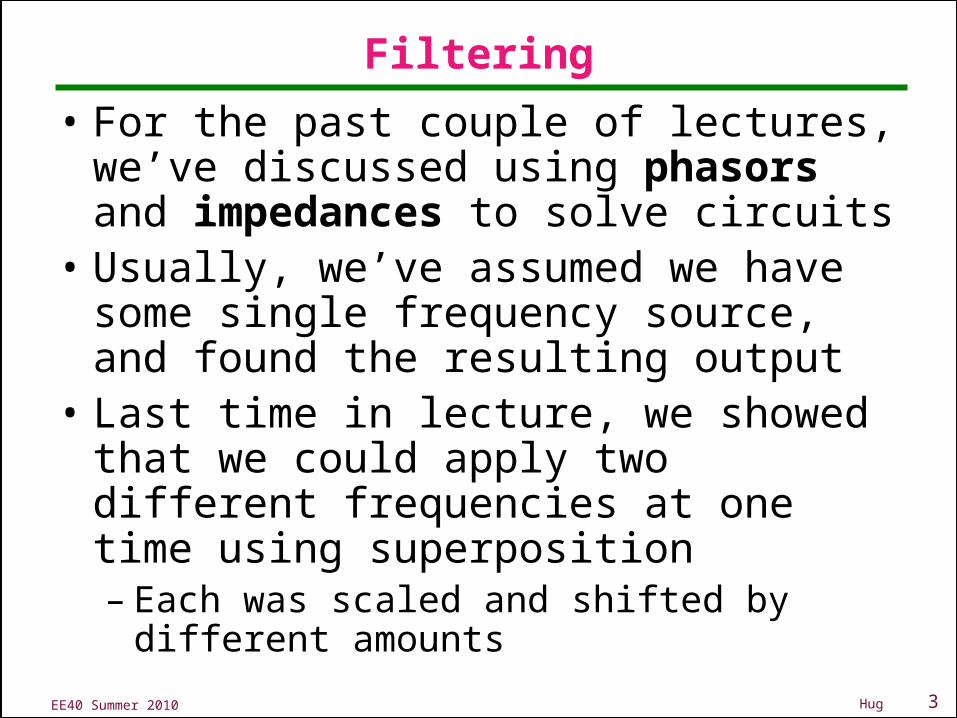
Filtering
• For the past couple of lectures, we’ve discussed using phasors and impedances to solve circuits
• Usually, we’ve assumed we have some single frequency source, and found the resulting output
• Last time in lecture, we showed that we could apply two different frequencies at one time using superposition– Each was scaled and shifted by different
amounts
4EE40 Summer 2010 Hug
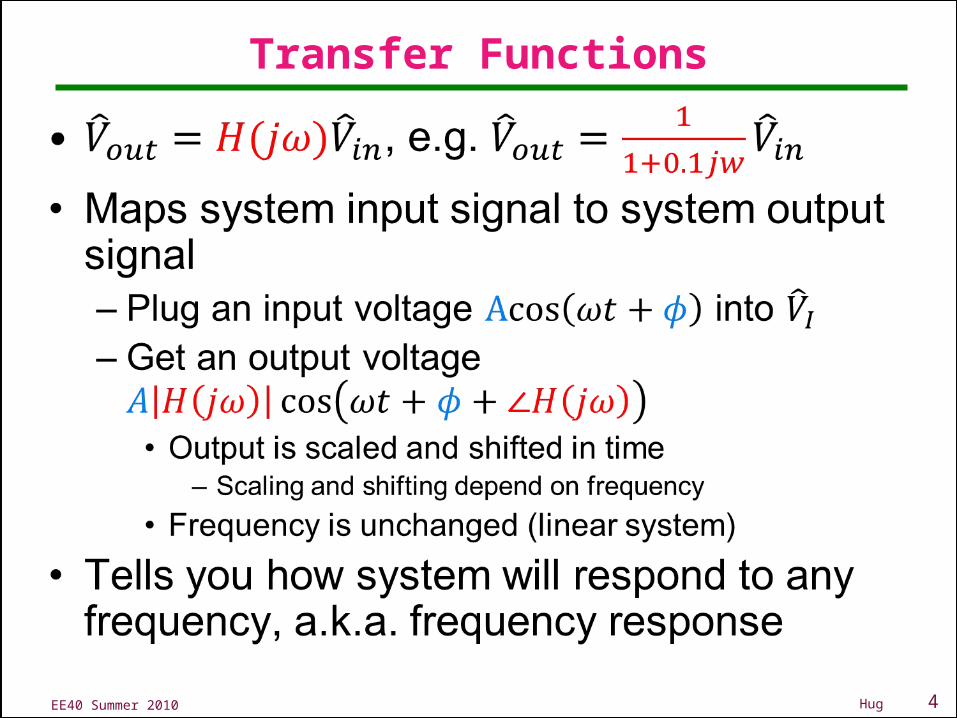
Transfer Functions

5EE40 Summer 2010 Hug
Using a Transfer Function
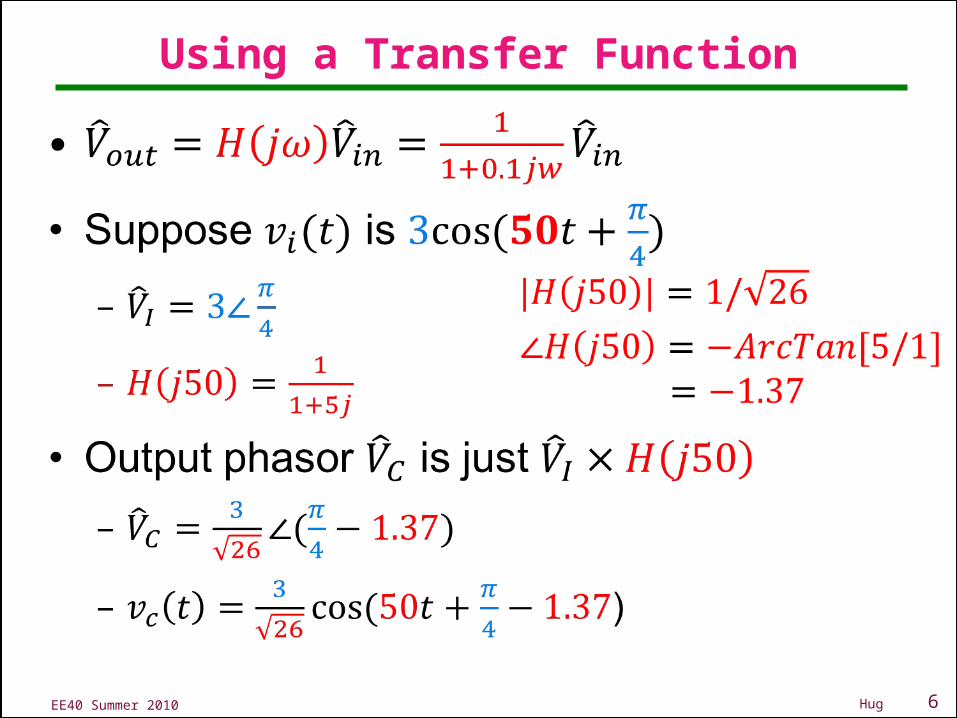
6EE40 Summer 2010 Hug
Using a Transfer Function

7EE40 Summer 2010 Hug
Transfer Function

8EE40 Summer 2010 Hug
Bode Magnitude Plot
Linear Scale Log Scale
9EE40 Summer 2010 Hug
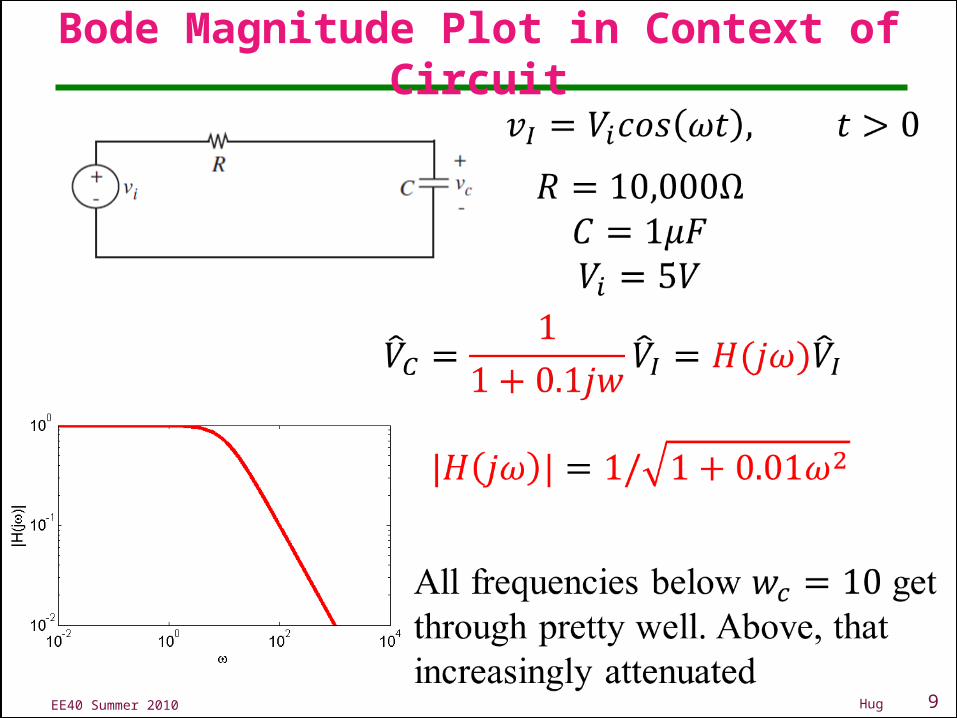
Bode Magnitude Plot in Context of Circuit

10EE40 Summer 2010 Hug
Bode Phase Plot
Linear Scale Semilog Scale
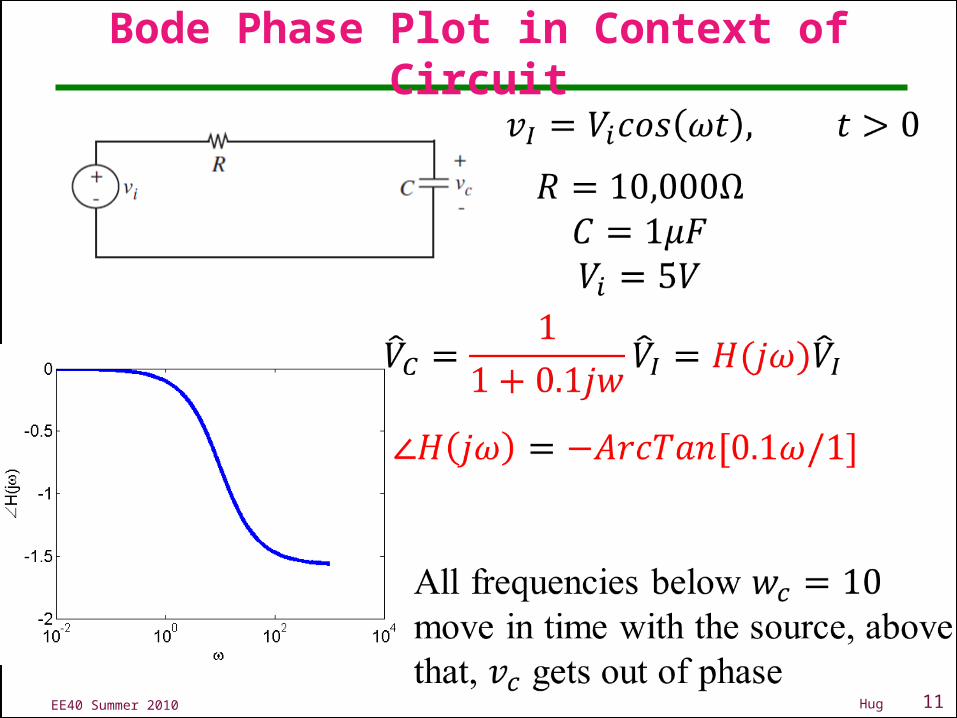
11EE40 Summer 2010 Hug
Bode Phase Plot in Context of Circuit
12EE40 Summer 2010 Hug
Multiple Frequencies
• Real signals are often a combination of a continuum of many frequencies– Radio antenna input– Microphone input
• Intuitively:– Thunder contains a bunch of low frequency
sounds– Boiling kettles contains a bunch of high frequency
sounds
• There is a mathematically well defined idea of what it means for a signal to “contain many frequencies”
13EE40 Summer 2010 Hug
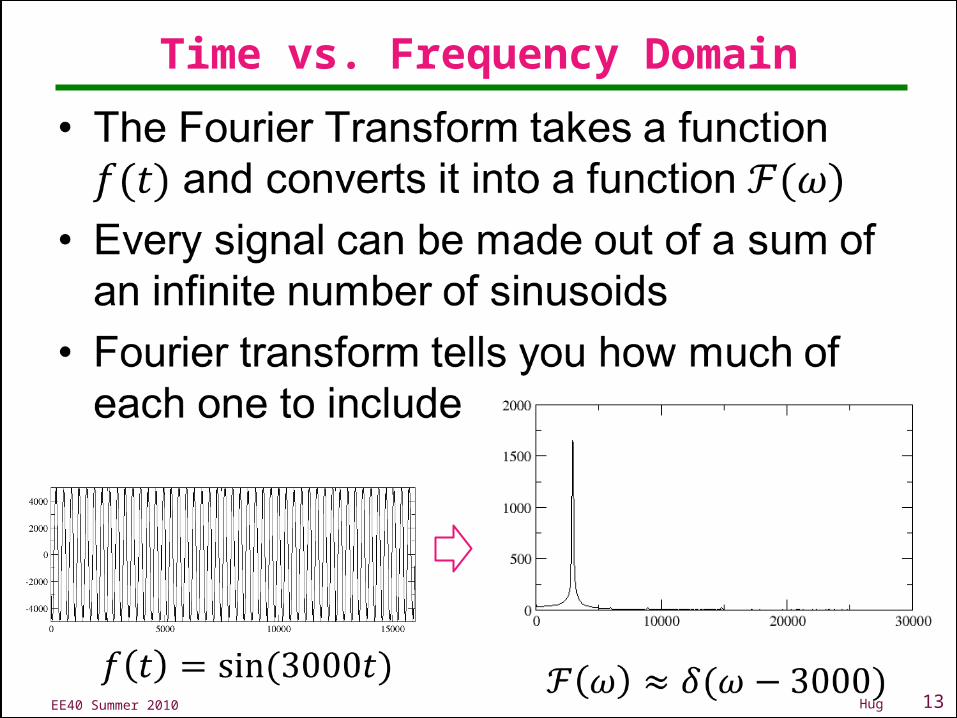
Time vs. Frequency Domain
14EE40 Summer 2010 Hug
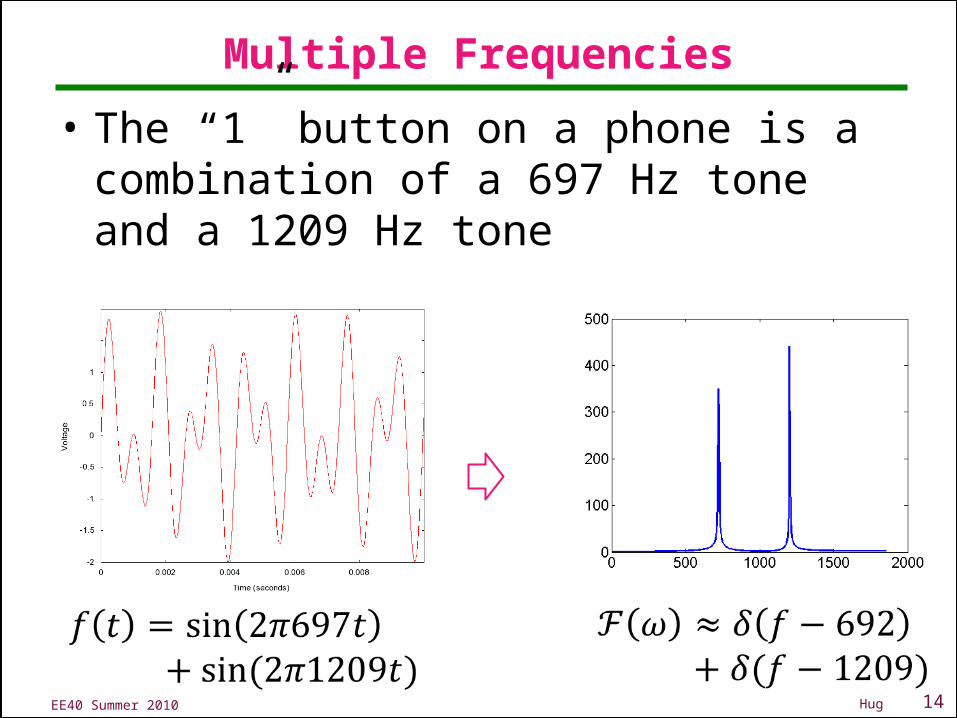
Multiple Frequencies
• The “1” button on a phone is a combination of a 697 Hz tone and a 1209 Hz tone
15EE40 Summer 2010 Hug
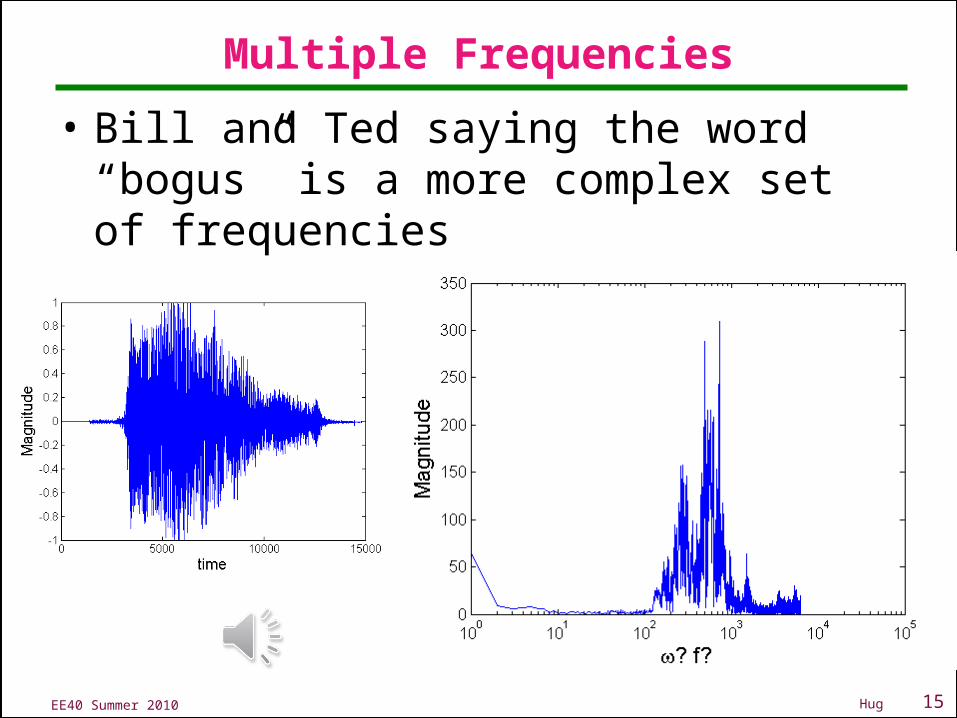
Multiple Frequencies
• Bill and Ted saying the word “bogus” is a more complex set of frequencies
16EE40 Summer 2010 Hug
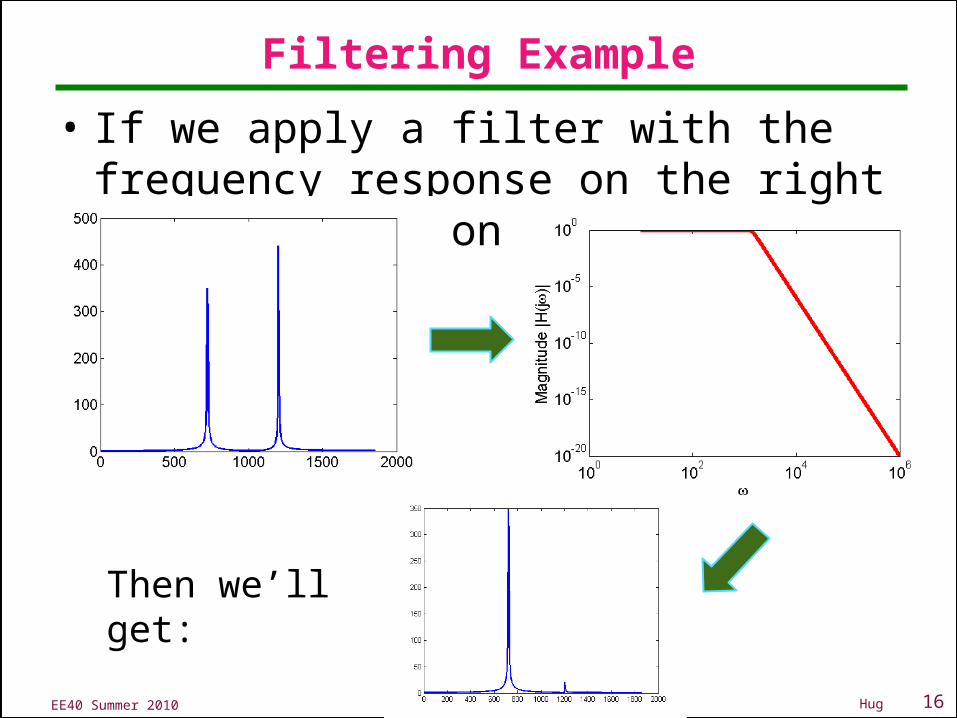
Filtering Example
• If we apply a filter with the frequency response on the right to the signal on the left
Then we’ll get:

17EE40 Summer 2010 Hug
More complex filtering
Each frequency individually scaled
18EE40 Summer 2010 Hug
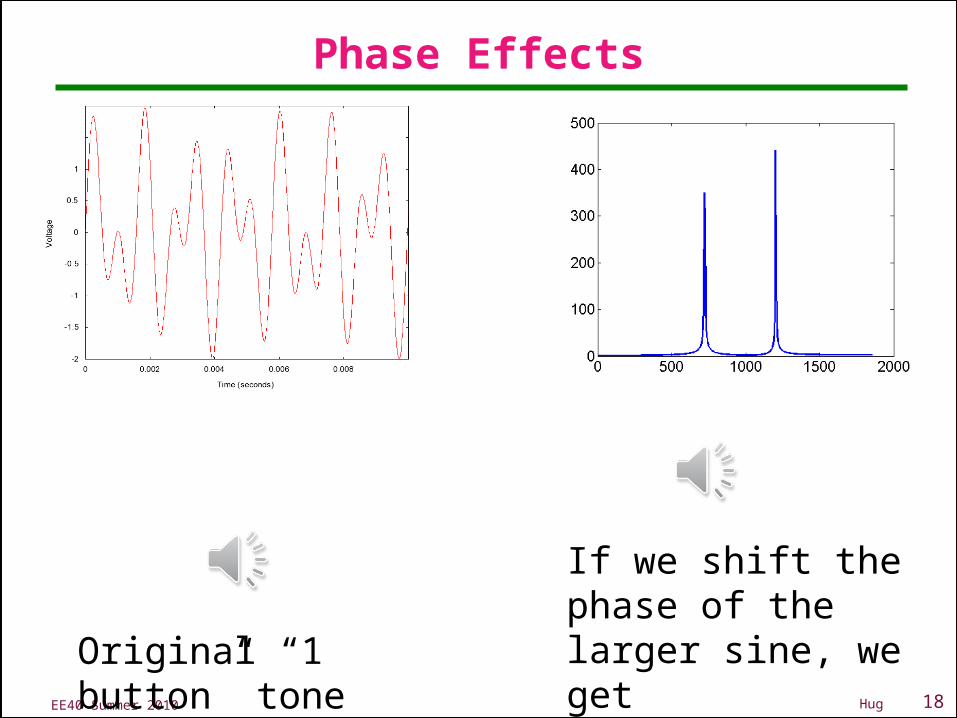
Phase Effects
If we shift the phase of the larger sine, we get
Original “1 button” tone
19EE40 Summer 2010 Hug
Magnitude and Phase Demo
• Let’s try the ever risky live demo
20EE40 Summer 2010 Hug
Bode Plots
• Hopefully I’ve convinced you that magnitude and phase plots are useful
• Now, the goal will be to draw them straight from the transfer function
• First, some reminders on loglog plots
21EE40 Summer 2010 Hug
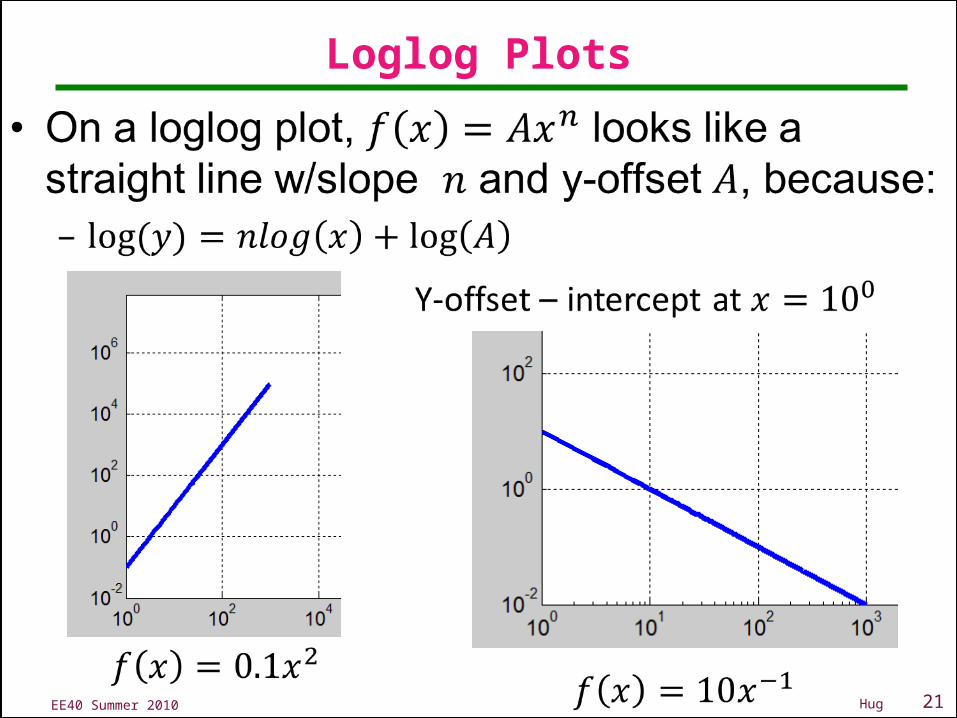
Loglog Plots
22EE40 Summer 2010 Hug
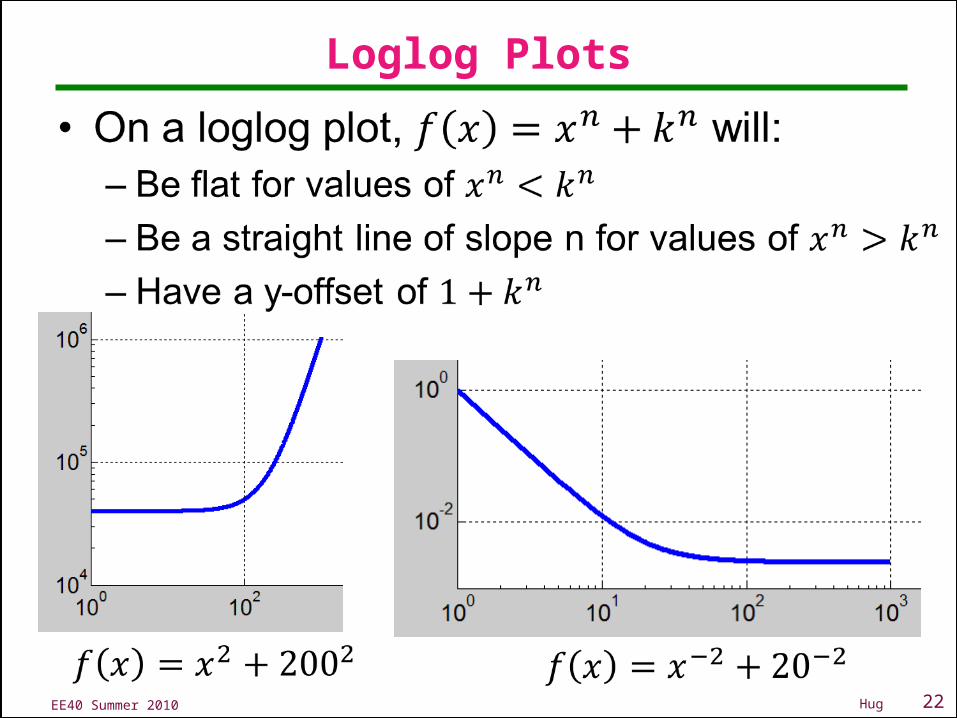
Loglog Plots
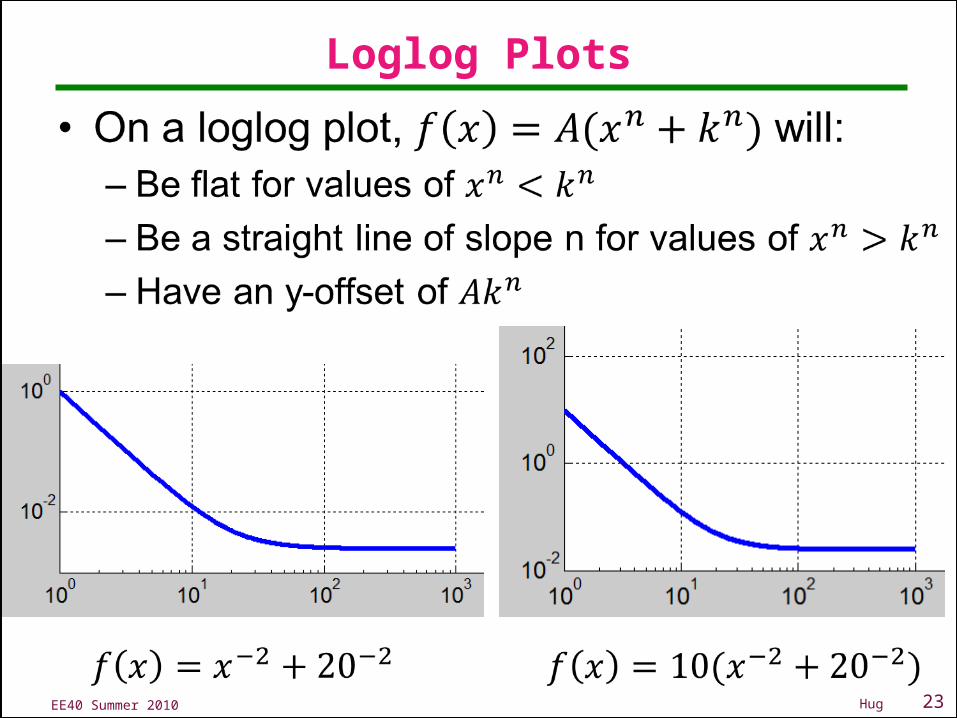
23EE40 Summer 2010 Hug
Loglog Plots
24EE40 Summer 2010 Hug
Manual Bode Plots
• On board, using handout
25EE40 Summer 2010 Hug
2nd Order Filter Example
• Also on board
26EE40 Summer 2010 Hug
2nd order Bode Plots
• Also on board
• This is where we stopped in class

27EE40 Summer 2010 Hug
Active filter example
• On board
28EE40 Summer 2010 Hug
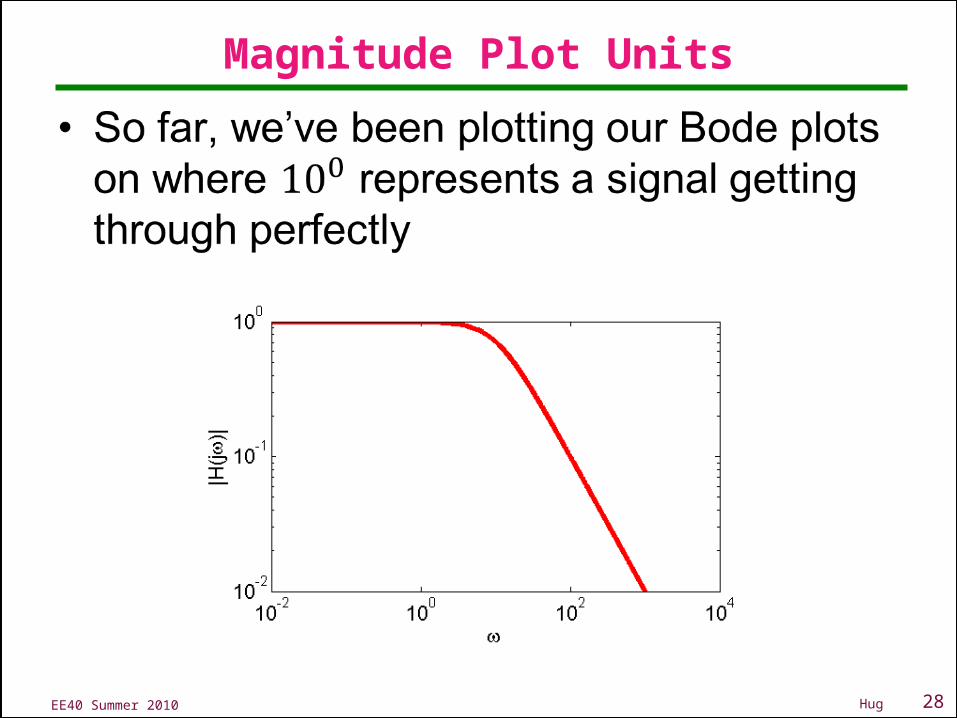
Magnitude Plot Units
29EE40 Summer 2010 Hug
Bel and Decibel (dB)
• A bel (symbol B) is a unit of measure of ratios of power levels, i.e. relative power levels. – B = log10(P1/P2) where P1 and P2 are power levels.
– The bel is a logarithmic measure– Zero bels corresponds to a ratio of 1:1– One bel corresponds to a ratio of 10:1– Three bels corresponds to a ratio of 1000:1
• The bel is too large for everyday use, so the decibel (dB), equal to 0.1B, is more commonly used. – 1dB = 10 log10(P1/P2)
– 0 dB corresponds to a ratio of 1:1– 10 dB corresponds to a ratio of 10:1– -10 dB corresponds to a ratio of 1:10
• dB are used to measure – Electric power, filter magnitude
30EE40 Summer 2010 Hug
Logarithmic Measure for Power
• To express a power in terms of decibels, one starts by choosing a reference power, Preference, and writing
Power P in decibels = 10 log10(P/Preference)
• Exercise: – Express a power of 50 mW in decibels relative to 1 watt.
– P (dB) =10 log10 (50 x 10-3) = - 13 dB
• Use logarithmic scale to express power ratios varying over a large range
2
1log10P
P dB Note: dB is not a unit for a physical quantity since power ratio is unitless. It is just a notation to remind us we are in the log scale.
dB:
31EE40 Summer 2010 Hug
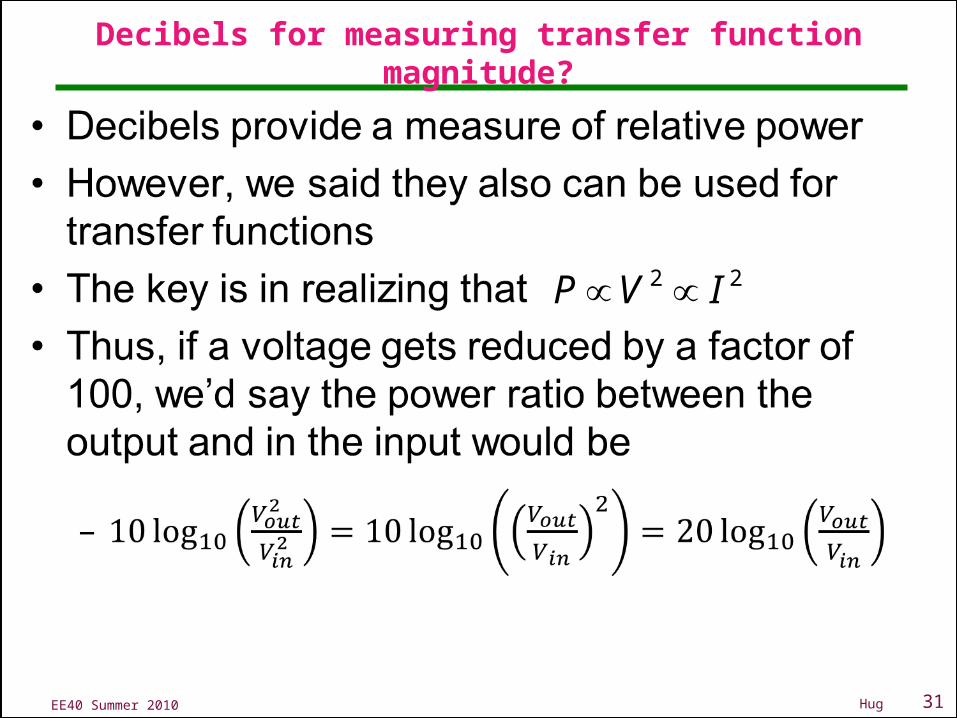
Decibels for measuring transfer function magnitude?
22 IVP
32EE40 Summer 2010 Hug
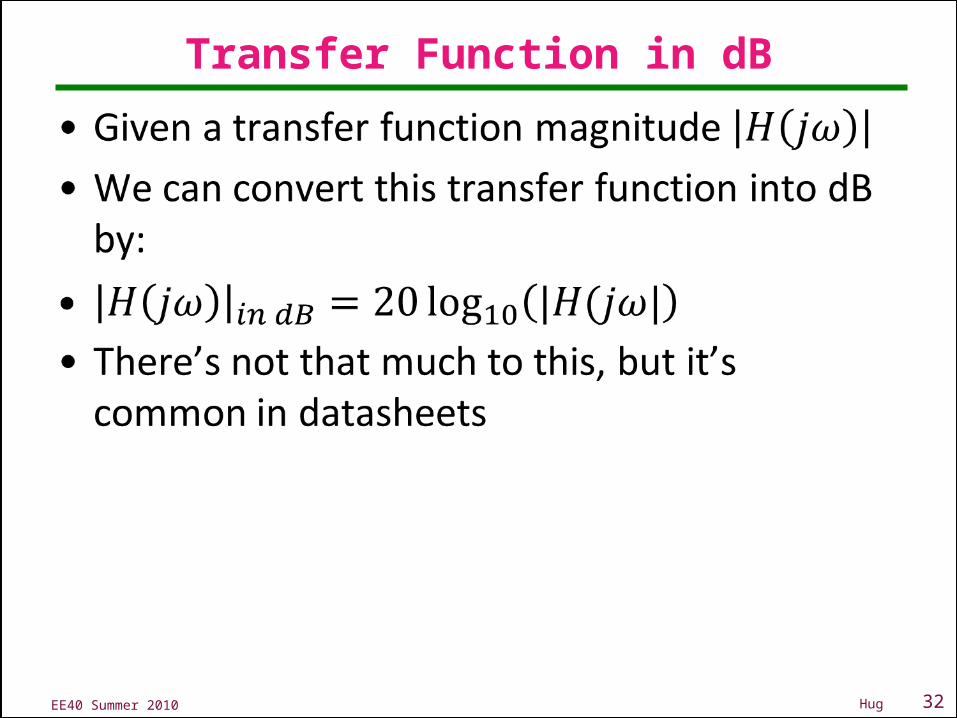
Transfer Function in dB
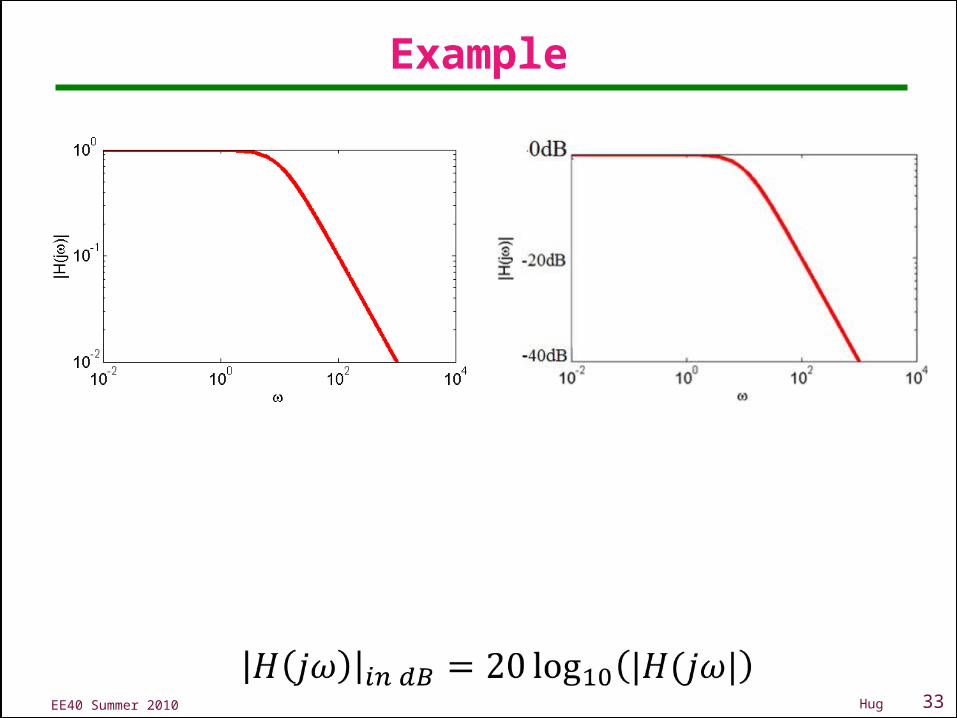
33EE40 Summer 2010 Hug
Example
Related Documents