1 Development of Programmable Micro-Power-Meter Testbed for Radio Modules M. C. Ekström *† , M. Bergblomma *‡ , M. Lindén * , M. Björkman * and M. Ekström * * School of Innovation, Design and Engineering, Mälardalen University, Gurksaltargatan 9, 7218 Västerås, Sweden † Email: [email protected] ‡ Email: [email protected] Abstract—This paper presents the POMPOM testbed for high precision power consumption in situ measurements for interchangeable radio modules. The main requirements for the development have been; Interchangeable radio modules to enable the same hardware testbed to be used independently of the radio standard used make comparison studies possible. The testbed should be programmable so that the need for hardware development should be minimized. The testbed must be able to act as a controller for the communication and simultaneously make accurate in situ measurements of the energy consumption of the radio. The required sample rate must be at least 50 kSamples per second. The range of the current measurement should cover at least 0.2 μAmpere to 60 mAmpere with at least 14-bit resolution. Mobility, low cost and small size are vital for the testbed. It must be possible to deploy several measurement testbeds to act as sensor nodes in a wireless sensor network to capture the behavior of the entire network. The results for test measurement setup for POMPOM is presented to illustrate a typical usage of the testbed. The results presented show how the testbed can be used to investigate the correlation between distance, packet-error-rate and current consumption for a Zigbee radio. Index Terms—Wireless, Testbed, Testbed development, Radio modules, Energy consumption. I. I NTRODUCTION The need for high precision in situ measurement for re- search within the domain of energy consumption of wireless technology is increasing with the development of new low energy radio standards. Jian et al. describe the need for an adaptive micro power meter that can both integrate the energy consumption over longer periods of time as well as capture high resolution power consumption of shorter bursts [1]. Jiang et.al. also emphasize the need to do this at node level for all active nodes in the network in situ. There is increasing demand for a larger measurement range for measurement systems as radio standards and technology develop. These measurement systems should not only be able to evaluate traditional wireless communications, such as Bluetooth version 2 [2], but should also be applicable for new, low energy models, such as Bluetooth Low Energy [3]. It is claimed that Bluetooth Low Energy will consume as little as 0.4 μA, whereas Bluetooth version 2 consumes 40 μA. Thus, there is a need for accurate models and energy consumption measurement of wireless technology with in situ testbeds with high sample frequency and resolution. To be able to compare different wireless technologies, it is vital to be able to isolate the energy consumption of the radio from the rest of the system. One desired feature is a programmable testbed with interchangeable radio technology that can provide an accurate measurement system as well as be able to control the communication in real-time. This would mean that there would be no need to redesign the hardware when changing the radio module. Naturally the mobility and size of the measurement system are of great importance as the system may be used in situ as a sensor node in various environments. Low cost is another requirement as the need for multiple measurement points is vital to gain an understanding of the energy consumption of the entire network. II. PROBLEM FORMULATION This section presents the fundamental requirements of our programmable micro-power-meter for a multi-radio testbed. A vital requirement for a measurement system that will be used for monitoring the energy consumption of various radio chips is that the range and sample rate is adequate to capture the variation in the power consumption for all radio standards that are likely to be used. The Bluetooth Low Energy device is specified to consume no more than 0.4 μA in sleep, and up to 40 mA in the transmit mode. As most of these radio standards utilize a low duty cycle scheme to preserve energy, which leads to long periods of low-power sleep modes that are punctuated with bursts of activity with relatively high energy. Bluetooth version 2.0 + EDR utilizes the low duty cycle scheme when applying the low power mode Sniff as describe by Negri et al. in [4]. Each burst lasts around 10-20ms with the high power- consumption peaks during transmission lasting 625 μs, leading to a nonlinear energy consumption during the bursts. This suggests that a sampling rate of at least tens of kHz is needed. This is supported by Jiang et al. in [1], where they state that the lowest sample rate is 40 kHz according to Nyquist’s theorem, since the highest frequency at which it is possible to attain a significant amount of energy is 20 kHz. Perturbation is an important aspect when designing an energy monitoring system as it is vital that the system does not affects the energy consumption of the object monitored. In addition the shunt resistor should be very small and purely resistive as stated by Cawley in [5].

Welcome message from author
This document is posted to help you gain knowledge. Please leave a comment to let me know what you think about it! Share it to your friends and learn new things together.
Transcript
1
Development of Programmable Micro-Power-MeterTestbed for Radio Modules
M. C. Ekström∗†, M. Bergblomma∗‡, M. Lindén∗, M. Björkman∗ and M. Ekström∗∗School of Innovation, Design and Engineering, Mälardalen University,
Gurksaltargatan 9, 7218 Västerås, Sweden†Email: [email protected]
‡Email: [email protected]
Abstract—This paper presents the POMPOM testbed forhigh precision power consumption in situ measurements forinterchangeable radio modules. The main requirements for thedevelopment have been;
Interchangeable radio modules to enable the same hardwaretestbed to be used independently of the radio standard used makecomparison studies possible.
The testbed should be programmable so that the need forhardware development should be minimized. The testbed mustbe able to act as a controller for the communication andsimultaneously make accuratein situ measurements of the energyconsumption of the radio.
The required sample rate must be at least 50 kSamples persecond. The range of the current measurement should cover atleast 0.2µAmpere to 60 mAmpere with at least 14-bit resolution.
Mobility, low cost and small size are vital for the testbed. Itmust be possible to deploy several measurement testbeds to act assensor nodes in a wireless sensor network to capture the behaviorof the entire network.
The results for test measurement setup for POMPOM ispresented to illustrate a typical usage of the testbed. The resultspresented show how the testbed can be used to investigatethe correlation between distance, packet-error-rate and currentconsumption for a Zigbee radio.
Index Terms—Wireless, Testbed, Testbed development, Radiomodules, Energy consumption.
I. I NTRODUCTION
The need for high precisionin situ measurement for re-search within the domain of energy consumption of wirelesstechnology is increasing with the development of new lowenergy radio standards. Jianet al. describe the need for anadaptive micro power meter that can both integrate the energyconsumption over longer periods of time as well as capturehigh resolution power consumption of shorter bursts [1]. Jianget.al. also emphasize the need to do this at node level for allactive nodes in the networkin situ.
There is increasing demand for a larger measurement rangefor measurement systems as radio standards and technologydevelop. These measurement systems should not only beable to evaluate traditional wireless communications, such asBluetooth version 2 [2], but should also be applicable for new,low energy models, such as Bluetooth Low Energy [3]. It isclaimed that Bluetooth Low Energy will consume as little as0.4 µA, whereas Bluetooth version 2 consumes 40µA.
Thus, there is a need for accurate models and energyconsumption measurement of wireless technology within situ
testbeds with high sample frequency and resolution. To beable to compare different wireless technologies, it is vital tobe able to isolate the energy consumption of the radio fromthe rest of the system. One desired feature is a programmabletestbed with interchangeable radio technology that can providean accurate measurement system as well as be able to controlthe communication in real-time. This would mean that therewould be no need to redesign the hardware when changingthe radio module. Naturally the mobility and size of themeasurement system are of great importance as the systemmay be usedin situ as a sensor node in various environments.Low cost is another requirement as the need for multiplemeasurement points is vital to gain an understanding of theenergy consumption of the entire network.
II. PROBLEM FORMULATION
This section presents the fundamental requirements of ourprogrammable micro-power-meter for a multi-radio testbed.
A vital requirement for a measurement system that will beused for monitoring the energy consumption of various radiochips is that the range and sample rate is adequate to capturethe variation in the power consumption for all radio standardsthat are likely to be used. The Bluetooth Low Energy device isspecified to consume no more than 0.4µA in sleep, and up to40 mA in the transmit mode. As most of these radio standardsutilize a low duty cycle scheme to preserve energy, which leadsto long periods of low-power sleep modes that are punctuatedwith bursts of activity with relatively high energy. Bluetoothversion 2.0 + EDR utilizes the low duty cycle scheme whenapplying the low power mode Sniff as describe by Negriet al.in [4]. Each burst lasts around 10-20ms with the high power-consumption peaks during transmission lasting 625µs, leadingto a nonlinear energy consumption during the bursts. Thissuggests that a sampling rate of at least tens of kHz is needed.This is supported by Jianget al. in [1], where they state that thelowest sample rate is 40 kHz according to Nyquist’s theorem,since the highest frequency at which it is possible to attainasignificant amount of energy is 20 kHz.
Perturbation is an important aspect when designing anenergy monitoring system as it is vital that the system doesnot affects the energy consumption of the object monitored.In addition the shunt resistor should be very small and purelyresistive as stated by Cawley in [5].
2
Distributed measurements in wireless sensor networks arevital. All nodes in a measurement setup should preferablybe monitored. Consequently, it is vital that the test bed issmall, mobile and low-cost. The mobility alone could causea problem since the node should be battery powered, whichimplies that the measurement data must either be storedlocally, or transmitted wirelessly to the collector node inwireless sensor network (WSN).
A measurement setup allowing each node to be monitoredin a WSN in situ measurement is essential to get a completeoverview of the energy consumption for the network. Thetestbed must be able to communicate and control the com-munication as well as automatically adapt the measurementprocedure for different measurement setups.
III. R ELATED WORK
Jinaget al. [1] presented the SPOT measurement platformfor empirically evaluating the energy consumptionin situ forwireless platforms. The SPOT has been developed to measurethe energy consumption existing platforms such as the Telosdeveloped by Polastreet al. [6]. The SPOT measurementplatform uses a voltage to frequency converter, VFC, sincethe analog-to-digital converters could not provide the samplerate nor the resolution needed to sense the range of 2µA -40 mA at 40 kSample per second, as stated.
Margii et al. presented the characterization of a visualsensor network testbed [7], where the energy consumption ismeasured with both an external digital multimeter connectedto a PC via a GPIB cable and battery monitoring system.The latter has a sampling rate of 36.41 Hz with a 12- bitADC resolution with a 270mOhm shunt resistor, resulting ina resolution of 0.904 mA +- 1.808 mA error. The digitalmultimeter setup is set to measure at 60 samples per second,but the resolution of the measurement system is not stated.
A common measurement setup that use an external digitaloscilloscope that measures the voltage drop over a 0.5 Ohmshunt resistor placed on the input voltage to the WLAN cardwas presented by Feeneyet al. in [8].
Negri et.al. presented a setup similar to that of Feenyetal. [8] in [4], where a directin situ measurement setup ispresented with a current datalogger to monitor the powerconsumption of a Bluetooth chip.
Hergenroeder presented in [9] a testbed for monitoring thewhole sensor node energy consumption, a system similar tothat of Jianget al. [1] system but with a higher resolutionand faster sample rate, however it does not isolate the radiochip or provide a broad enough range for the micro powermeasurements needed for evaluating modern radio standards.An error of up to 15% was achieved when measuring thecurrent consumption below 5 mA. However this is more thansufficient for this type of platforms since the minimum powerconsumption of a whole sensor node is unlikely to be less than5 mA.
IV. PROPOSED TESTBED SOLUTION
In this paper a programmable testbed with embeddedinsitu micro-power-meter with a high resolution and fast sample
rate is presented. The most significant difference between thisnew testbed, POMPOM, and other existing systems is thatPOMPOM is a programmable testbed with interchangeableradio modules. This implies that the energy consumption canbe compared for different radio modules that implement thesame radio standard.
The requirements for the measurement testbed developedare presented below.
• Interchangeable radio modules: the same hardwaretestbed is used independent of the radio standard chosento make studies comparable.
• Programmable: the need for hardware developmentshould be minimized.
• The testbed should be able to act as a controller for thecommunicationand simultaneously make accuratein situmeasurements of the energy consumption of the radio.
• The testbed must be able to perform integrating longtermmeasurements of the energy consumption as well as beable to capture high resolution periodic measurementswith high sample frequency. The required sample rateand range of the measurement is described in Section II
• Mobility: being of low cost, small in size and batterypowered are vital for this testbed. It must be possible todeploy several measurement testbeds to act as distributedsensor nodes in a wireless sensor network to capture thebehavior of the entire network.
V. SYSTEM SPECIFICATION
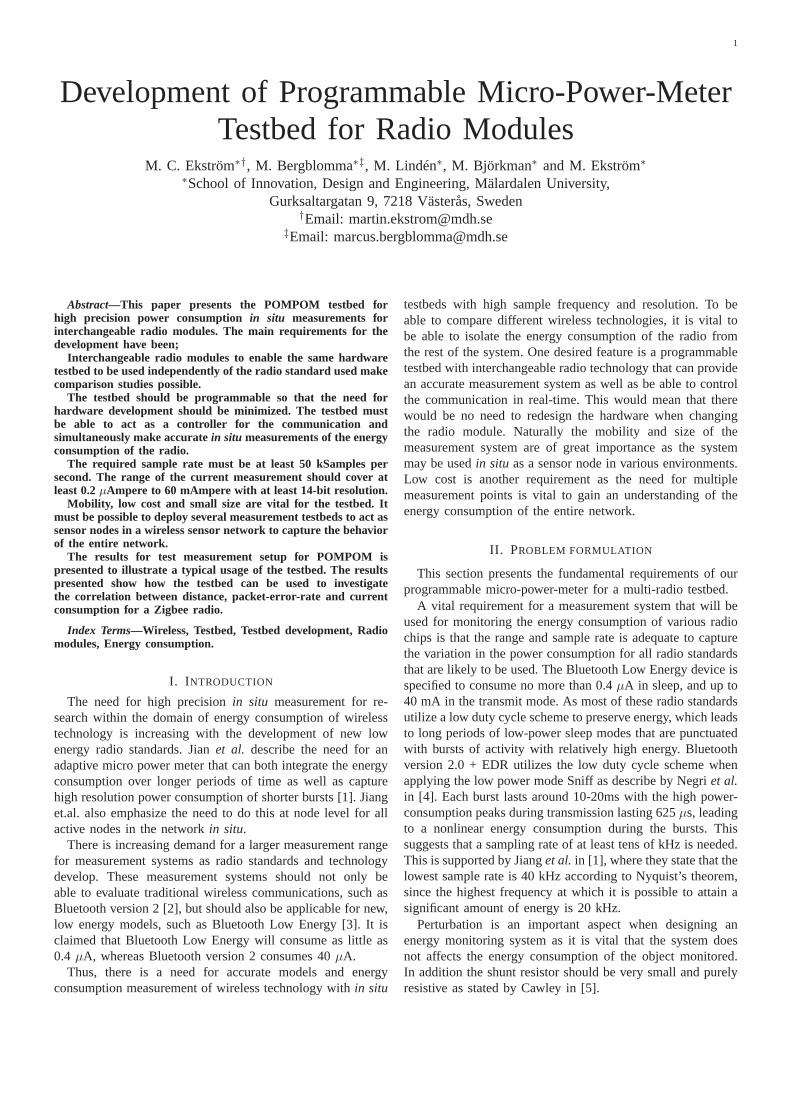
This section will describe the components and the spec-ification of the programmable micro power meter testbeddeveloped for the radio module, POMPOM. The specifica-tions of the whole system are presented as follows; Samlperate and range of the system in SectionV-A,current mon-itoring system in SectionV-B, Analog-to-digital converterin sectionV-C,the microcontroller unit and its peripheralinSectionV-D and POMPOMs power supply in SectionV-E.The hardware overview of the POMPOM system depicted infigure 1.
A. Range and sample frequency
POMPOM will primarily be used for evaluating and com-paring the energy characteristics for different radio modules.As described in section IV the range of the current that need tobe measured is ranging from 0.4µA to 40 mA. The samplingrate needs to be at least 40 kHz. To meet these requirements,two analog shunt resistor monitoring systems in combinationwith 16-bit resolution ADC with a sample rate at 50 kSamplesper second has been developed.
B. Current monitor system
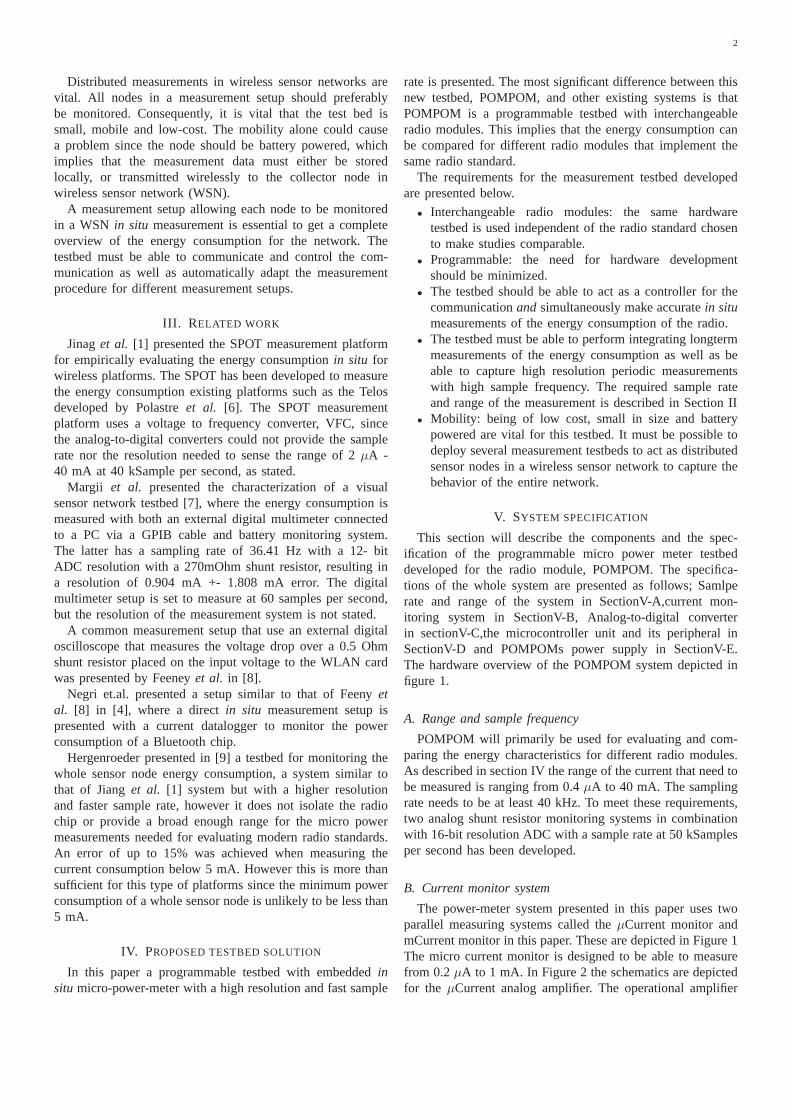
The power-meter system presented in this paper uses twoparallel measuring systems called theµCurrent monitor andmCurrent monitor in this paper. These are depicted in Figure1The micro current monitor is designed to be able to measurefrom 0.2µA to 1 mA. In Figure 2 the schematics are depictedfor the µCurrent analog amplifier. The operational amplifier
3
Fig. 1. Hardware overview of the POMPOM system specification. IncludingADC, power supply,µCurrent and MilliCurrent meter, microcontroller andperipherals
Fig. 2. µCurrent Monitor schematics. The measurement range is from 0.2µAto 1 mA
used is the ADA4528 from Analog Devices and the NPN smallsignal transistor is the BCW60A from Diodes.
To monitor the milli current consumption of the radiomodule a 1 Ohm shunt resistor is been used in combinationwith and current shunt monitor, INA193 [10]. The INA193has a voltage gain of 20 and bandwidth of 400 kHz. Theamplified analog signal is connected to the analog-to-digitalconverter presented in V-C.
C. Analog-to-Digital Converter
The central part of the measurement system is the analog-to-digital conversion, to fulfill the requirements described inII the AD7685 has been chosen. The AD7685 is an 16-bitAnalog-to-digital converter with a sample rate of 250 kSpsthat communicates via a serial port interface, SPI, to the microcontrol unit.
D. Micro Control Unit
The micro control unit, MCU, that will be used forcontrolling the communication and measurements is thePIC24FJ256GB106. This 16-bit architecture MCU commu-nicates with the radio modules via USART and when usedas a collector node via USB On-the-go, OTG, with the PC.The SPI interface is used to communicate and control theembedded measurement system described in Section V-B andSection V-C.
E. Power supply
The testbed is powered either by a 4.2 V Li-ion batteryor with USB power supply. The battery is charged with theMAX1811 that utilizes the USB power supply.
F. Peripherals
This section will describe the peripherals to the POMPOMsystem.
1) USB OTG interface: The POMPOM testbed is USB On-the-go compatible, which implies that it can be connected toa PC as well as a memory stick.
2) Radio Modules: The main objective and first study thatthe POMPOM will be used for is to compare the most com-monly used radio standards operating in the 2.45 GHz ISMfrequency band and how different parameters of the standardseffect the energy consumption. The goal is to create energyconsumption models for simulation studies. The followingstandards are of immediate interest:
• IEEE 802.15.4 based standards such as ZigBee andWirelessHART. IEEE 802.15.4, which implements thephysical layer and data link layer, is inteded for ap-plications with a low data rate and has a low power-consumption requirement [11].
• Different versions of the Bluetooth standard, especiallyBluetooth Low Energy [3]. The latter version of Blue-tooth is intended for applications with a low data rate andlow power consumption, but also for applications whichrequire a low latency.
VI. VALIDATION OF THE MEASUREMENT SYSTEM
The calibration of the energy measurement system of thePOMPOM testbed and a test measurement setup for thePOMPOM system with a Zigbee radio module is presentedin this section.
A. Power meter calibration
For accurate measurements the whole system needs to bevalidated and calibrated to establish accuracy and verify thelinearity of the energy consumption measurements. The cali-bration setup is depicted in figure 3. All calibration requiredto correct the nonlinearity is made in software on the MCUin the POMPOM system. The current measurements, whichare used to calculate the energy consumed, are calibrated andvalidated with the use of a known load and a digital multimeter(DMM), a Hewlett Packard 34401A [12].
4
Fig. 3. Validation measurement setup for POMPOM testbed
B. Test measurement setup
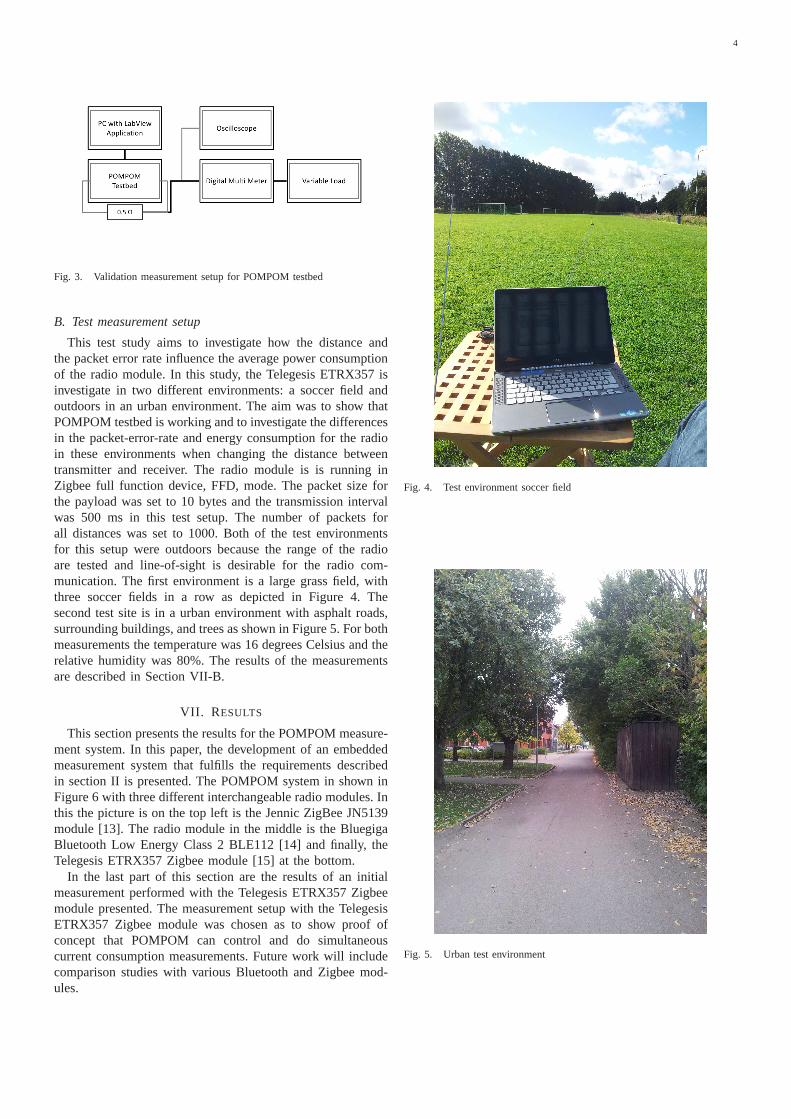
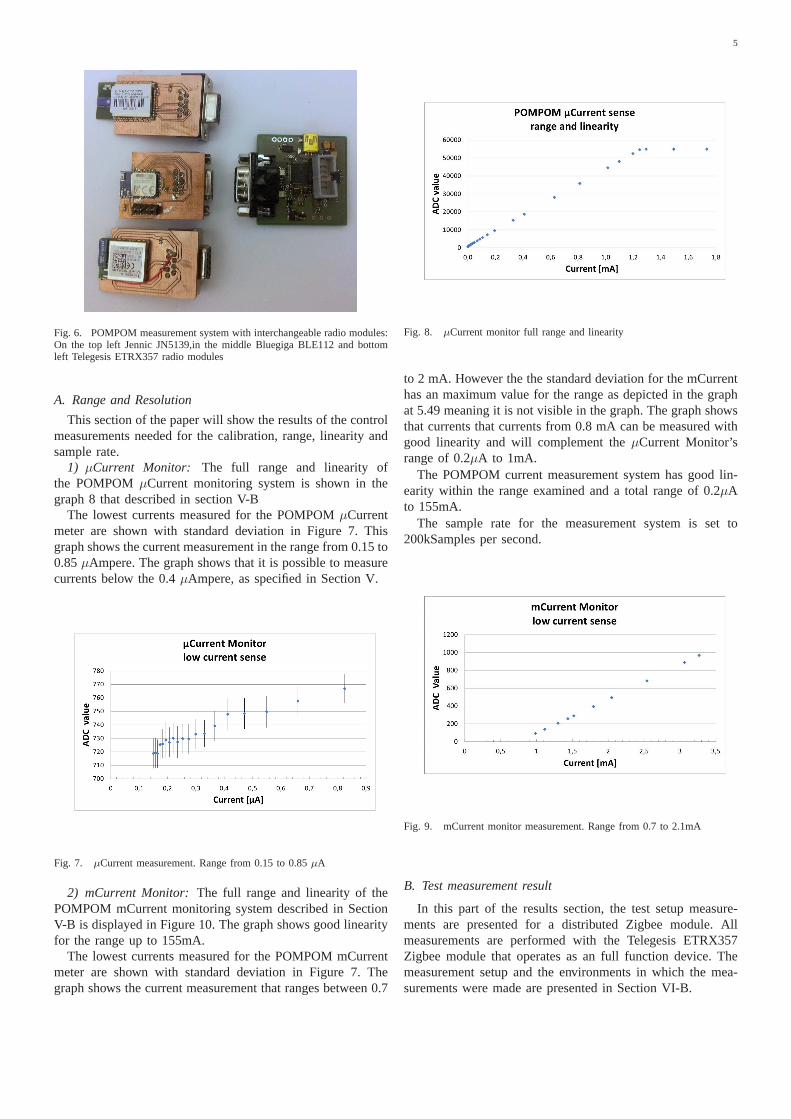
This test study aims to investigate how the distance andthe packet error rate influence the average power consumptionof the radio module. In this study, the Telegesis ETRX357 isinvestigate in two different environments: a soccer field andoutdoors in an urban environment. The aim was to show thatPOMPOM testbed is working and to investigate the differencesin the packet-error-rate and energy consumption for the radioin these environments when changing the distance betweentransmitter and receiver. The radio module is is running inZigbee full function device, FFD, mode. The packet size forthe payload was set to 10 bytes and the transmission intervalwas 500 ms in this test setup. The number of packets forall distances was set to 1000. Both of the test environmentsfor this setup were outdoors because the range of the radioare tested and line-of-sight is desirable for the radio com-munication. The first environment is a large grass field, withthree soccer fields in a row as depicted in Figure 4. Thesecond test site is in a urban environment with asphalt roads,surrounding buildings, and trees as shown in Figure 5. For bothmeasurements the temperature was 16 degrees Celsius and therelative humidity was 80%. The results of the measurementsare described in Section VII-B.
VII. R ESULTS
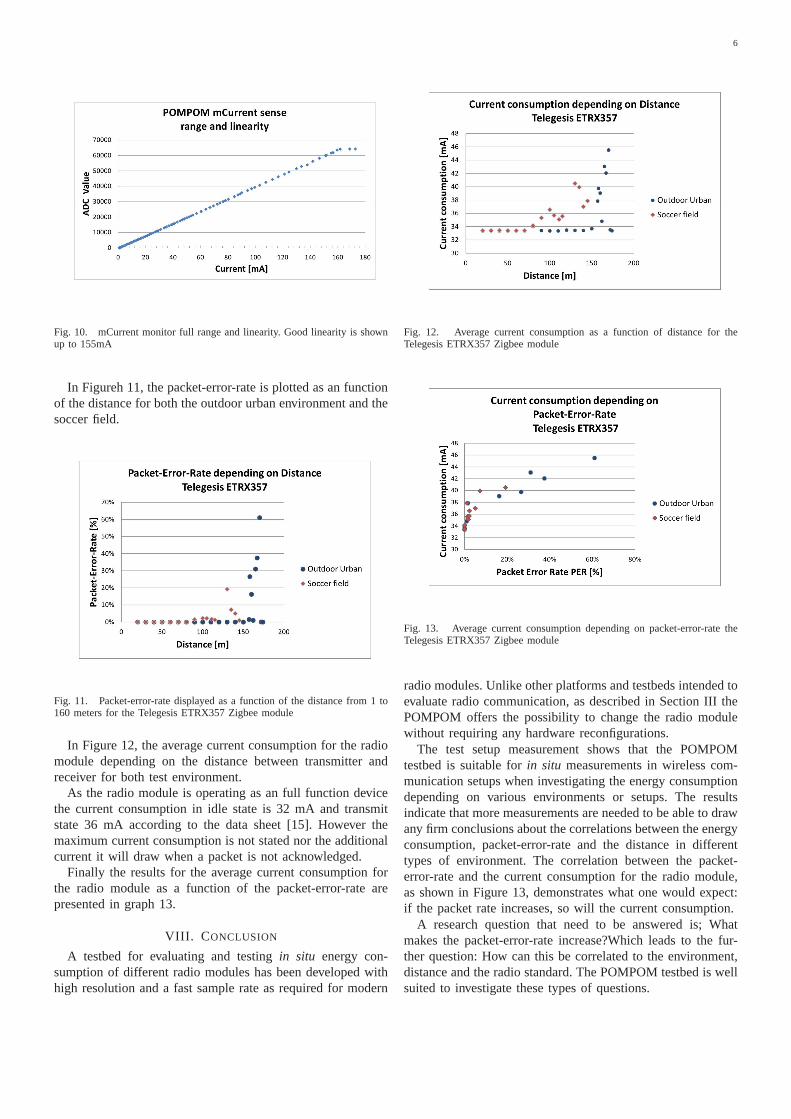
This section presents the results for the POMPOM measure-ment system. In this paper, the development of an embeddedmeasurement system that fulfills the requirements describedin section II is presented. The POMPOM system in shown inFigure 6 with three different interchangeable radio modules. Inthis the picture is on the top left is the Jennic ZigBee JN5139module [13]. The radio module in the middle is the BluegigaBluetooth Low Energy Class 2 BLE112 [14] and finally, theTelegesis ETRX357 Zigbee module [15] at the bottom.
In the last part of this section are the results of an initialmeasurement performed with the Telegesis ETRX357 Zigbeemodule presented. The measurement setup with the TelegesisETRX357 Zigbee module was chosen as to show proof ofconcept that POMPOM can control and do simultaneouscurrent consumption measurements. Future work will includecomparison studies with various Bluetooth and Zigbee mod-ules.
Fig. 4. Test environment soccer field
Fig. 5. Urban test environment
5
Fig. 6. POMPOM measurement system with interchangeable radiomodules:On the top left Jennic JN5139,in the middle Bluegiga BLE112 and bottomleft Telegesis ETRX357 radio modules
A. Range and Resolution
This section of the paper will show the results of the controlmeasurements needed for the calibration, range, linearityandsample rate.
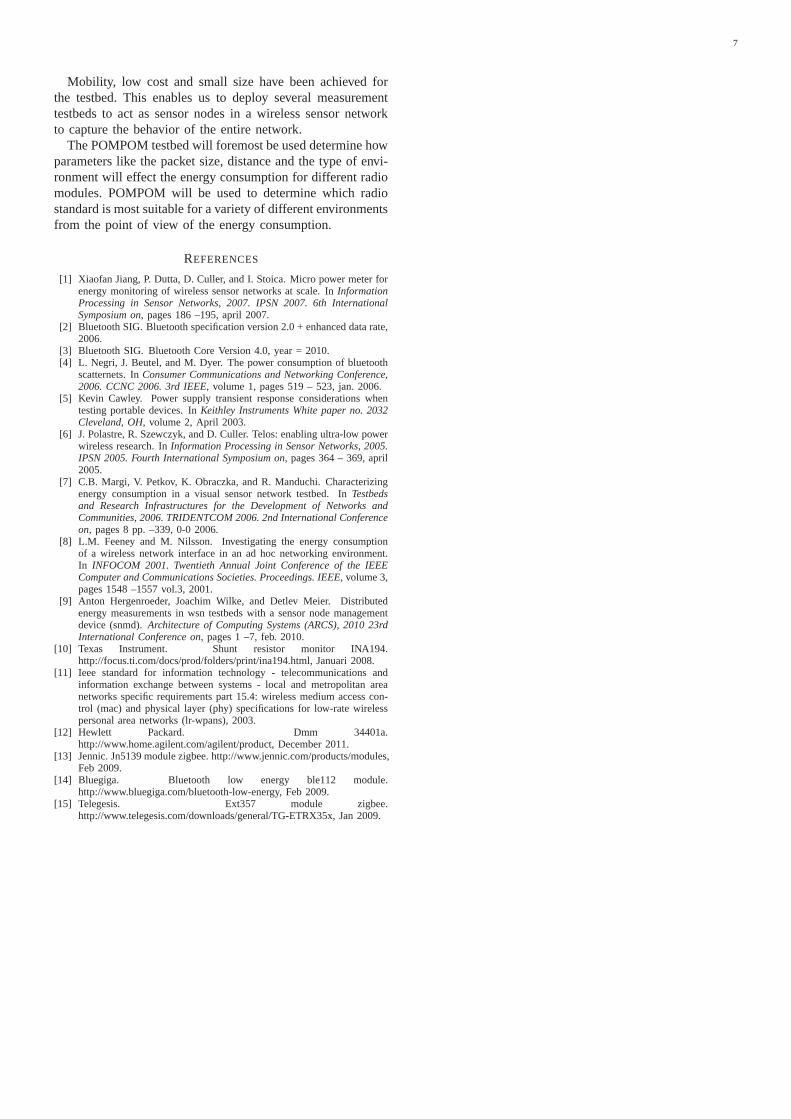
1) µCurrent Monitor: The full range and linearity ofthe POMPOMµCurrent monitoring system is shown in thegraph 8 that described in section V-B
The lowest currents measured for the POMPOMµCurrentmeter are shown with standard deviation in Figure 7. Thisgraph shows the current measurement in the range from 0.15 to0.85µAmpere. The graph shows that it is possible to measurecurrents below the 0.4µAmpere, as specified in Section V.
Fig. 7. µCurrent measurement. Range from 0.15 to 0.85µA
2) mCurrent Monitor: The full range and linearity of thePOMPOM mCurrent monitoring system described in SectionV-B is displayed in Figure 10. The graph shows good linearityfor the range up to 155mA.
The lowest currents measured for the POMPOM mCurrentmeter are shown with standard deviation in Figure 7. Thegraph shows the current measurement that ranges between 0.7
Fig. 8. µCurrent monitor full range and linearity
to 2 mA. However the the standard deviation for the mCurrenthas an maximum value for the range as depicted in the graphat 5.49 meaning it is not visible in the graph. The graph showsthat currents that currents from 0.8 mA can be measured withgood linearity and will complement theµCurrent Monitor’srange of 0.2µA to 1mA.
The POMPOM current measurement system has good lin-earity within the range examined and a total range of 0.2µAto 155mA.
The sample rate for the measurement system is set to200kSamples per second.
Fig. 9. mCurrent monitor measurement. Range from 0.7 to 2.1mA
B. Test measurement result
In this part of the results section, the test setup measure-ments are presented for a distributed Zigbee module. Allmeasurements are performed with the Telegesis ETRX357Zigbee module that operates as an full function device. Themeasurement setup and the environments in which the mea-surements were made are presented in Section VI-B.
6
Fig. 10. mCurrent monitor full range and linearity. Good linearity is shownup to 155mA
In Figureh 11, the packet-error-rate is plotted as an functionof the distance for both the outdoor urban environment and thesoccer field.
Fig. 11. Packet-error-rate displayed as a function of the distance from 1 to160 meters for the Telegesis ETRX357 Zigbee module
In Figure 12, the average current consumption for the radiomodule depending on the distance between transmitter andreceiver for both test environment.
As the radio module is operating as an full function devicethe current consumption in idle state is 32 mA and transmitstate 36 mA according to the data sheet [15]. However themaximum current consumption is not stated nor the additionalcurrent it will draw when a packet is not acknowledged.
Finally the results for the average current consumption forthe radio module as a function of the packet-error-rate arepresented in graph 13.
VIII. C ONCLUSION
A testbed for evaluating and testingin situ energy con-sumption of different radio modules has been developed withhigh resolution and a fast sample rate as required for modern
Fig. 12. Average current consumption as a function of distance for theTelegesis ETRX357 Zigbee module
Fig. 13. Average current consumption depending on packet-error-rate theTelegesis ETRX357 Zigbee module
radio modules. Unlike other platforms and testbeds intended toevaluate radio communication, as described in Section III thePOMPOM offers the possibility to change the radio modulewithout requiring any hardware reconfigurations.
The test setup measurement shows that the POMPOMtestbed is suitable forin situ measurements in wireless com-munication setups when investigating the energy consumptiondepending on various environments or setups. The resultsindicate that more measurements are needed to be able to drawany firm conclusions about the correlations between the energyconsumption, packet-error-rate and the distance in differenttypes of environment. The correlation between the packet-error-rate and the current consumption for the radio module,as shown in Figure 13, demonstrates what one would expect:if the packet rate increases, so will the current consumption.
A research question that need to be answered is; Whatmakes the packet-error-rate increase?Which leads to the fur-ther question: How can this be correlated to the environment,distance and the radio standard. The POMPOM testbed is wellsuited to investigate these types of questions.
7
Mobility, low cost and small size have been achieved forthe testbed. This enables us to deploy several measurementtestbeds to act as sensor nodes in a wireless sensor networkto capture the behavior of the entire network.
The POMPOM testbed will foremost be used determine howparameters like the packet size, distance and the type of envi-ronment will effect the energy consumption for different radiomodules. POMPOM will be used to determine which radiostandard is most suitable for a variety of different environmentsfrom the point of view of the energy consumption.
REFERENCES
[1] Xiaofan Jiang, P. Dutta, D. Culler, and I. Stoica. Micro power meter forenergy monitoring of wireless sensor networks at scale. InInformationProcessing in Sensor Networks, 2007. IPSN 2007. 6th InternationalSymposium on, pages 186 –195, april 2007.
[2] Bluetooth SIG. Bluetooth specification version 2.0 + enhanced data rate,2006.
[3] Bluetooth SIG. Bluetooth Core Version 4.0, year = 2010.[4] L. Negri, J. Beutel, and M. Dyer. The power consumption of bluetooth
scatternets. InConsumer Communications and Networking Conference,2006. CCNC 2006. 3rd IEEE, volume 1, pages 519 – 523, jan. 2006.
[5] Kevin Cawley. Power supply transient response considerations whentesting portable devices. InKeithley Instruments White paper no. 2032Cleveland, OH, volume 2, April 2003.
[6] J. Polastre, R. Szewczyk, and D. Culler. Telos: enablingultra-low powerwireless research. InInformation Processing in Sensor Networks, 2005.IPSN 2005. Fourth International Symposium on, pages 364 – 369, april2005.
[7] C.B. Margi, V. Petkov, K. Obraczka, and R. Manduchi. Characterizingenergy consumption in a visual sensor network testbed. InTestbedsand Research Infrastructures for the Development of Networks andCommunities, 2006. TRIDENTCOM 2006. 2nd International Conferenceon, pages 8 pp. –339, 0-0 2006.
[8] L.M. Feeney and M. Nilsson. Investigating the energy consumptionof a wireless network interface in an ad hoc networking environment.In INFOCOM 2001. Twentieth Annual Joint Conference of the IEEEComputer and Communications Societies. Proceedings. IEEE, volume 3,pages 1548 –1557 vol.3, 2001.
[9] Anton Hergenroeder, Joachim Wilke, and Detlev Meier. Distributedenergy measurements in wsn testbeds with a sensor node managementdevice (snmd).Architecture of Computing Systems (ARCS), 2010 23rdInternational Conference on, pages 1 –7, feb. 2010.
[10] Texas Instrument. Shunt resistor monitor INA194.http://focus.ti.com/docs/prod/folders/print/ina194.html, Januari 2008.
[11] Ieee standard for information technology - telecommunications andinformation exchange between systems - local and metropolitanareanetworks specific requirements part 15.4: wireless medium access con-trol (mac) and physical layer (phy) specifications for low-rate wirelesspersonal area networks (lr-wpans), 2003.
[12] Hewlett Packard. Dmm 34401a.http://www.home.agilent.com/agilent/product, December 2011.
[13] Jennic. Jn5139 module zigbee. http://www.jennic.com/products/modules,Feb 2009.
[14] Bluegiga. Bluetooth low energy ble112 module.http://www.bluegiga.com/bluetooth-low-energy, Feb 2009.
[15] Telegesis. Ext357 module zigbee.http://www.telegesis.com/downloads/general/TG-ETRX35x, Jan 2009.
Related Documents


![Challenge: COSMOS: A City-Scale Programmable Testbed for ... · new system designs. It should incorporate emerging spectrum tech-niques (e.g., dynamic spectrum sharing [21ś23], mmWave](https://static.cupdf.com/doc/110x72/5ed191cb38f837763c35f6ce/challenge-cosmos-a-city-scale-programmable-testbed-for-new-system-designs.jpg)