1 Data Quality and Query Cost in Wireless Sensor Networks David Yates, Erich Nahum, Jim Kurose, a nd Prashant Shenoy IEEE PerCom 2008 IEEE PerCom 2008

1 Data Quality and Query Cost in Wireless Sensor Networks David Yates, Erich Nahum, Jim Kurose, and Prashant Shenoy IEEE PerCom 2008.
Dec 20, 2015
Welcome message from author
This document is posted to help you gain knowledge. Please leave a comment to let me know what you think about it! Share it to your friends and learn new things together.
Transcript

1
Data Quality and Query Cost in Wireless Sensor Networks
David Yates, Erich Nahum, Jim Kurose, and Prashant Shenoy
IEEE PerCom 2008IEEE PerCom 2008
2
Papers
Data Quality and Query Cost in Wireless Sensor Networks
IEEE PerSeNS 2007IEEE PerSeNS 2007
Data Quality and Query Cost in Wireless Sensor Networks
IEEE PerCom 2008IEEE PerCom 2008
with analysis of performance trend

3
Outline
Introduction Caching and Lookup Policies Data Quality and Query Cost Discussion of Results Performance Trends
when value deviation is most important when end-to-end delay is most important
Conclusion

4
Introduction (1/4)
Data-centric WSNs Environmental and infrastructure monitoring Commercial and industrial sensing
Performance Metrics accuracy total system end-to-end delay the quality of the data provided to sensor networks applications

5
Introduction (2/4)Sensor Network Deployment Example:Sensor Network Deployment Example:
Sensor Field
Routers and switches Monitoring and control center
What if the gateway is augmented with storage?
Data server / Gateway (and cache)
Data Acquisition and Caching

6
Introduction (3/4)Data Server or Gateway with a Cache:Data Server or Gateway with a Cache:
cache hit vs. cache miss
7
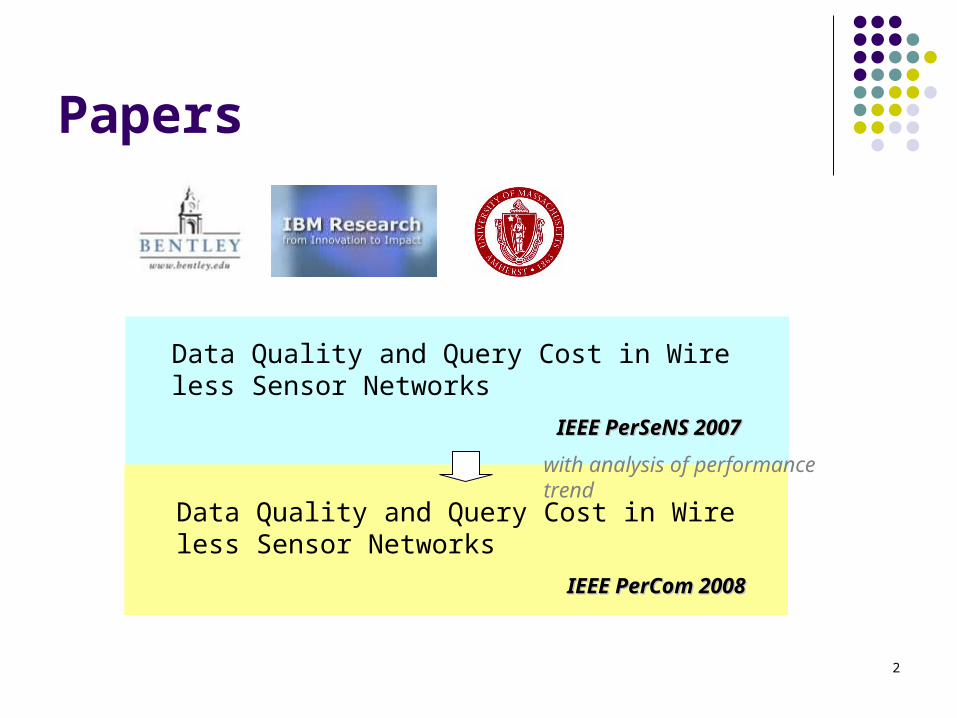
Introduction (4/4)
system delay the time between a query arriving and corresponding
reply departing from zero for a cache hit
value deviation the unsigned difference between the data value in
and the true value at location i
dS
mQuery
mReply
vD
mReply
8
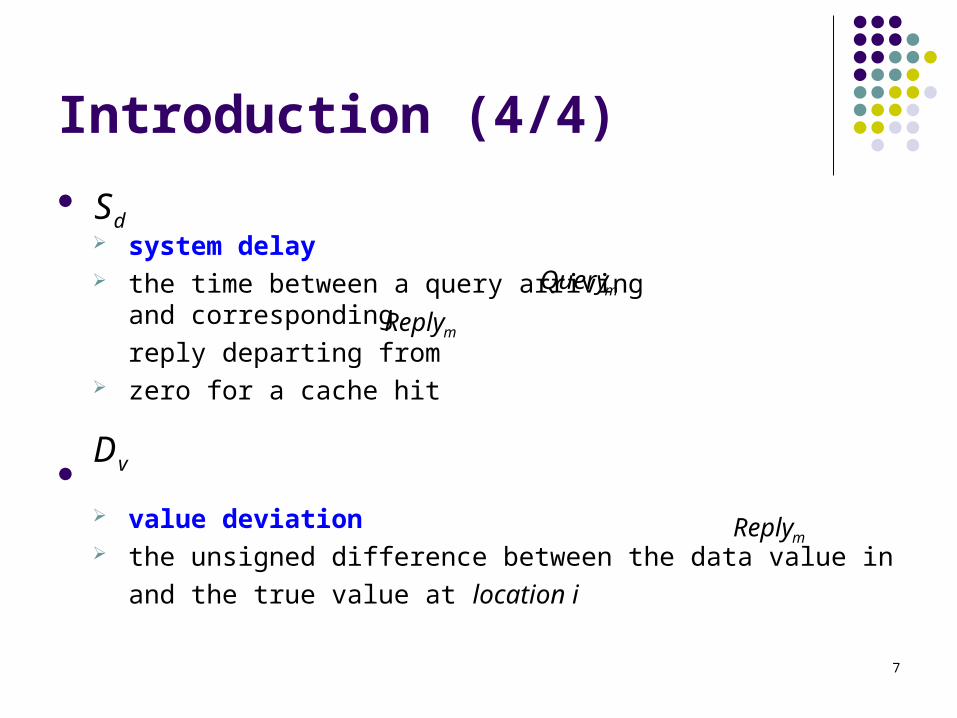
Caching and Lookup PoliciesPrecise Policies and Approximate Policies
Cac
he
Uti
liza
tio
n
FullFull
Not AvailableNot Available
All hitsage threshold parameter: T
All misses
Greedy Policies
Tcache entries are never deleted, updated, or replaced
Greedy age lookups ( )
Greedy distance lookups ( )
Median-of-3 lookups ( )
T
T
T
Precise PoliciesSimple lookups ( ), Piggybacked queries ( )TT
0T
Spatial LocalitySpatial Locality
'iv iv )(' ii lNl

9
Data Quality and Query CostQuality Measurement
Data Quality linear combination of normalized system delay and normalized
value deviation : relative importance
A
nQ
cbn e
Ae
AQ
1
11
1
1
Softmax normalization
v
vv
d
dd
D
DDc
S
SSb
stddev
mean
stddev
mean
10 A
Small values indicate better data quality!
Z-score normalization
10
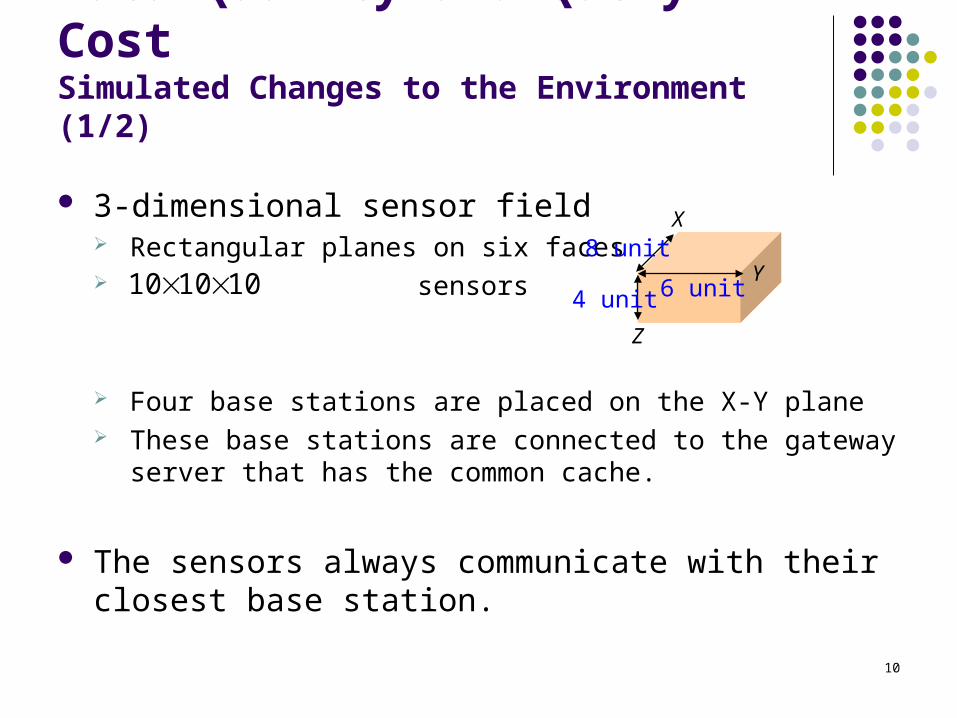
Data Quality and Query CostSimulated Changes to the Environment (1/2)
3-dimensional sensor field Rectangular planes on six faces sensors
Four base stations are placed on the X-Y plane These base stations are connected to the gateway server that
has the common cache.
The sensors always communicate with their closest base station.
101010 6 unit
8 unit
4 unit
X
Y
Z

11
Data Quality and Query CostSimulated Changes to the Environment (2/2)
One-way communication to and from
minimum cost to query a location: 2 units (query and reply)
maximum delay to query a location: 2 seconds
llocation
unit 1min | 2' lbl CostrpCost
normalization constant distance
second 1max | ' lbl DelayrqDelay
normalization constant distance

12
Data Quality and Query CostTrace-driven Changes to the Environment
Intel Lab Dataset 2-dimensional field 54 Mica2Dot sensors light intensity: the most dynamically changing of sensor values
Assume the sensors always communicate with their closest base station.
Sensor Field
Intel Berkeley Research Lab
13
Data Quality and Query CostQuery Workload Model (1/2)
Query Workload Model periodic arrival process random arrival process
The superposition of two query processes polling component
slowly scans the sensor field at fixed rate the period of the polling component of the query workload:
random component queries to different locations in the sensor field average query arrival rate of the random component:

14
Data Quality and Query CostQuery Workload Model (2/2)
Simulated changes to the environment exponentially distributed inter-arrival times with mean
90 queries per second
Trace-driven changes to the environment
0.9 queries per second
condqueries/se 81/1
seconds 11.111 9 queries/second
seconds 600condqueries/se 81.0
0.09 queries/second
15
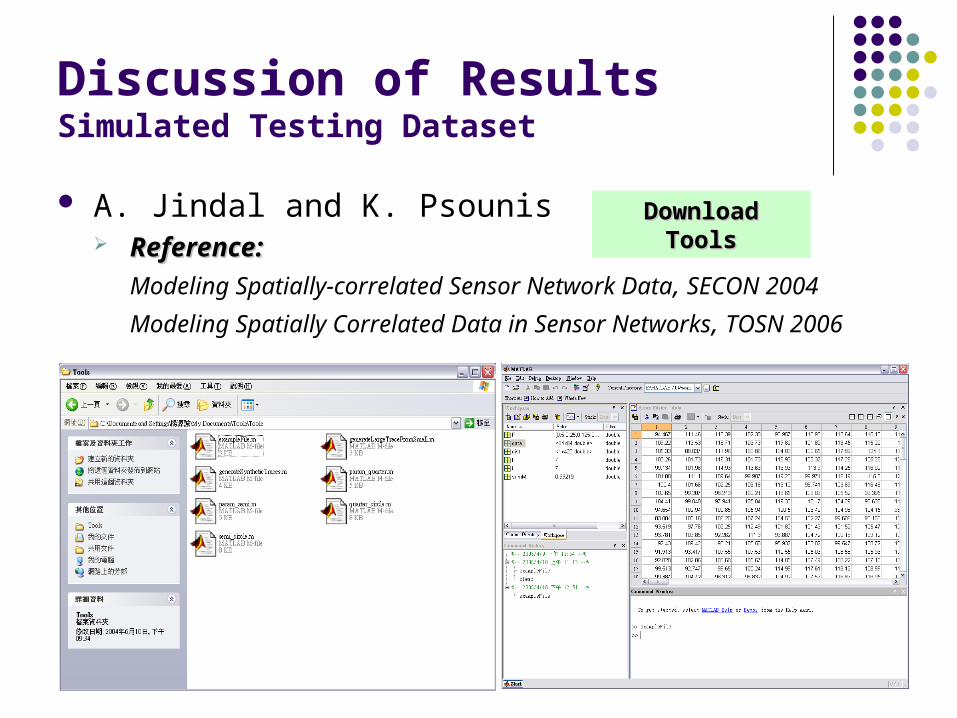
Discussion of ResultsSimulated Testing Dataset
A. Jindal and K. Psounis Reference:Reference:
Modeling Spatially-correlated Sensor Network Data, SECON 2004
Modeling Spatially Correlated Data in Sensor Networks, TOSN 2006
Download ToolsDownload Tools
16
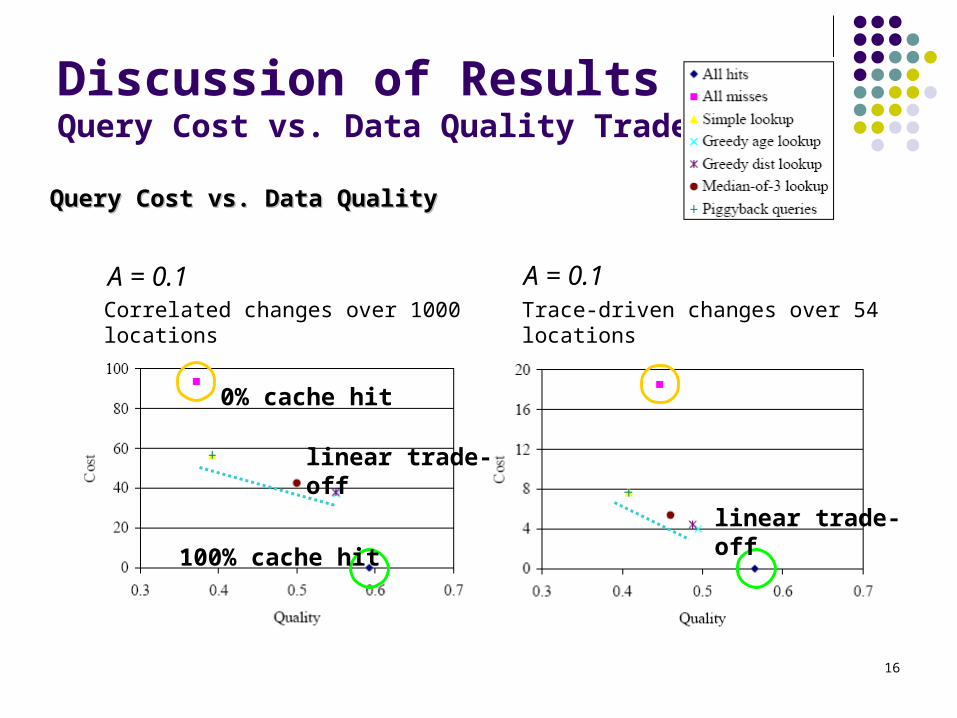
Discussion of ResultsQuery Cost vs. Data Quality Trade-off
Query Cost vs. Data QualityQuery Cost vs. Data Quality
Correlated changes over 1000 locations Trace-driven changes over 54 locations
A = 0.1 A = 0.1
100% cache hit
0% cache hit
linear trade-off
linear trade-off

17
Discussion of ResultsQuery Cost vs. End-to-End Delay
Query Cost vs. End-to-End DelayQuery Cost vs. End-to-End Delay
Correlated changes over 1000 locations Trace-driven changes over 54 locations
A = 0.1 A = 0.1
an increase in the normalized delay term!
1.18 4.4

18
Discussion of ResultsQuery Cost vs. Data Quality Trade-off
Query Cost vs. Data QualityQuery Cost vs. Data Quality
Correlated changes over 1000 locations Trace-driven changes over 54 locations
A = 0.9 A = 0.9
No trade-off No trade-off
the best performance the best performance

19
Discussion of ResultsHit Ratios, Query Costs, and End-to-End Delays
Hit Ratios, Query Costs, and End-to-End DelaysHit Ratios, Query Costs, and End-to-End Delays
Correlated changes over 1000 locations Trace-driven changes over 54 locations, 90 queries/second T = 90, 0.9 queries/second88.8T
Hit ratio Query Cost End-to-End Delay

20
Discussion of ResultsQuery Cost vs. Value Deviation
Query Cost vs. Value DeviationQuery Cost vs. Value Deviation
Correlated changes over 1000 locations Trace-driven changes over 54 locations
A = 0.1 A = 0.1
increase the dispersion

21
Discussion of ResultsWhether Delay or Value Deviation?
Query Cost vs. Data QualityQuery Cost vs. Data Quality
Correlated changes over 1000 locations Trace-driven changes over 54 locations
A = 0.1 A = 0.1
Quality is more important.
Cost is at a premium.
value deviation is more important than delay

22
Discussion of ResultsWhether Delay or Value Deviation?
Query Cost vs. Data QualityQuery Cost vs. Data Quality
value deviation is more important than delay
Correlated changes over 1000 locations Trace-driven changes over 54 locations
A = 0.9 A = 0.9
Getting the fast response time of a cache “hit” is worthwhile!
23
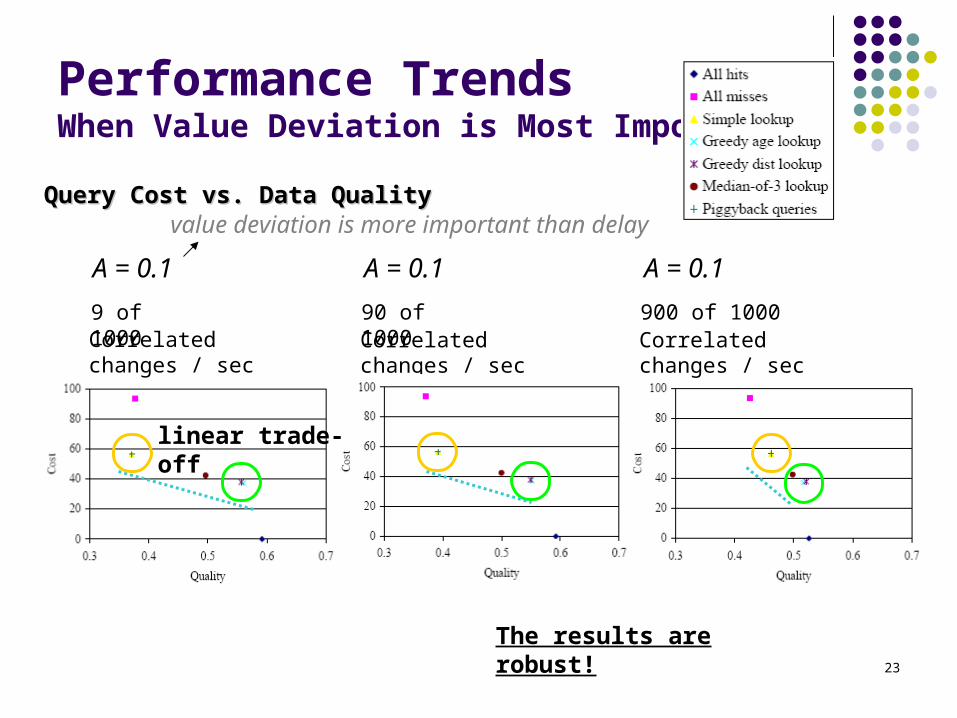
Performance TrendsWhen Value Deviation is Most Important
Query Cost vs. Data QualityQuery Cost vs. Data Quality
Correlated changes / sec
A = 0.1 A = 0.1
9 of 1000Correlated changes / sec Correlated changes / sec90 of 1000 900 of 1000
A = 0.1
linear trade-off
The results are robust!
value deviation is more important than delay

24
Performance TrendsWhen Value Deviation is Most Important
Value Deviation vs. Data QualityValue Deviation vs. Data Quality
Correlated changes / sec
A = 0.1 A = 0.1
9 of 1000Correlated changes / sec Correlated changes / sec90 of 1000 900 of 1000
A = 0.1
strong positive correlation!
Environment Changes Value Deviation
value deviation is more important than delay
25
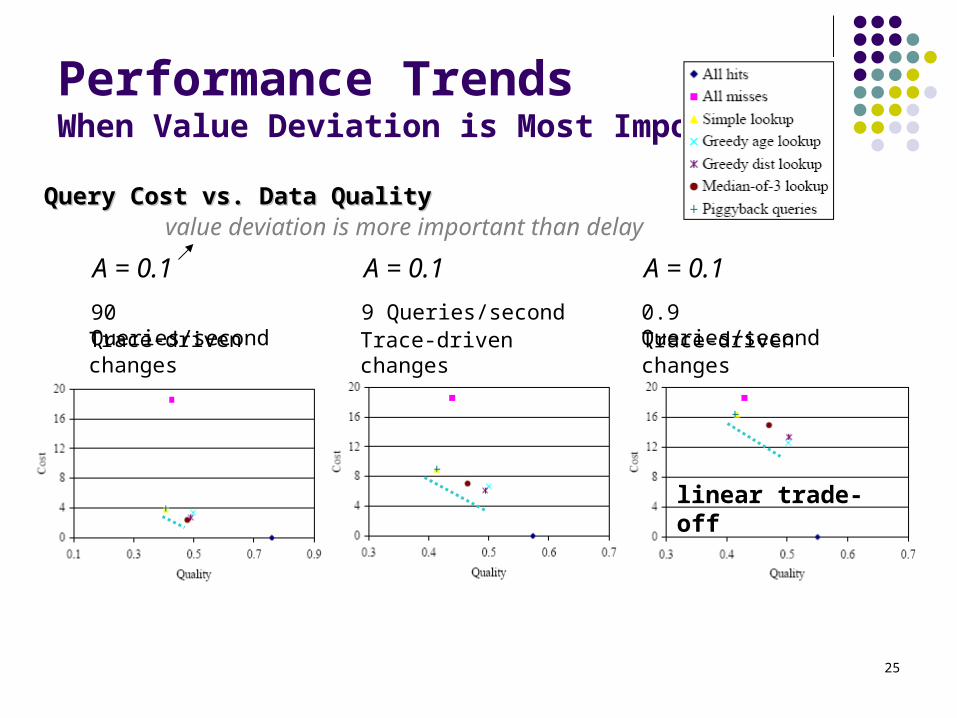
Performance TrendsWhen Value Deviation is Most Important
Query Cost vs. Data QualityQuery Cost vs. Data Quality
Trace-driven changes
A = 0.1 A = 0.1
90 Queries/secondTrace-driven changes9 Queries/second
A = 0.1
0.9 Queries/secondTrace-driven changes
linear trade-off
value deviation is more important than delay

26
Performance TrendsWhen Value Deviation is Most Important
Value Deviation vs. Data QualityValue Deviation vs. Data Quality
Trace-driven changes
A = 0.1 A = 0.1
90 Queries/secondTrace-driven changes9 Queries/second
A = 0.1
0.9 Queries/secondTrace-driven changes
strong positive correlation!
value deviation is more important than delay
27
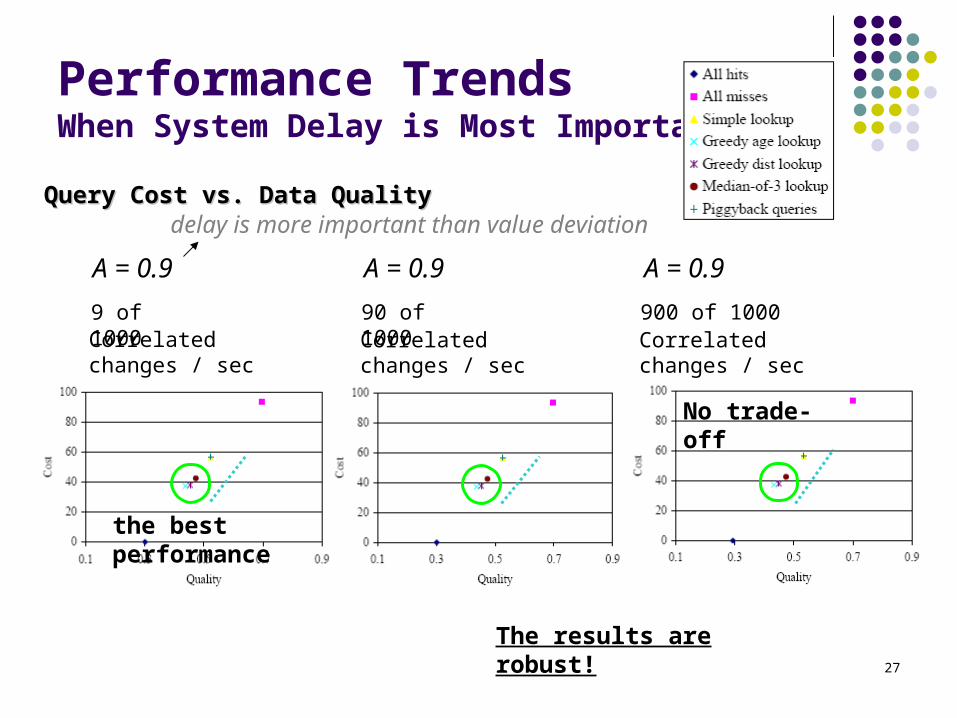
Performance TrendsWhen System Delay is Most Important
Query Cost vs. Data QualityQuery Cost vs. Data Quality
Correlated changes / sec
A = 0.9 A = 0.9
9 of 1000Correlated changes / sec Correlated changes / sec90 of 1000 900 of 1000
A = 0.9
delay is more important than value deviation
the best performance
The results are robust!
No trade-off

28
Performance TrendsWhen System Delay is Most Important
End-to-End Delay vs. Data QualityEnd-to-End Delay vs. Data Quality
Correlated changes / sec
A = 0.9 A = 0.9
9 of 1000Correlated changes / sec Correlated changes / sec90 of 1000 900 of 1000
A = 0.9
delay is more important than value deviation
strong positive correlation!
29
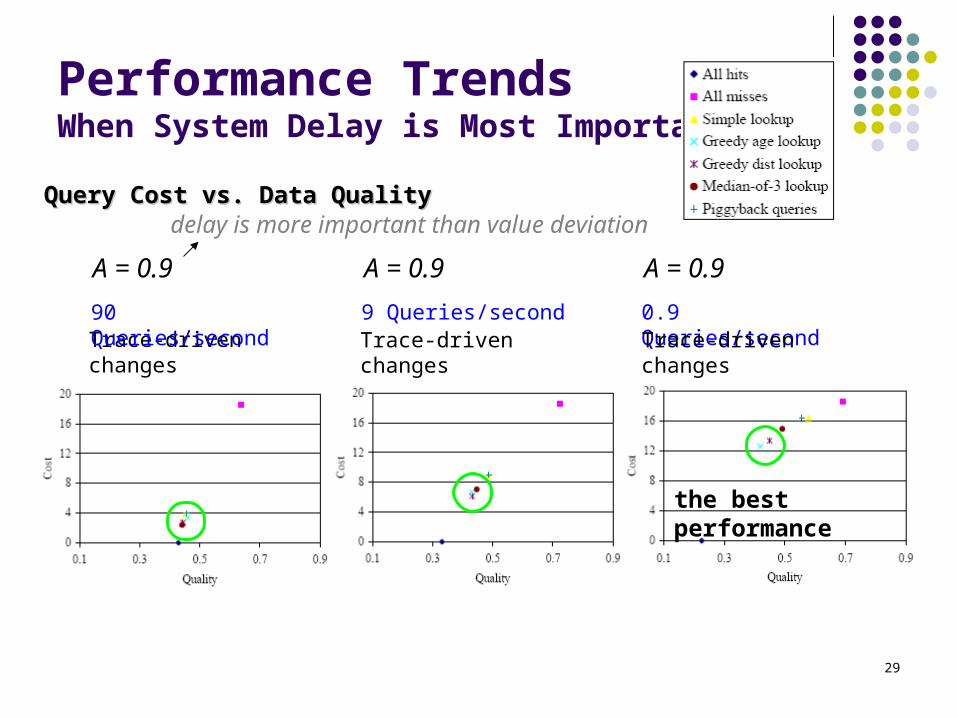
Performance TrendsWhen System Delay is Most Important
Query Cost vs. Data QualityQuery Cost vs. Data Quality
A = 0.9 A = 0.9 A = 0.9
delay is more important than value deviation
Trace-driven changes90 Queries/second
Trace-driven changes9 Queries/second 0.9 Queries/second
Trace-driven changes
the best performance
30
Conclusion We measure the benefit and cost of seven different
caching and lookup policies. when delay drives data quality when value deviation drives data quality
Query Cost vs. Data Quality linear trade-off cost vs. accuracy and/or cost vs. delay are also linear
The performance trends generally remain the same. with the environment changes on query cost and data quality
performance
Related Documents