1 Credit Risk Analysis

1 Credit Risk Analysis. 2 What is a bond? A long-term debt instrument in which a borrower agrees to make payments of principal and interest, on specific.
Dec 16, 2015
Welcome message from author
This document is posted to help you gain knowledge. Please leave a comment to let me know what you think about it! Share it to your friends and learn new things together.
Transcript
1
Credit Risk Analysis
2
What is a bond?
A long-term debt instrument in which a borrower agrees to make payments of principal and interest, on specific dates, to the holders of the bond.
Creditors receive interest and principal payments they have been promised

3
What determines interest rates of corporate bonds?
ki = k* + IP + MRP +DRP + LP
ki = required return on a debt securityk* = real risk-free rate of interestIP = inflation premiumMRP= maturity risk premium (also called
interest rate risk premium) DRP= default risk premiumLP = liquidity premium

4
Default risk
If an issuer defaults, investors receive less than the promised return. Therefore, the expected return on corporate bonds might be less than the promised return.
Default risk is influenced by the issuer’s financial strength and the terms of the bond contract.

5
Default Risk
A bond also has legal rights attached to it: if the borrower doesn’t make the required
payments, bondholders can force bankruptcy proceedings
in the event of bankruptcy, bond holders get paid before equity holders

6
Bankruptcy
Two main chapters of the Federal Bankruptcy Act: Chapter 11, Reorganization Chapter 7, Liquidation
Chapter 11 bankruptcy is a financial reorganization in which the company continues to operate and works with creditors to formulate repayment plans.Chapter 7 bankruptcy is a complete liquidation in which the firm ceases operations and sells all assets.Typically, a company wants Chapter 11, while creditors may prefer Chapter 7.

7
Credit rating
Rely on qualitative and quantitative analyses
Standard & Poor’s (AAA to D) Intermediate “+/-” scores
Moody’s (Aaa to C) Intermediate “1,2,3” scores
Fitch (AAA to D)
8
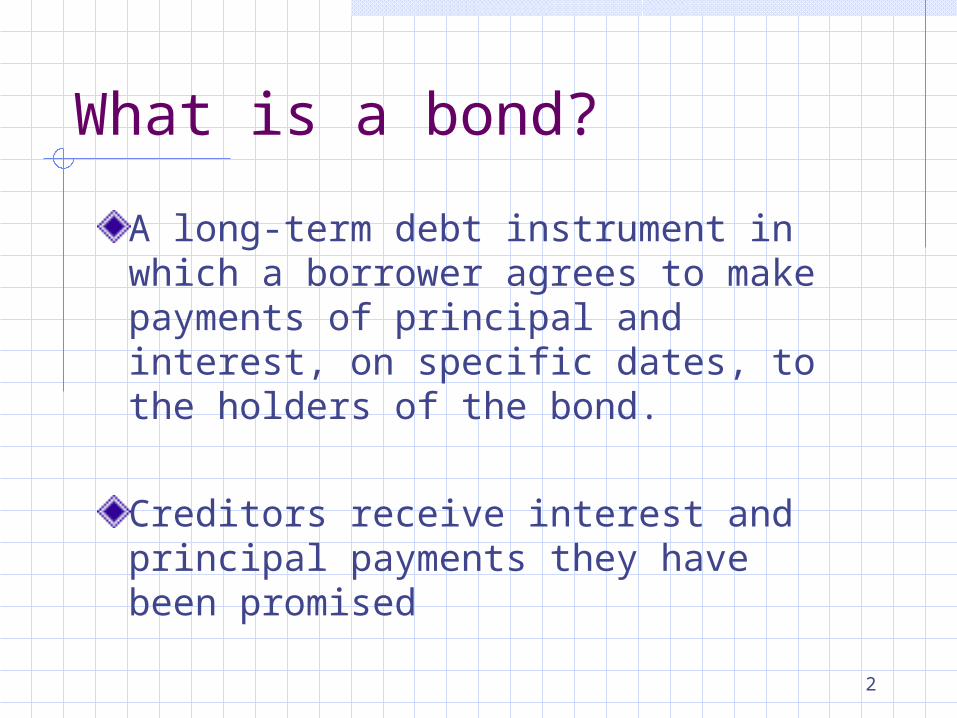
Bond Quality RatingsRating Grades Standard & Poor’s Moody’s
Highest grade AAA AaaHigh grade AA AaUpper medium A ALower medium BBB BaaMarginally speculative BB BaHighly speculative B B, CaaDefault D Ca, C
Rating Criteria

9
Now more competition!
Of the more than 130 credit-rating agencies, the SEC has granted only five the designation NRSROs: Moody's, S&P, A.M. Best, Dominion Bond Rating Service, and Fitch Ratings. President Bush Signs Rating Agency Reform Act on October 2006A credit-rating company with three years of experience that meets certain standards would be allowed to register with the SEC as a “nationally recognized statistical ratings organization (NRSRO)."

10
Ratings and Yields
Rating Debt Obligations
Source: Standard & Poor’s, 2002
10-Year Treasury and Corporate Bond Yields - 2002
0 1 2 3 4 5 6 7
Treasury
AAA
AA
A
Percent
11
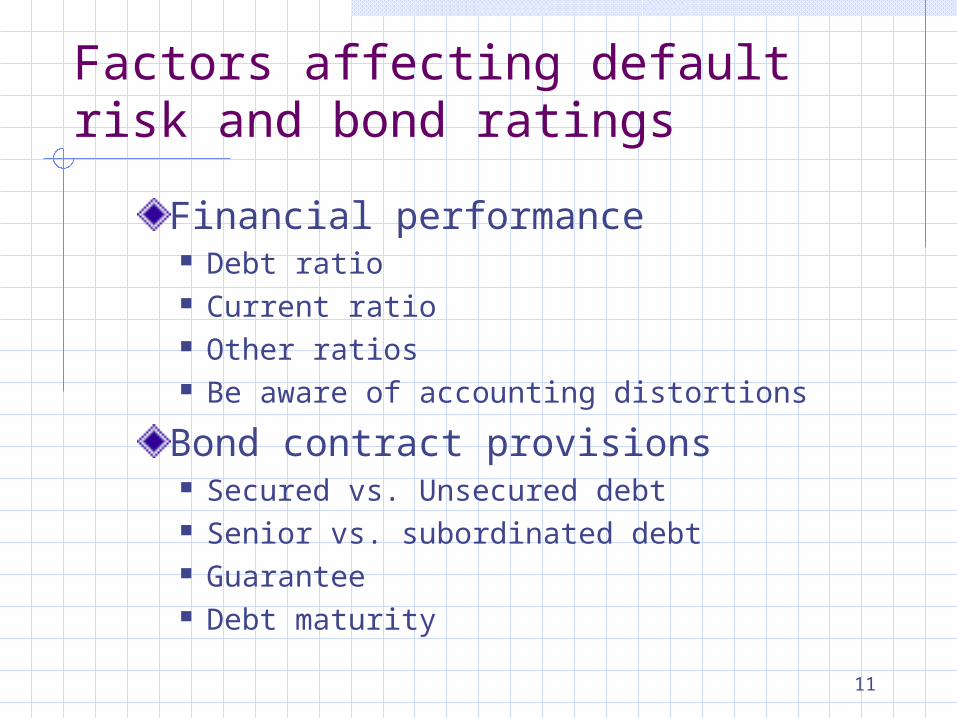
Factors affecting default risk and bond ratings
Financial performance Debt ratio Current ratio Other ratios Be aware of accounting distortions
Bond contract provisions Secured vs. Unsecured debt Senior vs. subordinated debt Guarantee Debt maturity
12
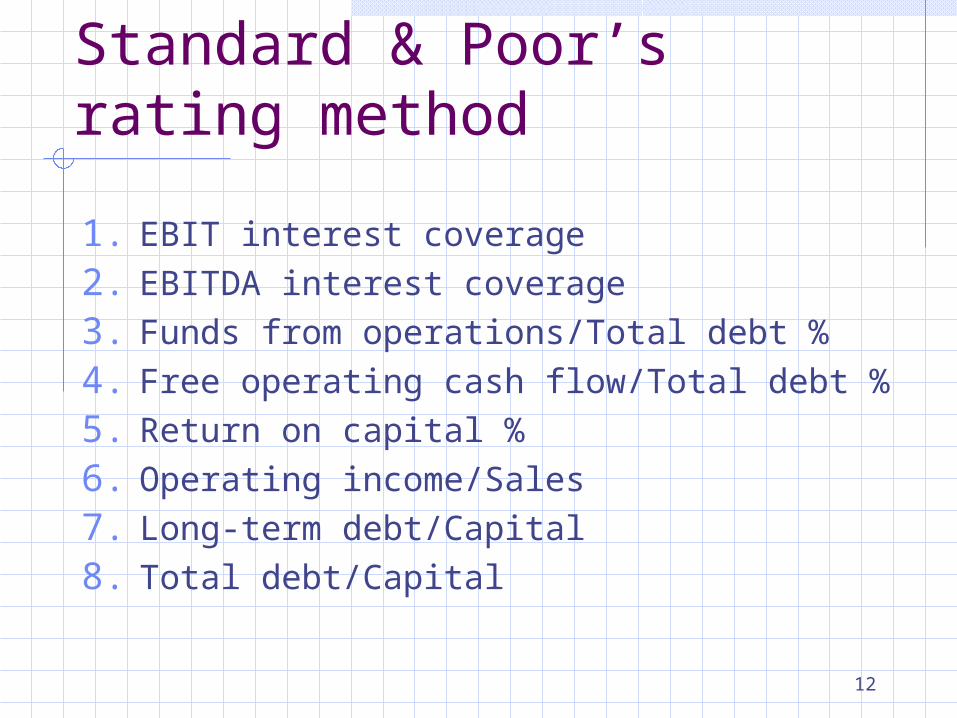
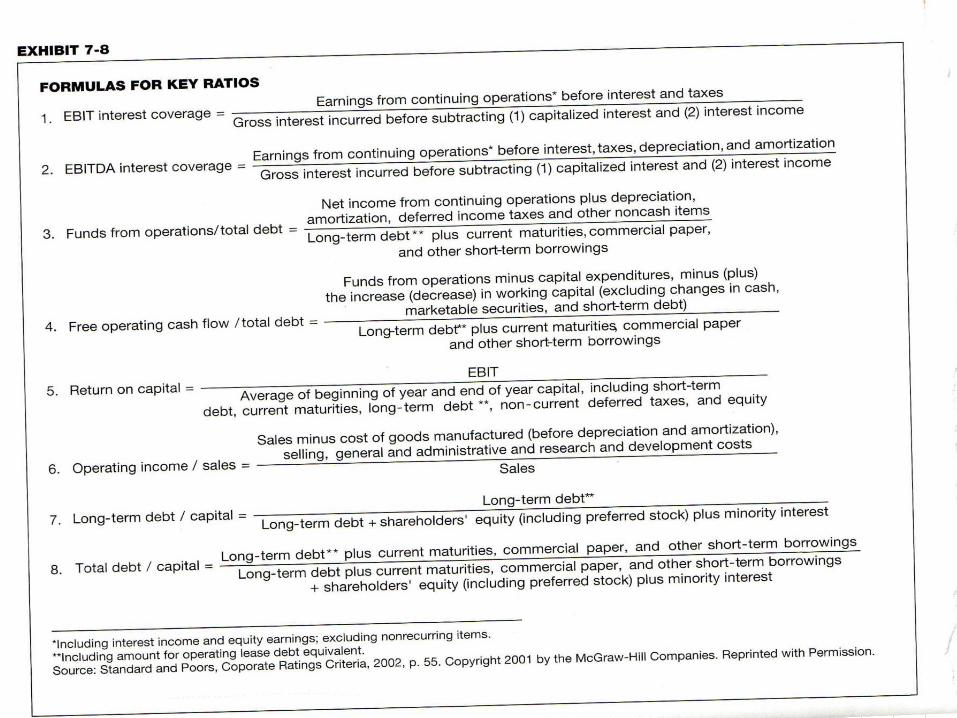
Standard & Poor’s rating method
1. EBIT interest coverage
2. EBITDA interest coverage
3. Funds from operations/Total debt %
4. Free operating cash flow/Total debt %
5. Return on capital %
6. Operating income/Sales
7. Long-term debt/Capital
8. Total debt/Capital
13

14

15
17
Financial distress
Financial distress can also be directly predicted.
18
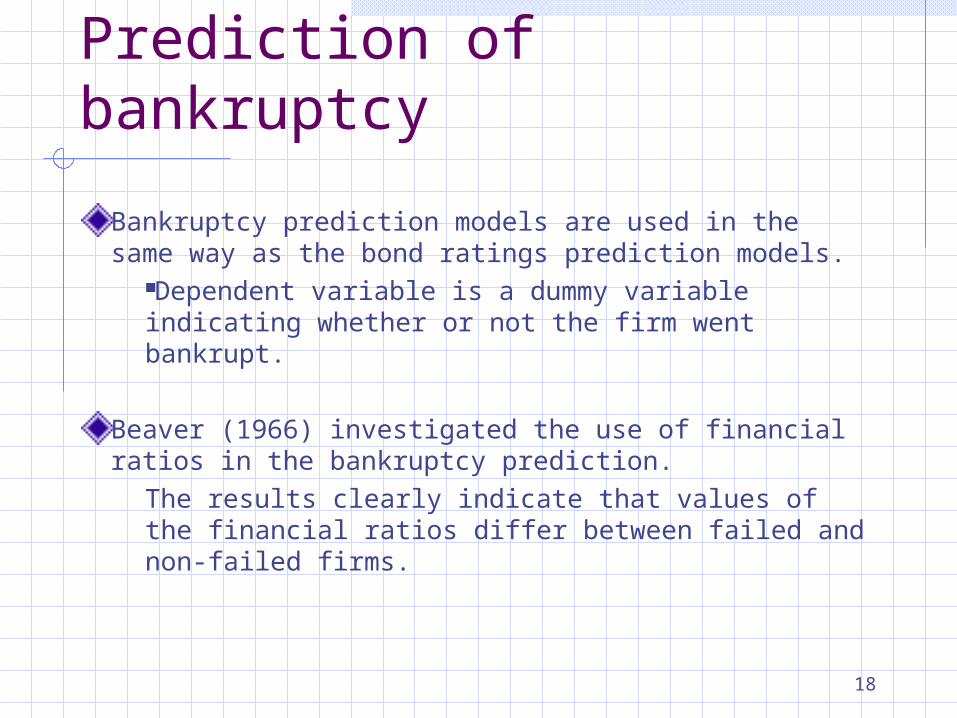
Prediction of bankruptcy
Bankruptcy prediction models are used in the same way as the bond ratings prediction models.
Dependent variable is a dummy variable indicating whether or not the firm went bankrupt.
Beaver (1966) investigated the use of financial ratios in the bankruptcy prediction.
The results clearly indicate that values of the financial ratios differ between failed and non-failed firms.

19
Prediction of financial distressUnivariate models
Beaver (1966) relied on Cash flow to total debt Net income to total assets Total debt to total assets Working capital to total assets Current ratio

20
Example: Cash flow / total debt
-0.3
-0.2
-0.10
0.1
0.2
0.30.4
0.5
0.6
5 4 3 2 1
Years before failure
Nonfailedfirms
Failed firms

21
Example (cont.): Net income / total assets
-0.25
-0.2
-0.15
-0.1
-0.05
0
0.05
0.1
5 4 3 2 1
Years before failure
Nonfailedfirms
Failed firms

22
Example (cont.): Total debt / total assets
00.10.20.30.40.50.60.70.80.9
5 4 3 2 1
Years before failure
Failed firms
Nonfailedfirms

23
Example (cont.): Working capital / total assets
00.050.1
0.150.2
0.250.3
0.350.4
0.45
5 4 3 2 1
Years before failure
Nonfailedfirms
Failed firms

24
Example (cont.): Current ratio
0
0.5
1
1.5
2
2.5
3
3.5
4
5 4 3 2 1
Years before failure
Nonfailedfirms
failed firms
25
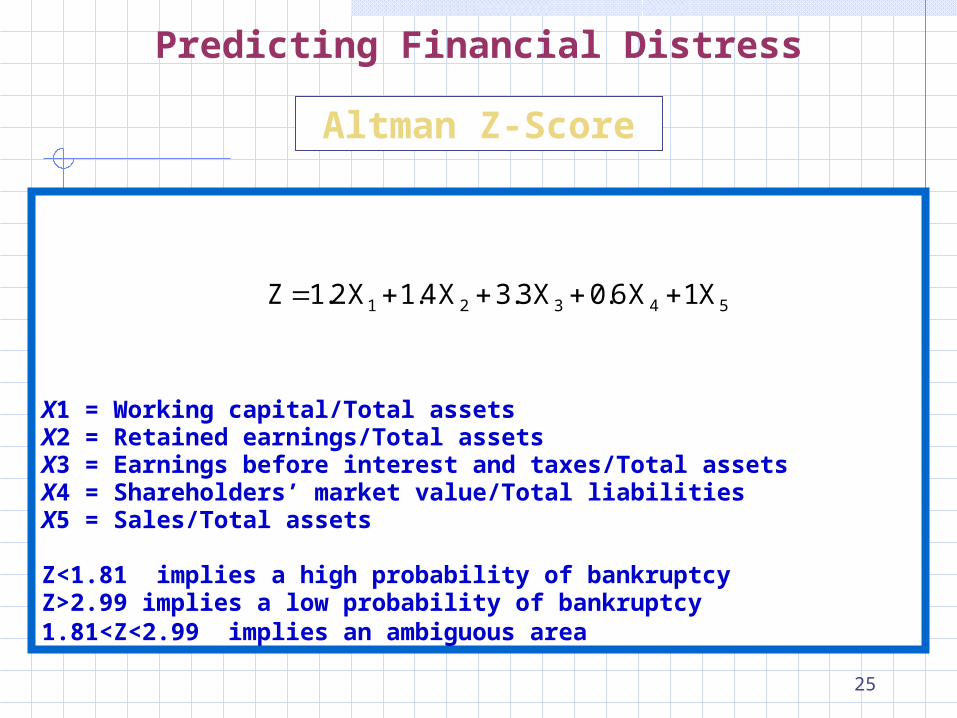
X1 = Working capital/Total assetsX2 = Retained earnings/Total assetsX3 = Earnings before interest and taxes/Total assetsX4 = Shareholders’ market value/Total liabilitiesX5 = Sales/Total assets
Z<1.81 implies a high probability of bankruptcyZ>2.99 implies a low probability of bankruptcy1.81<Z<2.99 implies an ambiguous area
Predicting Financial Distress
Altman Z-Score
1 2 3 4 5Z 1.2X 1.4X 3.3X 0.6X 1X

26
Prediction of financial distressMultivariate models
Altman Z-score (Current assets – current liabilities)/total assets Retained earnings/Total assets EBIT/Total assets Preferred and common stock market value/Book value of
liabilities Sales/Total assets
Nokia = 9.88Motorola = 1.71 (below the 2.99 nonbankrupt benchmark)

30
Motorola, Note 8Off-balance-sheet financing
“At December 31, 2001, future minimum lease obligations, net of minimum sublease rentals, for the next five years and beyond are as follows: 2002—$150 million; 2003—$117 million; 2004—$97 million; 2005—$76 million; 2006—$63 million; beyond—$90 million.”
•The present value of these payments, at 7%, is $484 million•Inclusion of these items increases debt by 5%

33
Nokia debt note detailOperating lease payments
Payments due Amount PV factor PV2002 254 € 0.9346 237 €2003 213 € 0.8734 186 €2004 178 € 0.8163 145 €2005 165 € 0.7629 126 €2006 162 € 0.7130 116 €
Beyond 274 € 0.6663 183 €993 €Total estimated liability

34
Elements of Free Operating Cash Flow
2001 Nokia (EURm) Motorola ($m)
EBITDA 5,735 (4,039)
Non-cash items 248 (2,273)
Fund from operations 5,983 (6,312)
Capital expenditures (1,041) (1,321)
Working capital change 978 1,527
Free operating cash flow 5,920 (6,106)

35
Debt Analysis Ratios
2001 2000 2001 2000EBIT interest coverage 37.11 31.91 (10.22) 2.97 EBITDA interest coverage 49.44 37.06 (6.26) 8.68 Funds from operations/Total debt 4.63 5.04 (0.58) 0.29 Free operating cash flow/Total debt 4.59 2.97 (0.56) (0.40) Return on end of year capital 0.31 0.50 (0.27) 0.04 Operating income/Sales 0.160 0.195 0.018 0.116 Long-term debt/Capital 0.085 0.066 0.421 0.238 Total debt/Capital 0.094 0.115 0.443 0.427
Nokia Motorola

36
38
More Recent Advances in Distress Prediction
RiskCalc
Market (Merton) Model

39

40
RiskCalc™
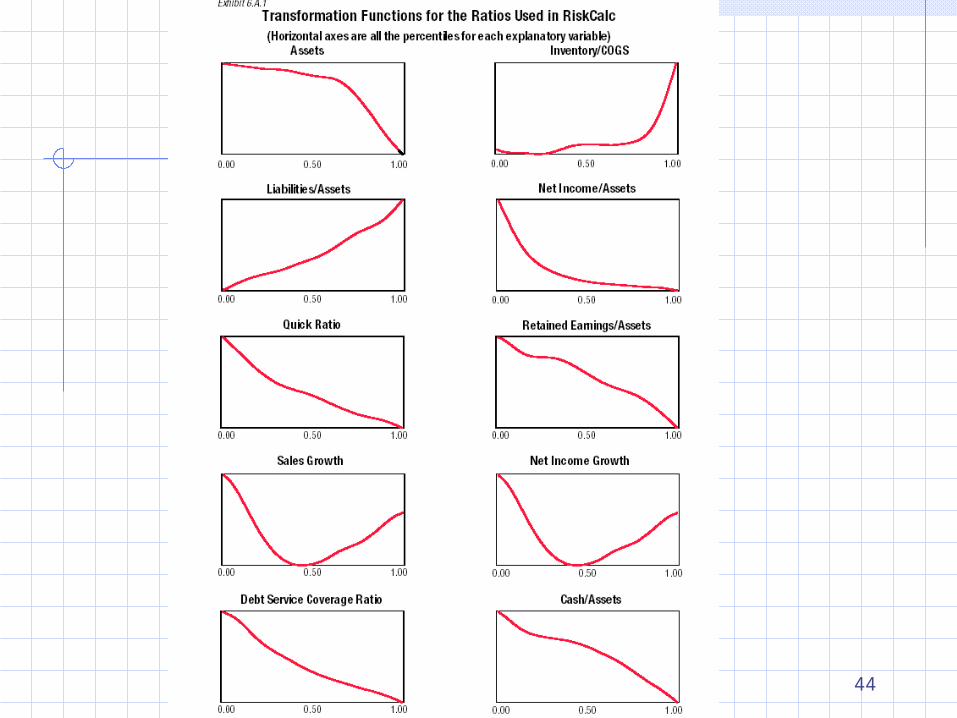
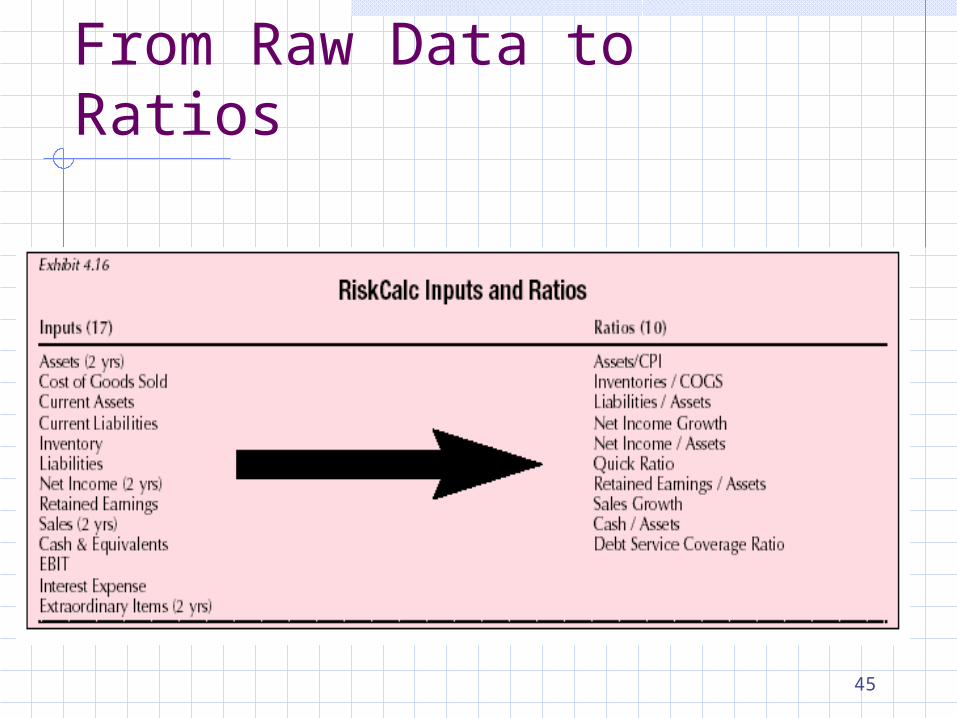
“The model's key advantage derives from Moody's unique and proprietary middle market private firm financial statement and default database (Credit Research Database), which comprises 28,104 companies and 1,604 defaults. Our main insights and conclusions are:…Comprehensive testing and validation suggest that RiskCalc's predictive power is superior to that of other publicly available benchmark models and is robust across non-financial industry sectors, and over time. RiskCalc™ was developed to achieve maximum predictive power with the smallest number of inputs. It requires just 10 financial ratios & indicators computed from 17 basic financial inputs. RiskCalc's predictive power derives, in part, from its meticulous transformation of input financial ratios….” Source: RiskCalc™ For Private Companies: Moody's Default Model , may 2000
41
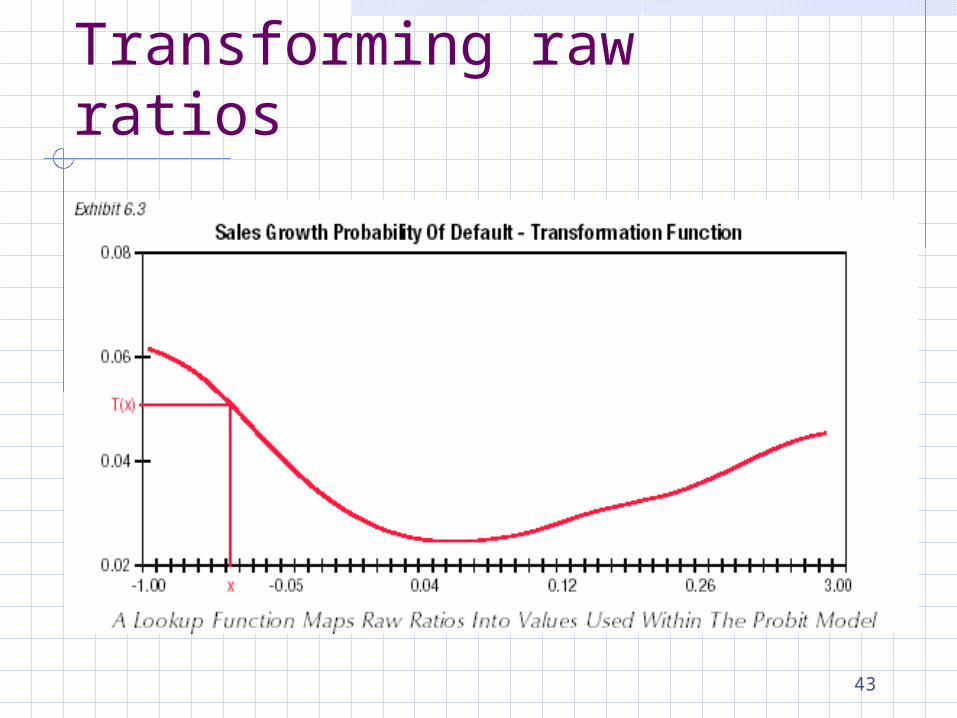
43
Transforming raw ratios
44
45
From Raw Data to Ratios

46
Contribution of Factors

49
Market Model (Not required)
Banks can use the theory of option pricing to assess the credit risk of a corporate borrower
The probability of default is positively related to: the volatility of the firm’s stock the firm’s leverage
A model developed by KMV corporation is being widely used by banks for this purpose

50
Related Documents