PRIME VISION / CA FINAL / SCM & PE / THEORY 1 1. COST OF QUALITY (COQ) Quality is concerned with conformance to specification; ability to satisfy customer expectations and value for money. Recognising the importance of cost of quality is important in terms of continuous improvement process. The cost of control/conformance and the cost of failure of control/non-conformance is the quantitative measure of COQ. It is the sum of the costs related to prevention and detection of defects and the costs incurred due to occurrences of defects. Views regarding Cost of Quality In the past, it was assumed that increased quality is accompanied by increased cost; higher quality means higher cost. Today view of quality cost among practitioners fall into three categories: ▪ Higher quality means higher cost: Quality attributes such as performance and features cost more in terms of labour, material, design, and other costly resources. The additional benefits which are gained from improved quality do not compensate for the additional expenses. ▪ The resultant savings are greater than the cost of improving quality: Deming promoted this view, which is still widely accepted in Japan. The savings result from less rework, scrap, and other direct expenses related to defects. Japanese firms made continuous improvements using this philosophy. ▪ Quality costs are those incurred in excess of those that would have been incurred if product was built or service performed exactly right the first time: This view is held by adherents of the TQM philosophy. Here not only direct costs are included, but also those resulting from loss of customers, loss in market share, and many hidden costs and foregone opportunities not identified by modern cost accounting systems. Components of COQ

Welcome message from author
This document is posted to help you gain knowledge. Please leave a comment to let me know what you think about it! Share it to your friends and learn new things together.
Transcript

PRIME VISION / CA FINAL / SCM & PE / THEORY
1
1. COST OF QUALITY (COQ)
Quality is concerned with conformance to specification; ability to satisfy customer expectations and value for money. Recognising the importance of cost of quality is important in terms of continuous improvement process. The cost of control/conformance and the cost of failure of control/non-conformance is the quantitative measure of COQ. It is the sum of the costs related to prevention and detection of defects and the costs incurred due to occurrences of defects.
Views regarding Cost of Quality
In the past, it was assumed that increased quality is accompanied by increased cost; higher quality means higher cost. Today view of quality cost among practitioners fall into three categories:
▪ Higher quality means higher cost:
Quality attributes such as performance and features cost more in terms of labour, material, design, and other costly resources. The additional benefits which are gained from improved quality do not compensate for the additional expenses.
▪ The resultant savings are greater than the cost of improving quality:
Deming promoted this view, which is still widely accepted in Japan. The savings result from less rework, scrap, and other direct expenses related to defects. Japanese firms made continuous improvements using this philosophy.
▪ Quality costs are those incurred in excess of those that would have been incurred if product was built or service performed exactly right the first time:
This view is held by adherents of the TQM philosophy. Here not only direct costs are included, but also those resulting from loss of customers, loss in market share, and many hidden costs and foregone opportunities not identified by modern cost accounting systems.
Components of COQ

PRIME VISION / CA FINAL / SCM & PE / THEORY
2
Mr. Philip B. Crosby in his book Quality is Free referred to the COQ costs in two broad categories namely ‘Price of Conformance’ and ‘Price of Non-conformance’. These two can be bifurcated further in to prevention & appraisal costs and internal & external failure costs. Hence, COQ is often referred as PAF (Prevention, appraisal & failure) model. In other words, ‘Price of Conformance’ is known as ‘Cost of Good quality’ and ‘Price of Non-conformance’ is often termed as ‘Cost of Poor Quality’.
Prevention Costs
The costs incurred for preventing the poor quality of products and services may be termed as Prevention Cost. These costs are incurred to avoid quality problems. They are planned and incurred before actual operation and are associated with the design, implementation, and maintenance of the quality management system. Prevention costs try to keep failure and appraisal cost to a minimum.
Examples include the costs for:
▪ Quality planning (creation of plans for quality, reliability, operations, production, and inspection)
▪ Quality assurance (creation and maintenance of the quality system)
▪ Supplier evaluation
▪ New product review
▪ Error proofing
▪ Capability evaluations
▪ Quality improvement team meetings
▪ Quality improvement projects
▪ Quality education and training (development, preparation, & maintenance of programs)
▪ Cost incurred due to product specification arising may be from incoming materials or intermediate processes.
Appraisal Costs
The need of control in product and services to ensure high quality level in all stages, conformance to quality standards and performance requirements is Appraisal Costs. These are costs associated with measuring and monitoring activities related to quality. Appraisal Cost incurred to determine the degree of conformance to quality requirements (measuring, evaluating or auditing). They are associated with the supplier’s and customer’s evaluation of purchased materials, processes, products and services to ensure that they are as per the specifications. They could include:
PRIME VISION / CA FINAL / SCM & PE / THEORY
3
▪ Verification (checking of incoming material, process setup, and products against agreed specifications)
▪ Quality audits (confirmation that the quality system is functioning correctly)
▪ Supplier rating (assessment and approval of suppliers of products and services)
▪ Checking and testing purchased goods and services
▪ In-process and final inspection/test
▪ Field testing
▪ Product, process, or service audits
▪ Calibration of measuring and test equipment
Internal Failure Costs
Internal Failure Cost associated with defects found before the customer receives the product or service. Internal failure costs are incurred to remedy defects discovered before the product or service is delivered to the customer. These costs occur when the product is not as per design quality standards and they are detected before they are transferred to the customer. These are costs that are caused by products or services not conforming to requirements or customer/user needs and are found before delivery of products and services to external customers. Deficiencies are caused both by errors in products and inefficiencies in processes. They could include:
▪ Waste- waste occurs when unnecessary work is done or holding of stock as a result of errors, poor organization, or communication
▪ Scrap—defective product or material that cannot be repaired, used or sold
▪ Rework or rectification—when the work needs to be rectified for defective material or errors
▪ Failure analysis—activity required to establish the causes of internal product or service failure
▪ Delays
▪ Re-designing
▪ Shortages
▪ Re-testing
▪ Downgrading
▪ Downtime
▪ Lack of flexibility and adaptability

PRIME VISION / CA FINAL / SCM & PE / THEORY
4
External Failure Costs
External failure costs are incurred to medicate defects discovered by customers. These costs occur when products or services that fail to reach design quality standards are not detected until after transfer to the customer. After the product or service is delivered and then the defects is found then it is an external failure. Further external failure costs are costs that are caused by deficiencies found after delivery of products and services to external customers, which lead to customer dissatisfaction. They could include:
▪ Repairs and servicing (of both, products that have been returned by the customer as well as which are serviced at the customer’s place)
▪ Warranty claims (failed products that are replaced or services that are re-performed under a guarantee)
▪ Complaints (all work and costs associated with handling and servicing customer ’s complaints)
▪ Returns (handling and investigation of rejected or recalled products, including transport costs)
▪ Repairing goods and redoing services
▪ Warranties
▪ Losses due to sales reductions
▪ Environmental costs
The total quality costs are then the sum of all these costs.
▪ In its simplest form, COQ can be calculated in terms of effort (hours/days).
▪ A better approach will be to calculate COQ in terms of money (converting the effort into money and adding any other tangible costs like test environment setup).
▪ The best approach will be to calculate COQ as a percentage of total cost. This allows for comparison of COQ across projects or companies.
To ensure impartiality, an external person say the accountant must determine the Cost of Quality of a project/ product rather than a person who is a core member of the project/ product team (Say, someone from the Accounts Department).

PRIME VISION / CA FINAL / SCM & PE / THEORY
5
2. TOTAL QUALITY MANAGEMENT (TQM)
Total Quality Management is a management approach that originated in the 1950s and has steadily become more popular since the early 1980s. The concept of Total Quality Management was developed jointly by W. Edwards Deming, Joseph M. Juran, and Armand V. Feigenbaum. TQM is a management philosophy that seeks to integrate all organizational functions (marketing, finance, design, engineering, and production, customer service, etc.) to focus on meeting customer needs and organizational objectives.
TQM aims at improving the quality of organizations outputs, including goods and services, through continual improvement of internal practices. As part of the TQM approach, standards can be set based on both internal priorities or any industry standards currently in place. It is indeed a joint effort of management, staff members, workforce, and suppliers to meet and exceed customer satisfaction level. Industry standards can be defined at multiple levels, and may include production of items to an understood norm or adherence to various laws and regulations governing the operation of the particular business. TQM was originally applied in manufacturing areas and used in that for a number of years & is now becoming recognized as a generic management tool and applied in service and public sector organizations.
TQM's objectives are to eradicate waste and increase efficiency. This is done by ensuring that the production of the organization's product/service is apt the first time. CIMA defines ‘Total Quality Management’ as “Integrated and comprehensive system of planning and controlling all business functions so that products or services are produced which meet or exceed customer expectations. TQM is a philosophy of business behaviour, embracing principles such as employee involvement, continuous improvement at all levels and customer focus, as well as being a collection of related techniques aimed at improving quality such as full documentation of activities, clear goal-setting and performance measurement from the customer perspective.”
Thus, Total Quality Management (TQM) is a management strategy aimed at embedding awareness of quality in all organizational processes. TQM requires that the company maintain this quality standard in all aspects of its business. This requires ensuring that things are done right the first time and that defects and waste are eliminated from operations. TQM is a comprehensive management system which:
▪ Focuses on meeting owner’s/ customer’s needs, by providing quality services at a reasonable cost.
▪ Focuses on continuous improvement.
▪ Recognizes role of everyone in the organization.
▪ Views organization as an internal system with a common aim.
▪ Focuses on the way tasks are accomplished.
▪ Emphasizes teamwork.

PRIME VISION / CA FINAL / SCM & PE / THEORY
6
Six C’s of TQM
The Six Cs for successful implementation of a Total Quality Management (TQM) process are as follows:
▪Commitment: If a TQM culture is to be developed, so that quality improvement becomes a normal part of everyone’s job, a clear commitment, from the top must be provided. Without this all else fails. It is not sufficient to delegate ‘quality’ issues to a single person since this will not provide an environment for changing attitudes and breaking down the barriers to quality improvement. Such expectations must be made clear, together with the support and training necessary to their achievement.
▪Culture: Training lies at the centre of effecting a change in culture and attitudes. Management accountants, too often associate ‘creativity’ with ‘creative accounting’ and associated negative perceptions. This must be changed to encourage individual contributions and to make ‘quality’ a normal part of everyone’s job.
▪ Continuous Improvement: Recognition that TQM is a ‘process’ not a ‘programme’ necessitates that we are committed in the long term to the never ending search for ways to do the job better. There will always be room for improvement, however small.
▪ Co-operation: The application of Total Employee Involvement (TEI) principles is paramount. The on-the-job experience of all employees must be fully utilised and their involvement and co-operation sought in the development of improvement strategies and associated performance measures.
▪ Customer Focus: The needs of the customer are the major driving thrust; not just the external customer’s (who are in receipt of the final product or service) but the internal customer’s (i.e employees who receive and supply goods, services or information). Perfect service with zero defects is all that is acceptable at either internal or external levels. Too frequently, in practice, TQM implementations focus entirely on the external customer to the exclusion of internal relationships. They will not survive in the short term unless they foster the mutual respect necessary to preserve morale and employee participation.
▪ Control: Documentation, procedures and awareness of current best practice are essential if TQM implementation is to function appropriately. The need for control mechanisms is frequently overlooked, in practice, in the euphoria of customer service and employee empowerment. Unless procedures are in place improvements cannot be monitored and measured nor deficiencies corrected.
Difficulties will undoubtedly be experienced in the implementation of quality improvement and it is worthwhile expounding procedure that might be adopted to minimise them in detail.

PRIME VISION / CA FINAL / SCM & PE / THEORY
7
Implementation of TQM
Implementation of TQM is a strategic Decision. The first and foremost step in this process involves collecting the data related to the organization’s current reality. TQM implementation should be delayed till the organization is in a state where TQM is likely to succeed. In case there exist an organisational problem such as a very unstable funding base, weak administrative systems, lack of managerial skill, or poor employee morale, TQM would not be appropriate. Management audit helps in identifying the current levels of organizational functioning and areas in need of change.
Criticisms of Total Quality Management
Some authors, notably Carlzon (1987), Albrecht (1985) and Albrecht and Zemke (1988) have criticised the direction that TQM implementations have tended to take in practice, in particular
▪ the focus on documentation of process and ill-measurable outcomes;
▪ the emphasis on quality assurance rather than improvement; and
▪ an internal focus which is at odds with the alleged customer orientation.
Carlzon has revived the customer focus with an emphasis on total employee involvement (TEI) culminating in the empowerment of the ‘front-line’ of customer service troops. The main features of his empowerment thrust has been:
▪ loyalty to the vision of the company through the pursuit of tough, visible goals;
▪ recognition of satisfied customers and motivated employees as the true assets of a company;
▪delegation of decision-making to the point of responsibility by eliminating hierarchical tiers of authority to allow direct and speedy response to customer needs; and
▪decentralisation of management to make best use of the creative energy of the workforce. Albrecht suggest that TQM may not be appropriate for service based industries, because the standards-based approach of ‘industry best practice’ ignores the culture of organisations. He recommends a move towards TQS (total quality service), which is more customer oriented and creates an environment to promote enthusiasm and commitment. Albrecht suggests that poor service is associated with sloppy procedures, errors, inaccuracies and oversights and poor co-ordination, all of which represents improvement opportunities which can be achieved through tighter controls.

PRIME VISION / CA FINAL / SCM & PE / THEORY
8
Conclusion
There is no single theory on TQM, but Deming, Juran and Ishikawa provide the core assumptions, as a “discipline and philosophy of management which institutionalizes planned and continuous improvement and assumes that quality is the outcome of all activities that take place within an organization; that all functions and all employees have to participate in the improvement process; that organizations need both quality systems and a quality culture”.
To successfully implement TQM immense efforts, time, courage, and patience is required. Successful implementation of TQM results in improved quality across all major processes and departments, higher customer retention, higher revenue on account of improved sales, and global brand recognition.
While TQM shares much in common with the Six Sigma improvement process, it is not the same as Six Sigma. TQM focuses on process improvements, while Six Sigma looks to reduce defects.

PRIME VISION / CA FINAL / SCM & PE / THEORY
9
3. SIX SIGMA
Engineer Bill Smith introduced Six Sigma while working at Motorola in 1986. Six Sigma became well known after Jack Welch made it a focus of his business strategy at General Electric in 1995, and today it is widely used in many sectors of industry. It is quality improvement technique whose objective to eliminate defects in any aspect that affects customer satisfaction. The premise of Six Sigma is that by measuring defects in a process, a company can develop ways to eliminate them and practically achieve “zero defects”. Six sigma can be used with balanced scorecard by providing more rigorous measurement system based on statistics. The primary focus of Six Sigma is on:
▪ Customer satisfaction.
▪ Decisions based on data-driven facts.
▪ Management, improvements, and processes.
▪ Proactive management team.
▪ Collaboration with in the business
▪ Goal for perfection.
Numerical Concept of Six Sigma
'Sigma' is a statistical term that measures how far a process deviates from perfection. The higher the sigma number, the closer the process is to perfection.
The values of Defect Percentage
Six Sigma is 3.4 defects per million opportunities or getting things right 99.99966% of the time. It is possible to develop ways of reducing defects by measuring the level of defects in a process and discovering the causes.
The Value of the Defect Percentage under Various Sigma Levels
Sigma Level
Defects per Million Opportunities (DPMO)
Percentage Defective
(%)
Percentage Yield
(%)
Quality/ Profitability
1σ 6,91,462 69 31 Loss
2σ 3,08,538 31 69 Non-Competitive
3σ 66,807 6.7 93.3 Average Industries 4σ 6,210 0.62 99.38 Above Average
5σ 233 0.023 99.977 Below Maximum Productivity
6σ 3.4 0.0034 99.99966 Near Perfection
It may not be possible to achieve 'perfect Six Sigma' but relevant benefits can be achieved from a rise from one Sigma Level to another.

PRIME VISION / CA FINAL / SCM & PE / THEORY
10
Implementation of Six Sigma
There are two methodologies for the implementation of Six Sigma-
DMAIC: This method is very robust. It is used to improve existing business process. To produce dramatic improvement in business process, many entities have used it successfully. It has five phases:
Define the problem, the project goals and customer requirements.
Measure the process to determine current performance.
Analyze the process to determine root causes of variation and poor performance.
Improve the process by addressing and eliminating the root causes.
Control means maintaining the improved process and future process performance
DMAIC is used under the following circumstances:
▪ A product or process exists.
▪ The project is part of ongoing continuous improvement process.
▪ Only a single process needs to be altered.
▪ Competitor’s actions are stable.
▪ There is no change in customer’s behavior.
▪ Technology is stable.
Application of DMAIC in the Banking Sector
In banking sector, DMAIC may be used as follows:
▪ Define: Customer satisfaction & loyalty have significant impact on financial
performance of a bank. Based on customer’s feedback or complaints, six sigma
involves defining objectives and opportunities to improve in discussion with
the staff.
▪ Measure: In this phase, Six Sigma experts deploy quantitative procedures to
collect statistical data. Then the statistical data is used for measuring the
impact of the various processes on customer satisfaction. Different processes may have
different impact on customer satisfaction. The measurement of impact of the individual
processes helps the banks to concentrate on improving the processes that have the
maximum impact on customer satisfaction. In the banking industry, wait times are said
to have the maximum impact on customer satisfaction.

PRIME VISION / CA FINAL / SCM & PE / THEORY
11
▪ Analyse: In this phase, Six Sigma experts analyse the data collected in
accordance with the parameters set for improvement so that, the processes
that directly affects customer’s satisfaction can be improved at minimum cost.
▪ Improve: In this phase, experts take corrective measures to improve
processes in consultation with staff based on facts and statistics. Advanced
statistical tools can also be used to study the impact of the proposed
improvement initiative on business processes.
▪ Control: Control systems should be put in place to monitor the impact of the
improvement initiatives through periodical review performance. If still a
business process is not performing well in accordance with the desired Six
Sigma levels, the process is referred back to the ‘define’ phase. However, if a
small problem is impacting the performance, then corrective measures are taken
and the whole process is not referred back.
DMADV: The application of these methods is aimed at creating a high-quality product keeping in mind customer requirements at every stage of the product. It is an improvement system which is used to develop new processes or products at Six Sigma quality levels. The phases are as given below:
Define the project goals and customer deliverables.
Measure and determine customer needs and specifications.
Analyze the process options to meet the customer needs.
Design the process to meet customer needs.
Verify the design performance and ability to meet customer needs.
DMDAV is used under the following circumstances:
▪ A product or process is not in existence
▪ Existing process has been optimised using either DMAIC or some other process.
▪ Project have strategic importance.
▪ Multiple process need to be altered.
▪ Competitor’s performance is changing.
▪ Customer’s behaviour is changing.
▪ Technology is growing.

PRIME VISION / CA FINAL / SCM & PE / THEORY
12
Similarities between DMADV and DMAIC
▪ Both of these six sigma methodologies are based on defects per million
opportunities (DPMO).
▪ Both DMADV and DMAIC use the same kind of six sigma quality management tools.
▪ Customer’s needs are the basic parameter for both six sigma methodologies.
Both DMADV and DMAIC are fundamental six sigma methodologies for improving quality of product/process. Broadly, DMAIC deals with improving some existing process to make it align with customer’s needs while DMADV deals with new design or redesign.
Difference DMAIC and DMADV
Following table highlights the differences between DMAIC and DMADV.
DMAIC DMADV
Review the existing processes and fixes problem(s)
Emphases on the design of the product and processes.
More reactive process. Proactive process.
Increase the capability. Increase the capacity.
Rupee benefits quantified rather quickly. Rupee benefits more difficult to quantify and tend to be much more long term.
Examples of DMAIC problem-solving methods:
▪ Reduce the cycle time to process a patent.
▪ Reduce the number of errors in sales list.
▪ Improve search time for critical information.
Examples of procedures that the DMADV development method is designed to address:
▪ Add a new service
▪ Create a real-time system.
▪ Create a multiple-source lead tracking system
Limitations of Six Sigma
▪ Six Sigma focuses on quality only.
▪ Six Sigma does not work well with intangible results.
▪ Substantial infrastructure investment is required.
▪ Six Sigma is complicated for some tasks.
▪ Not all products need to meet Six Sigma standards.
▪ Six Sigma focuses on specific type of process only.

PRIME VISION / CA FINAL / SCM & PE / THEORY
13
There are lot to real time barriers which needs to be resolved while translating
the theoretical concepts into practical applications.
Lean Six Sigma
Lean Six Sigma is the combination of Lean and Six Sigma which help to achieve greater results that had not been achieved if Lean or Six Sigma would have been used individually. It increases the speed and effectiveness of any process within any organization. By using lean Six Sigma, organisations will be able to Maximize Profits, Build Better Teams, Minimize Costs, and Satisfy Customers.
Six Sigma in Practice
Wipro
Wipro is the first Indian company to adopt Six Sigma. Today, Wipro has one of the most mature Six Sigma programs in the industry ensuring that 91% of the projects are completed on schedule, much above the industry average of 55%.
Six Sigma at Wipro simply means a measure of quality that strives for near perfection. It is an umbrella initiative covering all business units and divisions so that it could transform itself in a world class organization.
At Wipro, it means: Have products and services meet global benchmarks. Ensure robust processes within the organization. Consistently meet and exceed customer expectations. Make Quality a culture within.
Six Sigma training
Wipro is using Six Sigma at present on over 500 projects in multiple areas including, project management, market development and resource utilisation.

PRIME VISION / CA FINAL / SCM & PE / THEORY
14
4. THEORY OF CONSTRAINTS
During the 1980s Goldratt and Cox advocated a new approach to production management called optimised production technology (OPT). OPT is based on the principle that profits are expanded by increasing the throughput of the plant. The OPT approach determines what prevents throughput being higher by distinguishing between bottleneck and non -bottleneck resources. This approach advocates that bottleneck resources/activities should be fully utilised while non-bottleneck resources/activities should not be utilized to 100% of their capacity since it would result in increase in inventory.
The concept behind the system was first formulated and developed by Goldratt and Core (1986) in USA. Goldratt developed the concept and eventually gave it the name the Theory of Constraints (TOC).
Operational Measures of Theory of Constraints
The theory of constraints focuses on revenue and cost management when faced with bottlenecks. It advocates the use of three key measures. These are
Throughput (T) ▪ Throughput as a TOC measure is the rate of generating money in an organization through Sales.
▪ Throughput = (Sales Revenue–Unit Level Variable Expenses)/ Time
▪ Direct Labour Cost is viewed as a fixed unit level expenses and is not usually included.
Investment (I) ▪ This is money associated with turning materials into Throughput and do not have to be immediately expensed.
▪ Includes assets such as facilities, equipment, fixtures and computers.
Operating Expense (OE)
▪ Money spent in turning Investment into Throughput and therefore, represent all other money that an organisation spends.
▪ Includes direct labour and all operating and maintenance expenses
Based on these three measures, the objectives of management can be expressed as increasing throughput, minimizing investment and decreasing operating expenses.

PRIME VISION / CA FINAL / SCM & PE / THEORY
15
Goldratt’s Five-Step Method for Improving Performance
The theory of constraints describes the process of identifying and taking steps to remove the bottlenecks that restrict output. The theory of constraints considers short-run time horizons and assumes other current operating cost to be fixed costs. The key steps in managing bottleneck resources are as follows:
Op
erat
ion
al M
easu
res
Throughput
Measures
Incoming Money
Increase
Investment
Measures
Money Tied up within the System
Minimum
Operating Expenses
Money Leaving the System
Decrease

PRIME VISION / CA FINAL / SCM & PE / THEORY
16
1. Identifying the System Bottlenecks: This step involves identification of constraints which restrict output from being expanded.
2. Describe How to Exploit the Bottlenecks: Having identified the bottlenecks it becomes the focus of attention since only the bottleneck can restrict or enhance the flow of products. It is therefore essential to ensure that the bottleneck activity is fully utilised. Decision regarding the optimum-mix of products to be produced by the bottleneck activity must be made.
3. Subordinate Everything Else to the Decision in Step-2: This step requires that the optimum production of bottleneck activity should determine the production schedule of the non-bottleneck activities.
Let us consider an organisation dealing with a product which requires multiple parts and processed on different machines. With multiple parts in a product, dependencies arise among operations; some operations cannot be started until parts from previous operations are available. Waiting time appear for two reasons:
- Parts that require processing at a bottleneck machine must wait in line until the bottleneck machine is free, and
- Parts made on non-bottleneck machines must wait until parts coming off the bottleneck machines arrive.
Therefore, the workers of non-bottleneck machines should not be motivated to improve their productivity if the additional output cannot be processed by bottleneck machine. Producing more non-bottleneck output results in increase in WIP inventories and no increase in sales volume. Therefore, the preferred course of action is that bottleneck machine should setup pace for non-bottleneck machine.
4. Elevate the System Bottlenecks or Increase Bottleneck Efficiency and Capacity: This step involves taking action to remove (that is elevate) the constraint. This might involve replacing a bottleneck machine with a faster one or providing additional training for a slow worker or changing of the design of the product to reduce the processing time required by a bottleneck activity.
5. Repeat the Process as a New Constraint Emerges: If the bottleneck activity has been elevated and replaced by a new bottleneck activity it is necessary to return to step 1 and repeat the process.

PRIME VISION / CA FINAL / SCM & PE / THEORY
17
5. RELATIONSHIP MARKETING
Marketing plays a vital role to successfully handle the downstream supply chain management. The Relationship marketing helps the organization to keep existing customer and to attract new customers through helpful staff, quality service / product, appropriate prices and proper customer care etc.
Six Markets Model identifies the six key “market domain” where organizations may consider directing their marketing activities.
a. Internal Markets
Internal Markets are the crucial requirement for the success of relationship marketing. Internal markets include internal departments and staff. Staff have the ability to determine customer oriented corporate culture.
b. Referral Markets
Referral Markets include two main categories: existing customers who recommend their suppliers to others and referral sources such as a consultancy firm that may refer work to a law firm.
c. Influence Markets
Influence Markets represent entities and individuals, which have the ability to influence the marketing environment of a firm may include financial analysts, shareholders, the business press, the government, and consumer groups. A good relationship needs to be developed by the firms with critical sources of influencers relevant to their markets.
d. Recruitment’s Markets
Recruitment Markets are focal point for relationship marketing. Firms have to manage its relationships with recruitment markets such as commercial recruitment agencies, universities and institutes in order to have access to potential employees who possess the required skills for the job position.
e. Supplier’s Markets
Supplier Markets refer to traditional suppliers as well as organizations with which the firm has some form of strategic alliance to gain benefits such as better quality, faster reach-to-market, original and creative products, and lower levels of inventory.
f. Customer’s Markets
Customer Markets represent all existing and prospective customers as well as intermediaries. They can be either consumers or intermediaries. In today’s environment, the way firms provide services affects the market and helps in gaining customers.
The six markets model suggests that a firm must regulate its actions towards developing appropriate relationships with each of the market areas as the management of relationships in each of the six markets is critical for the attainment of customer retention objective.

PRIME VISION / CA FINAL / SCM & PE / THEORY
18
Gordon (1998) states that there are six dimensions that illustrate how relationship marketing differs from the historical definition. These are that:
▪ Relationship marketing seeks to create new value for customers and then share it with these customers.
▪ Relationship marketing recognises the key role that customers have, both, as purchasers and in defining the value they wish to receive.
▪ Relationship marketing businesses are visualised to design and align process.
▪ Relationship marketing represents continuous cooperative effort between buyers and sellers.
▪ Relationship marketing recognises the value of customer’s purchasing lifetime (i.e. Customer Lifetime Value).
▪ Relationship marketing even searches for the chain of relations that can be drawn within the organisation. Customer’s wants and values are created between the organisation and its main stakeholders, including suppliers, distribution channels, intermediaries, and shareholders.
The growing interest in relationship marketing suggests a shift in the nature of marketplace transactions from discrete to relational exchanges, from exchanges between parties with no past history and no future to interactions between parties with a history and plans for future interaction.
Customers Relationship Management
To manage and analyse customer’s interaction and data throughout the life cycle with the main motive of improving business relations, the strategies and technologies used is Customer Relationship Management (CRM). Relation includes relations with customers, assisting in customer retention and driving sales growth. Customers under different channels are compiled through CRM. The staff dealing with customers get a detailed information about customer ’s personal information, purchase history, buying preferences and concerns. Organizations must ensure customers are satisfied with their products and services for higher customer retention. Remember, one satisfied customer brings ten new customers with him where as one dissatisfied customer takes away ten customers along with him. In simpler words, CRM is knowing the needs of the customers and providing them with best possible solution.

PRIME VISION / CA FINAL / SCM & PE / THEORY
19
6. CUSTOMERS ACCOUNT PROFITABILITY (CAP)
Most firms today understand the source of their revenues but unfortunately, do not understand the source of profits. Often, attempts to measure profitability is centered on either product costs alone or on profitability at the business unit or enterprise level. These attempts can be severely misleading. What firms fail to do is measure profit at the most meaningful and controllable level, the customer level. Understanding the underlying components of cost and addressing specific causes of poor profitability associated with specific customers will significantly improve bottom-line performance.
Undertaking a customer account profitability improvement initiative is a five-step process:
Customer Profitability Analysis is best conducted with a technique known as Activity Based Costing or ABC analysis. The net profit coming from each customer which can be calculated by revenue less costs done by this tool. These costs are not only manufacturing and distribution costs but also sales costs, marketing costs, services cost and any other related costs which have to be undertaken to service the customer.
After finalisation of cost customers are divided into different profit tiers . This principle is best observed in the banking industry with credit card as a product. Customers are basically classified into four types
▪ Platinum Customers – Most Profitable
▪ Gold Customers – Profitable
▪ Iron Customers – Low Profit but Desirable
▪ Lead Customers – Unprofitable and Undesirable
Analyse the customer
base and split it into the segments
Calculate the annual
revenues earned fromthe customer
Calculate the annual costs
of serving the segment
Identify and retain quality
customers
Re-engineer/ eliminate the unprofitable segments

PRIME VISION / CA FINAL / SCM & PE / THEORY
20
A credit card company would always give the best service as well financial and other benefits to the top two customers. It will at the same time try to attract iron customers and try to convert these iron customers to platinum or gold customers. Finally, these companies will have systems in place so as to avoid lead customers completely.
It is found that with customer profitability analysis (CPA), the firm can correctly classify customers and also find out which of the customers it needs to hold on to and acquire more of the same type, and which customers it needs to let go of. Several times, firms find out that there are customers which they should have left altogether as the profitability from these customers is minimum and expenses are more.
Cost calculation is one of the major problem in CPA. Calculating cost per customer becomes difficult especially in a service environment where manpower as well as time also has a cost factor associated with it. Time spent with each customer is different and therefore the cost is different. Furthermore, there are several non-customer related costs too. If these costs are ignored, then right figures would be difficult to check. The customers will be shown more profitable than they are.
Customers Lifetime Value (CLV)
Customer Life time value is the present value of net profit that we derive from a customer over the entire lifetime of relationship with that particular customer. It is the net present value of the projected future cash flows from a lifetime of customer relationship. It is an essential tool used in marketing to focus on more profitable customers and stop servicing non -profitable customers.
First of all, we need to ascertain the profits generated from each customer. ABC model helps in associating direct costs and revenues to a particular customer over a period of time to ascertain the profit margins from that particular customer. To ascertain the lifetime value, judgements with regards to the duration of relationships have to be made. These require detailed analysis of the strength of relationships, the likelihood, frequency and amount of repeated or additional purchases, competitive products, customer loyalty etc. Thus, profit margins are then discounted at the firm’s cost of capital or any other rate that may be determined by the organisation to arrive at the CLV.

PRIME VISION / CA FINAL / SCM & PE / THEORY
21
7. GAIN SHARING ARRANGEMENTS
Gain sharing is an approach to the review and adjustment of an existing contract, or series of contracts, where the adjustment provides benefits to both parties. A fundamental form of gain-sharing is where a supplier agrees to perform its side of the contract with no guarantee of receiving a payment. Instead, any payment received is based upon the benefits that emerge to the customer as a result of the successful completion of the supplier’s side of the bargain. This is clearly a risky stance for the supplier, because it could spend a fortune and walk away with nothing. Alternatively, if the benefits to the customer are substantial, the supplier could find itself rewarded with a large return. In this situation, the supplier could almost be described as taking an equity stake in the customer rather than entering into a contract with it. There must be no rewards for the suppliers to achieve a higher return through adversarial behaviour or by hiding behind the contract. Gain-sharing deals are, on the face of it, a win-win situation for suppliers and their customers.
Example Cost Savings initiatives and Gain Sharing arrangements at Chiang International -
▪ Supplier will deliver 3% minimum cost savings on controllable portion of costs.
▪ Cost savings generated in first year as a result of Supplier idea will be retained by Supplier.
▪ Cost savings generated in year second will be shared between Chiang International and Supplier at a ratio of 40%:60%.
▪ Cost savings generated in year three will be passed along to Chiang International.
▪ Any cost savings generated by an idea proposed exclusively by Chiang International that does not require capital investment by Supplier will be immediately passed along to Chiang International.

PRIME VISION / CA FINAL / SCM & PE / THEORY
22
8. OUTSOURCING
Outsourcing (also sometimes referred to as "contracting out") is a business practice used by companies to reduce costs or improve efficiency by shifting tasks, operations, jobs or processes to another party for a span of time.
The contract given to third party can be done at the premises or outside. Outsourcing is a cost- saving measure, and practising this, can have a significant impact on manufacturing.
Outsourcing is not limited to manufacturing. Giving services to customer such as those in a call center, and computer programming jobs are also outsourced by companies seeking ways to reduce costs.
A part of product may even be purchased from outside this would be within the purview of outsourcing, such as components for computer equipment. The component can be purchased for a lower cost than it would be for the company to manufacture that component themselves, and the component may be of higher quality. Outsourcing is often an integral part of downsizing or reengineering.
Advantages of Outsourcing
▪ Outsourcing helps in cost savings. The lower cost of operation and labour, and Reduction in overhead costs makes it attractive to outsource.
▪ It frees an organization from investments in technology, infrastructure and people that make up the bulk of a back-end process capital expenditure.
▪ It gives businesses flexibility in staffing, manpower management, helps in cost savings.
Disadvantages of Outsourcing
▪ One of the biggest disadvantages is the risk of losing sensitive data and the loss of confidentiality.
▪ Control of operations and deliverables of activities outsourced.
▪ Inexperienced worker or improper process can lead to quality problems.

PRIME VISION / CA FINAL / SCM & PE / THEORY
23
9. BACK-FLUSHING IN A JIT SYSTEM
Back-flushing requires no data entry of any kind until a finished product is completed. At that time the total amount finished is entered into the computer system, which multiplies it by all the components listed in the bill of materials for each item produced. This yields a lengthy list of components that should have been used in the production process and which are subtracted from the beginning inventory balance to arrive at the amount of inventory that should now be left on hand. Given the large transaction volumes associated with JIT, this is an ideal solution to the problem.
However, there are some serious problems with back-flushing that must be corrected before it will work properly. They are:
▪ Production reporting: The total production figure entered into the system
must be absolutely correct, or else the wrong component types and quantities
will be subtracted from stock. This is a particular problem when there is high
turnover or a low level of training to the production staff that records this
information, which leads to errors.
▪ Scrap reporting: All abnormal scrap must be diligently tracked and
recorded; otherwise these materials will fall outside the black-flushing system
and will not be charged to inventory. Since scrap can occur anywhere in a
production process, a lack of attention by any of the production staff can result
in an inaccurate inventory. Once again, high production turnover or a low level
of employee training increases this problem.
▪ Lot tracing: Lot tracing is impossible under the back-flushing system. It is
required when a manufacturer need to keep records of which production lots were
used to create a product in case all the items in a lot must be recalled. Only a
picking system can adequately record this information. Some computer system
allows picking and back-flushing system to coexist, so that pick transactions for lot
tracing purpose can still be entered in the computer. Lot tracing may then still be
possible if the right software is available; however, this feature is generally
present only on high-end systems.
▪ Inventory accuracy: The inventory balance may be too high at all times because
the back-flushing transaction that relieves inventory usually does so only once a
day, during which time other inventory is sent to the production process; this
makes it difficult to maintain an accurate set of inventory records in the
warehouse.

PRIME VISION / CA FINAL / SCM & PE / THEORY
24
Of all the issues noted here, the worst is a situation where the production staff is clearly incapable of providing sufficiently accurate scrap or production reporting for the back -flushing system. If there is an easily traceable cause, such as less capable workers on a particular shift, moving a few reliable employees into these positions can provide immediate relief from the problem. It may even be possible to have an experienced shift supervisor to collect this information. However, where this is not possible for whatever reason, computer system users experience back-flushing garbage in, garbage out (GIGO)—entering inaccurate information rapidly eliminates any degree of accuracy in the inventory records, requiring many physical inventory counts to correct the problem. Consequently, the success of a back-flushing system is directly related to a company’s willingness to invest in a well-paid, experienced well-educated production staff that undergoes little turnover.

PRIME VISION / CA FINAL / SCM & PE / THEORY
25
10. 5S
5S is the name of a workplace organization method that uses a list of five Japanese words: seiri, seiton, seiso, seiketsu, and shitsuke. It explains how a work space should be organized for efficiency and effectiveness by identifying and storing the items used, maintaining the area and items, and sustaining the new order.
There are 5S phases: They can be translated from the Japanese as “sort”, “set in order”, “shine”, “standardize”, and “sustain”
Sort (Seiri)
▪ Make work easier by eliminating obstacles and evaluate necessary items with regard to cost or other factors.
▪ Reduce chances of being disturbed with unnecessary items.
▪ Prevent accumulation of unnecessary items.
Set In Order (Seiton)
▪ Arrange all necessary items into their most efficient and accessible
arrangements so that they can be easily selected for use and make workflow
smooth and easy.
▪ Ensure first-in-first-out FIFO basis, so that it is easy to find and pick up
necessary items.
▪ Place components according to their uses, with the frequently used components
being neared to the work.
Shine (Seiso)
▪ Clean your workplace on daily basis completely or set cleaning frequency.
▪ Keep workplace safe, easy to work, clean and pleasing to work in.
▪ In an unfamiliar environment, people must be able to detect any problems
within 50 feet.
Standardize (Seiketsu)
▪ Standardize the best practices in the work area.
▪ Maintain high standards, orderliness, everything in order and according to its standard.
▪ Every process has a standard.
Sustain (Shitsuke)
▪ Not harmful to anyone, training and discipline, to maintain proper order.
▪ Also translates as “do without being told”.
▪ Training is goal-oriented process. Its resulting feedback is necessary monthly.

PRIME VISION / CA FINAL / SCM & PE / THEORY
26
5S in Lean Product & Process Development
Information is the output of engineering and design in a lean enterprise, the theory behind using 5S here is “Dirty, cluttered, or damaged surfaces attract the eye, which spends a fraction of a second trying to pull useful information from them every time we glance past. Old equipment hides the new equipment from the eye and forces people to ask which to use.”
5S methodology is being applied to a wide variety of industries including Manufacturing, Health care, Education & Government.

PRIME VISION / CA FINAL / SCM & PE / THEORY
27
11. TOTAL PRODUCTIVE MAINTENANCE (TPM)
Total Productive Maintenance (TPM) is a system of maintaining and improving the integrity of production and quality systems. This is done through the machines, equipment, processes, and employees that add to the value in Business Organisation. This concept was first introduced by M/s Nippon Denso Co. Ltd. of Japan, a supplier of M/s Toyota Motor Company.
TPM helps in keeping all equipment in top working condition so as to avoid breakdowns and delays in manufacturing processes.
How TPM can be introduced in the organization? The introduction of TPM follows four main phases:
▪ Preparation Stage: Establish a suitable environment and conducting
programme awareness.
▪ Introduction Stage: Initialization of TPM, information to suppliers,
customers, and other stakeholders.
▪ Implementation Stage: This is done with the help of eight activities referred
as eight pillars of TPM.
▪ Institutionalizing stage: This is the stage of getting TPM awards.
TPM Strategy focuses on eight pillars of success with 5S strategy as foundation.
Foundation & Pillars
About Techniques
Foundation: 5S TPM starts with 5S. It deals with organizing a workplace which helps to recognize the uncovered problems.
Seiri (sort), Seiton (set in order) Seiso, (shine), Seiketsu (standardize), Shitsuke, (sustain).
P-1: Autonomous Maintenance
Operation of equipment without breakdown and eliminating the defects at source through active employee participation.
Cleaning, Lubricating, Visual Inspection, Tightening of Loosened Bolts etc.

PRIME VISION / CA FINAL / SCM & PE / THEORY
28
P-2: Focussed Improvement (Kaizen)
This pillar is about the minor improvements made on continuous basis. This pillar aims to reduce losses in the workplace that affect efficiencies.
Kaizen Register, Kaizen Summary Sheet, Why-Why Analysis, Summary of Losses.
P-3: Planned Maintenance
This is proper maintenance system adopted for improvement in reliability and maintainability of equipment. It aims to have zero breakdown and optimum maintenance cost.
Preventive Maintenance,
Breakdown Maintenance, Corrective Maintenance, and Maintenance Prevention.
P-4: Early Management
This focuses on shortening the time required for product and equipment development.
Engineering and Re-engineering Processes.
P-5: Quality Maintenance
This is towards achieving customer satisfaction through delivery of highest quality product.
Root Cause Analysis, Customer Data Analysis.
P-6: Education & Training
It aims to improve knowledge/ skills and enhance morale of employees.
Training Calendar, Policies for Education and Training, On-site Training etc.

PRIME VISION / CA FINAL / SCM & PE / THEORY
29
P-7: Office TPM
This refers to application of TPM techniques in administration to improve productivity and efficiency in the functions with elimination of losses.
Analyzing processes and procedure towards increased Office Automation.
P-8: Safety, Health, and Environment
Above all the safety of worker is utmost importance. It aims to have zero accidents and zero health damages.
Drama, Safety Slogans, Quizzes, Posters Making to create awareness related to safety.
Performance Measurement in TPM
The most important approach to the measurement of TPM performance is known as Overall Equipment Effectiveness (OEE) measure. The calculation of OEE measure requires the identification of “six big losses”
1. Equipment Failure/ Breakdown
2. Set-up/ Adjustments
3. Idling and Minor Stoppages
4. Reduced Speed
5. Reduced Yield and
6. Quality Defects and Rework
The first two losses refer to time losses and are used to calculate the availability of equipment. The third and fourth losses are speed losses that determine performance efficiency of equipment. The last two losses are regarded as quality losses.
Performance × Availability × Quality = OEE %
OEE may be applied to any individual assets or to a process. It is unlikely that any manufacturing process can run at 100% OEE. According to Dal et al (2000), Nakajima (1998) suggested that ideal values for the OEE component measures are:
Availability > 90%
Performance > 95%
Quality > 99%
Accordingly, OEE at World Class Performance would be approximately 85%. Kotze (1993) contradicted, that an OEE figure greater than 50% is more realistic and therefore more useful as an acceptable target.

PRIME VISION / CA FINAL / SCM & PE / THEORY
30
12. TARGET COSTING
Target costing has been described as a process that occurs in a competitive environment, in which cost minimization is an important component of profitability. This newer approach of product costing may take into account initial design and engineering costs, as well as manufacturing costs, plus the costs of distribution, sales and services.
It can be defined as “a structured approach to determining the cost at which a proposed product with specified functionality and quality must be produced, to generate a desired level of profitability at its anticipated selling price” .
A critical aspect of this definition is that it emphasizes that target costing is much more than a management accounting technique. Rather, it is an important part of a comprehensive management process aimed at helping an organization to survive in an increasingly competitive environment. In this sense the term “target costing” is a misnomer: it is not a product costing system, but rather a management technique aimed at reducing a product ’s life-cycle costs.
Target Cost Concept
Target costing is almost the exact opposite of cost plus margin modeling where a company produces a product with no cost structure in mind. Once the product is built they add a profit margin on top to arrive at the final price.
In Target costing, we first determine what price we think the consumer will pay for our product. We then determine how much of a profit margin we expect and subtract that from the final price. The remaining amount left is what is available as a budget to be used to create the product.
Advantages of Target Costing
▪ Proactive approach to cost management.
▪ It reinforces top-to-bottom commitment to process and product innovation, and is aimed at identifying issues to be resolved, in order to achieve some competitive advantage.
▪ Target costing starts with customer’s study or market study. It helps to create a company’s competitive future with market-driven management for designing and manufacturing products that meet the price required for market success.
▪ It uses management control systems to support and reinforce manufacturing strategies; and to identify market opportunities that can be converted into real savings to achieve the best value rather than simply the lowest cost.
▪ Target costing ensures proper planning well ahead of actual production and marketing.
▪ Implementation of Target Costing enhances employee awareness & empowerment.

PRIME VISION / CA FINAL / SCM & PE / THEORY
31
▪ Foster partnership with suppliers.
▪ Minimize non-value-added activities.
▪ Encourages selection of lowest cost value added activities.
▪ Reduced time to market.
▪ Target Costing takes a market – driven approach towards cost, in which value is defined not only by what customers demand but also by what they are willing to pay for. This strategy introduces a discipline in which planning focus shifts to those costs that create value and meet the needs of the customer. By involving and educating customers, target costing provides a process that allows teams to make intelligent trade-offs between features, functionality and cost, resulting in designs that are better suited to customer’s quality and price expectations.
Main features of Target Costing System
The main features of Target Costing System can be understood by going through the following points:
▪ Target costing is viewed as an integral part of the design and introduction of new products. As such, it is part of an overall profit management process, rather than simply a tool for cost reduction and cost management. The first part of the process is driven by customer, market and profitability considerations. Given that profitability is critical for survival, a target profit margin is established for all new product offerings. The target profit margin is derived from the company’s long-term business plan, which incorporates its long-term strategic intent and profit margins. Each product or product line is required to earn at least the target profit margin.
▪ For any given product, a target selling price is determined using various sales forecasting techniques. Critical to setting the target selling price are the design specifications (reflecting certain levels of functionality and quality) of the new product. These specifications are based on customer requirements and expectations and are often influenced by the offerings of competitors. Importantly, while setting the target selling price, competitive conditions and customer’s demand for increased functionality and higher quality, without significant increases in price, are clearly recognised, as charging a price premium may not be sustainable.
Hence, the target selling price is market-driven and should encompass a realistic reflection of the competitive environment.

PRIME VISION / CA FINAL / SCM & PE / THEORY
32
▪ Integral to setting the target selling price is the establishment of target production volumes, given the relationship between price and volume. The expected targets volumes are also critical to computing unit costs, especially with respect to capacity-related costs (such as tooling costs), as product costs are dependent upon the production levels over the life cycle of the product. Once the target selling price and required profit margin have been determined, the difference between these two figures indicates the allowable cost for the product. Ideally, the allowable cost becomes the target cost for the product. However, in many cases the target cost agreed upon will exceed the allowable cost, given the realities associated with existing capacities and capabilities.
▪ Establishing Cost Reduction Targets. The next stage of the target costing process is to determine cost reduction targets. Some firms will do this by estimating the “current cost” of the new product. The current cost is based on existing technologies and components, but encompasses the functionalities and quality requirements of the new product. The difference between the current cost and the target cost indicates the required cost reduction that is needed. This amount may be divided into a target cost-reduction objective and a strategic cost- reduction challenge. The former is viewed as being achievable (yet still a very challenging target), while the latter acknowledges current inherent limitations. After analyzing the cost reduction objective, a product-level target cost is set which is the difference between the current cost and the target cost-reduction objective.
▪ It should be noted that a fair degree of judgement is needed where the allowable cost and the target cost differ. As the ideal is to produce at the allowable cost, it is important that the difference is not too great. Once the product-level target cost is set, however, it generally cannot be changed, and the challenge for those involved is to meet this target.
▪ Having achieved consensus about the product-level target cost, a series of intense activities commence to translate the cost challenge into reality. These activities continue throughout the design stage up until the point when the new product goes into production.
Components of Target Costing System
Typically, the total target is broken down into its various components, each component is studied and opportunities for cost reductions are identified. These activities are often referred to as Value Analysis (VA) and Value Engineering (VE).
Value Analysis is a planned, scientific approach to cost reduction which reviews the material composition of a product and production design so that modifications and improvements can be made which do not reduce the value of the product to the customer or to the user. Value Engineering is the application of value analysis to new products. Value engineering relates closely to target costing as it is cost avoidance or cost reduction before production. Value analysis is cost avoidance or cost reduction of a product already in production; both adopt the same approach i.e. a complete audit of the product.

PRIME VISION / CA FINAL / SCM & PE / THEORY
33
Here are some of the issues that are dealt with during a Value Analysis/ Value Engineering review:
Can we eliminate functions from the production process?
Can we eliminate some durability or reliability?
Can we minimize the design?
Can we design the product better for the manufacturing
process? Value Analysis/ Engineering
Can we substitute parts?
Can we combine steps?
Can we take supplier’s assistance?
Is there a better way?

PRIME VISION / CA FINAL / SCM & PE / THEORY
34
13. KAIZEN COSTING
Lean manufacturing is founded on the idea of kaizen, or continual improvement. Continuous improvement is the continual examination and improvement of existing processes and is very different from approaches such as business process re-engineering (BPR), which seeks to make radical one-off changes to improve an organization's operations and processes. This philosophy implies that small, incremental changes routinely applied and sustained over a long period result in significant improvements. The kaizen strategy aims to involve workers from multiple functions and levels in the organization in working together to address a problem or improve a particular process.
Some of the activities in the kaizen costing methodology include the elimination of waste in the production, assembly, and distribution processes, as well as the elimination of work steps in any of these areas. Though these points are also covered in the value engineering phase of target costing, the initial value engineering may not uncover all possible cost savings. Thus, kaizen costing is really designed to repeat many of the value engineering steps for as long as a product is produced, constantly refining the process and thereby stripping out extra costs. The cost reductions resulting from kaizen costing are much smaller than those achieved with value engineering but are still worth the effort since competitive pressures are likely to force down the price of a product over time, and any possible cost savings allow a company to still attain its targeted profit margins while continuing to reduce cost.
Kaizen Costing Principles
▪ The system seeks gradual improvements in the existing situation, at an acceptable cost.
▪ It encourages collective decision making and application of knowledge.
▪ There are no limits to the level of improvements that can be implemented.
▪ Kaizen involves setting standards and then continually improving these
standards to achieve long-term sustainable improvements.
▪ The focus is on eliminating waste, improving systems, and improving productivity.
▪ Involves all employees and all areas of the business.

PRIME VISION / CA FINAL / SCM & PE / THEORY
35
14. LIFE CYCLE COSTING
Life Cycle Costing involves identifying the costs and revenue over a product’s life i.e. from inception to decline. Life cycle costing aims to maximize the profit generated from a product over its total life cycle. Understanding this can be a useful analysis tool and can help to suggest which strategies the organisation needs to adopt in order to compete successfully.
Product Life Cycle
Each product has a life cycle. The life cycle of a product varies from a few months to several years. Product life cycle is thus a pattern of expenditure, sales level, revenue and profit over the period from new idea generation to the deletion of product from product range.
The life cycle of a product consists of four phases/ stages viz., Introduction; Growth; Maturity and Decline.

PRIME VISION / CA FINAL / SCM & PE / THEORY
36
Stage I: Introduction Stage
Stage one is where the new product is launched in the market. As the product is novel, there is minimal awareness and acceptance of it. Competition is almost negligible and profits are non- existent. The length of the introduction stage differs from product to product depending on various factors.
Strategies
▪ Attracting customers by raising awareness of the product through promotion activities.
▪ Inducing customers to try and buy the product.
▪ Strengthening or expanding channel and supply chain relationships.
▪ Building on the availability and visibility of the product that boost channel intermediaries to support the product.
▪ Setting price in alignment with the competitive realities of the market.
Decision about the product branding,
packaging and labelling
High distribution and promotional expenses
Profits are low or
negative due to low initial volume
Pricing may be low-penetration or high-
skimming pricing
Huge efforts to attract various marketing
channels
Aggressive promotional efforts to
increase awareness
Product refinements
are not possible
Few competitors produce basic version
of products
Focus on those buyers who are the most
ready to buy

PRIME VISION / CA FINAL / SCM & PE / THEORY
37
Stage II: Growth Stage
The next stage in the product life cycle is growth stage. Sales begin to expand rapidly because of greater customer awareness. Competitors enter the market often in large numbers. As a result of competition, profit starts declining near the end of the growth stage.
Strategies
▪ Establish a clear brand identity through promotional campaigns.
▪ Maintain control over product quality to assure customer satisfaction.
▪ Maximize availability of the product through strong distribution channel.
▪ Find the ideal balance between price and demand as per price elasticity.
▪ Overall strategy shifts from acquisition to retention of customers, from motivating product trial to generating repeat purchases and building brand loyalty.
▪ Development of long-term relationships with customers and partners for the maturity stage.
▪ Value-based pricing strategies may be considered.
▪ Leverage the product’s perceived differential advantages to secure a strong market position.
High volume of business and increase in competition
Sales increase at an increased rate in early growth
stage
New channels to handle additional volumes and new
markets
Shift of emphasis from product awareness to
product conviction
Overall strategy for trade-off between high profits and
high market share
Improving and/or adding
features or strategic lowering of prices to attract
more buyers
Same promotional
spending or slightly higher
Educating market is main goal
The length of the growth stage varies according to the nature of the product and competitive reactions
PRIME VISION / CA FINAL / SCM & PE / THEORY
38
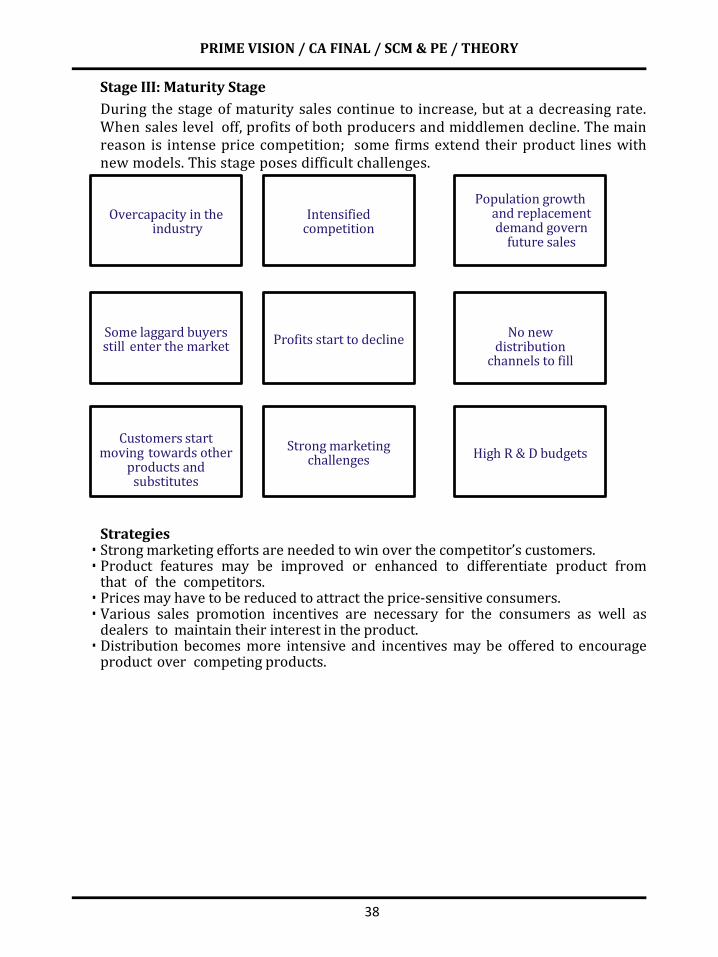
Stage III: Maturity Stage
During the stage of maturity sales continue to increase, but at a decreasing rate. When sales level off, profits of both producers and middlemen decline. The main reason is intense price competition; some firms extend their product lines with new models. This stage poses difficult challenges.
Strategies ▪ Strong marketing efforts are needed to win over the competitor’s customers. ▪ Product features may be improved or enhanced to differentiate product from
that of the competitors. ▪ Prices may have to be reduced to attract the price-sensitive consumers. ▪ Various sales promotion incentives are necessary for the consumers as well as
dealers to maintain their interest in the product. ▪ Distribution becomes more intensive and incentives may be offered to encourage
product over competing products.
Overcapacity in the industry
Intensified competition
Population growth
and replacement demand govern
future sales
Some laggard buyers still enter the market
Profits start to decline
No new distribution
channels to fill
Customers start moving towards other
products and substitutes
Strong marketing challenges
High R & D budgets

PRIME VISION / CA FINAL / SCM & PE / THEORY
39
Stage IV: Decline Stage
Decline in sales volume characterizes this last stage of the product life cycle. The need or demand for product disappears. Availability of better and less costly substitutes in the market accounts for the arrival of this stage.
Strategies
▪ The product can be maintained in the market by differentiation, keeping low cost for some more time by adding certain new features and finding new uses.
▪ The firm can continue to offer the product to its loyal customers (niche segment) at a reduced price.
▪ Firm can even discontinue the product.
▪ Use the product as replacement product for launching another new product successfully in the market.
▪ The various marketing decisions in the decline stage will depend on the fact that, whether it is being revived, or given a new lease of life, or left unchanged if it is being liquidated.
▪ The price may be maintained or reduced drastically if liquidated.
Sales of most product forms drop to zero or may remain at a low
level
Sales decline for a
number of reasons, including technological advances, consumer's
shift in taste, etc.
Profits start declining and at times become
negative
No of organisations
producing the products drops

PRIME VISION / CA FINAL / SCM & PE / THEORY
40
Life Cycle Characteristics
Introduction Growth Maturity Decline
Objectives Create product awareness & trial
Maximise market share
Maximise profits while defending market share
Reduce expenditures & milk the brand
Sales Low sales Rapidly rising Peak sales Declining sales
Costs per Customer
High cost per customer
Average cost per customer
Low cost per customer
Low cost per customer
Profits Negative Rising profits High profits Declining profits
Customers Innovators Early adopters Middle majority Laggards
Competitors Few Growing number
Steady number beginning to decline
Declining number
Strategies
Introduction Growth Maturity Decline
Product Offer basic product
Offer product extensions, service & warranty
Diversify brands and models
Phase out weak items
Price Cost plus profit Price to penetrate market
Price to match or beat competitors
Price cutting
Advertising Build product awareness amongst early adopters & dealers
Build awareness
& interest in mass market
Stress on brand differences and benefits
Reduce level to keep hard core loyalty
Distribution Build selective distribution
Build Intensive distribution
Build more intensive distribution
Go selective: Phase out unprofitable outlets

PRIME VISION / CA FINAL / SCM & PE / THEORY
41
Sales Promotion
Use heavy sales promotion to entice trial
Reduce to take advantage of heavy consumer demand
Increase to encourage brand switching
Reduce to minimal level
Characteristics of Product Life Cycle
The major characteristics of product life-cycle concept are as follows:
▪ The products have finite lives and pass through the cycle of development, introduction, growth, maturity, decline and deletion at varying speeds.
▪ Product cost, revenue and profit patterns tend to follow predictable courses through the product life cycle. Profits first appear during the growth stage and after stabilising during the maturity stage, decline thereafter to the point of deletion.
▪ Profit per unit varies as products move through their life cycles.
▪ Each stage of the product life-cycle poses different threats and opportunities that give rise to different strategic actions.
▪ Products require different functional emphasis in each stage-such as an R&D emphasis in the development stage and a cost control emphasis in the decline stage.
▪ Finding new uses or new users or getting the present users to increase their consumption may extend the life of the product.
Benefits of Product Life Cycle Costing
The benefits of product life cycle costing are summarized as follows:
▪ The product life cycle costing results in earlier actions to generate revenue or to lower costs than otherwise might be considered. There are a number of factors that need to the managed in order to maximise return on a product.
▪ Better decisions should follow from a more accurate and realistic assessment of revenues and costs, at least within a particular life cycle stage.
▪ Product life cycle thinking can promote long-term rewarding in contrast to short-term profitability rewarding.
▪ It provides an overall framework for considering total incremental costs over the entire life span of a product, which in turn facilitates analysis of parts of the whole where cost effectiveness might be improved.
▪ It is an approach used to provide a long-term picture of product line profitability, feedback on the effectiveness of life cycle planning and cost data to clarify the economic impact of alternatives chosen in the design, engineering phase etc.

PRIME VISION / CA FINAL / SCM & PE / THEORY
42
▪ It is also considered as a way to enhance the control of manufacturing costs. The thrust of product life cycle costing is on the distribution of costs among categories changes over the life of the product, as does the potential profitability of a product. Hence it is important to track and measure costs during each stage of a product’s life cycle.
▪ Product life cycle costing traces research and design and development costs etc., incurred to individual products over their entire life cycles, so that the total magnitude of these costs for each individual product can be reported and compared with product revenues generated in later periods.
Uses of Product Life Cycle (PLC)
Product Life Cycle
▪ As a Planning tool, it characterizes the marketing challenges in each stage and poses major alternative strategies, i.e. application of kaizen.
▪ As a Control tool, the PLC concept allows the company to measure product performance against similar products launched in the past.
▪ As a Forecasting tool, it is less useful because sales histories exhibit diverse patterns and the stages vary in duration.

PRIME VISION / CA FINAL / SCM & PE / THEORY
43
15. PRICING METHODS
Costs, Demand, and Competition define different pricing methods that a firm may adopt. Let us understand these methods:
Cost-Based Pricing Method
In many businesses, the common method of price determining is to estimate the cost of product & fix a margin of profit. The term ‘cost’ here means Full Cost at current output and wages level since these are regarded as most relevant in price determination. If a firm wants to survive and stay in business, it has to maintain its fixed capital intact so that its fixed assets may be replaced at the end of their useful working life out of the funds generated from profits retained in the business. In a period of relatively stable price levels, depreciation based on historical cost of fixed assets would perhaps be adequate for achieving this object. In periods when the price level is continuously changing, the firm may not be left with adequate funds generated out of accumulated depreciation at the end of the life of the plant to replace the plant at a higher price. Hence depreciation should be properly included as a part of cost so as to leave sufficient profits for asset replacement.
Pricing based on total costs is subjected to two limitations. They are:
The allocation of inter-departmental overheads is based on an arbitrary basis; and
The allocation of overheads will require estimation of normal output which often cannot be done precisely.
In order to avoid these complications, Variable Costs which are considered as relevant costs are used for pricing, by adding a markup (to include fixed costs allocation also).
Sometimes, instead of arbitrarily adding a percentage on cost for profit, the firm determines an average mark-up on cost necessary to produce a desired
Pricing Methods
Competition -Based
Cost-Based Value- Based
Going Rate Pricing
Sealed Bid- Pricing
True Economic
Value
Perceived Value

PRIME VISION / CA FINAL / SCM & PE / THEORY
44
Rate of Return on Investment. The rate of return to be earned by the firm or industry must depend on the risk involved.
PRICING IN PERIODS OF RECESSION
In periods of recession, a firm may sell its articles at a price less than the total cost but above the marginal cost for a limited period.
The advantages of this practice are:
The firm can continue to produce and use the services of skilled employees who are well trained and will be difficult to re-employ later if discharged.
Plant and machinery can be prevented from deterioration through idleness.
The business would be ready to take advantage of improved business conditions later.
This avoids the competition of securing the business of the firm.
One thing to remember here is that a situation like this should not lead to a drastic price cutting and the orders accepted should not cover a long period extending over the production facilities of a period when business conditions improve.
PRICING BELOW MARGINAL COST
Firm may also be justifiable to sell the product at a price below marginal cost for a limited period provided the following conditions prevail:
Where materials are of perishable nature.
Where stocks have been accumulated in large quantities and the market prices have fallen. This will save the carrying cost of stocks.
To popularize a new product.
Where such reduction enables the firm to boost the sales of other products having larger profit margin.
STRATEGIC PRICING OF NEW PRODUCTS
The pricing of new product poses a bigger problem because of the uncertainty involved in the estimation of their demand. In order to overcome this difficulty experimental sales are conducted in different markets using different prices to see which price is suitable. A company may, for example, choose three different markets and by using the same amount of sales promotional activities, ascertain what the right price is. In such circumstances, it may even prove that the highest price yielding the largest unit contributory margin need not necessarily maximise the profits. A lower price may well go to maximise the profits. But at the same time if a product is priced very low to attract more demand, it may be difficult in the future to raise the price as it may not be acceptable to the consumers. So, pricing of a new product is very critical issue which should be decided after a thorough market study and consumer behavior analysis.
A new product is analysed into three categories for the purpose of pricing:

PRIME VISION / CA FINAL / SCM & PE / THEORY
45
Revolutionary Product: A product is said to be revolutionary when it is new for the market and has the potential to create its own value. This type of product has revolutionary impact on the market and consumer behaviour. It replaces the existing method or technology and the approach to doing a work is quite different and unique. These products enjoy the benefit of product differentials and have the potential of being market leader.
Revolutionary product may enjoy the premium price as a reward for its innovation and taking first initiative.
Evolutionary Product: A product introduces upgraded version with few additional characteristics of the product is known as evolutionary product.
The evolutionary products may be priced taking cost-benefit, competitor, and demand for the product into account.
Me-too Product: A product is said to be me-too product when its emergence is a result of the success of a revolutionary product. These types of products are very similar (in ordinary language imitation) to revolutionary and/ or evolutionary products of other firms. The firm while producing me-too products, generally follows the similar production process and technology that is used by the other firms. These are known as market followers.
The me-too products are price takers as the price is determined by the market mainly by the competitive forces.

PRIME VISION / CA FINAL / SCM & PE / THEORY
46
Independent Situations
Sl. Situation RP/EP/MP Pricing
I II III IV
(i) Adjustable work table like a stool, has been successfully capturing the market. Company X makes a small variant of this product and is trying to enter the market.
Me-too Product (MP)
Market Price that is determined by competitive forces for the successful product.
(ii) R & D has just been completed on an innovative computer processor in the shape of a pen, with accompanying pen- like devices to act as keyboard projector and monitor projector. This is expected to get the laptops out of business due to extreme ease of portability of just 3 pen- like light weight devices.
Revolutionary Product (RP)
Premium Pricing, it can expect to make a tidy profit as a reward for innovation and taking its first initiative.
(iii) A successful mobile manufacturing company has built into its latest mobile phone, an additional sliding screen and improved its processor capabilities so that the phone is almost a laptop.
Evolutionary Product (EP)
Demand Based Pricing, Price higher than the earlier version to justify its Costs and Benefits subject to what amount can be stepped up in the market.
While preparing to enter the market with a new product, management must decide whether to adopt a skimming or penetration pricing strategy.

PRIME VISION / CA FINAL / SCM & PE / THEORY
47
Skimming Pricing
It is a policy of high prices during the early period of a product’s existence. This can be synchronised with high promotional expenditure and in the later years the prices can be gradually reduced. The reasons for following such a policy are
(i) The demand is likely to be inelastic in the earlier stages till the product is established in the market.
(ii) The change of high price in the initial periods serves to skim the cream of the market that is relatively insensitive to price. The gradual reduction in price in the later year will tend to increase the sales.
(iii) This method is preferred in the beginning because in the initial periods when the demand for the product is not known the price covers the initial cost of production.
(iv) High initial capital outlays, needed for manufacture, results in high cost of production. Added to this, the manufacturer has to incur huge promotional activities resulting in increased costs. High initial prices will be able to finance the cost of production particularly when uncertainties block the usual sources of capital.
Penetration Pricing
This policy is in favour of using a low price as the principal instrument for penetrating mass markets early. It is opposite to skimming price. The low price policy is introduced for the sake of long-term survival and profitability and hence it has to receive careful consideration before implementation. It needs an analysis of the scope for market expansion and hence considerable amount of research and forecasting are necessary before determining the price.
Penetrating pricing, means a pricing suitable for penetrating mass market as quickly as possible through lower price offers. This method is also used for pricing a new product. In order to popularise a new product penetrating pricing policy is used initially. The company may not earn profit by resorting to this policy during the initial stage. Later on, the price may be increased as and when the demand picks up. Penetrating pricing policy can also be adopted at any stage of the product life cycle for products whose market is approached with low initial price. The use of this policy by the existing concerns will discourage the new concerns to enter the market.
We must distinguish penetration pricing from Predatory Pricing. Predatory Pricing (loss leading) is the practice of selling a product or service at a very low price, intending to drive competitors out of the market or create barriers to entry for potential new competitors.
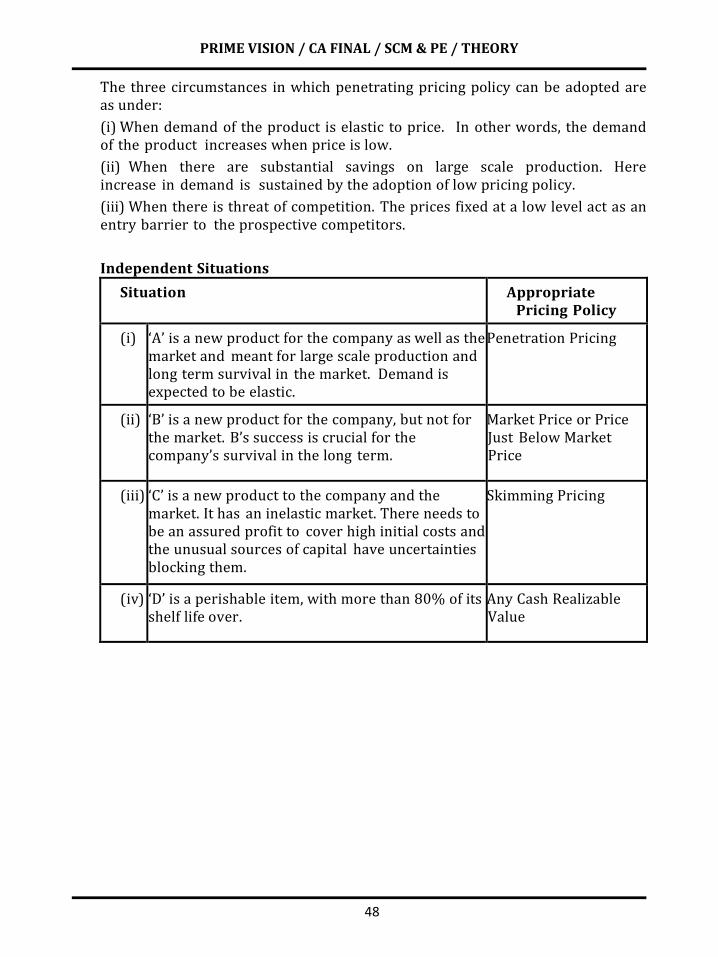
PRIME VISION / CA FINAL / SCM & PE / THEORY
48
The three circumstances in which penetrating pricing policy can be adopted are as under:
(i) When demand of the product is elastic to price. In other words, the demand of the product increases when price is low.
(ii) When there are substantial savings on large scale production. Here increase in demand is sustained by the adoption of low pricing policy.
(iii) When there is threat of competition. The prices fixed at a low level act as an entry barrier to the prospective competitors.
Independent Situations
Situation Appropriate Pricing Policy
(i) ‘A’ is a new product for the company as well as the market and meant for large scale production and long term survival in the market. Demand is expected to be elastic.
Penetration Pricing
(ii) ‘B’ is a new product for the company, but not for the market. B’s success is crucial for the company’s survival in the long term.
Market Price or Price Just Below Market Price
(iii) ‘C’ is a new product to the company and the market. It has an inelastic market. There needs to be an assured profit to cover high initial costs and the unusual sources of capital have uncertainties blocking them.
Skimming Pricing
(iv) ‘D’ is a perishable item, with more than 80% of its shelf life over.
Any Cash Realizable Value

PRIME VISION / CA FINAL / SCM & PE / THEORY
49
16. PRICING UNDER DIFFERENT MARKET STRUCTURES
The determination of optimal price can be considered under the following market structures:
a. Perfect Competition
Under perfect competitive market, there are large numbers of sellers selling a homogeneous product using identical production process and all of them have perfect information about the market and price. Perfect market allows free entry and exit of firms into and out of the industry.
Under this type of market, firm has no pricing policy of its own as the sellers are price takers (i.e. it has to accept the price determined by the market) and sell as much as they are capable of selling at the prevailing market price. Since each firm produces and sells a homogeneous product, it cannot increase its price beyond the market price. If it does so then it has to lose all of its market demand to the competitors.
There is no control over market price which will equate the quantities available with the quantities which the buyers are willing to buy. The firm has to take a decision in favour of the quantity to sell. The firm can continue to produce so long as its marginal cost is less than or equal to its selling price, upto the point at which the marginal cost is equal to price, increase in output will add to revenue and thereafter the increase will add to cost. It can be seen in following example.
Example
Aditya LLP produces a product X, the market for the product X is competitive and the prevailing market price for a unit of product X is `40. The following table presents the marginal cost and profit for the product X:
Units Total Revenue (`)
Total Cost (`)
Marginal Cost (`)
Profit (`)
0 0 20 - (20)
1 40 30 10 10
2 80 50 20 30
3 120 85 35 35
4 160 125 40 35
5 200 170 45 30
6 240 217 47 23
The marginal cost for producing 4th unit is equal to the price per unit. Thus, Aditya LLP can maximize its profit at 4th unit level.

PRIME VISION / CA FINAL / SCM & PE / THEORY
50
b. Monopoly
Monopoly is a market condition where there is only one supplier or producer of a homogeneous product for which there is no close substitute but has many buyers. Under the monopoly, a firm is a price setter i.e. it can fix any price but here also the pricing is done taking elasticity of demand for the product into consideration. That means though the seller/ producer can fix any price but it will go for the price where demand for the product and consequent profit will be maximum.
c. Monopolistic Competition
The monopolistically competitive market is one in which there are large number of firms producing similar but not identical products. Since there is limit to the growth of competitors the excess profits earned by monopolistic situation attracts new competition. This will have a long - run effect on the excess profits which will tend to diminish because of the price competition with close substitutes. The company will, however, have to compare marginal cost and marginal revenue in maximising its profits.
Under monopolistic condition, consumers may buy more at a lower price than at higher price. The profit can be maximised by equating marginal revenue with marginal cost.
d. Oligopoly
A market structure where there are few firms producing or selling homogenous or identical product. In this type of market structure the firms are aware of the mutual interdependence of investment, production process, advertising and sales plan of its rival firm. Hence, any change in any variable by a firm is likely to have an equal reaction on the part of other competing firms. It is therefore, clear that the oligopolistic firm, while determining the price for its product, consider not only the demand for the product but also the reactions of the other firms in the industry to any action or decision it may take.
If a firm does not follow or adapt its pricing policy in consonance with its competitor, the shift in the sales will be sensitive. That means demand will shift towards the lower price. Thus, each firm will study the potential reaction before increasing or decreasing the selling price. The firms in oligopolistic market maintain the price of the product either by close analysis of each other’s behavior or by means of cooperation and collusion.

PRIME VISION / CA FINAL / SCM & PE / THEORY
51
17. PARETO ANALYSIS
Pareto Analysis is a rule that recommends focus on the most important aspects of the decision making in order to simplify the process of decision making. It is based on the 80: 20 rule that was a phenomenon first observed by Vilfredo Pareto, a nineteenth century Italian economist. He noticed that 80% of the wealth of Milan was owned by 20% of its citizens. This phenomenon, or some kind of approximation of it say, (70: 30 etc.) can be observed in many different business situations. The management can use it in a number of different circumstances to direct management attention to the key control mechanism or planning aspects. It helps to clearly establish top priorities and to identify both profitable and unprofitable targets.
Usefulness of Pareto Analysis
It provides the mechanism to control and direct effort by fact, not by emotions. It helps to clearly establish top priorities and to identify both profitable and unprofitable targets. Pareto analysis is useful to:
▪ Prioritize problems, goals, and objectives to identify root causes.
▪ Select and define key quality improvement programs.
▪ Select key customer relations and service programs.
▪ Select key employee relations improvement programs.
▪ Select and define key performance improvement programs.
▪ Allocate physical, financial and human resources.
Applications of Pareto Analysis
Pareto analysis may be applicable in the presentation of Performance Indicators data through selection of representative process characteristics that truly determine or directly or indirectly influence or conform the desired quality or performance result or outcome. The Pareto Analysis is generally applicable to the following business situations:
a. Pricing of a Product
▪ In the case of a firm dealing with multi products, it would not be possible for it to analyse cost - profit- price -volume relationships for all of them. In practice, in case of such firm approximately 20% of products may account for about 80% of total sales revenue. Pareto Analysis is used for analysing the firm estimated sales revenues from various products and it might indicate that approximately 80% of its total sales revenue is earned from about 20% of its products.
▪ Such analysis helps the top management to delegate the pricing decision for approximately 80% of its products to the lower levels of management, thus freeing themselves to concentrate on the pricing decisions for products approximately 20% which are essential for the company’s survival.

PRIME VISION / CA FINAL / SCM & PE / THEORY
52
▪ Thus, a firm can adopt more sophisticated pricing methods for small proportion of products that jointly accounts for approximately 80% of total sales revenue. For the remaining 80% of the products which account for 20% of total sales revenue the firm may use cost based pricing method.
b. Customer Profitability Analysis
▪ Instead of analysing products, customers can be analysed for their relative profitability to the organisation.
▪ Again, it is often found that approximately 20% of customers generate 80% of the profit. There will always be some customers who are less profitable than others, just as some products are less profitable than others.
▪ Such an analysis is useful tool for evaluation of the portfolio of customer profile and decision making such as whether to continue serving a same customer group, what is the extent of promotion expenses to be incurred.
c. ABC Analysis- Stock Control
▪ Another application of Pareto analysis is in stock control where it may be found that only a few of the goods in stock make up most of the value. In practice, approximately 20% of the total quantity of stock may account for about 80% of its value. The outcome of such analysis is that by concentrating on small proportion of stock items that jointly accounts for 80% of the total value, a firm may well be able to control most of monetary investment in stocks.
d. Application in Activity Based Costing
▪ In Activity Based Costing it is often said that 20% of an organisation cost drivers are responsible for 80% of the total cost. By analysing, monitoring and controlling those cost drivers that cause most cost, a better control and understanding of overheads will be obtained.
e. Quality Control
▪ Pareto analysis seeks to discover from an analysis of defect report or customer complaints which “vital few” causes are responsible for most of the reported problems.
▪ Often, 80% of reported problems can usually be traced to 20% of the various underlying causes. By concentrating once efforts on rectifying the vital 20%, one can have the greatest immediate impact on product quality.
▪ The Pareto Analysis indicates how frequently each type of failure (defect) occurs. The purpose of the analysis is to direct management attention to the area where the best returns can be achieved by solving most of quality problems, perhaps just with a single action.

PRIME VISION / CA FINAL / SCM & PE / THEORY
53
18. ENVIRONMENTAL MANAGEMENT ACCOUNTING [EMA]
EMA is the process of collection and analysis of the information relating to environmental cost for internal decision making. EMA identifies and estimates the costs of environment-related activities and seeks to control these costs. The focus of EMA is not on financial costs but it also considers the environmental cost or benefit of any decisions made. EMA is an attempt to integrate best management accounting thinking with best environmental management practice.
EMA can be viewed as a part of the environmental accounting framework and is defined as using monetary and physical information for internal management use. Though EMA information can be used in any management decision making process, it is particularly useful for environmental decision making. EMA aims to make a better use of or to modify sources of information and management accounting techniques and to evaluate sustainability and/or environmental efficiency of a company.
The major areas for the application for EMA are:
▪ Product Pricing
▪ Budgeting
▪ Investment Appraisal
▪ Calculating Costs and
▪ Savings of Environmental Projects, or Setting Quantified Performance Targets.
Environmental Costs
The US Environmental Protection Agency in 1998 has categorized Environmental Costs in four sections:
▪ Conventional Costs: Raw material and energy costs having environmental relevance.
▪ Hidden Costs: Costs which have been accounted for but then lose their identity in ‘general overheads’.
▪ Contingent Costs: Costs to be incurred at a future date – for example, clean- up costs.
▪ Relationship Costs: Intangible Costs, for example, the costs of preparing environmental reports.

PRIME VISION / CA FINAL / SCM & PE / THEORY
54
The United Nations Division for Sustainable Development (UNDSD), on the other hand, described Environmental Costs as comprising of:
Environmental Prevention Cost: These costs are basically incurred in relation to activities undertaken to prevent the production of waste that could harm the environment.
Environmental Appraisal Costs: It means costs incurred in relation to activities undertaken to determine whether product processes and other activities within firm are complying with environment standards.
Environmental Failure Cost: It means cost incurred in relation to activities dealing with pollution arising from the activities of entity includes costs related to treatment harmful gases and treatment of solid waste.
Cost of environment related activities and measures to control these cost.
1. Waste
A company should measure, manage and monitor waste from operations in order to minimise impact on people and the environment. ‘Mass balance’ approach can be used to determine how much material is wasted in production, whereby the weight of materials bought is compared to the product yield. From this process, potential cost savings may be identified.
2. Water Management Businesses pay for water twice – first, to buy it and second, to dispose of it. If savings are to be made in terms of reduced water bills, it is important to identify where water is used and how consumption can be decreased. For water conservation, sustainable water management techniques should be adopted. In refining operation, water is mainly used in boilers and cooling units. Collective efforts should be made to optimize water consumption and maximum reuse of used water. Advanced treatment system like rain water harvesting, ultra-filtration, reverse osmosis etc. may be used for water purification for further use. This would lead to substantial reduction in intake of fresh water. In addition, company’s staff should be alerted for water conservation through seminars, presentations, conference, awareness campaigns.
3. Energy Often, energy costs can be reduced significantly at very little cost. Environmental Management Accounts may help to identify inefficiencies and wasteful practices and, therefore, opportunities for cost savings. Some of energy conservation initiatives may be taken by CNB like:
Conducting periodic energy audits for identifying energy saving opportunities.
Phasing out conventional lights and replacement with LED lights/induction lights.
Power factor improvement by installation of capacitor banks.

PRIME VISION / CA FINAL / SCM & PE / THEORY
55
Installation of 5 star rated energy equipment.
Prevention of idle running of equipment.
Installation of solar lights.
Use of Nano molecular thermal additives in ACs.
Installation of efficient energy monitoring system for energy intensive equipment.
Capacity improvement for batteries.
4. Consumables and Raw Material
A company may use recyclable technology for raw material and consumable wastages which provides sustainability in terms of environmental protection and reduction in carbon footprint. Periodic testing should be performed to assess the health of equipment and pipelines as to have better process of raw materials and consumables.
5. Transport
Again, EMA may be used to identify saving in terms of transport of goods and materials. In order to cutback emission and fuel consumption due to transportation, route optimization activity may be used like allocation of customer on the basis of nearest depots and locations as to reduce distance, real time fleet tracking using GPS (to make sure that vehicles do not deviate from assigned shortest route) etc.
In practice, Environmental Costs can be split into further two categories: Internal Costs and External Costs.
Internal Costs have direct impact on the income statement of a company. On the other hand, External Costs are imposed on society at large, but not borne by the company that generates the cost in the first instance.
Recently governments of many countries are becoming increasingly aware of these external costs and are using taxes and regulations to convert them to internal costs. For example, if the activities of companies lead to forest degradation they might be required to have a tree replacement programme, or they may be granted lower tax allowances on vehicles that cause a high degree of harm to the environment.

PRIME VISION / CA FINAL / SCM & PE / THEORY
56
19. ECONOMIC VALUE ADDED (EVA)
In practice, many organizations use profit-based measures as the primary measure of their financial performance. Two problems relating to profit in this area are:
▪ Profit ignores the cost of equity capital. Companies only generate wealth when
they generate a return in excess of the return required by providers of capital
– both equity and debt. In financial statements, the calculation of profit does
take into account the cost of debt finance, but ignores the cost of equity finance.
▪ Profits calculated in accordance with accounting standards do not truly reflect
the wealth that has been created, and are subject to manipulation by
accountants.
EVA is a performance measurement system that aims to overcome these two weaknesses.
Economic Value Added is a measure of economic profit. Economic Value Added is calculated as the difference between the Net Operating Profit After Tax (NOPAT) and the Opportunity Cost of Invested Capital. This opportunity cost is determined by multiplying the Weighted Average Cost of Debt and Equity Capital (WACC) and the amount of Capital Employed.
Where- NOPAT means net operating profit after tax. This profit figure shows profits before taking out the cost of interest.
Two approaches to adjusting for interest are taken.
▪ Start with operating profit, then deduct the adjusted tax charge. The tax
charge should be adjusted because it includes the tax benefit of interest. Since
interest is a tax -deductible item, having interest in the income statement
means that the tax charge is lower. Since we are taking the cost of interest out
of the income statement, it is also necessary to remove the tax benefit of it from
the tax charge. To do this, multiply the interest by the tax rate, and add this to
the tax charge, or
▪ Start with profit after tax, and add back the net cost of interest. This is the
interest charge multiplied by (1 – rate of corporate tax).
PRIME VISION / CA FINAL / SCM & PE / THEORY
57
20. PERFORMANCE MEASUREMENT IN NOT FOR PROFIT SECTOR
▪ It is important to understand the nature of not-for-profit organisation in
order to appreciate the dynamics of performance evaluation in such
organisations. Not-for-Profit organisations are generally formed for social
causes (like healthcare, education, infrastructure development, environmental
causes, charitable causes etc.) They are also formed for rendering services to
the members and operate on a no-profit and no-loss basis. Examples include
professional bodies, societies formed for maintenance of residential complex,
political parties etc. (Not-for-profit organisations are also referred to as NGOs,
Charitable organisations, Voluntary organisations etc.)
▪ As the name suggest, unlike in the case of a for-profit organisation, the
underlying objective of these organisations is not to earn profits and
distribute dividends to its members. The for-profit organisations have an
ultimate objective of shareholder’s wealth maximisation and hence the
performance can be measured using financial measures like profitability,
return on net assets, economic value added, residual income etc. Since a not-
for profit organisation is focused on certain causes and is not focused on
financial returns, performance measurement can be tricky.
▪ The not-for-profit organisations are formed for certain specific mission and
objectives. For e.g. an organisation formed to provide free education to poor
children is formed with a specific mission to provide access to education to
those who are deprived. These organisations also need funds to achieve the
mission and objectives which are contributed by donors and members. The
organisation, thus, has fiduciary responsibilities to those contributing funds
and must ensure that the funds are deployed to meet the intended mission
and objectives. Thus, though the not-for- profit organisations are not focused
towards earning profits, the financial measures are equally important as non-
financial measures to measure their performance.

PRIME VISION / CA FINAL / SCM & PE / THEORY
58
Why do we need performance measure in Not-for-Profit Organisations?
▪ As discussed earlier, a not-for-profit organisation does not exist for earning
profits but for achieving certain social or charitable cause. The activities
carried out by such organisations must be measured to give a confidence to
the donors/ members that the resources contributed are being utilised
efficiently and effectively.
▪ However, performance measurement in such not-for-profit organisations is not
easy. The following are key challenges for measuring performance in not-for-
profit organisations –
Benefits cannot be quantified
A large part of benefits derived from the activities of these organisations are not quantifiable. For example - if a not-for-profit organisation is formed for providing free education to poor students, the benefits derived by the students cannot be quantified. In some cases, an organisation might spend money to provide better ambulance services to its patient. The benefits of saving lives of patients cannot be measured in financial terms. Hence, it is difficult to evaluate performance of not-for-profit organisations using financial measures.
Benefits may accrue over a longer term
The expenditure incurred in one year may yield benefits over several years. A hospital may invest in creating ICU (Intensive Care Units) facility, the benefit of which will be obtained over multiple years. Such benefits cannot be measured reliably.
Measurement of utilisation of funds & expenditure
Some not-for-profit organisation spend out of their fixed budget and do not earn any revenue. The assessment of whether the spending have been appropriate is a key challenge. The organisations may resort to rampant spending simply to meet the expenditure targets. Many organisations get additional funds if they achieve the expenditure targets and this could be a motive for increase spending.
Multiple objectives
Many not-for-profit organisations are formed for multiple objectives. The prioritisation of objectives can be a challenging task.

PRIME VISION / CA FINAL / SCM & PE / THEORY
59
Performance Measurement
Despite the challenges highlighted above, it is imperative that the performance measurement is carried out for not-for-profit organisations. This helps the members, donors and other stakeholders to get a comfort that the organisation is working towards desired objectives and mission.
Value for Money (VFM) Framework
A framework which can be used for measurement of performance in not-for-profit sector is the Value for Money framework. Not-for-profit organisations are expected to provide value for money which is demonstrated by:
▪ Effectiveness: Whether the organisation has achieved its desired mission and
objectives?
▪ Efficiency: Whether the resources and funds available to the organisation has
been utilised efficiently i.e. maximum output has been obtained with
minimum input?
▪ Economy: Whether the desired output has been obtained using the lowest
cost? It must be noted that use of lowest cost approach should not compromise
quality.

PRIME VISION / CA FINAL / SCM & PE / THEORY
60
21. TRIPLE BOTTOM LINE (TBL)
TBL expands traditional accountancy reporting systems, looking at social and environmental performance, rather than simply financial performance. This can be used to help encourage each division and manager within the organisation to act in a socially responsible manner. TBL incorporates the three dimensions-
▪ Environmental- measures the impact on resources, such as air, water, ground
and waste emissions
▪ Social- relates to corporate governance, motivation, incentives, health and
safety, human capital development, human rights and ethical behaviour.
▪ Economic- refers to measures maintaining or improving the company’s success.

PRIME VISION / CA FINAL / SCM & PE / THEORY
61
22. ETHICAL AND NON-FINANCIAL CONSIDERATION IN DECISION MAKING
Capital Budgeting or Investments decisions are generally made based on the various financial evaluation like Net Present Value, Internal Rate of Return, Payback Period etc. The financial considerations in capital budgeting decisions are important because the end objective of every for-profit business is maximisation of shareholders wealth. However, an important aspect of capital budgeting is that investment decisions cannot be purely based on financial analysis since there are other soft non-financial aspects of the investment appraisal that need to be thoroughly looked into. Some of the non-financial considerations that a company factors for capital budgeting or investment decisions are listed below:
Environmental Factors
Environmental factors like pollution, deforestation, impact on climate and weather, greenhouse effects etc. must be considered by companies while selecting a project for implementation. Any project which adversely affects the environment is not taken positively by common public and environmentalists. A lot of projects have been stalled or delayed due to the protests by pro- environment groups leading to cost and time overrun. The government through ministry of environment could impose penalties on projects which are violating environmental norms or green norms.
Staff Motivation
Staff motivation and satisfaction is another important factor which companies might consider while choosing projects. If, for example, a company decides to implement automation in its plants for operations which would result in redundancy in labour, the overall staff motivation would come down. Staff and workers would resort to strikes and lockouts to protest against such decisions. The company should adopt a participative approach while taking such decisions considering the impact it would have on the labours.
Government Regulations
The companies must comply with relevant government regulations while implementing projects. Some projects might be profitable and yield excellent returns. However, if the profits and cashflows are generated by violating government regulations, it could be harmful in the longer run for the company and its brand. The companies must ensure that all relevant laws and regulations are complied with.

PRIME VISION / CA FINAL / SCM & PE / THEORY
62
Availability of Resources
The evaluation of any project must also consider availability of key resources like raw material, manpower, logistics infrastructure, electricity etc. If there is any constraint on any of the key resources at a future date, a financially viable and excellent project could well turn into a failed project. It is thus important that the requirements and availability of key resources are analysed in advance.
Availability of Project Site
Site selection involves measuring the needs of a new project against the merits of potential locations. This indicates the practice of new facility location, keeping in mind project requirements. A wrong or unsuitable project location may mar the very benefits of a financially lucrative investment proposal.
Corporate Social Responsibility Corporate social responsibility refers to "the ethical principle that an organisation should be responsible for how its behaviour might affect society and the environment”. The companies do not function in silos but are a part of the larger society and environment. They have a responsibility towards the society and environment to use the various resources judiciously and ensure a sustainable development. Companies are expected to uplift the well being of the society at large and to not harm the environment through operations. The aspects of corporate social responsibility must also be considered while deciding the project to be implemented.
Ethics
Ethics are a set of guiding moral principles for individuals and corporates. Every company has a duty of care to various stakeholders (shareholders, employees, suppliers, customers etc.). A company is expected to act in a fair and transparent manner and be honest in all its dealings with stakeholders.

PRIME VISION / CA FINAL / SCM & PE / THEORY
63
23. BALANCED SCORECARD
In today’s business environment information becomes a vital element and to gain competitive advantage over the peers, it cannot be denied. In this era of information age competition, a company cannot survive just by injecting huge capital investment in new technology for physical assets only or by excellent management of financial assets and liabilities. In this information age both manufacturing and service organisation needs new capabilities for competitive success. Merely investing in and managing physical, tangible assets is not enough but an organisation must be able to mobilise and exploit its intangible or invisible assets which in turn becomes a decisive factor.
Intangible assets enable an organisation to:
▪ Maintain and further development in customer relationships to retain
loyalty of existing customers and to serve new market/ customer segments
effectively and efficiently.
▪ Introduce products and services as per the desire of targeted customer
and market segments.
▪ Produce customised high-quality products and services economically with
short gestation periods.
▪ Mobilise employee skills and motivation for better and consistent
deliberation in process capabilities, quality, and response times.
▪ Deploy information technology, data bases and effective management
information systems.
The balanced scorecard is a method which displays organisation’s performance into four dimensions namely financial, customer, internal and innovation. The four dimensions acknowledge the interest of shareholders, customers and employees taking into account of both long-term and short-term goals.
Kaplan and Norton classified performance measures into four business ‘perspectives’:
(i) The financial perspective
(ii) The customer perspective
(iii) The internal business perspective
(iv) The learning and growth perspective

PRIME VISION / CA FINAL / SCM & PE / THEORY
64
Financial Perspective: “How Do We Look To Shareholders?” In this step manager of a division or a unit, links its business objectives to the corporate strategy of the company as a whole. Financial performance measures indicate whether the company’s strategy implementation and execution are contributing to its revenue and earnings. To identify key performance measures in this perspective, managers, during strategic planning ask “How do we look to shareholders?”
Corporate strategy and strategic initiatives are examined from the financial perspective to see feasibility of these initiatives of being met. The financial objectives chosen at the onset of the balanced scorecard implementation should serve two purposes:
To provide definite performance that was expected at the time of strategies selection.
To provide a focus for objectives and appropriate measures in each of the other three perspectives.
Customer Perspective: “How Do Customer View Us?” In this stage, companies identify customers and market segments in which they compete and also the means by which they provide value to these customers and markets. Managers identify the lead indicators which make a particular business unit or product different from that of others. Lead indicator may vary from customer to customer or market segment. If for example, a customer values on-time delivery then on-time delivery becomes a lead indicator.
Examples of lead indicators may include any number of customer considerations, including:
On-time delivery
On-site service
After sales support
Defects per order
Cost of the product
Free shipments etc.
By delivering quality as per the customer demand and need, business units can improve outcome measures such as customer satisfaction, retention, acquisition and loyalty.
Internal Business Perspective: “At What Must We Excel?” In this stage companies identify processes and activities which are necessary to achieve the objectives as identified at financial perspectives and customer perspective stage. These objectives may be achieved by reassessing the value chain and making necessary changes to the existing operating activities. If maintaining net earnings is the financial objective of a company and after sales service can increase customer retention, then internal business perspective needs to improve after sales services to satisfy customer requirements to maintain net earnings. This objective may be achieved by providing for example toll free customer help lines, setting up service centres in all major cities.

PRIME VISION / CA FINAL / SCM & PE / THEORY
65
Learning and Growth Perspective: “How Do We Continue To Improve And Create Value?” In the learning and growth perspective, Companies determine the activities and infrastructure that the company must build to create long term growth, which are necessary to achieve the objectives set in the previous three perspectives. Organisational learning and growth comes from three principle sources:
People i.e. employee capabilities
Systems i.e. information system capabilities and
Organisational procedures i.e. motivation, empowerment and alignment.
Since, the balanced scorecard is intended to improve long-term performance, managers may invest in resources needed in the short-run but this should not affect business unit’s performance.
The ultimate result of using the Balanced Scorecard approach should be an improved long term financial performance. Since the scorecard gives equal importance to the relevant non –financial measures, it should discourage the short termism that leads to cuts in spending on new product development, human resource development etc. which are ultimately detrimental for the future prospects of the company.
The responsibility to devise and implement a Balanced Scorecard should be that of the managers working with the business. Since every company is different, it shall need to work out for itself the various financial and non – financial measures, which need to be focused upon for its own development. Since the Balanced Scorecard is recommended as a management tool used both for internal and external reporting purposes, it is again the manager’s responsibility to decide as to what information needs to be disclosed and how any problems of confidentiality can best be overcome.
The following are some reasons why Balanced Scorecards sometimes fail to provide for the desired results;
Managers mistakenly think that since they already use non – financial measures, they already have a Balanced Scorecard.
Senior executives misguidedly delegate the responsibility of the Scorecard implementation to middle level managers.
Company’s try to copy measures and strategies used by the best companies rather than developing their own measures suited for the environment under which they function.
There are times when Balanced Scorecards are thought to be meant for reporting purposes only. This notion does not allow a Business to use the Scorecard to manage Business in a new and more effective way.
It may be noted that the above-mentioned difficulties refer to the internal use of the Scorecard, unless it is used internally successfully, it should not be used as a basis for external reporting.

PRIME VISION / CA FINAL / SCM & PE / THEORY
66
24. PERFORMANCE PRISM
Performance Prism creators Andy Neely and Chris Adams mentioned that the better-known Balanced Scorecard framework only focuses on two sets of stakeholders: shareholders and customers.
The Performance Prism is an approach to performance management which aims to effectively meet the needs and requirements of all stakeholders.
This is in contrast with the performance pyramid which tends to concentrate on customers and shareholders and is also in contrast with value based management, which prioritizes the needs of shareholders.
▪ It takes stakeholder requirements as the start point for the development of
performance measures rather than the strategy of the organisation.
▪ It recognises the need to work with stakeholders to ensure that their needs are
met.
There are five ‘facets’ to the Performance Prism which lead to key questions for strategy formulation and measurement design:
Stakeholders Satisfaction: The organization needs to focus on who are the stakeholders? What are the needs and wants of the stakeholders?
Strategies: What are the strategies required by the organization to fulfill the wants and needs of the stakeholders?
Processes: What are the necessary processes required for satisfying the above strategies ?
Capabilities: What capabilities does the organization needs for operating and enhancing the process?
Stakeholders Contributions: It further takes into account what contribution does the management needs from its stakeholders?
Stakeholders expect some things from the organisation. The organisation also must expect contribution from the stakeholders. There is a ‘Quid Pro Quo’ relationship between the stakeholders and organisation.
The Performance Prism allows organisations to develop strategies, business processes and measures geared to the specific needs of all important stakeholder groups. By taking a broad stakeholder perspective that includes regulators and business communities, the PP enables an organisation to more directly address the risks and opportunities in its business environment. Using the PP to develop measures for each relevant stakeholder facilitates the communication and implementation of strategy.
PRIME VISION / CA FINAL / SCM & PE / THEORY
67
Performance Measures – Benefits
Berry, Broadbent and Otley (1995) suggest that the following benefits can be derived from the use of performance measures:
▪ Develops agreed measures of activity.
▪ Clarifies the objectives of the organization.
▪ Greater understanding of process.
▪ Helps facilitate comparison between divisions.
▪ Promotes accountability to stakeholder.
▪ Helps in setting of targets for managers.
▪ Helps facilitate comparison between different organizations

PRIME VISION / CA FINAL / SCM & PE / THEORY
68
25. THE BUILDING BLOCK MODEL
Fitzgerald and Moon proposed a Building Block Model which suggests the solution of performance measurement problems in service industries. But it can be applied to other manufacturing and retail businesses to evaluate business performance. Variants of the building block model are currently used in Australia in the regulation of electricity transmission and distribution, gas transmission and distribution, railways, postal services, urban water and sewerage services, irrigation infrastructure, and port access.
1. Standards. These are the measures used, i.e. the Key Performance Indicators (KPIs), should have the following characteristics:
Equity- Performance measures should be equally challenging for all parts of business. Relaxation given to one part of the business leads to perception of unfair treatment which hinders productivity.
Ownership- Performance measure should be acceptable to everyone. Employees should get involved in the identification of measures rather than being imposed on them. Ownership means here is responsibility for the results.
Achievable- Performance measure should be realistic. Ex, using actual results for the competitors to set as target. Employee will not be motivated to achieve the targets if considered impossible to achieve them.
2. Rewards- To ensure that employees are motivated to meet standards, the standards need to be clear and linked to controllable factors. Reward schemes should possess following characteristics:
Motivation- Rewards scheme should be set in manner which motivates employees to achieve the business goals. If sales growth is desired then bonus can be linked to performance measures, like increase in number of units sold than previous year.
Clear- Rewards scheme should be clearly communicated to employees in advance. What kind to performance will be rewarded and how their performance will be measured?
Controllability- Employees should only be rewarded or penalized if the result over which they some control or influence.
3. Dimensions- Dimensions are the goals for the business, i.e. the Critical Success Factors (CSFs) and suitable measures must be developed to measure each performance dimension. They are further divided into two sub-categories.
a. Determinants-These are performance areas which influence the results. These are.
▪ Quality- It is the ability to deliver goods and service with consistency. Quality
should be judged from eyes of the customers. Quality is the level of benefits
customers expects from the product. Quality should be enough for a product
price paid.

PRIME VISION / CA FINAL / SCM & PE / THEORY
69
▪ Flexibility- It is the responsiveness to change in the factor influencing the
business performance. Ex, ability to cope with sudden increase in sales demand.
▪ Innovation- Ability of the business to devise new products and new ways of
doing things. Like packaging of products with environment friendly (recyclable)
material.
▪ Resource Utilization- It is the ability to use resources to achieve
business objectives.
Business assets should be used for the proper purpose and in most efficient way. Ex, using delivery vans to its maximum capacity only by carrying authorized goods.
b. Results- It reflects the success or failure of determinants identified above.
▪ Financial Performance- Financial performance gives an indication of overall
business at a glance in monetary terms. These can be used to identify areas of
strengths and weaknesses. It may also highlight other areas previous identified
which may be critical to business success.
▪ Competitive Performance- How they stand in comparison to its
competitors? How are the different from their competitors? Ex, offering of
products of higher quality than competitors and products having distinct
features than rival products.

PRIME VISION / CA FINAL / SCM & PE / THEORY
70
The Results and Determinants Framework
Dimensions of Performance
Types of Measures R
esu
lts
Competitiveness ▪ Relative Market Share and Position
▪ Sales Growth
▪ Measures of the Customer Base Financial Performance
▪ Profitability
▪ Liquidity
▪ Capital Structure
▪ Market Ratios
Det
erm
inan
ts
Quality of Service ▪ Reliability
▪ Responsiveness
▪ Aesthetics/appearance Communication
▪ Cleanliness/tidiness
▪ Comfort
▪ Friendliness
▪ Courtesy
▪ Competence
▪ Access
▪ Availability
▪ Security
▪ Communication
Flexibility ▪ Volume Flexibility
▪ Delivery Speed Flexibility
▪ Specification Flexibility Resource utilization
▪ Productivity
▪ Efficiency
Innovation ▪ Performance of the Innovation Process
▪ Performance of Individual Innovations

PRIME VISION / CA FINAL / SCM & PE / THEORY
71
26. BENCHMARKING
Benchmarking, technique for continuous improvement was originated in Japan during the early 1960s due to Japanese curiosity and fondness for achieving the best of best. Various forms of benchmarking have been used in industry for years. After 1980s with the advent of worldwide competition in key industries benchmarking come of age. Xerox, Motorola, Ford and other leading companies pioneered a much broader forms of benchmarking. These companies found benchmarking a valuable means of improving their competitiveness and effectiveness. It became an integral part of their continuous process improvement programme.
Benchmarking is a technique for continuous improvement in performance. It involves comparing a firm’s products, services or activities against other best performing organisations, either internal or external to the firm. The objective is to find out how a product, service or activity can be improved and ensure that the improvements are implemented. It attempts to identify an activity such as customer order processing needs to be improved and finding a non-rival organisation that is considered to represent world class best practice and studying how it performs the activity. It is a performance measure that provides the driving force to establish high performance and means to accomplish these goals. It is thus a component of a wider improvement process such as business process reengineering or quality improvement.
The benchmarking is a versatile tool that can be applied in a variety of ways to meet a range of requirements. The distinct types of benchmarks have been evolved over a period of time. Each has its own benefits and shortcomings and therefore each one is appropriate in certain circumstances than others.
Benchmarking are of following types:
▪ Competitive Benchmarking: It involves the comparison of competitors
products, processes and business results with own. Benchmarking partners are
drawn from the same sector. However, to protect confidentiality it is common
for the companies to undertake this type of benchmarking through trade
associations or third parties.
▪ Strategic Benchmarking: It is similar to the process benchmarking in nature
but differs in its scope and depth. It involves a systematic process by which a
company seeks to improve its overall performance by examining the long term
strategies. It involves comparing high level aspects such as developing new
products and services, core competencies etc.

PRIME VISION / CA FINAL / SCM & PE / THEORY
72
▪ Global Benchmarking: It is a benchmarking through which distinction in
international culture, business processes and trade practices across companies
are bridged and their ramification for business process improvement are
understood and utilised. Globalisation and advances in information technology
leads to use this type of benchmarking.
▪ Process Benchmarking: It involves the comparison of an organisation critical
business processes and operations against best practice organisation that
performs similar work or deliver similar services. For example, how do best
practice organisations process customers’ orders?
▪ Functional Benchmarking: This type of benchmarking is used when
organisations look to benchmark with partners drawn from different business
sectors or areas of activity to find ways of improving similar functions or work
processes. This sort of benchmarking can lead to innovation and dramatic
improvements.
▪ Internal Benchmarking: This involves seeking partners from within the same
organisation, for example, from business units located in different areas. The
main advantages of internal benchmarking are that access to sensitive data and
information are easier; standardised data is often readily available; and,
usually less time and resources are needed. There may be fewer barriers to
implementation as practices may be relatively easy to transfer across the
same organisation. However, real innovation may be lacking and best in class
performance is more likely to be found through external benchmarking.
▪ External Benchmarking: This involves seeking help of outside organisations
that are known to be best in class. External benchmarking provides
opportunities of learning from those who are at the leading edge, although it
must be remembered that not every best practice solution can be transferred
to others. In addition, this type of benchmarking may take up more time and
resource to ensure the comparability of data and information, the credibility
of the findings and the development of sound recommendations.
The benchmarking can be categorised into:

PRIME VISION / CA FINAL / SCM & PE / THEORY
73
(i) Intra-Group Benchmarking: In intra group benchmarking the groups of
companies in the same industry agree that similar units within the cooperating
companies will pool data on their process. The processes are benchmarked
against each other at an operational level. ‘Improvement task forces’ are
established to identify and transfer best practice to all members of the group.
(ii) Inter-Industry Benchmarking: In inter-industry benchmarking a non-
competing business with similar process is identified and asked to participate in a
benchmarking exercise. For example, a publisher of school book may approach a
publisher of university level books to establish a benchmarking relationship.
Although two publishers are not in direct competition but there are obviously
many similarities in their business with respect to sources of supply, distribution
channels. Each will be able to benefit from the experience of other and establish
‘best practices’ in their common business processes.
Goals of Benchmarking
Benchmarking can deliver significant performance improvements and returns based on efficiency, cost savings and new revenues. Benchmarking projects typically target cycle times, productivity, customer service, quality and production costs. They also can be part of an effort to shift the culture of a company to be more customer oriented and results focused.
Process of Benchmarking
The process of benchmarking requires a Company to identify the areas i.e. processes, activity etc. which are central to its business and then selects the top-performing companies in those areas. By analyzing how that excellence is achieved, the company learns lessons to apply to its own processes.
The benchmarking process is comprised of following stages. These stages are:
(I) Planning
(i) Determination of benchmarking goal statement: This requires identification of areas to be benchmarked. In practice, one should start with the identification of those areas which have to be really good to be really successful. One should start with the areas which account for most of the expenditure or which tie up the most of cash. One should remember that one cannot benchmark own performance until one have reliable and efficient systems of measurement in its own organisation. This applies irrespective of whether our benchmarking partners are internal or external, in parallel or in totally different business sectors. For identification of areas to be benchmarked the following criteria are used:
▪ What would make the most significant improvements in our relationships with our customers.
▪ What would make the most significant improvements to our bottom-line.

PRIME VISION / CA FINAL / SCM & PE / THEORY
74
Benchmarks important for customer satisfaction may include:
▪ Consistency of product or service.
▪ Process cycle time.
▪ Delivery performance.
▪ Responsiveness to customer requirements.
▪ Adaptability to special needs.
Benchmarks important for direct impact on the bottomline may include:
▪ Waste and reject levels.
▪ Inventory levels.
▪ Work-in-Progress.
▪ Cost of sales.
▪ Sales per employee.
(ii) Identification of best performance: Once the benchmarked goal
statement are defined, the next step is seeking the best of the breed or best of
the best. Since practically to arrive at the best is both expensive and time
consuming therefore it is better to identify company which has recorded
performance success in a similar area.
(iii) Establishment of the benchmarking or process improvement team:
Ideally this should include the persons who are most knowledgeable about the
internal operations and will be directly affected by changes due to
benchmarking.
(iv) Defining the relevant benchmarking measurement: Relevant measures
will not include the measures used by the organisation today but they will be
refined measures that comprehend the true performance differences.
Developing good measurement is key to successful benchmarking.
(II) Collection of Data and Information
The data gathering for benchmarking could be done through national/international clearing houses, mail surveys, suppliers, company visits, telephone, interviews etc. In recent years national and international clearing houses have been set up.
The collection of data and information involves following steps:
▪ Compile information and data on performance. They may include mapping
processes.
▪ Select and contact partners.

PRIME VISION / CA FINAL / SCM & PE / THEORY
75
▪ Develop with partners, a mutual understanding about the procedures to be
followed and, if necessary, prepare a Benchmarking Protocol.
▪ Prepare questions and agree terminology and performance measures to be used.
▪ Distribute schedule of questions to each partner.
▪ Undertake information and data collection by chosen method for example,
interviews, site-visits, telephone, fax and e-mail.
▪ Collect the findings to enable analysis.
(III) Analysing the Findings
The analysing of finding of above step requires following:
▪ Review the findings and produce tables, charts and graphs to support the
analysis.
▪ Identify gaps in performance between our organisation and better performers.
▪ Seek explanations for the gaps in performance. The performance gaps can
be positive, negative or zero.
▪ Ensure that comparisons are meaningful and credible.
▪ Communicate the findings to those who are affected.
▪ Identify realistic opportunities for improvements. The negative performance
gap indicates an undesirable competitive position and provide a basis for
performance improvement. If there is no gap it may indicate a neutral position
relative to the performance being benchmarked. The zero position should be
analysed for identifying means to transform its performance to a level of
superiority or positive gap.
(IV) Recommendations
This involves
Making recommendation:
▪ Deciding the feasibility of making the improvements in the light of the
conditions that apply within own organisation.
▪ Agreement on the improvements that are likely to be feasible.
▪ Producing a report on the Benchmarking in which the recommendations are
included.
▪ Obtaining the support of key stakeholder groups for making the changes needed.
▪ Developing action plan(s) for implementation.
Implementing recommendations:
▪ Implement the action plans.
▪ Monitor performance.

PRIME VISION / CA FINAL / SCM & PE / THEORY
76
▪ Reward and communicate successes.
▪ Keep key stakeholders informed of progress.
(V) Monitoring and Reviewing : This involves:
▪ Evaluating the benchmarking process undertaken and the results of the
improvements against objectives and success criteria plus overall efficiency and
effectiveness.
▪ Documenting the lessons learnt and make them available to others.
▪ Periodically re-considering the benchmarks for continuous improvement.
Pre-requisites for Successful Benchmarking Irrespective of the type and scope of benchmarking, it will be important to ensure that:
▪ Senior manger’s support benchmarking and are committed to continuous
improvements;
▪ The objectives are clearly defined at the outset;
▪ The scope of the work is appropriate in the light of the objectives, resources,
time available and the experience level of those involved;
▪ Sufficient resources are available to complete projects within the required time
scale;
▪ Benchmarking teams have a clear picture of their organisation’s
performance before approaching others for comparisons;
▪ Benchmarking teams have the right skills and competencies;
▪ Stakeholders, particularly staff and their representatives, are kept informed of
the reasons for benchmarking.
Difficulties in Implementation of Benchmarking
▪ Benchmarking is a time consuming and at times difficult. It has significant
requirement of staff time and company resources.
▪ Benchmarking implementation requires the direct involvement of the senior
manager etc. The drive to be best in the industry or world cannot be delegated.
▪ It is likely that there is resistance from employees.
▪ Companies can become preoccupied with the measures. The goal becomes not
to improve process but to match the best practices at any cost.
▪ The key element in benchmarking is the adaptation of a best practice to
tailor it to a company’s needs and culture. Without that step, a company
merely adopts another company’s process. This approach condemns
benchmarking to fail.
▪ Companies often waste time in benchmarking non-critical functions.

PRIME VISION / CA FINAL / SCM & PE / THEORY
77
Benchmarking Code of Conduct
Benchmarking - the process of identifying and learning from the best practices anywhere in the world - is a powerful tool for continuous improvement. To contribute to efficient, effective, and ethical benchmarking, individuals agree for themselves and their organization to be abide by the following principles for benchmarking with other organizations:
The following is a suggested Benchmarking code of conduct:
▪ Principle of Legality: Avoid discussions or actions that might lead to or imply
an interest in restraint of trade, market or customer allocation schemes, price
fixing, dealing arrangements, bid rigging, bribery or misappropriation. Do not
discuss costs with competitors if costs are an element of pricing.
▪ Principles of Exchange: Be willing to provide the same level of information that
you request in any benchmarking exchange.
▪ Principle of Confidentiality: Treat benchmarking interchange as something
confidential to the individuals and organizations involved. Information
obtained must not be communicated outside the partnering organizations
without prior consent of participating benchmarking partners. An
organization’s participation in a study should not be communicated externally
without their permission.
▪ Principle of Use: Use information obtained through benchmarking partnering
only for the purpose of improvement of operations within the partnering
companies themselves. External use or communication of a benchmarking
partner’s name with their data of observed practices requires permissions of
that partner. Do not, as a consultant or client, extend one company’s
benchmarking study findings to another without the first company’s permission.
▪ Principle of First Party Contact: Initiate contacts, whenever possible,
though a benchmarking contact designated by the partner company. Obtain
mutual agreement with the contact on any hand off of communication or
responsibility to other parties.
▪ Principle of Third Party Contact: Obtain an individual’s permission before
providing their name in response to a contact request.
▪ Principle of Preparation: Demonstrate commitment to the efficiency and
effectiveness of the benchmarking process with adequate preparation at each
process step, particularly, at initial partnering contact.

PRIME VISION / CA FINAL / SCM & PE / THEORY
78
27. BUSINESS PROCESS RE-ENGINEERING (BPR)
Business Process Re-engineering involves examining business processes and making substantial changes to how organisation currently operates. ABM is a powerful tool for measuring business performance, determining the cost of business output and is used as a means of identifying opportunities to improve process efficiency and effectiveness. A business process consists of linked set of activities.
For example, purchasing of materials might be considered as business process which consist of activities such as receiving a purchase request, identifying supplies, preparing purchase orders, mailing purchase orders and performing follow up. One way the process might be reengineered by sending the production schedule directly to the suppliers and to enter into a contractual agreement to deliver materials according to the production schedule. The end result might be permanent reduction or elimination of some activities like raising a requisition every time if there is a need for materials, identifying potential suppliers each time, waiting for their bid which may result in a delay of the production process and thereby hamper the organisation’s goals.
Benchmarking
Benchmarking is a process of comparing of ABC derived activity costs of one segment of company with those of other segments. It requires uniformity in the definition of activities and measurement of their costs.
Performance Measurement
Many organisations are now focusing on activity performance as a means of facing competitors and managing costs by monitoring the efficiency and effectiveness of activities. Activity performance measures consist of measures relating to costs, time, quality and innovation. For instance, in the current era of globalisation, the overall goal for any company is to produce a quality product at a competitive price. But the quality is not something which one can apply somewhere in the production process or assume will happen automatically. Product quality starts with the correct design. The next stages are high quality raw material inputs, quality processing and work, and proper handling and packaging etc. The various performance measures of quality are:
Area Measures
Quality of Purchased Component Zero Defects
Quality of Output % Yield
Customer Awareness Orders; Number of Complaints

PRIME VISION / CA FINAL / SCM & PE / THEORY
79
28. VALUE CHAIN ANALYSIS
Value-chain analysis is a process by which a firm identifies & analyses various activities that add value to the final product. The idea is to identify those activities which do not add value to the final product/service and eliminate such non-value adding activities. The analysis of value chain helps a firm obtain cost leadership or improve product differentiation. Resources must be deployed in those activities that are capable of producing products valued by customers. The idea of a value chain was first suggested by Michael Porter (1985) to depict how customer value accumulates along a chain of activities that lead to an end product or service. The concepts, tools and techniques of value chain analysis apply to all those organisations which produce and sell a product or provide a service. The various activities undertaken by a firm can be broadly classified into Primary activities and Secondary activities. Primary activities are those which are directly involved in transforming of inputs (Raw Material) into outputs (Finished Products) or in provision of service. Secondary activities (also known as support activities) support the primary activities. Though, secondary activities are not directly involved in creation of product, it doesn't mean that they are of less importance as compared to primary activities.
Primary Activities include: Inbound Logistics: These are activities concerned with receiving, storing, and
distributing the inputs (raw materials) to the production process. The relationship with suppliers is a key component in this process.
Operations: These activities involve transforming inputs into final product. Activities such as machining, packaging, testing and equipment maintenance form part of Operations.
Outbound Logistics: These activities involve collecting, storing and distributing the products from the factory line to end consumers. This may include finished goods warehousing, delivery vehicle operation, order processing and scheduling.
Marketing and Sales: Marketing and Sales provide the means by which the customers are made aware of the product. The activities include advertising, promotion, distribution channel selection, sales force management and pricing policy.
Service: This includes activities related to after sales service like Installation, repair and parts replacement.
Support Activities include: Procurement involves which purchasing of raw material, supplies and other
consumables required as inputs for the primary activities. Technological Development which includes technical knowledge, equipment,
hardware, software & any other knowledge which is used in the transformation of inputs to outputs.
Human Resource Management which includes activities around selection, recruitment, placement, training, appraisal, rewards & promotion; management development; and labour/employee relations.

PRIME VISION / CA FINAL / SCM & PE / THEORY
80
Firm Infrastructure consists of activities such as planning, finance, accounting, legal, government affairs and quality management. A Value Chain gives managers a deeper understanding of what the organisation does and helps them identify key processes of the business. The various processes can be analysed to identify those activities which do not add value to consumers. Such non-value activity can be eliminated to add to the margins of the business as a whole.

PRIME VISION / CA FINAL / SCM & PE / THEORY
81
29. SUPPLY CHAIN MANAGEMENT
A complete chain of serving the customers or consumer whether linked or interdependent is the composition of supply chain. It comprises of vendors that supply raw material, producers who convert the material into products, warehouses that store, distribution centers that deliver to the retailers and retailers who sell the product to the ultimate users. Supply chains encourage value-chains because, without them, no producer has the ability to give customers what they want, when and where they want, at the price they want. Deficiencies in supply chain reduces the ability of the producers to compete with each other. The term supply chain can be referred to as the entire network of organisations working together to design, produce, deliver and service products. In other words all activities associated with the flow and transformation of goods from raw material to end user- is called supply chain. The transformation of product from node to node includes activities such as
Production Planning Purchasing Material Management Distribution Customer Service Forecasting
The Global Supply Chain Forum (GSCF) defines Supply chain management as the “integration of key business processes from end user through original suppliers
that provides products, services, and information that add value for customers and other stakeholders”.
The following eight supply chain management processes are included in the GSCF framework:
Customer Relationship Management, to manage and analyse customer’s interaction and data throughout the life cycle with the main motive of improving business relations.
Supplier Relationship Management, provides the structure for how relationships with suppliers are developed and maintained.
Customer Service Management, provides the key points of contact for administering product and service agreements.
Demand Management, provides the structure for optimising the customer's requirements with supply chain capabilities.
Order Fulfilment, includes all activities necessary to define customer requirements, design the logistics network, and fill customer orders.

PRIME VISION / CA FINAL / SCM & PE / THEORY
82
Types of Supply Chain- Push and Pull
During the traditional chain suppliers were at one end. Suppliers give their products to manufacturer or distributers who further send it to retailers. Although customers are the source of the profits, they are at the end of the chain in the ‘push’ model.
Push Model
Under Push model stocks are produced on the basis of anticipated demand. Demand forecasting can be done via a variety of sophisticated techniques may be from operations research area or data mining.
Supply to Forecast
Production Based on Forecast
Inventory Based on Forecast
Stock Based on Forecast
Purchase What is Available
Pull Model
Under Pull model stocks are produced in response to the actual demand. This new business model is less products centric and more directly focused on the individual consumer – a more marketing - oriented approach.
Customer Orders
Automatically Replenish Stock
Automatically Replenish Warehouse
Produce to Order
Supply to Order
Manufacturing Flow Management, includes all activities necessary to move products through the plants and to obtain, implement and manage manufacturing flexibility in the supply chain.
Product Development and Commercialization, provides the structure for developing and bringing to market new products jointly with customers and suppliers.
Returns Management, includes all activities related to returns, reverse logistics, gatekeeping, and avoidance.
Supplier Manufacturer Distributer Retailer Customer
Supplier Manufacturer Distributer Retailer Customer

PRIME VISION / CA FINAL / SCM & PE / THEORY
83
30. FEEDBACK AND FEED-FORWARD CONTROL
Feedback and Feed-forward are two types of control schemes for systems that react automatically to changing environmental dynamics. Each utilizes sensors to measure important factors and a set of rules to react to changes in those factors. Feedback and Feedforward Controls may coexist in the same system, but the two designs function in very different ways.
Feedback Control
Feedback as the name suggests is a reaction after an action has taken place. So, there has to be an error if we want to take corrective actions.
A feedback system would simply compare the actual historical results with the budgeted results.
Primary
Could be reported to line management in the form of control reports, comparing actual and budgeted results.
If the variances are small or can be corrected easily then the information may not be feedback to anyone higher in the organisation.
Secondary
Where feedback is sent to a higher level in an organisation and can lead to a plan being reviewed and possibly changed.
For example, the revision of a budget after large variances were discovered due to price changes over time.
Negative
Feedback taken to reverse a deviation from standard.
This could be by amending the inputs or process so that the system reverts to a steady state.
For example, a machine may need to be reset over time to its original settings.
Positive
Taken to reinforce a deviation from standard. The inputs or process would not be altered.
Limitations
Feedback control system does have some operational limitations. First, it depends heavily on success of the error detection system. Second, there may be a time lag between the error detection, error confirmation, and error revision during which actual results may change again.
Feed-forward Control
In certain cases, we may be able to measure the amount of error before it has actually taken place. We may thus be able to place a control mechanism before the error takes place. Feed-forward Control is one such Controlling system.
A feed-forward control system operates by comparing budgeted results against a forecast. Control action is triggered by differences between budgeted and forecasted results.

PRIME VISION / CA FINAL / SCM & PE / THEORY
84
Example
Information on Industrial Dispute in a state which was a major supplier of an important raw material would cause smart buyers to buy before prices went up and their own inventory were exhausted (in contrast a pure feedback system would not react until inventory had actually fallen).
Any manager who ignores feed-forward control will contribute to the downfall of a company.
Limitations
Akira Ishiwkawa observed the following limitations of the feed-forward control system:
The feed-forward process is an evaluation process and is concerned with the estimates of uncertain future. This problem of uncertainty is likely to limit application of the concept.
Study of future is not well developed; neither are the tools that have potential for overcoming the problem of uncertainty.

PRIME VISION / CA FINAL / SCM & PE / THEORY
85
31. MICHAEL PORTERS 5 FORCES MODEL
An industry might not yield high profits just because the industry is large or growing.
The five forces suggested by Porter’s play an important role in determining profit potential of the firms in an industry. Michael Porter developed a five factors model as a
way to organise information about an industry structure to evaluate its potential
attractiveness.
Bargaining power of buyers: The bargaining power of buyers generally determines
the ability of buyer to push the price down. This happens when the buyers are
concentrated or when the volume purchased by buyers is very high. In other words,
when the bargaining power of buyers is high, they would be in a position to dictate terms to the firm. A buyer also has higher bargaining power if the cost of switching
suppliers is very low. A higher bargaining power results in lower profitability. Large companies have a high bargaining power when they buy from small suppliers.
Bargaining power of suppliers: The bargaining power of supplier is relatively higher when the input is important to the buying firm or when there are very few suppliers of the input. The suppliers could also dictate terms if the input supplied is not replaceable or when an alternate input is not available. Microsoft dominates the operating system business of computers and laptops and can dictate terms to its buyers as buyers do not
have multiple options to choose from. The profitability of companies can shrink if the
suppliers have a higher bargaining power.
Threat of substitute products or services: When multiple and close substitutes are available in the market for a particular product, customers are likely to switch suppliers easily. A firm in such a case must resort to competitive pricing to retain its
customers. When few substitutes exist for a product, consumers are willing to pay a potentially high price. If close substitutes for a product exist, then there is a limit to what price customers are willing to pay. The problem becomes severe if substitutes are available at much cheaper price (case of launch of Reliance Jio). A company should
strive to build its brand and customer loyalty to thwart the threat of substitutes.
Substitutes could be from within the industry or from a different industry. The paper industry faces threats from e-book market. When more people switch to public transport as trains, the demand for vehicles comes down.
Threat of new entrants: The threat of new entrants largely depends on the barrier to entry and perceived profitability in an industry. If an industry is profitable and the
barriers to entry are low, new firms could enter the industry leading to excess supplies and reduced prices. Some examples of barriers to entry are intensive capital requirement, sophisticated technology, legal factors, limited access to raw material &
labour etc.

PRIME VISION / CA FINAL / SCM & PE / THEORY
86
Industries which require huge amount of capital or sophisticated technical knowhow
might not have a high threat of new firms entering into the industry. Airline industry is
a case where very few new firms enter the business because of the capital
requirements. Another barrier to entry could be legislation which restricts newer firms
to start the business, like in the case of defense industry. Certain industries (for
example medicines) are largely driven by patents and new firms might find it difficult
to enter the industry. An industry where threat of new entrants is low is more
profitable than an industry where new entrants can easily enter the industry.
Intensity of competition/ rivalry amongst firms: Some markets are more competitive than others. In highly competitive industries, firms resort to cut-throat competition to win more customers. The competitive rivalry is higher when an industry has high number of firms and is lower when there are few large players dominating the market. The intensity of competition is higher:
▪ When firms are of more or less equal size.
▪ Extra capacity exists in the industry
▪ Difficulty in differentiation in the products.
▪ High exit barriers - This is a case where the exit costs are high and hence firms must continue in the industry despite excess capacity at industry level.
▪ Higher fixed costs - Firms would want to produce as much as possible to keep the unit costs low leading to surplus capacity.
Since these five forces are ever-changing, Porter’s framework needs to be employed as a dynamic analytical tool. This is because competition is a dynamic process; equilibrium is never reached and industry structures are constantly being reformed. The five forces analysis helps a firm to better understand the industry value chain and its competitive environment.
Related Documents