1 Corporate Governance and the Returns to Acquiring Firms’ Shareholders: An International Comparison Dennis C. Mueller and B. Burcin Yurtoglu University of Vienna

1 Corporate Governance and the Returns to Acquiring Firms’ Shareholders: An International Comparison Dennis C. Mueller and B. Burcin Yurtoglu University.
Jan 01, 2016
Welcome message from author
This document is posted to help you gain knowledge. Please leave a comment to let me know what you think about it! Share it to your friends and learn new things together.
Transcript

1
Corporate Governance and the Returns to Acquiring Firms’
Shareholders: An International Comparison
Dennis C. Mueller and B. Burcin Yurtoglu
University of Vienna

2
Motivation
• Corporate governance systems that better align shareholders’ and managers’ interests lead to higher dividend payouts and higher returns on investment.
• Strong shareholder protection leads to larger external capital markets, which in turn have been found to be associated with higher rates of economic growth.
• Thus, it appears that shareholders and the rest of society may both benefit from strong corporate governance institutions.
3
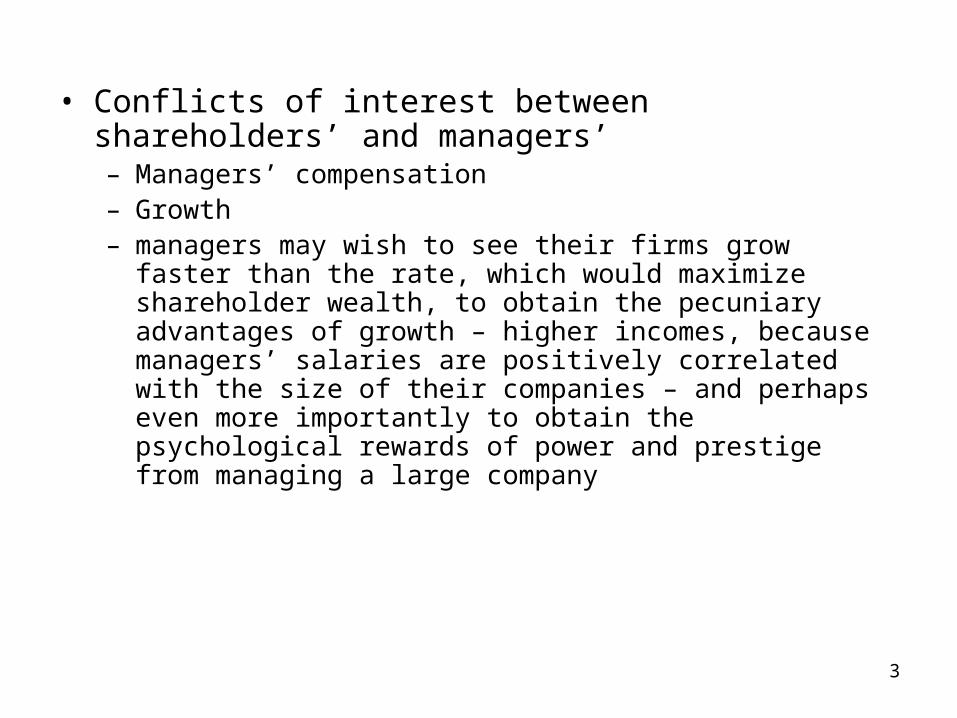
• Conflicts of interest between shareholders’ and managers’– Managers’ compensation– Growth– managers may wish to see their firms grow faster than the rate,
which would maximize shareholder wealth, to obtain the pecuniary advantages of growth – higher incomes, because managers’ salaries are positively correlated with the size of their companies – and perhaps even more importantly to obtain the psychological rewards of power and prestige from managing a large company

4
• countries with civil law systems have returns on investment significantly below their costs of capital, while companies in countries with common law systems have returns on investment roughly equal to their costs of capital (Gugler, Mueller and Yurtoglu, 2003, 2004).
• These findings are consistent with the claim of LLSV (1997) that Anglo-Saxon legal systems better align manager and shareholder interests than civil law systems, and further that managers in civil law system countries harm their shareholders in part by over investing.
• Mergers are the fastest way to grow, and thus are particularly likely to be attractive for growth-maximizing managers with limited time horizons in their companies.

5
• Gugler, Mueller and Yurtoglu (2003, 2004) use a broad definition of investment, which includes mergers as well as capital equipment purchases, R&D and advertising.
• Because of the special attraction mergers should hold for growth-orientated managers, we test in this paper to see whether the same differences in investment performance between Anglo-Saxon and civil-law countries are
observed when one concentrates just on mergers.

6
• The stylized facts about mergers (largely Anglo-Saxon countries)
– they benefit shareholders of the acquired companies, because of the premia paid for their shares;
– they do not benefit the acquiring companies’ shareholders, if one measures gains over short time intervals (windows) around the merger announcements;
– and that over long windows following the mergers the returns to acquirers’ shareholders are often significantly negative.
– These findings are consistent with their being agency problems even in Anglo-Saxon countries, and that managers of the acquiring firms are not maximizing their shareholders’ wealth.

7
The empirical evidence is overwhelming
• Mandelker (1974), Langetieg (1978), Firth (1980), Asquith (1983), Malatesta (1983), Varaiya and Ferris (1987), Bradley, Desai and Kim (1988), Magenheim and Mueller (1988), Franks and Harris (1989), Lang, Stultz and Walking (1989),Bhagat, Shleifer and Vishny (1990), Franks, Harris and Titman (1991), Agrawal, Jaffe and Mandelker (1992),Kang (1993), Berkovitch and Narayanan (1993), Houston and Ryngaert (1994), Leeth and Borg (1994), Smith and Kim (1994), Doukas (1995), Hubbard and Palia (1995), Gregory (1997), Higson and Elliott (1998), Maquieira, Megginson and Nail (1998), Bhagat, Dong, Hirshleifer and Noah (2005), Becher (2000), Eckbo and Thorborn (2000), Andrade, Mitchell and Stafford (2001), and Conn, Cosh, Guest and Hughes (2005), Moeller, Schlingemann, and Stulz (2005).

8
„Overvaluation“ and Mergers
• Shleifer and Vishny (2003)– a theory about the causes of mergers that provides an
alternative explanation for why acquirers’ shareholders appear to lose from the mergers
– They assume that the shares of some companies become overvalued at some points in time, and that acquirers’ managers maximize their shareholders’ wealth by trading their overvalued shares for the real assets of target companies.
– The post-merger declines in acquirers’ share prices are assumed to be a market correction of the initial overvaluation, and not to be caused by the mergers.
– To judge whether mergers on average increase wealth or destroy it, it is necessary to determine whether the post-merger losses experienced by acquirers’ shareholders are caused by the mergers or by the acquirers’ overvaluation at the time of the acquisitions.
• One of the contributions of this article is to disentangle these two possible causes of losses to acquirers.

9
• Mergers that are due to agency problems or overvaluation do not create wealth and are likely to destroy it, if there are transactions costs in combining the merging companies.
• On the other hand, some mergers do increase shareholder wealth by increasing the efficiency or market power of the merging companies. (Even a growth-maximizing manager would not pass up an opportunity to undertake a profitable merger, since she could always use these profits to pursue still more growth.)
• Thus, we expect that some mergers in all countries are profitable, while others do not. We expect the shareholders of both the acquiring and acquired companies to gain from profitable mergers.
• One of the contributions of this article is to employ a methodology, which allows us to test several of the leading hypotheses about the causes of mergers and to determine the fractions of mergers in each country sample that are wealth creating.

10
Our findings in a nutshell(1)Some mergers fit the traditional hypotheses that
mergers increase efficiency or market power, while others fit the behavioral hypotheses that assume agency problems or overvaluation.
(2)The fractions of mergers that fit the behavioral hypotheses increases as one extends the window for measuring the gains to acquirers, and thus it is important for obtaining a true picture of the causes and effects of mergers that one measure acquirers’ gains over long, post-merger windows.
(3)It is also important to adjust for any overvaluation of acquirers at the time of the mergers to determine whether they are wealth-creating.
(4)After adjustments for overvaluation, mergers in Anglo-Saxon countries turn out to be wealth-creating, while mergers in continental European countries are wealth-destroying.

11
Theory• Two broad categories of hypotheses about the causes of mergers:
neoclassical and behavioral theories.
• The neoclassical theories make three assumptions– managers maximize their shareholders’ wealth,– consequently mergers increase shareholder wealth,– the capital market is efficient.
• The third assumption implies that the effects of mergers on shareholder wealth can be measured over short windows around merger announcements.
• The capital market evaluates the likely effects of the mergers on future profits when they are announced, and all wealth changes are thus unbiasedly reflected in the share price changes accompanying the announcements.
• The returns to acquirers over longer windows should be normal. (Since the targets disappear, one cannot measure returns to them over long windows.)
12
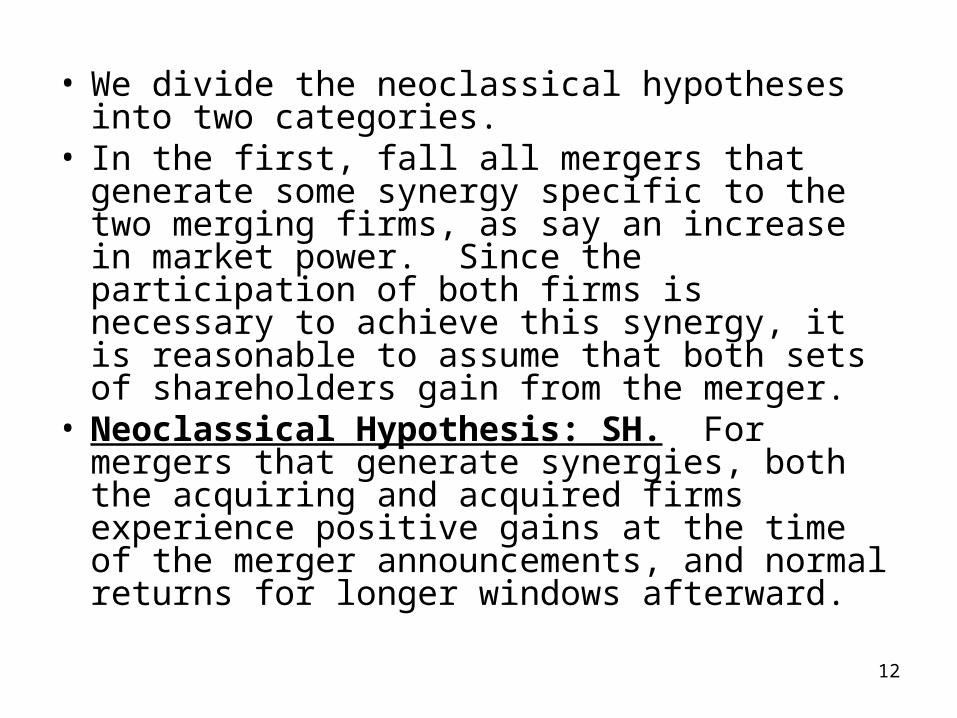
• We divide the neoclassical hypotheses into two categories.
• In the first, fall all mergers that generate some synergy specific to the two merging firms, as say an increase in market power. Since the participation of both firms is necessary to achieve this synergy, it is reasonable to assume that both sets of shareholders gain from the merger.
• Neoclassical Hypothesis: SH. For mergers that generate synergies, both the acquiring and acquired firms experience positive gains at the time of the merger announcements, and normal returns for longer windows afterward.
13
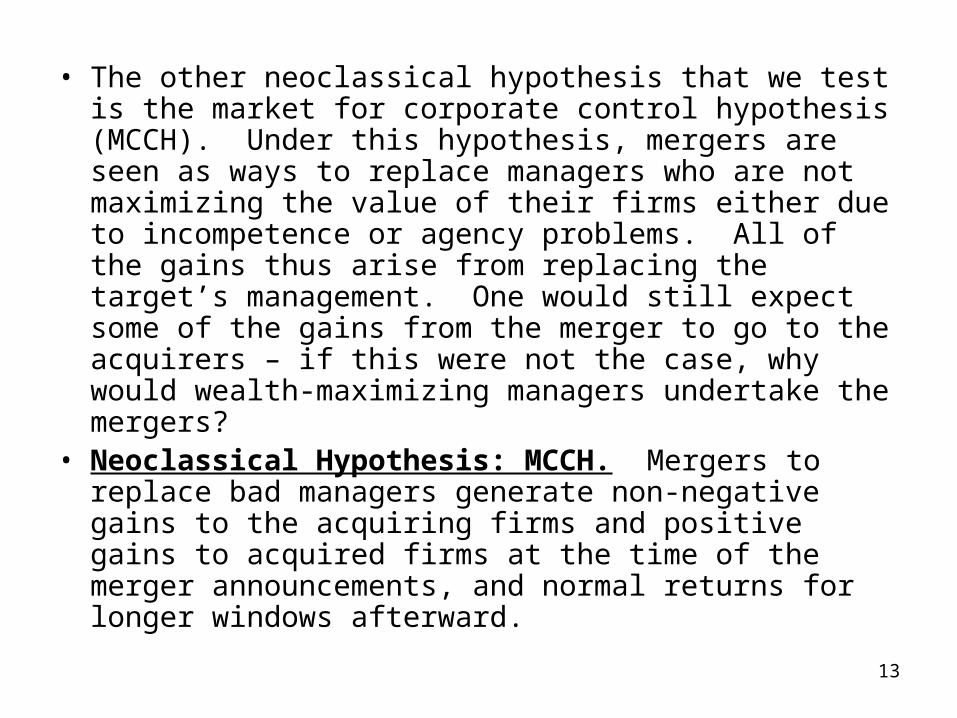
• The other neoclassical hypothesis that we test is the market for corporate control hypothesis (MCCH). Under this hypothesis, mergers are seen as ways to replace managers who are not maximizing the value of their firms either due to incompetence or agency problems. All of the gains thus arise from replacing the target’s management. One would still expect some of the gains from the merger to go to the acquirers – if this were not the case, why would wealth-maximizing managers undertake the mergers?
• Neoclassical Hypothesis: MCCH. Mergers to replace bad managers generate non-negative gains to the acquiring firms and positive gains to acquired firms at the time of the merger announcements, and normal returns for longer windows afterward.

14
• The behavioral hypotheses relax one or more of the assumptions underlying the neoclassical hypotheses.
• The managerial discretion hypothesis (MDH) – relaxes all three.
• Growth maximization, threat of takeover as a constraint, the role of share prices, market optimism
• Behavioral Hypothesis: MDH. Acquiring companies’ shareholders experience large negative abnormal returns over long time windows after the mergers, but not when the mergers are announced.
15
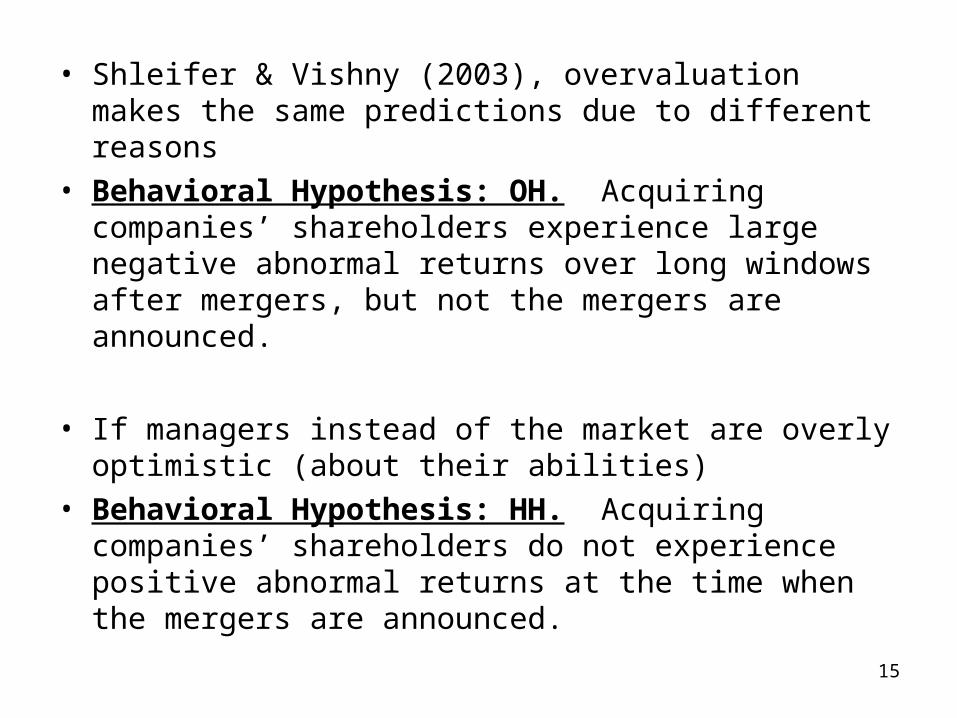
• Shleifer & Vishny (2003), overvaluation makes the same predictions due to different reasons
• Behavioral Hypothesis: OH. Acquiring companies’ shareholders experience large negative abnormal returns over long windows after mergers, but not the mergers are announced.
• If managers instead of the market are overly optimistic (about their abilities)
• Behavioral Hypothesis: HH. Acquiring companies’ shareholders do not experience positive abnormal returns at the time when the mergers are announced.

16
Data and Methodology
• sample period: 1981-2002• Global Mergers and Acquisitions database from
Thompson Financial Securities• Compustat and Compustat Global databases of
Standard and Poors’• Datastream
17
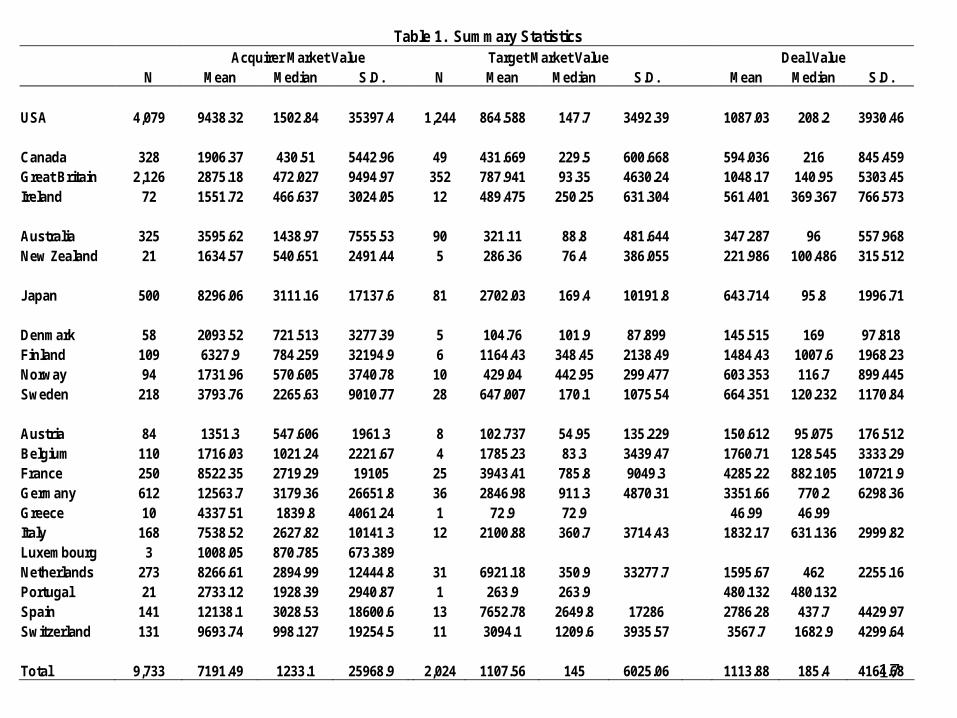
Table 1. Summary Statistics Acquirer Market Value Target Market Value Deal Value N Mean Median S.D. N Mean Median S.D. Mean Median S.D. USA 4,079 9438.32 1502.84 35397.4 1,244 864.588 147.7 3492.39 1087.03 208.2 3930.46 Canada 328 1906.37 430.51 5442.96 49 431.669 229.5 600.668 594.036 216 845.459 Great Britain 2,126 2875.18 472.027 9494.97 352 787.941 93.35 4630.24 1048.17 140.95 5303.45 Ireland 72 1551.72 466.637 3024.05 12 489.475 250.25 631.304 561.401 369.367 766.573 Australia 325 3595.62 1438.97 7555.53 90 321.11 88.8 481.644 347.287 96 557.968 New Zealand 21 1634.57 540.651 2491.44 5 286.36 76.4 386.055 221.986 100.486 315.512 Japan 500 8296.06 3111.16 17137.6 81 2702.03 169.4 10191.8 643.714 95.8 1996.71 Denmark 58 2093.52 721.513 3277.39 5 104.76 101.9 87.899 145.515 169 97.818 Finland 109 6327.9 784.259 32194.9 6 1164.43 348.45 2138.49 1484.43 1007.6 1968.23 Norway 94 1731.96 570.605 3740.78 10 429.04 442.95 299.477 603.353 116.7 899.445 Sweden 218 3793.76 2265.63 9010.77 28 647.007 170.1 1075.54 664.351 120.232 1170.84 Austria 84 1351.3 547.606 1961.3 8 102.737 54.95 135.229 150.612 95.075 176.512 Belgium 110 1716.03 1021.24 2221.67 4 1785.23 83.3 3439.47 1760.71 128.545 3333.29 France 250 8522.35 2719.29 19105 25 3943.41 785.8 9049.3 4285.22 882.105 10721.9 Germany 612 12563.7 3179.36 26651.8 36 2846.98 911.3 4870.31 3351.66 770.2 6298.36 Greece 10 4337.51 1839.8 4061.24 1 72.9 72.9 46.99 46.99 Italy 168 7538.52 2627.82 10141.3 12 2100.88 360.7 3714.43 1832.17 631.136 2999.82 Luxembourg 3 1008.05 870.785 673.389 Netherlands 273 8266.61 2894.99 12444.8 31 6921.18 350.9 33277.7 1595.67 462 2255.16 Portugal 21 2733.12 1928.39 2940.87 1 263.9 263.9 480.132 480.132 Spain 141 12138.1 3028.53 18600.6 13 7652.78 2649.8 17286 2786.28 437.7 4429.97 Switzerland 131 9693.74 998.127 19254.5 11 3094.1 1209.6 3935.57 3567.7 1682.9 4299.64 Total 9,733 7191.49 1233.1 25968.9 2,024 1107.56 145 6025.06 1113.88 185.4 4164.68
18
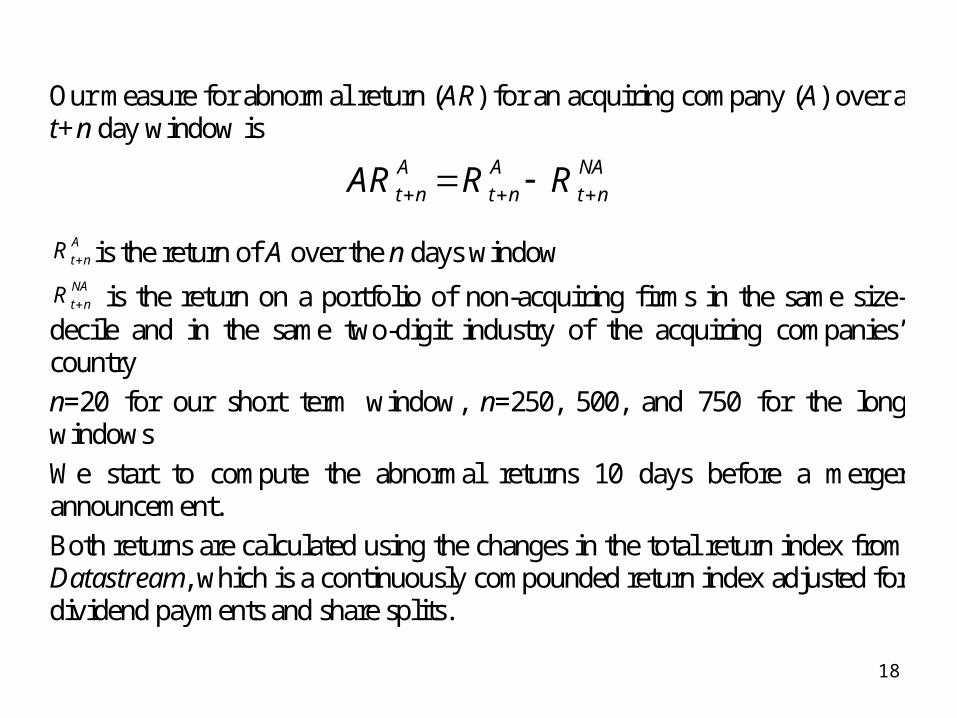
Our measure for abnormal return (AR) for an acquiring company (A) over a t+n day window is
A A NA
t n t n t nAR R R
A
t nR is the return of A over the n days window NA
t nR is the return on a portfolio of non-acquiring firms in the same size-decile and in the same two-digit industry of the acquiring companies’ country
n=20 for our short term window, n=250, 500, and 750 for the long windows
We start to compute the abnormal returns 10 days before a merger announcement.
Both returns are calculated using the changes in the total return index from Datastream, which is a continuously compounded return index adjusted for dividend payments and share splits.

19
Table 2. Abnormal Returns to Acquiring Companies’ Shareholders Window -10 +10 10 +250 10 +500 -10 +750 N M% M N M% M N M% M N M% M USA 4,079 0.006 155.8 3,855 -0.021 -365.4 3,604 -0.085 -1380.5 3,388 -0.183 -745.8 Australia 325 0.005 -17.9 288 -0.003 -162.3 261 -0.078 -395.7 231 -0.121 -268.7 Canada 328 0.013 45.5 301 -0.029 25.3 273 -0.143 -55.1 256 -0.274 -293.7 Great Britain 2,126 0.01 3.6 1,822 -0.023 -88.9 1,722 -0.083 -59.3 1,569 -0.151 -14.9 Ireland 72 0.011 70.2 60 -0.026 81.6 55 -0.155 -105.6 46 -0.262 142.1 New Zealand 21 0.012 -31.3 17 0.051 -59.7 13 -0.026 -187.6 13 -0.1 -621.8 Anglo-Saxon 2,872 0.01 7.543 2,488 -0.021 -79.257 2,324 -0.091 -98.38 2,115 -0.164 -76.698 Japan 500 0.002 52.9 428 0.014 90.7 388 0.025 105.8 310 -0.01 725.0 Denmark 58 -0.017 0.3 47 -0.045 -392.0 43 -0.125 -562.4 37 -0.106 -357.7 Finland 109 0.012 123.8 78 0.034 12.0 61 -0.017 188.1 51 -0.157 -296.5 Norway 94 0.009 -17.8 84 -0.041 -18.8 72 -0.084 -39.9 65 -0.14 -216.1 Sweden 218 0.009 -1.0 180 0.007 -233.1 163 0.008 -233.0 134 -0.161 -347.0 Scandinavia 479 0.006 25.282 389 -0.004 -156.857 339 -0.033 -157.987 287 -0.148 -309.773 Austria 84 0.003 12.9 65 -0.061 -126.6 60 -0.055 35.5 50 -0.109 296.6 Belgium 110 0.008 0.3 87 0.014 -19.9 90 -0.105 -219.5 84 -0.24 -367.4 France 250 0.003 128.3 222 -0.014 -713.2 208 -0.072 -1455.1 178 -0.166 -808.4 Germany 612 0.001 84.4 524 -0.061 -345.7 504 -0.156 -815.7 421 -0.241 -494.7 Greece 10 -0.009 -90.5 6 -0.037 224.1 5 -0.099 57.9 4 0.013 246.4 Italy 168 -0.004 -44.9 146 -0.053 -547.2 139 -0.077 -481.7 116 -0.114 -265.6 Luxembourg 3 0.021 27.0 3 -0.134 -88.9 3 -0.519 -495.0 3 -0.456 -518.9 Netherlands 273 0 72.0 233 -0.029 -796.2 214 -0.102 -2009.5 173 -0.142 -1847.9 Portugal 21 -0.006 -83.2 12 0.055 13.2 13 0.008 -81.2 10 -0.144 -1001.4 Spain 141 0.009 59.1 127 -0.032 -786.9 116 -0.037 -780.6 85 -0.103 -77.2 Switzerland 131 0 -78.7 102 -0.122 -1146.6 100 -0.251 -2791.7 86 -0.353 -3887.7 Continental Europe 1,803 0.002 52.561 1,527 -0.045 -543.881 1,452 -0.117 -1102.187 1,210 -0.195 -884.44 Total 9,733 0.006 83.194 8,687 -0.023 -283.021 8,107 -0.085 -840.871 7,310 -0.171 -496.00
20
Short window
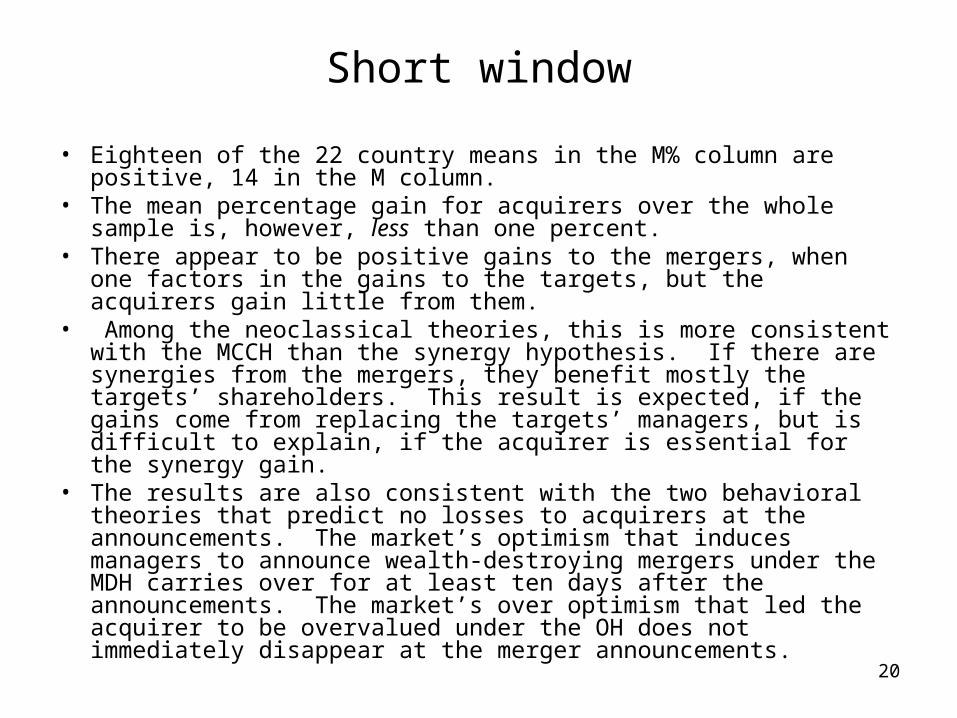
• Eighteen of the 22 country means in the M% column are positive, 14 in the M column.
• The mean percentage gain for acquirers over the whole sample is, however, less than one percent.
• There appear to be positive gains to the mergers, when one factors in the gains to the targets, but the acquirers gain little from them.
• Among the neoclassical theories, this is more consistent with the MCCH than the synergy hypothesis. If there are synergies from the mergers, they benefit mostly the targets’ shareholders. This result is expected, if the gains come from replacing the targets’ managers, but is difficult to explain, if the acquirer is essential for the synergy gain.
• The results are also consistent with the two behavioral theories that predict no losses to acquirers at the announcements. The market’s optimism that induces managers to announce wealth-destroying mergers under the MDH carries over for at least ten days after the announcements. The market’s over optimism that led the acquirer to be overvalued under the OH does not immediately disappear at the merger announcements.

21
Longer windows
• The total losses for the three year windows:– USA, $2.5 trillion– Other Anglo-Saxon countries, $1.6 trillion– Scandinavia, $66.6 billion– Continental Europe, $1.1 trillion– The aggregate loss for the full sample is pulled up by the
positive results for Japan, but nevertheless totals $3.6 trillion.
• inconsistent with both neoclassical theories and the hubris hypothesis.
• Consistent with the managerial discretion and overvaluation hypotheses.
• Since both OH and MDH make the same predictions over longer windows, we need additional tests to discriminate between them.
22
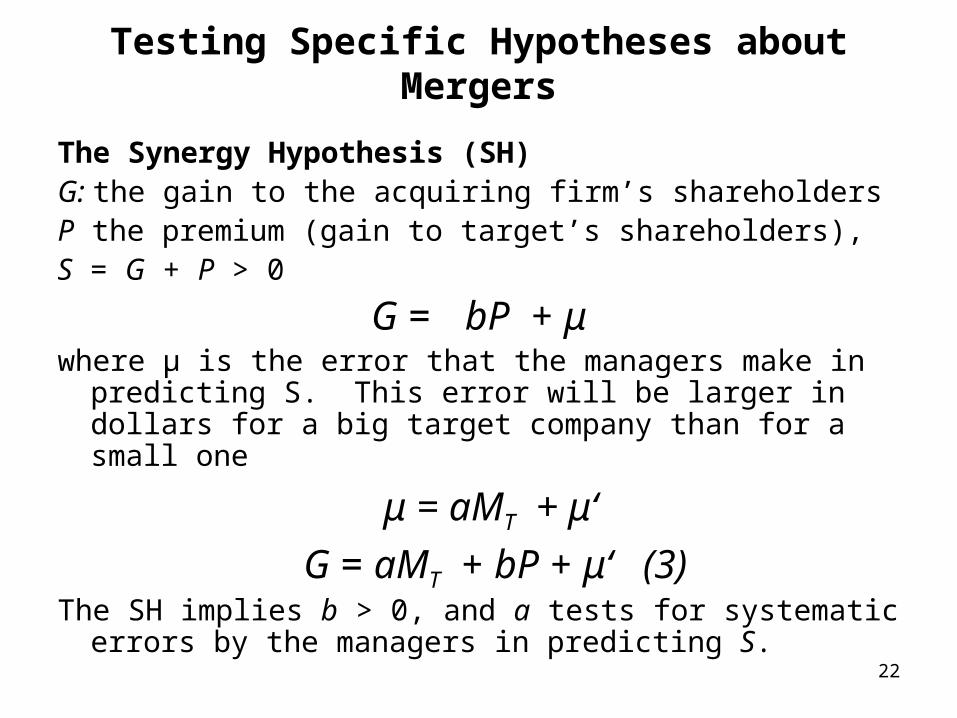
Testing Specific Hypotheses about Mergers
The Synergy Hypothesis (SH) G: the gain to the acquiring firm’s shareholdersP the premium (gain to target’s shareholders),S = G + P > 0
G = bP + μwhere μ is the error that the managers make in predicting
S. This error will be larger in dollars for a big target company than for a small one
μ = aMT + μ‘
G = aMT + bP + μ‘ (3)The SH implies b > 0, and a tests for systematic errors by
the managers in predicting S.
23
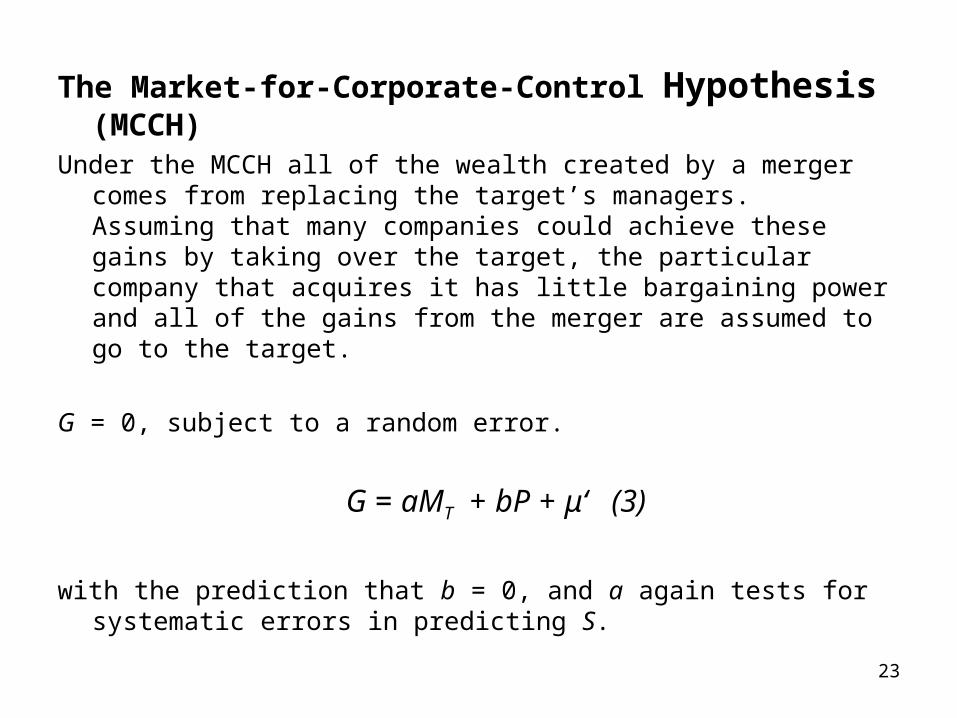
The Market-for-Corporate-Control Hypothesis (MCCH)
Under the MCCH all of the wealth created by a merger comes from replacing the target’s managers. Assuming that many companies could achieve these gains by taking over the target, the particular company that acquires it has little bargaining power and all of the gains from the merger are assumed to go to the target.
G = 0, subject to a random error.
G = aMT + bP + μ‘ (3)
with the prediction that b = 0, and a again tests for systematic errors in predicting S.
24
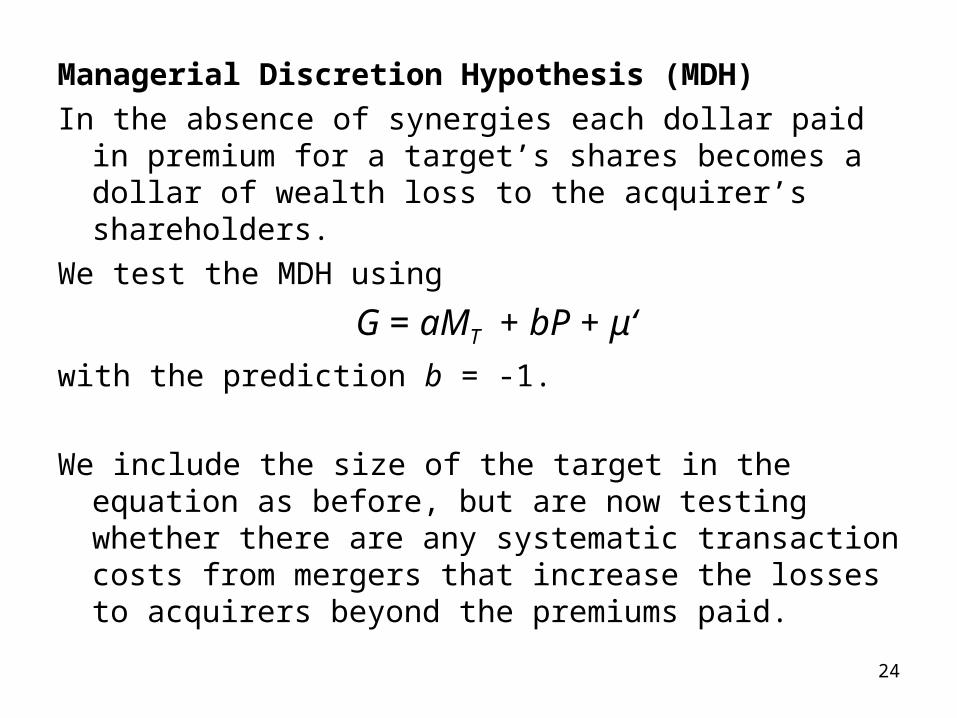
Managerial Discretion Hypothesis (MDH)
In the absence of synergies each dollar paid in premium for a target’s shares becomes a dollar of wealth loss to the acquirer’s shareholders.
We test the MDH using
G = aMT + bP + μ‘
with the prediction b = -1.
We include the size of the target in the equation as before, but are now testing whether there are any systematic transaction costs from mergers that increase the losses to acquirers beyond the premiums paid.
25
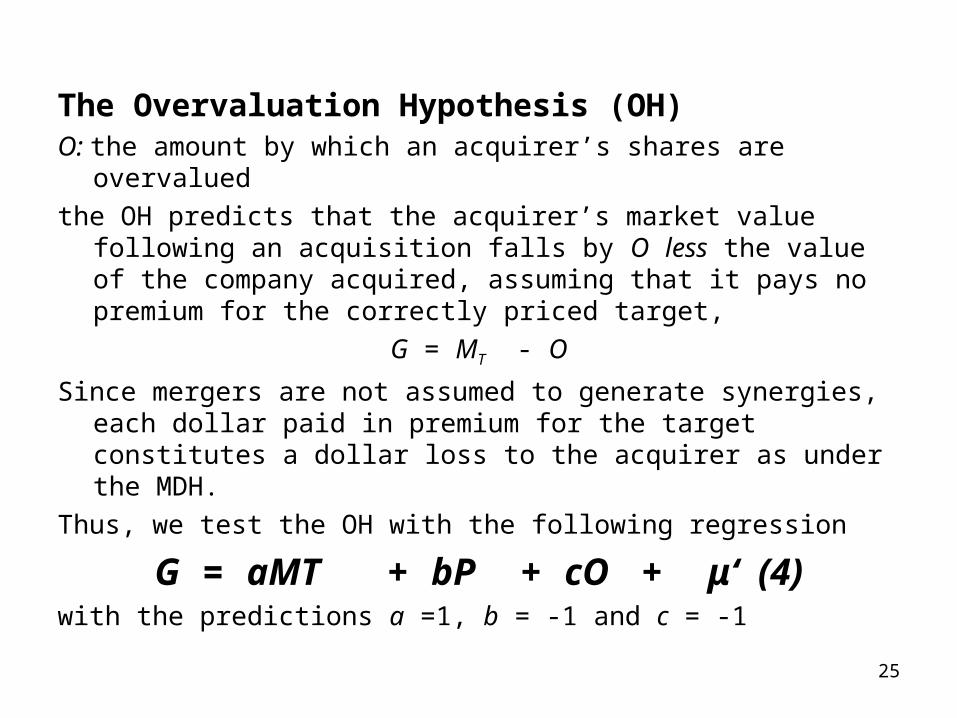
The Overvaluation Hypothesis (OH)O: the amount by which an acquirer’s shares are overvalued
the OH predicts that the acquirer’s market value following an acquisition falls by O less the value of the company acquired, assuming that it pays no premium for the correctly priced target,
G = MT - O
Since mergers are not assumed to generate synergies, each dollar paid in premium for the target constitutes a dollar loss to the acquirer as under the MDH.
Thus, we test the OH with the following regression
G = aMT + bP + cO + μ‘ (4)with the predictions a =1, b = -1 and c = -1
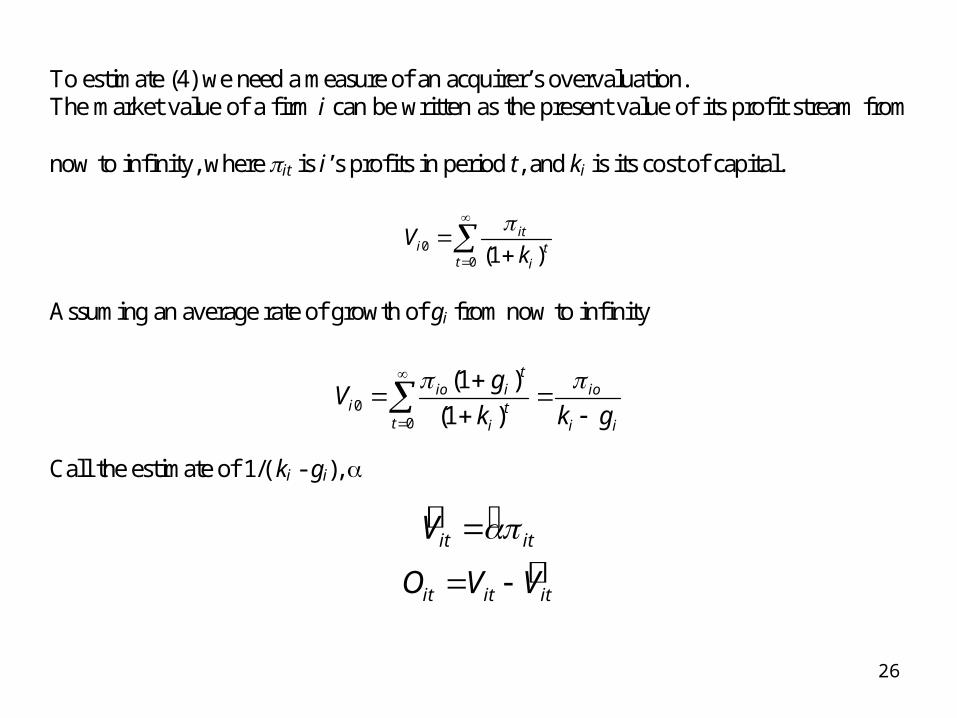
26
To estimate (4) we need a measure of an acquirer’s overvaluation. The market value of a firm i can be written as the present value of its profit stream from
now to infinity, where it is i’s profits in period t, and ki is its cost of capital.
00 (1 )
iti t
t i
Vk
Assuming an average rate of growth of gi from now to infinity
00
(1 )
(1 )
tio i io
i tt i i i
gV
k k g
Call the estimate of 1/( ki - gi),
it itV
it it itO V V
27
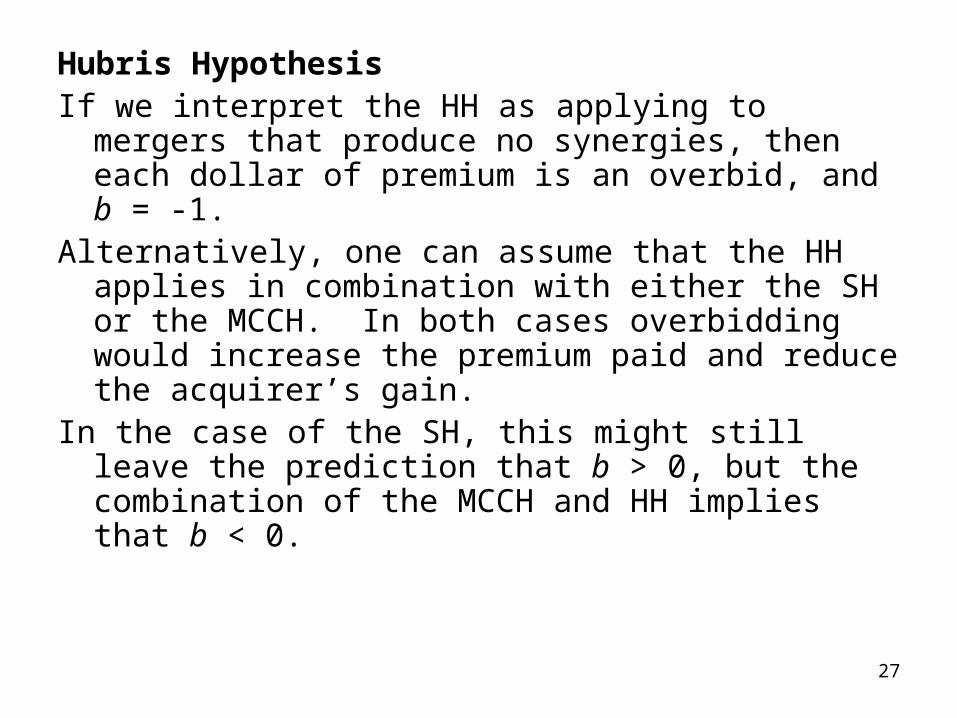
Hubris Hypothesis If we interpret the HH as applying to mergers that produce
no synergies, then each dollar of premium is an overbid, and b = -1.
Alternatively, one can assume that the HH applies in combination with either the SH or the MCCH. In both cases overbidding would increase the premium paid and reduce the acquirer’s gain.
In the case of the SH, this might still leave the prediction that b > 0, but the combination of the MCCH and HH implies that b < 0.
28
Results of the Tests • The synergy hypothesis assumes that mergers create
wealth and that the two firms share this increase in wealth. It is obviously falsified when the acquiring companies’ shareholders suffer losses.
• Similarly, the MDH and OH are falsified if the acquirers experience positive returns over long, post-merger windows.
• Since some mergers fall into each category, no single hypothesis can be consistent with all observations.
• We thus report separate estimates for mergers with positive gains to acquirers and with negative gains. We report only the results for equation (4), since the other hypotheses are nested within this equation.
29
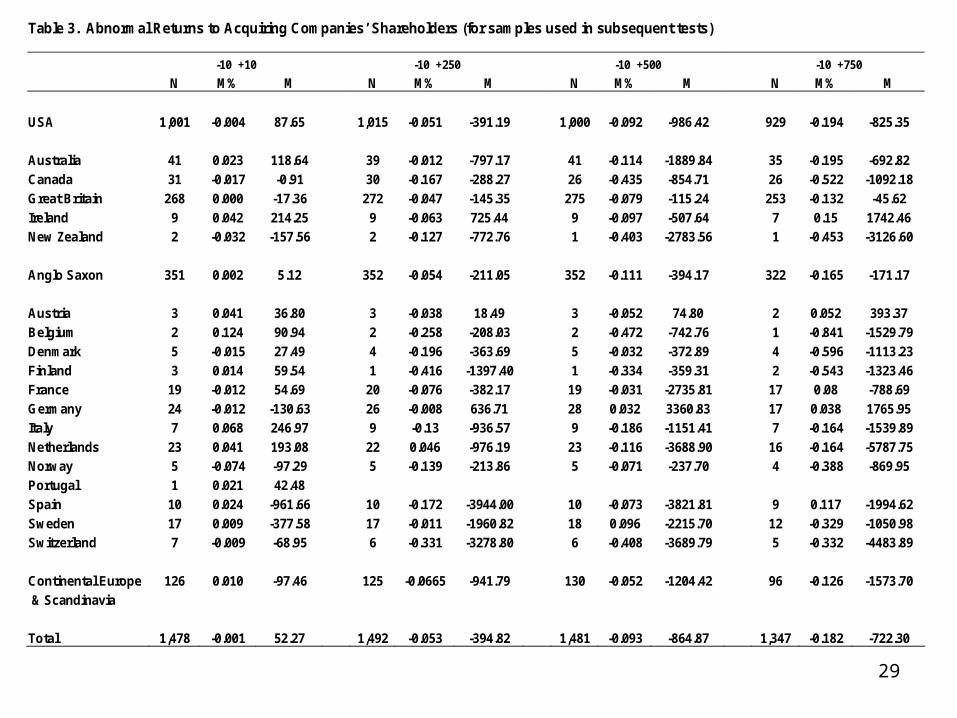
Table 3. Abnormal Returns to Acquiring Companies’ Shareholders (for samples used in subsequent tests)
-10 +10 -10 +250 -10 +500 -10 +750
N M% M N M% M N M% M N M% M
USA 1,001 -0.004 87.65 1,015 -0.051 -391.19 1,000 -0.092 -986.42 929 -0.194 -825.35
Australia 41 0.023 118.64 39 -0.012 -797.17 41 -0.114 -1889.84 35 -0.195 -692.82
Canada 31 -0.017 -0.91 30 -0.167 -288.27 26 -0.435 -854.71 26 -0.522 -1092.18
Great Britain 268 0.000 -17.36 272 -0.047 -145.35 275 -0.079 -115.24 253 -0.132 -45.62
Ireland 9 0.042 214.25 9 -0.063 725.44 9 -0.097 -507.64 7 0.15 1742.46
New Zealand 2 -0.032 -157.56 2 -0.127 -772.76 1 -0.403 -2783.56 1 -0.453 -3126.60
Anglo Saxon 351 0.002 5.12 352 -0.054 -211.05 352 -0.111 -394.17 322 -0.165 -171.17
Austria 3 0.041 36.80 3 -0.038 18.49 3 -0.052 74.80 2 0.052 393.37
Belgium 2 0.124 90.94 2 -0.258 -208.03 2 -0.472 -742.76 1 -0.841 -1529.79
Denmark 5 -0.015 27.49 4 -0.196 -363.69 5 -0.032 -372.89 4 -0.596 -1113.23
Finland 3 0.014 59.54 1 -0.416 -1397.40 1 -0.334 -359.31 2 -0.543 -1323.46
France 19 -0.012 54.69 20 -0.076 -382.17 19 -0.031 -2735.81 17 0.08 -788.69
Germany 24 -0.012 -130.63 26 -0.008 636.71 28 0.032 3360.83 17 0.038 1765.95
Italy 7 0.068 246.97 9 -0.13 -936.57 9 -0.186 -1151.41 7 -0.164 -1539.89
Netherlands 23 0.041 193.08 22 0.046 -976.19 23 -0.116 -3688.90 16 -0.164 -5787.75
Norway 5 -0.074 -97.29 5 -0.139 -213.86 5 -0.071 -237.70 4 -0.388 -869.95
Portugal 1 0.021 42.48
Spain 10 0.024 -961.66 10 -0.172 -3944.00 10 -0.073 -3821.81 9 0.117 -1994.62
Sweden 17 0.009 -377.58 17 -0.011 -1960.82 18 0.096 -2215.70 12 -0.329 -1050.98
Switzerland 7 -0.009 -68.95 6 -0.331 -3278.80 6 -0.408 -3689.79 5 -0.332 -4483.89
Continental Europe 126 0.010 -97.46 125 -0.0665 -941.79 130 -0.052 -1204.42 96 -0.126 -1573.70
& Scandinavia
Total 1,478 -0.001 52.27 1,492 -0.053 -394.82 1,481 -0.093 -864.87 1,347 -0.182 -722.30

30
Table 4b: Means of Variables, USA (For samples used in the -10, +750 window)
Variable Full Sample G>0 G<0
Market Value (Acquirer)
9169.30 11407.08 7822.77
G -825.35 4387.94 -3962.32 P 330.77 382.08 299.90 MT 855.98 980.87 780.83 O 5227.19 6652.79 4369.38

31
Table 4a Explaining the Gains to Acquirers, USA
The dependent variable in all regressions is the gain to the acquiring firm (G). MT is the target market value, P is the premium, O is the measure for overvaluation (see eqs. 5-8). Heteroscedasticity consistent t-values are reported under the coefficients in parentheses.
Window Gain MT P O N 2R
-10,+10 >0 -0.043 -0.064 0.095 463 0.62 (1.65) (1.23) (27.52)
-10,+250 >0 -0.158 0.061 0.434 437 0.79 (2.44) (0.57) (40.32)
-10,+500 >0 -0.234 -0.056 0.334 413 0.57 (3.59) (0.49) (22.97)
-10,+750 >0 -0.579 1.754 0.415 349 0.52 (3.26) (2.78) (17.16)
-10,+10 <0 0.032 0.012 -0.117 538 0.76 (1.69) (0.43) (40.35)
-10,+250 <0 0.271 0.314 -0.429 578 0.81 (3.81) (2.37) (48.24)
-10,+500 <0 -0.267 -0.447 -0.345 587 0.72 (2.70) (2.03) (37.29)
-10,+750 <0 -0.718 0.128 -0.458 580 0.66 (5.18) (0.49) (31.65)

32
Interpretation
• mergers with positive abnormal returns to acquirers– The coefficients on O positive and increasing over time: managerial
talent
– Only one of the coefficients on P is positive: weak support for SH but consistent with MCCH
– All of the coefficients on MT are negative: managers of successful mergers systematically overestimate the synergies from the mergers.
• mergers with negative abnormal returns to acquirers– The coefficients on O negative: consistent with OH, correction of
overvaluation by about 46% in year t+3
– Only one of the coefficients on P is negative: mixed results for OH, SH, and MCCH
– Coefficients on MT are negative but less than 1: the acquisitions of overvalued US companies do not seem to have protected them from subsequent declines in their shares prices as the market corrected its errors.

33
• A feel for the orders of magnitude implied by the estimates:
• Assume that an acquirer with a mean market value ($7,823 million) acquired a company with the mean market value of a target ($781 million), that it paid the mean premium ($299 million), and that the acquirer was at the time of the acquisition overvalued by the mean value ($4,369 million).
• T+3 year results imply:– an expected loss to the acquirers’ shareholders of $560.6 million
due to the costs of integrating the two companies,– $2,001 million due to the acquirer’s being overvalued– a combined loss of $2,561.6 million (33% of the acquirer’s
market value when it undertook the merger with about a fifth of this loss due to the merger)

34
Table 5b Means of Variables, Non-US Anglo-Saxon Countries (For samples used in the -10, +750 window)
Variable Full Sample G>0 G<0
Market Value (Acquirer)
3596.79 4856.34 2858.44
G -171.16 1870.06 -1367.74
P 213.39 324.64 148.18
MT 523.00 807.63 356.15
O 1525.85 2117.34 1179.11

35
Table 5a Explaining the Gains to Acquirers, Non-US Anglo-Saxon Countries
The dependent variable in all regressions is the gain to the acquiring firm (G). MT is the target market value, P is the premium, O is the measure for overvaluation (see eqs. 5-8). Heteroscedasticity consistent t-values are reported under the coefficients in parentheses.
Window Gain MT P O N 2R
-10,+10 >0 0.071 -0.063 0.072 163 0.70 (4.48) (1.10) (12.07)
-10,+250 >0 0.303 1.729 -0.146 137 0.81 (15.30) (10.33) (9.81)
-10,+500 >0 0.185 2.312 -0.013 132 0.83 (7.03) (10.15) (0.70)
-10,+750 >0 0.797 0.666 0.1655 119 0.85 (6.75) (1.32) (5.56)
-10,+10 <0 0.003 -0.149 -0.011 188 0.42 (0.70) (4.41) (3.40)
-10,+250 <0 -0.414 -0.185 -0.304 215 0.74 (3.39) (1.22) (18.52)
-10,+500 <0 -0.753 0.586 -0.597 220 0.77 (4.47) (2.55) (22.12)
-10,+750 <0 -0.481 0.334 -0.726 203 0.56 (2.20) (1.06) (13.46)
36
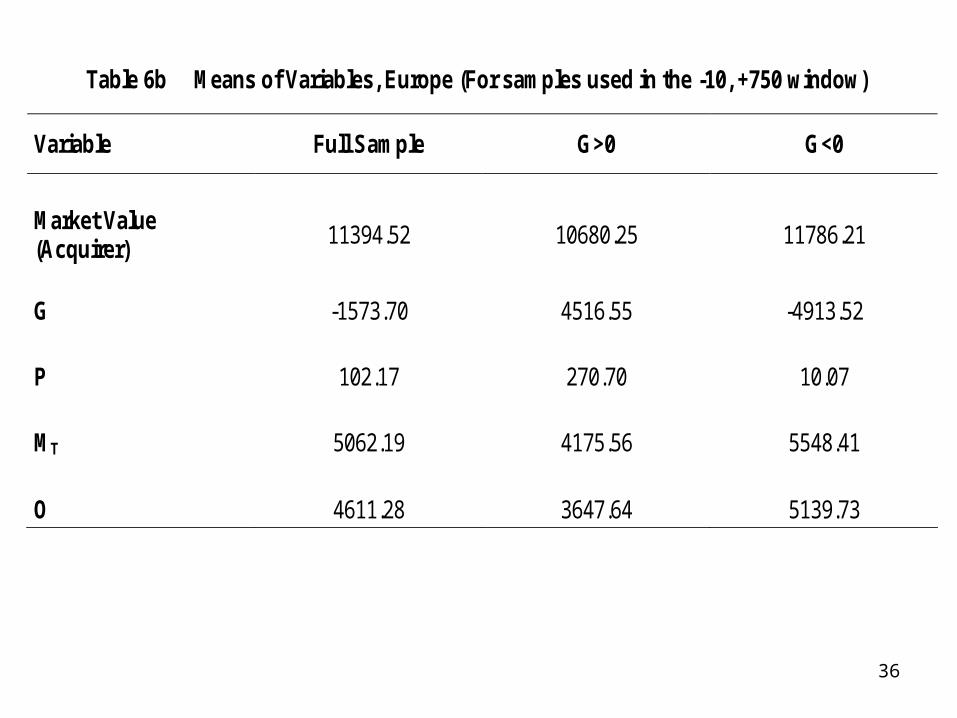
Table 6b Means of Variables, Europe (For samples used in the -10, +750 window)
Variable Full Sample G>0 G<0
Market Value (Acquirer)
11394.52 10680.25 11786.21
G -1573.70 4516.55 -4913.52 P 102.17 270.70 10.07 MT 5062.19 4175.56 5548.41 O 4611.28 3647.64 5139.73
37
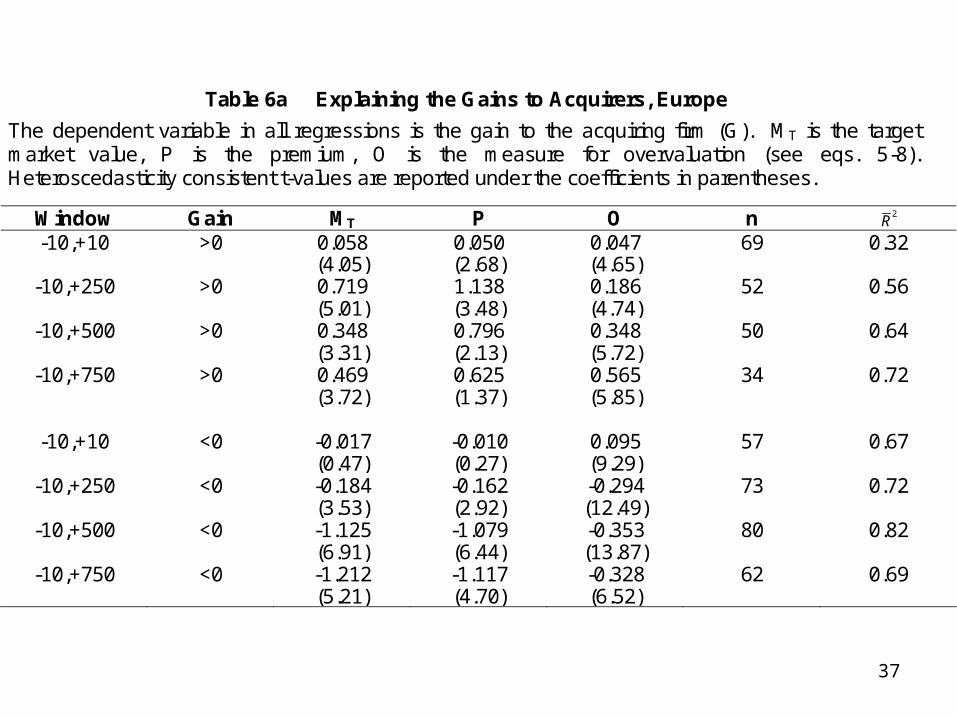
Table 6a Explaining the Gains to Acquirers, Europe
The dependent variable in all regressions is the gain to the acquiring firm (G). MT is the target market value, P is the premium, O is the measure for overvaluation (see eqs. 5-8). Heteroscedasticity consistent t-values are reported under the coefficients in parentheses.
Window Gain MT P O n 2R
-10,+10 >0 0.058 0.050 0.047 69 0.32 (4.05) (2.68) (4.65)
-10,+250 >0 0.719 1.138 0.186 52 0.56 (5.01) (3.48) (4.74)
-10,+500 >0 0.348 0.796 0.348 50 0.64 (3.31) (2.13) (5.72)
-10,+750 >0 0.469 0.625 0.565 34 0.72 (3.72) (1.37) (5.85)
-10,+10 <0 -0.017 -0.010 0.095 57 0.67 (0.47) (0.27) (9.29)
-10,+250 <0 -0.184 -0.162 -0.294 73 0.72 (3.53) (2.92) (12.49)
-10,+500 <0 -1.125 -1.079 -0.353 80 0.82 (6.91) (6.44) (13.87)
-10,+750 <0 -1.212 -1.117 -0.328 62 0.69 (5.21) (4.70) (6.52)

38
Comparison
• Difficult: part of the losses to acquirers over longer post-merger windows are due to their overvaluation at the time of the acquisitions, and not to the acquisitions themselves.
• A rough idea of the losses due to the mergers can be obtained by using the coefficients on the overvaluation variables and means:
• USA: an estimate of the average loss to acquirers due solely to the mergers $1961.14 =($3962.32 – 4369*0.458)
• Similar calculations for the Anglo-Saxon and continental European samples yield average losses of $512 and $3228 million.
• Thus, for those mergers that led to losses for the acquiring companies, by far the biggest losses occurred for mergers in
continental Europe, after adjusting for the overvaluation.
39
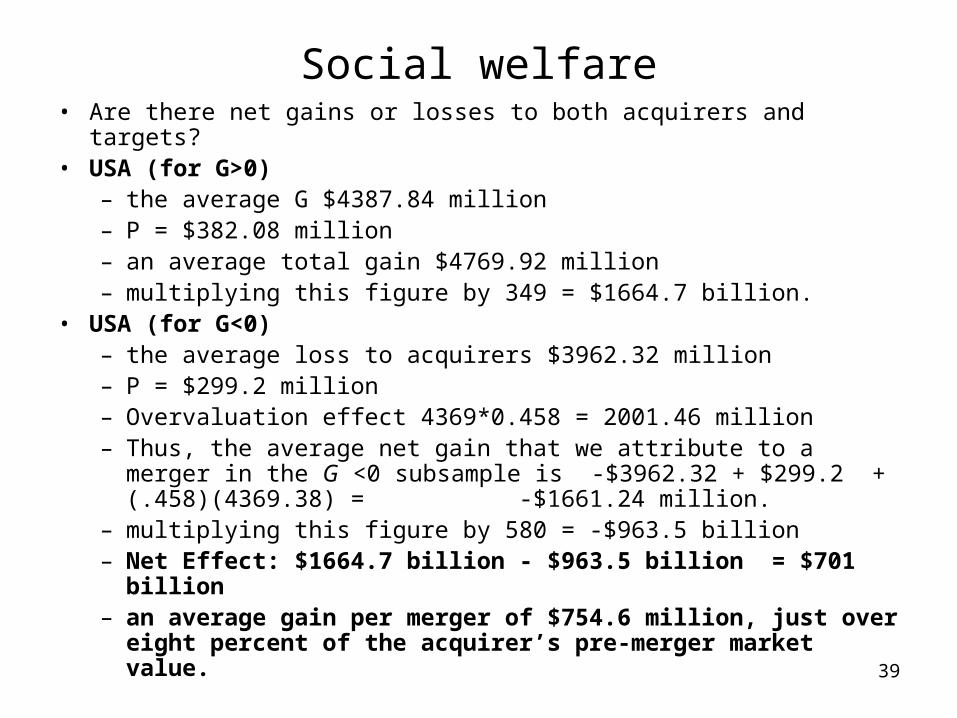
Social welfare• Are there net gains or losses to both acquirers and targets?• USA (for G>0)
– the average G $4387.84 million– P = $382.08 million– an average total gain $4769.92 million– multiplying this figure by 349 = $1664.7 billion.
• USA (for G<0) – the average loss to acquirers $3962.32 million– P = $299.2 million– Overvaluation effect 4369*0.458 = 2001.46 million– Thus, the average net gain that we attribute to a merger in the G
<0 subsample is -$3962.32 + $299.2 + (.458)(4369.38) = -$1661.24 million.
– multiplying this figure by 580 = -$963.5 billion– Net Effect: $1664.7 billion - $963.5 billion = $701 billion– an average gain per merger of $754.6 million, just over eight
percent of the acquirer’s pre-merger market value.

40
• Similar calculations for the Anglo-Saxon and continental Europe samples yield an average gain of $581.9 million (16 percent of the acquirer’s pre-merger market value) for a merger in an Anglo-Saxon country, and an average loss of $382.56 million (3.3 percent of the acquirer’s pre-merger market value) in continental Europe.
• The percentage loss per merger in the continental European countries appears very small, because the acquiring companies in these countries were much larger than in both the United States and the other Anglo-Saxon countries.
• These results indicate that differences in corporate governance institutions across countries are also related to the overall performance of mergers. Once we adjust for the overvaluation of some acquiring firms at the time of the acquisitions, we find that the average merger in the Anglo-Saxon countries created wealth, while the average merger in continental Europe destroyed wealth.
Related Documents