1 Copyright Ken Fletcher 2004 Australian Computer Security Pty Ltd Printed Mar 13, 2022 19:55 Prepared for: Monash University Subj: CSE4884 Network Design & Management Functional Capabilities The Project Engineer Squeeze Schedule Quality Cost NOTE: Project engineers are basically 25% solids, 70% liquids and 5% air. Ie virtually incompressible. Thus, increasing the pressure from any particular axis will inevitably cause one or more of the others to blow out. Alternatively, the whole project may explode

1 Copyright Ken Fletcher 2004 Australian Computer Security Pty Ltd Printed 16-May-15 00:58 Prepared for: Monash University Subj: CSE4884 Network Design.
Dec 17, 2015
Welcome message from author
This document is posted to help you gain knowledge. Please leave a comment to let me know what you think about it! Share it to your friends and learn new things together.
Transcript
1Copyright Ken Fletcher 2004 Australian Computer Security Pty LtdPrinted Apr 18, 2023 15:53
Prepared for: Monash University Subj: CSE4884 Network Design & Management
FunctionalCapabilities
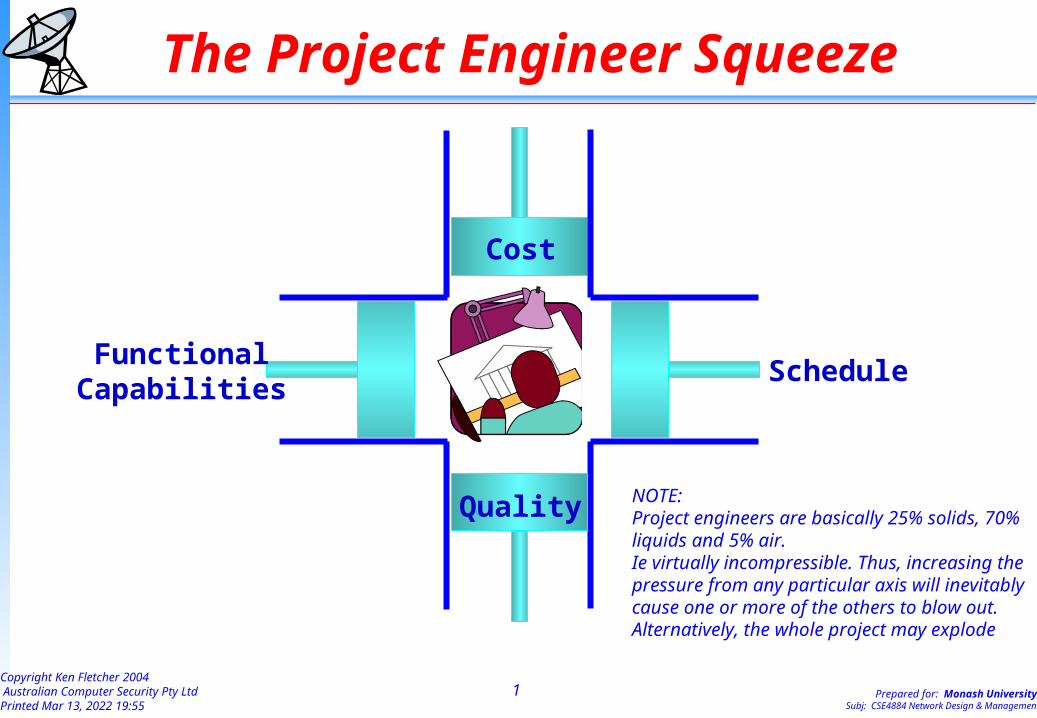
The Project Engineer Squeeze
Schedule
Quality
Cost
NOTE:Project engineers are basically 25% solids, 70% liquids and 5% air. Ie virtually incompressible. Thus, increasing the pressure from any particular axis will inevitably cause one or more of the others to blow out. Alternatively, the whole project may explode

2Copyright Ken Fletcher 2004 Australian Computer Security Pty LtdPrinted Apr 18, 2023 15:53
Prepared for: Monash University Subj: CSE4884 Network Design & Management
CSE4884 Network Design and Management
Lecturer: Ken Fletcher
Lecture 11
Revision
This presentation is a summary of Lectures 1 through 5

3Copyright Ken Fletcher 2004 Australian Computer Security Pty LtdPrinted Apr 18, 2023 15:53
Prepared for: Monash University Subj: CSE4884 Network Design & Management
CSE4884 Network Design and Management
Lecturer: Ken Fletcher
Lecture 1
Architectural Design and StrategyThis lecture was high-level and conceptual
Aim: to set the scene for subsequent lectures
6Copyright Ken Fletcher 2004 Australian Computer Security Pty LtdPrinted Apr 18, 2023 15:53
Prepared for: Monash University Subj: CSE4884 Network Design & Management
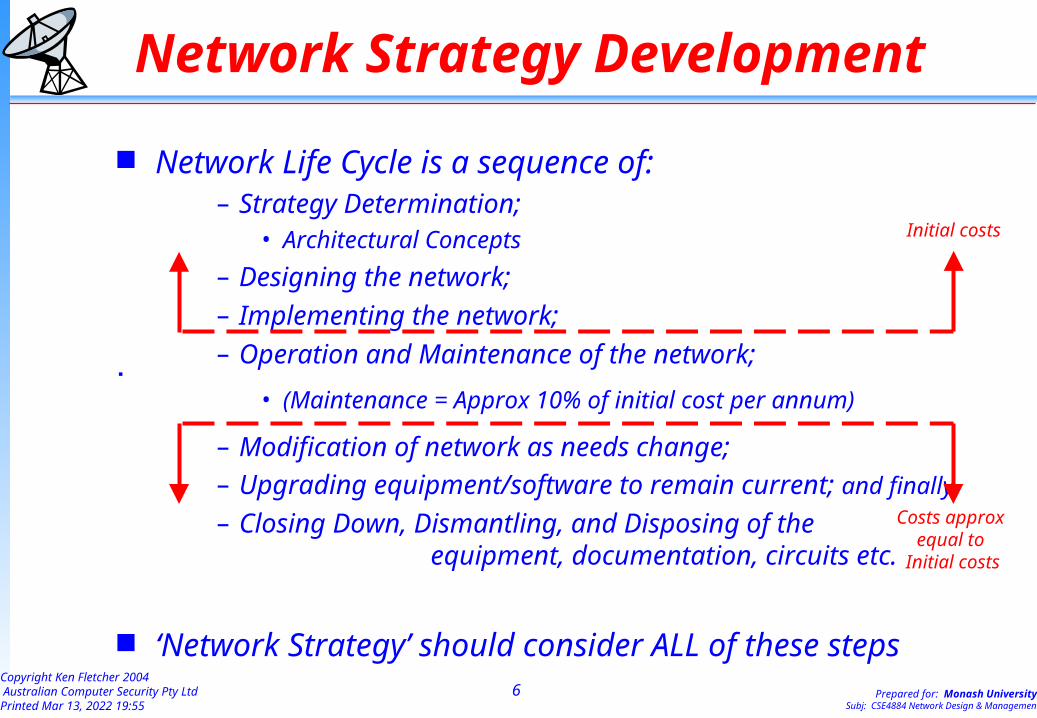
Network Strategy Development
Network Life Cycle is a sequence of:– Strategy Determination;
• Architectural Concepts
– Designing the network;– Implementing the network;– Operation and Maintenance of the network;
• (Maintenance = Approx 10% of initial cost per annum)
– Modification of network as needs change; – Upgrading equipment/software to remain current; and finally
– Closing Down, Dismantling, and Disposing of the equipment, documentation, circuits etc.
‘Network Strategy’ should consider ALL of these steps
Initial costs
Costs approx equal to
Initial costs

14Copyright Ken Fletcher 2004 Australian Computer Security Pty LtdPrinted Apr 18, 2023 15:53
Prepared for: Monash University Subj: CSE4884 Network Design & Management
Scope of Strategy Studies Include all forms of communications in study
– Voice, data, fax, telemetry, video, fire & security alarms– Don’t forget needs of ‘roaming’ or mobile users for data
WHY?• In order to:
– gain understanding of trends and intentions– look for possible rationalisation– ensure that future changes are allowed for– avoid simply automating yesterday’s approach and technology
Outcome of Strategy Study is an Architectural Concept or Design
15Copyright Ken Fletcher 2004 Australian Computer Security Pty LtdPrinted Apr 18, 2023 15:53
Prepared for: Monash University Subj: CSE4884 Network Design & Management
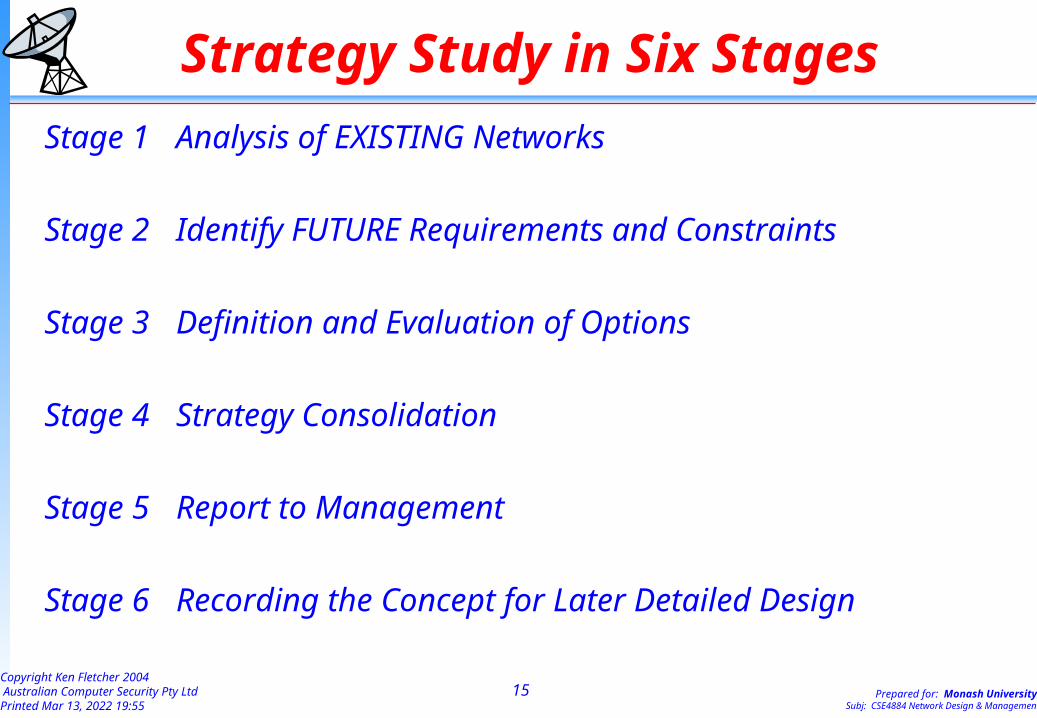
Strategy Study in Six Stages
Stage 1 Analysis of EXISTING Networks
Stage 2 Identify FUTURE Requirements and Constraints
Stage 3 Definition and Evaluation of Options
Stage 4 Strategy Consolidation
Stage 5 Report to Management
Stage 6 Recording the Concept for Later Detailed Design
23Copyright Ken Fletcher 2004 Australian Computer Security Pty LtdPrinted Apr 18, 2023 15:53
Prepared for: Monash University Subj: CSE4884 Network Design & Management
CSE4884 Network Design and Management
Lecturer: Ken Fletcher
Lecture 2
Network Design PrinciplesThis lecture introduced the major factors
to be considered in a design, and briefly addressed these.
24Copyright Ken Fletcher 2004 Australian Computer Security Pty LtdPrinted Apr 18, 2023 15:53
Prepared for: Monash University Subj: CSE4884 Network Design & Management
General Design Approach Network design is a complex task -
• as much people-handling & political as technical issues• requires patience and endurance
Starting conditions:• Usually a request ‘to install a network’• Sometimes with written ‘brief’, such as the document from
L1 Strategy Studies “Stage 6 - Recording Concept for Later” Ending Conditions:
• A detailed specification of the technical design, from which the network could be built, tested, and implemented.
Frequently, the designer then also implements the network
26Copyright Ken Fletcher 2004 Australian Computer Security Pty LtdPrinted Apr 18, 2023 15:53
Prepared for: Monash University Subj: CSE4884 Network Design & Management
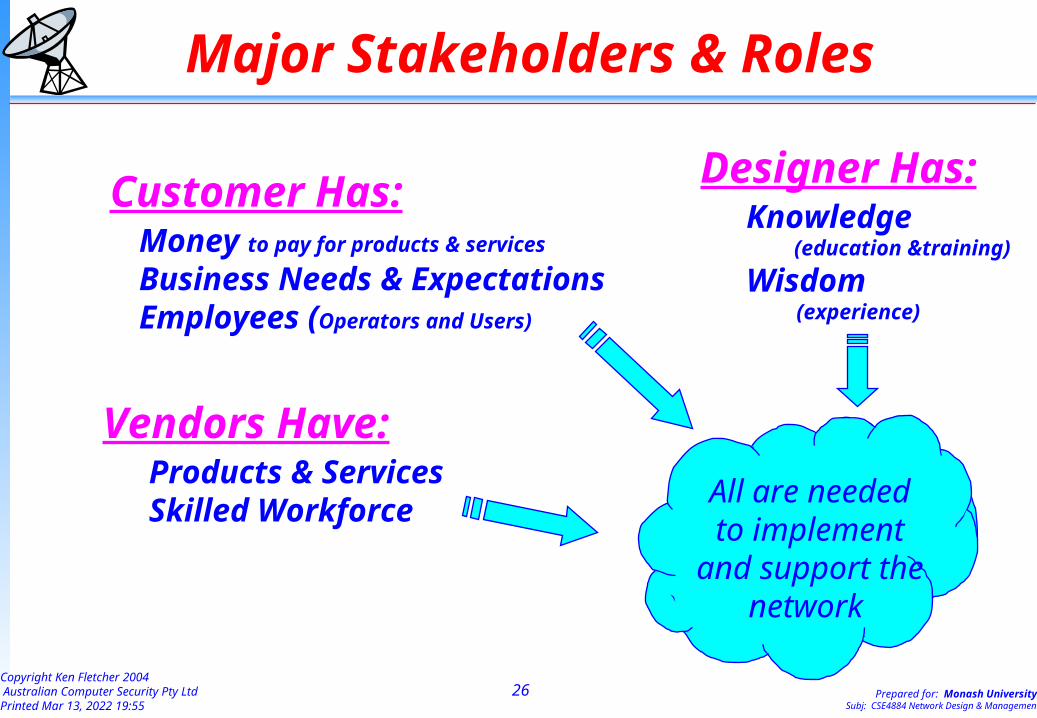
Major Stakeholders & Roles
Customer Has:Money to pay for products & services
Business Needs & ExpectationsEmployees (Operators and Users)
Designer Has:Knowledge (education &training)
Wisdom (experience)
Vendors Have:Products & ServicesSkilled Workforce
All are needed to implement
and support the network
28Copyright Ken Fletcher 2004 Australian Computer Security Pty LtdPrinted Apr 18, 2023 15:53
Prepared for: Monash University Subj: CSE4884 Network Design & Management
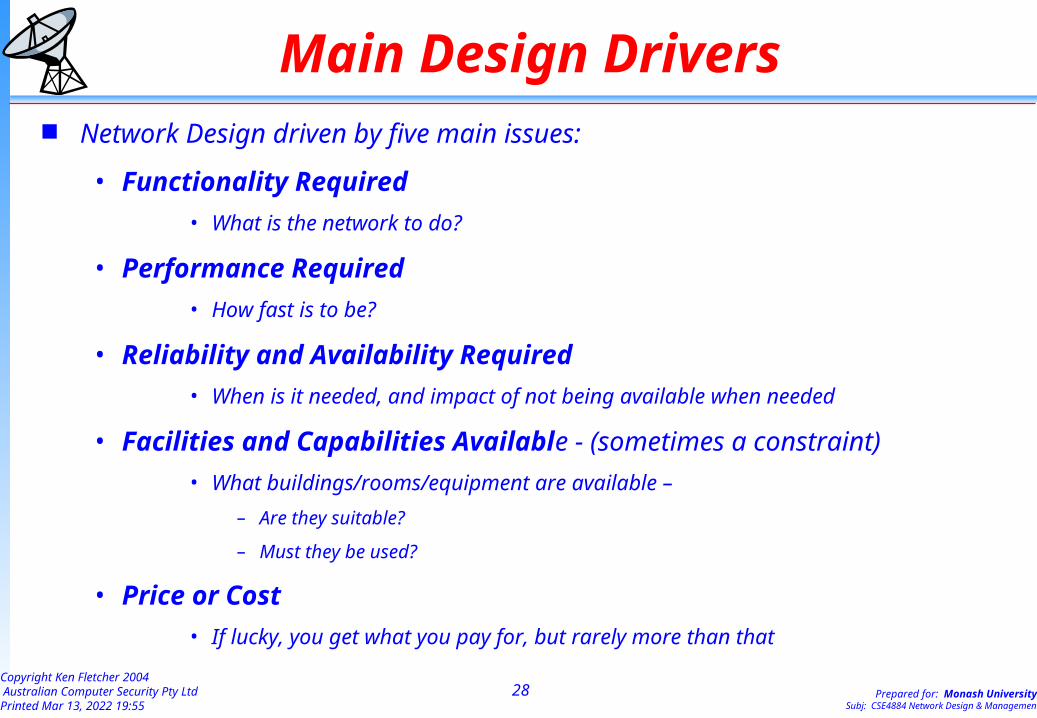
Main Design Drivers Network Design driven by five main issues:
• Functionality Required
• What is the network to do?
• Performance Required
• How fast is to be?
• Reliability and Availability Required
• When is it needed, and impact of not being available when needed
• Facilities and Capabilities Available - (sometimes a constraint)
• What buildings/rooms/equipment are available –
– Are they suitable?
– Must they be used?
• Price or Cost
• If lucky, you get what you pay for, but rarely more than that
30Copyright Ken Fletcher 2004 Australian Computer Security Pty LtdPrinted Apr 18, 2023 15:53
Prepared for: Monash University Subj: CSE4884 Network Design & Management
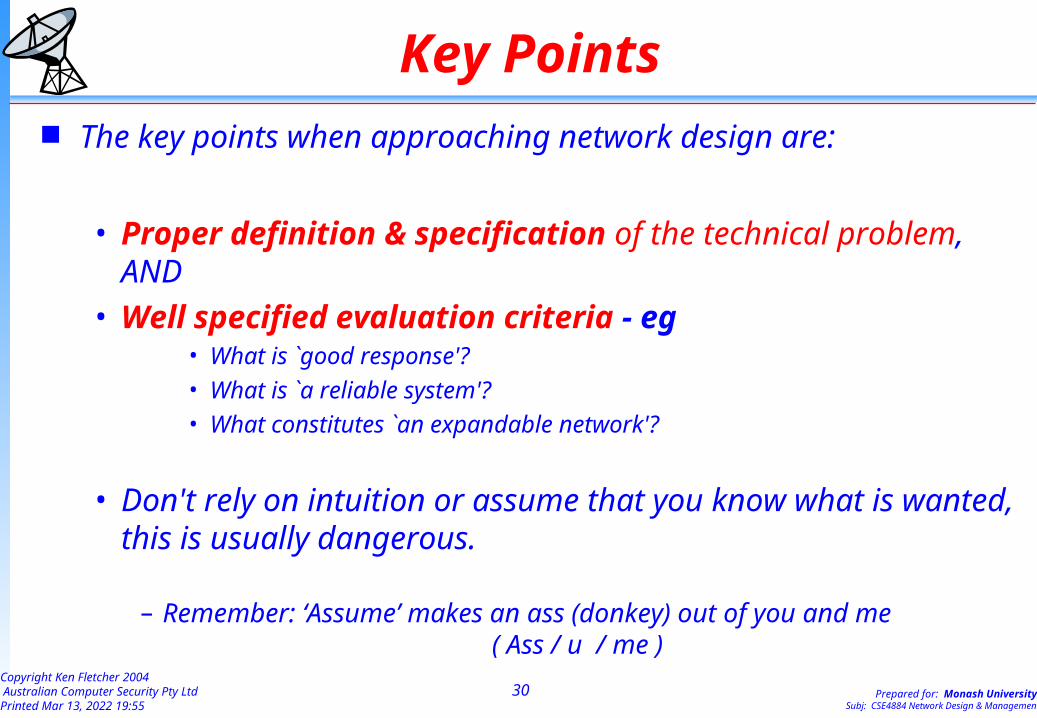
Key Points The key points when approaching network design are:
• Proper definition & specification of the technical problem, AND
• Well specified evaluation criteria - eg• What is `good response'?
• What is `a reliable system'?
• What constitutes `an expandable network'?
• Don't rely on intuition or assume that you know what is wanted, this is usually dangerous.
– Remember: ‘Assume’ makes an ass (donkey) out of you and me ( Ass / u / me )
33Copyright Ken Fletcher 2004 Australian Computer Security Pty LtdPrinted Apr 18, 2023 15:53
Prepared for: Monash University Subj: CSE4884 Network Design & Management
Performance Required
Performance requirements drive the ‘dimensioning’ of the network
ie number of circuits/components,
and the bandwidth required for their connection
34Copyright Ken Fletcher 2004 Australian Computer Security Pty LtdPrinted Apr 18, 2023 15:53
Prepared for: Monash University Subj: CSE4884 Network Design & Management
Response Time Covered mainly in lectures 3 and 4, and also in lecture 7
Response time is performance in interactive mode Typical User view:
– The time from pressing the key that `commits' the input command, and viewing the full output screen. (ie end-to-end delay)
Typical Specialist view:– Time from last input character going to line, and first output character being
received at the computer (ie transit delay).
Need agreed definition– Either view is valid - but
remember the golden rule, and who has the gold.
– Try for peak or busy hour definition • EG. “95% of traffic items shall be handled within ‘n’ seconds”• What should ‘n’ be?
35Copyright Ken Fletcher 2004 Australian Computer Security Pty LtdPrinted Apr 18, 2023 15:53
Prepared for: Monash University Subj: CSE4884 Network Design & Management
End-to-End Delay
The total time for an item to transit the network - including all:
• communications transit times –(usually negligible, except for satellite links)
• queuing times at intermediate nodes
• error recovery delays
• etc
• and sometimes includes processing times
Ensure that you know whether ‘allowable delay’ includes processing times.
It is often included in the ‘perceived comms delay’
37Copyright Ken Fletcher 2004 Australian Computer Security Pty LtdPrinted Apr 18, 2023 15:53
Prepared for: Monash University Subj: CSE4884 Network Design & Management
Busy Rate Goal This area of design is covered in Lecture 6 Usually related to `LOSS' aspects
• ie. those situations like a busy line on a telephone, where the request is lost if unable to be satisfied immediately.
– Dial up circuits– Port Selection– Virtual Circuits
Usually set to some acceptable criteria
(`grade of service’ or ‘degree of congestion’) – say 1% in busy hour is a typical rate for congestion of outgoing
telephone calls being unable to be completed due to circuit/switch congestion.

38Copyright Ken Fletcher 2004 Australian Computer Security Pty LtdPrinted Apr 18, 2023 15:53
Prepared for: Monash University Subj: CSE4884 Network Design & Management
Maintenance Goal Covered in Lecture 8 How much effort is management prepared to expend
on support of Hardware and on Software for:– fault prevention,– fault correction, and – environmental maintenance (keeping up with technology)
• Consider: Should you specify high reliability equipment and configurations in your design, even though it costs much more than simpler commercial grade equipment?
Mean Time Between Failures (MTBF)– concept
• For each critical component• For the communication carrier's circuits
Needs to be specified carefully– eg `Over any six months period , the MTBF shall be greater than xxx hours.‘

39Copyright Ken Fletcher 2004 Australian Computer Security Pty LtdPrinted Apr 18, 2023 15:53
Prepared for: Monash University Subj: CSE4884 Network Design & Management
Servicing Goal Mean Time to Restore (MTTR) concept
– Central or Capital City installations• Service personnel are less than an hours drive away• Spares warehouses are close to hand
– Remote Installations• Service personnel may have to fly in• Consider holding extended spares stocks on site
– Communications Carrier's MTTR (probably very high, but …)
Needs to be specified carefully– Define whether MTTR is to respond, repair, restart or RESTORE;– EG `Over six months, the MTTR shall not exceed three hours on
average, nor five hours for any single incident.’
NOTE: Many other terms apply to these concepts - eg– Inherent availability, mean down time, etc

40Copyright Ken Fletcher 2004 Australian Computer Security Pty LtdPrinted Apr 18, 2023 15:53
Prepared for: Monash University Subj: CSE4884 Network Design & Management
Implementation Ease Goal Not specifically covered in later lectures
The ease or difficulty of implementation - – closely related to ‘Technical Risk’, but with broader considerations
How long to achieve implementation? How much upheaval in the organisation? What is the risk of project failure:
– equipment inadequate
– supplier/vendor failure to deliver
– traffic estimates grossly inappropriate
– facilities not available on time
– Training
– state-of-the-art equipment is often as crude as kindergarten art
Leading Edge technology is BLEEDING edge for managers
43Copyright Ken Fletcher 2004 Australian Computer Security Pty LtdPrinted Apr 18, 2023 15:53
Prepared for: Monash University Subj: CSE4884 Network Design & Management
Performance Issues Regarding performance issues, this subject concentrates on:
– Network and Line Capacity• Line bps or Char/Sec
• Nodes Packets etc per second
– Delays • Waiting in queues for service
• Service Times
For all lines, actual throughput is always less than the theoretical maximum possible throughput due to:
• polling
• error block retransmissions
• synch frames and overheads
• effect of random traffic patterns
• Line utilisation = (Actual Load handled / Maximum Possible)
44Copyright Ken Fletcher 2004 Australian Computer Security Pty LtdPrinted Apr 18, 2023 15:53
Prepared for: Monash University Subj: CSE4884 Network Design & Management
Traffic Characteristics
Design is significantly affected by
• Type of traffic activity being handled
• Volume of traffic to be handled
– eg average transaction (packet) size
– eg average number of packets/second during the busy hour
Strange as it may seem, you will spend more time determining and analysing these issues than actually ‘designing’ the network. (consider the assignment effort)
Informal studies have indicated that actual network loads experienced within a short time of commissioning the new system are often 100% above the ‘design load’
47Copyright Ken Fletcher 2004 Australian Computer Security Pty LtdPrinted Apr 18, 2023 15:53
Prepared for: Monash University Subj: CSE4884 Network Design & Management
Message VolumesTraffic volumes are critical to response time/throughput.
`Communication item' sizes• Average size - best by application if available• Statistical distribution of sizes• Are these figures constant throughout the day/week/month?
Totals in-out for each application• Volumes of traffic - by application if available
Peak Times • (NOTE: WA is 2-3 hours later)• Special Days (Holidays, Religious festivals)
• Identifying the peak times for each application may be very useful
NEED TO UNDERSTAND BUSINESS / LOCAL PEAKS
eg First Tuesday in November = holiday for many, peak for TAB
48Copyright Ken Fletcher 2004 Australian Computer Security Pty LtdPrinted Apr 18, 2023 15:53
Prepared for: Monash University Subj: CSE4884 Network Design & Management
`Turnpike Effect' and Growth
(AKA as `Suppressed Demand’, Freeway Effect, etc)
Well designed systems encourage greater use - • especially enquiry systems
Need to add a contingency allowance for the unknown suppressed demand
Martin 1968:– "If terminals provide a useful service, their utilisation will expand to
fill the system capacity"
52Copyright Ken Fletcher 2004 Australian Computer Security Pty LtdPrinted Apr 18, 2023 15:53
Prepared for: Monash University Subj: CSE4884 Network Design & Management
CSE4884 Network Design and Management
Lecturer: Ken Fletcher
Lecture 3
Network Dimensioning
This lecture was the start of detailed design work dependent on calculations
53Copyright Ken Fletcher 2004 Australian Computer Security Pty LtdPrinted Apr 18, 2023 15:53
Prepared for: Monash University Subj: CSE4884 Network Design & Management
Notes
Lecture 3 introduced Queueing Theory concepts and simple cases
Lecture 4 continued Queueing Theory, covering
Spread of response times
Call centres
Discussion on psychology and queueing systems
Loss systems was covered in Lecture 6
55Copyright Ken Fletcher 2004 Australian Computer Security Pty LtdPrinted Apr 18, 2023 15:53
Prepared for: Monash University Subj: CSE4884 Network Design & Management
Fundamental Considerations Traffic Volumes
• Average per day or week
• During the peak period (15 to 60 minutes)
• During extreme situations
Traffic Flow characteristics• Random requests (“arrivals”)
• Bursts of traffic
Acceptable Delays in peak periods• Average delay
• “Maximum” delay - effectively 90th or 95th percentile
This information must be obtained from the Customer(See notes associated with the Traffic Analysis Tutorial)
62Copyright Ken Fletcher 2004 Australian Computer Security Pty LtdPrinted Apr 18, 2023 15:53
Prepared for: Monash University Subj: CSE4884 Network Design & Management
QUEUING or DELAY SYSTEMS:
QUEUING OR DELAY systems handle SHORT TERM OVERLOADS OR CONGESTION by forcing some activities/customers to wait.
ie Any systems which form a waiting queue are Queuing Systems.
LOSS or BAULKING SYSTEMS are those which handle overload or congestion by locking out all activities or customers. ie They ignore or lose customers when overloaded. (In most cases, this means that the customers tries again at the customer’s (in)convenience).
eg Getting on engaged number on the telephone.

65Copyright Ken Fletcher 2004 Australian Computer Security Pty LtdPrinted Apr 18, 2023 15:53
Prepared for: Monash University Subj: CSE4884 Network Design & Management
Queuing Theory - Approach #3 Approach 3
THUMBNAIL CALCULATIONS or EDUCATED GUESSWORKIt is:• Cheap• Quick• Uses conservative assumptions and graphs to simplify the
mathematical approach• Generally within 10% to 20% accuracy when compared to
simulation approaches• (Better than the accuracy of traffic activity projections on most systems.)
66Copyright Ken Fletcher 2004 Australian Computer Security Pty LtdPrinted Apr 18, 2023 15:53
Prepared for: Monash University Subj: CSE4884 Network Design & Management
Points To Remember
Estimates only, not exact calculations
Queuing delays only handle short term overloads
– “Short Term” is the time until the ‘hopper’ (buffer pool) overflows
Overload is defined as:“current input rate exceeding the activity rate of the servers”that is, more arrivals than can be handled in the time

67Copyright Ken Fletcher 2004 Australian Computer Security Pty LtdPrinted Apr 18, 2023 15:53
Prepared for: Monash University Subj: CSE4884 Network Design & Management
Components to be Considered (1)
Input Characteristics– Effect of population size – Average input rate or frequency – Distribution of arrivals - random/peaked/…etc
Queue Characteristics– Queue discipline priority/FIFO/random/ordered/...– What happens when the queue space is full?
Service Facility– Average time and variability to service an event– Number of servers– Average load (“utilisation”)
68Copyright Ken Fletcher 2004 Australian Computer Security Pty LtdPrinted Apr 18, 2023 15:53
Prepared for: Monash University Subj: CSE4884 Network Design & Management
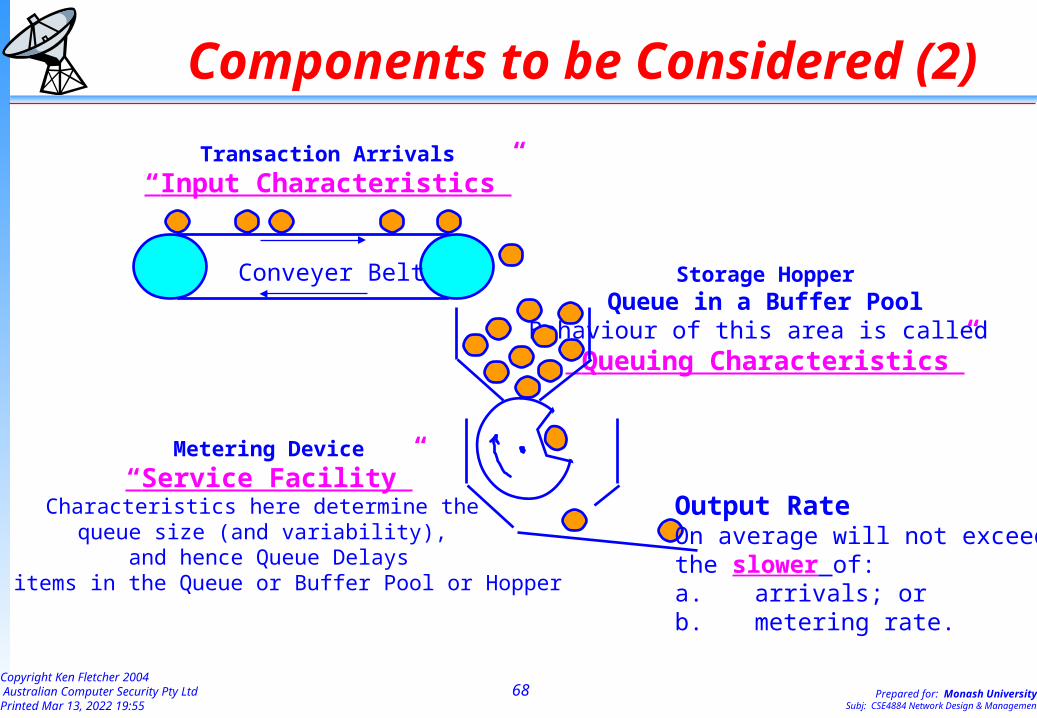
Transaction Arrivals
“Input Characteristics”
Storage HopperQueue in a Buffer Pool
Behaviour of this area is called “Queuing Characteristics”
Metering Device
“Service Facility”Characteristics here determine the
queue size (and variability), and hence Queue Delays
of items in the Queue or Buffer Pool or Hopper
Conveyer Belt
Output RateOn average will not exceed the slower of:a. arrivals; or b. metering rate.
Components to be Considered (2)

69Copyright Ken Fletcher 2004 Australian Computer Security Pty LtdPrinted Apr 18, 2023 15:53
Prepared for: Monash University Subj: CSE4884 Network Design & Management
Input Characteristics
1 Population Size Effects• All arrivals from some population of potential requestors.
– Assumptions of this method.– Infinite population size to draw from – Requestor waits for service of a request before requesting more.
– Effects– As population is finite, this assumption is conservative.– Small populations can smooth the peaks.
2 Input Rate or Frequency. “Load Intensity”– Taken as average arrivals per time period, for example:
• ‘3 arrivals/minute’, or• ‘5 transactions/second’

70Copyright Ken Fletcher 2004 Australian Computer Security Pty LtdPrinted Apr 18, 2023 15:53
Prepared for: Monash University Subj: CSE4884 Network Design & Management
Input Characteristics (2)
3 Input Traffic Distribution.• Generally the mathematical distribution (dispersion) of input
traffic requests is not known.
• Most networks are probably not describable mathematically
• Some assumptions are needed to enable analysis
• Consider these distributions of traffic arrivals or requests:– Random
– Constant arrivals
– Smoother than Random
– Rougher than Random
71Copyright Ken Fletcher 2004 Australian Computer Security Pty LtdPrinted Apr 18, 2023 15:53
Prepared for: Monash University Subj: CSE4884 Network Design & Management
Random Arrivals
There are many possible distributions of input traffic. The most common distribution is ‘unknown’. Think of it as a RANDOM distribution, unless you have evidence that something else is more appropriate.
Random arrivals (Distribution most commonly assumed)– Also Known As (AKA)
• Poisson distribution
• Exponential distribution
• Erlang-1 distribution (more of this later)
• Events are random and independent of each other
• Arrivals are independent of each other, and drawn from an infinite size population.
80Copyright Ken Fletcher 2004 Australian Computer Security Pty LtdPrinted Apr 18, 2023 15:53
Prepared for: Monash University Subj: CSE4884 Network Design & Management
Queue Characteristics (1) - Discipline
• How will the waiting items be queued?– Affects variability of waiting time, but not queue size unless the queue ordering
is based on expected service time, ie short tasks are queued ahead of longer tasks
• Discipline – Normally found in Communications Systems
• FIFO Most common• Priority (FIFO within priority) Relatively common• Predetermined H/W Interrupts, some polling systems• Round robin Common polling• Baulking Removing items from queues
– Special Circumstances• Sorted Disk access arms movement• Random Common In markets, but not computers
– Generally, • ‘FIFO’ gives least variable delays.• ‘Sorted’ gives overall efficiency at cost of variability in delays

82Copyright Ken Fletcher 2004 Australian Computer Security Pty LtdPrinted Apr 18, 2023 15:53
Prepared for: Monash University Subj: CSE4884 Network Design & Management
Transaction Arrivals
“Input Characteristics”
Storage HopperQueue in a Buffer Pool
Behaviour of this area is called “Queue Characteristics”
Metering Device
“Service Facility”Characteristics here determine the
queue size (and variability), and hence Queue Delays
of items in the Queue or Buffer Pool or Hopper
Conveyer Belt
Output RateOn average will not exceed the slower of:a. arrivals; or b. metering rate.
Service Facility Characteristics
83Copyright Ken Fletcher 2004 Australian Computer Security Pty LtdPrinted Apr 18, 2023 15:53
Prepared for: Monash University Subj: CSE4884 Network Design & Management
Service Facility (1) This is the area where most design work is possible.
• input characteristics are determined by external issues -– traffic loads and distribution characteristics are determined by the work
to be done
• queuing characteristics may be design issues if you are in control of the software, for example
– traffic queuing discipline may be a design parameter, but is usually dictated by the customer’s work or application software
• ‘Service facility characteristics’ for communications systems are:
– the design line speed for output; and– number of output lines.
• Some factors for consideration ...
84Copyright Ken Fletcher 2004 Australian Computer Security Pty LtdPrinted Apr 18, 2023 15:53
Prepared for: Monash University Subj: CSE4884 Network Design & Management
Service Facility (2) - “Utilisation” Average Utilisation = (time facility in use) / (time available)
or(actual load) / (maximum possible load)
eg.• Shop with one server.
– average time to serve each customer is 3 minutes, and – average of 12 customers per hour
• server is busy for a total of 36 minutes in the hour,• Then utilisation (of the server) = (36) / (60)
= 0.6
= 60%
85Copyright Ken Fletcher 2004 Australian Computer Security Pty LtdPrinted Apr 18, 2023 15:53
Prepared for: Monash University Subj: CSE4884 Network Design & Management
Service Facility (3) - Service Times
Service times may be :– Constant eg
• Fixed length packet processing• Time slices in a time sliced processor
or– Variable eg
• Variable length messages or packets• Disk I/O times
• Constant gives most consistent queue behaviour• ‘Variable’ generally considered as random
• Most are somewhere between these two extremes, that is: most communications servers are smoother than random
• Treat them as if Random - this is a conservative approach
86Copyright Ken Fletcher 2004 Australian Computer Security Pty LtdPrinted Apr 18, 2023 15:53
Prepared for: Monash University Subj: CSE4884 Network Design & Management
Service Facility (4) - Number of servers May be any integer (or whole) number
Communications systems usually have single servers, butmultiple server situations are not uncommon.
Consider multi server systems:• When higher speed lines are needed, but not available• When higher speed interface boxes are needed, but not
available (or too expensive), such as gateways, encryptors, format converters; or
• In the checkout line at supermarkets, banks, and McDonalds.
87Copyright Ken Fletcher 2004 Australian Computer Security Pty LtdPrinted Apr 18, 2023 15:53
Prepared for: Monash University Subj: CSE4884 Network Design & Management
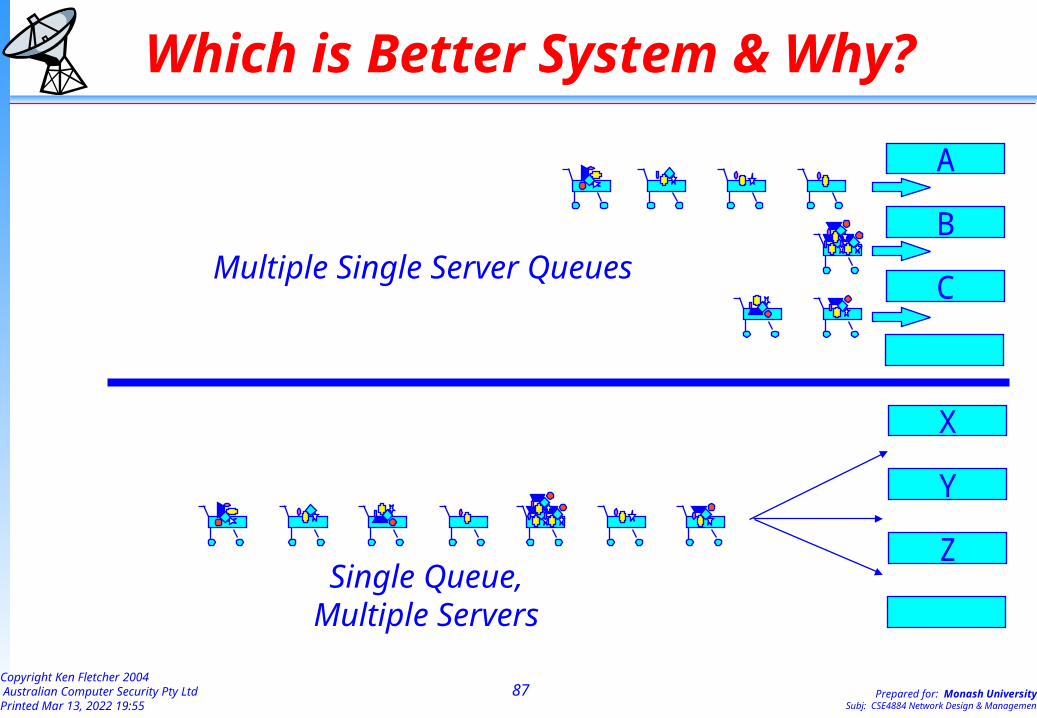
Which is Better System & Why?
A
B
CMultiple Single Server Queues
X
Y
ZSingle Queue,
Multiple Servers
90Copyright Ken Fletcher 2004 Australian Computer Security Pty LtdPrinted Apr 18, 2023 15:53
Prepared for: Monash University Subj: CSE4884 Network Design & Management
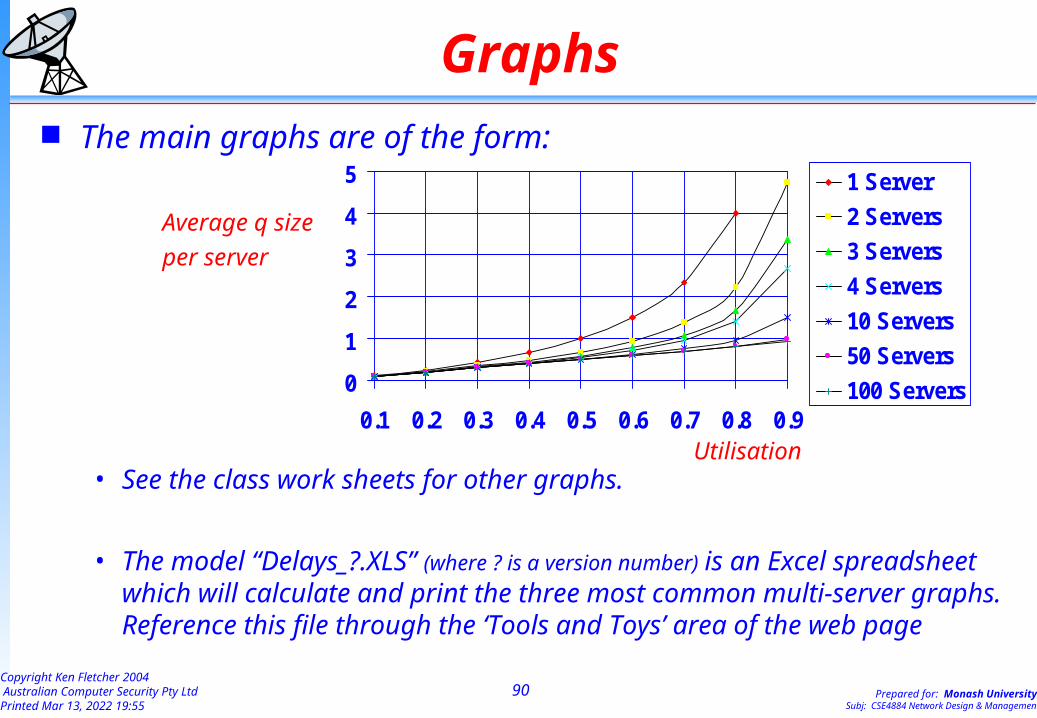
Graphs The main graphs are of the form:
Average q size
per server
• See the class work sheets for other graphs.
• The model “Delays_?.XLS” (where ? is a version number) is an Excel spreadsheet which will calculate and print the three most common multi-server graphs. Reference this file through the ‘Tools and Toys’ area of the web page
0
1
2
3
4
5
0.1 0.2 0.3 0.4 0.5 0.6 0.7 0.8 0.9
1 Server
2 Servers
3 Servers
4 Servers
10 Servers
50 Servers
100 Servers
Utilisation

91Copyright Ken Fletcher 2004 Australian Computer Security Pty LtdPrinted Apr 18, 2023 15:53
Prepared for: Monash University Subj: CSE4884 Network Design & Management
Some other graphs The handouts from James Martin contain many other graphs.
The main graphs are also available from the tool “Delays.xls” available via the Tools and toys, or under ‘Queueing Graphs’ on the lectures and tutorials page• Eg• Mean number of items in a queue (waiting and being served)• Mean queueing times• Effect of different dispatching disciplines• Standard deviations of queueing times etc
Some of these will be shown on the OHP projector – but you can look these up for yourself on the references given.

92Copyright Ken Fletcher 2004 Australian Computer Security Pty LtdPrinted Apr 18, 2023 15:53
Prepared for: Monash University Subj: CSE4884 Network Design & Management
Notes re Graphs
These graphs are based on assumptions – General Assumptions (but check carefully on each graph):
• Random arrivals• Random Service times• All servers equally loaded in a multi server situation• FIFO Dispatching .
Most of the graphs are of the same form:• X axis is utilisation of the servers,• Y axis is the number of items, usually on a ‘per server’ basis
93Copyright Ken Fletcher 2004 Australian Computer Security Pty LtdPrinted Apr 18, 2023 15:53
Prepared for: Monash University Subj: CSE4884 Network Design & Management
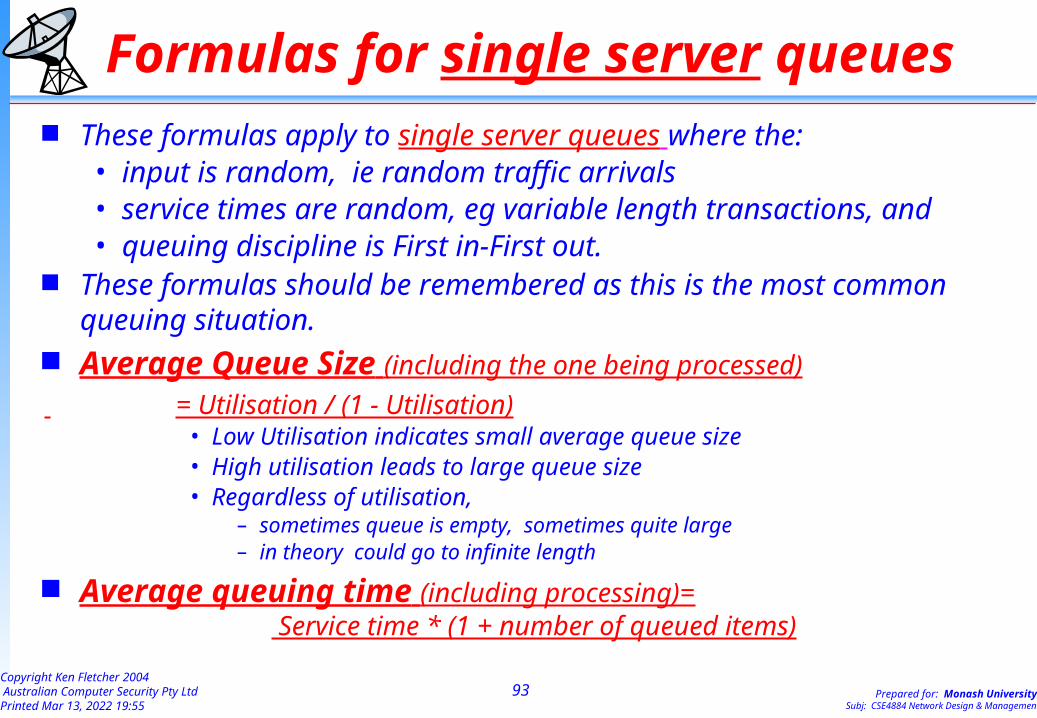
Formulas for single server queues These formulas apply to single server queues where the:
• input is random, ie random traffic arrivals• service times are random, eg variable length transactions, and • queuing discipline is First in-First out.
These formulas should be remembered as this is the most common queuing situation.
Average Queue Size (including the one being processed)
= Utilisation / (1 - Utilisation)• Low Utilisation indicates small average queue size• High utilisation leads to large queue size• Regardless of utilisation,
– sometimes queue is empty, sometimes quite large– in theory could go to infinite length
Average queuing time (including processing)= Service time * (1 + number of queued items)
99Copyright Ken Fletcher 2004 Australian Computer Security Pty LtdPrinted Apr 18, 2023 15:53
Prepared for: Monash University Subj: CSE4884 Network Design & Management
A Useful Formula for link Design. The normal formulae and graphs for single server queues are adequate for
most circumstances where analysis of an existing system is required.
During design work, we often do not know the utilisation until the end of the design, and hence have to design re-iteratively until a suitable solution is found.The following formula is useful in this circumstance.
Note: Assumptions of this derivation:• Single server
• random arrivals
• FIFO queuing
• random service times
100Copyright Ken Fletcher 2004 Australian Computer Security Pty LtdPrinted Apr 18, 2023 15:53
Prepared for: Monash University Subj: CSE4884 Network Design & Management
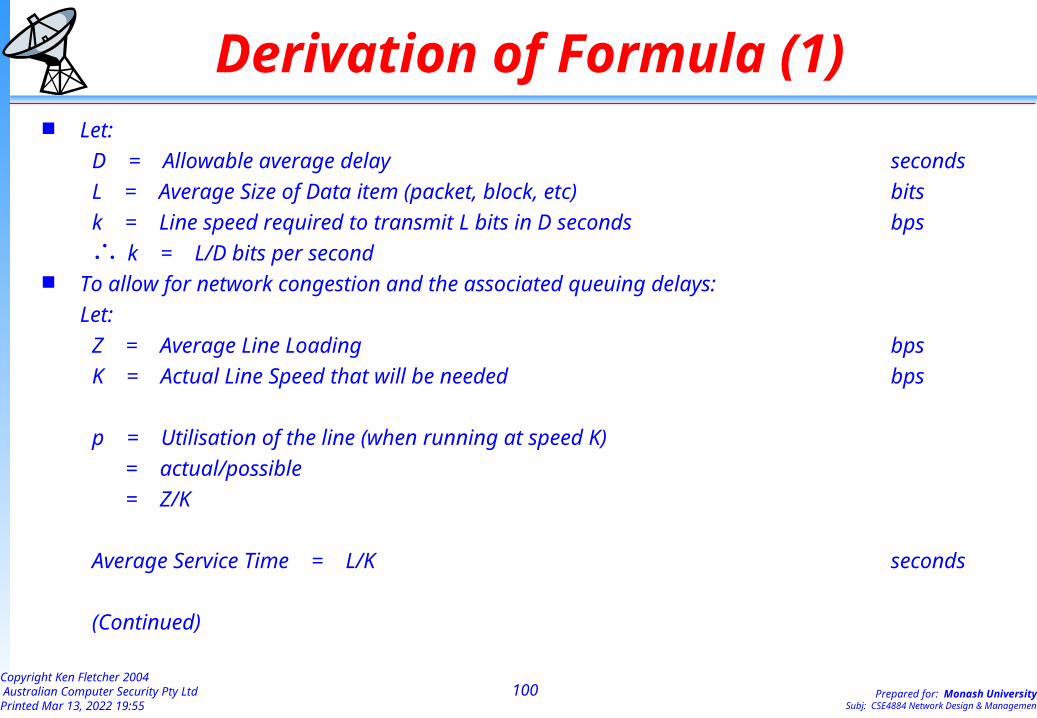
Derivation of Formula (1) Let:
D = Allowable average delay seconds
L = Average Size of Data item (packet, block, etc) bits
k = Line speed required to transmit L bits in D seconds bps k = L/D bits per second
To allow for network congestion and the associated queuing delays:
Let:
Z = Average Line Loading bps
K = Actual Line Speed that will be needed bps
p = Utilisation of the line (when running at speed K)
= actual/possible
= Z/K
Average Service Time = L/K seconds
(Continued)

101Copyright Ken Fletcher 2004 Australian Computer Security Pty LtdPrinted Apr 18, 2023 15:53
Prepared for: Monash University Subj: CSE4884 Network Design & Management
Derivation of Formula (2)Average queuing Time = Average Service Time * ( 1 + ( Utilisation / (1- Utilisation ) ) = ( ( L / K ) * ( 1 + ( p / ( 1 - p ) ) ) )
= ( ( L / K ) * ( 1 / (1 - p ) ) )
= ( L / (K ( 1 - p ) ) seconds
Actual Line Speed RequiredK = k * ( 1 / ( 1 - p ) ) K = ( L / D ) * ( 1 / ( 1 - p ) ) K = ( L / D ( 1 - p ) ) K ( 1 - p ) = L / D K - K p = L / D
But p = Z / K K - K * ( Z / K ) = L / D K - Z = L / D K = ( L / D ) +Z bits per second

103Copyright Ken Fletcher 2004 Australian Computer Security Pty LtdPrinted Apr 18, 2023 15:53
Prepared for: Monash University Subj: CSE4884 Network Design & Management
Example usage of this Formula: Example task
• Average line loading from all sources Z = 100 bytes per second = 800 bits per second
• D = Allowable delay is three seconds• L = Average block size is 375 bytes = 3000 bits
Required line speed Min. Line Speed Required = ( L / D ) + Z bps = (3000/3) + 800 bps
= 1800 bps
Do you believe it could be this easy? see next page
104Copyright Ken Fletcher 2004 Australian Computer Security Pty LtdPrinted Apr 18, 2023 15:53
Prepared for: Monash University Subj: CSE4884 Network Design & Management
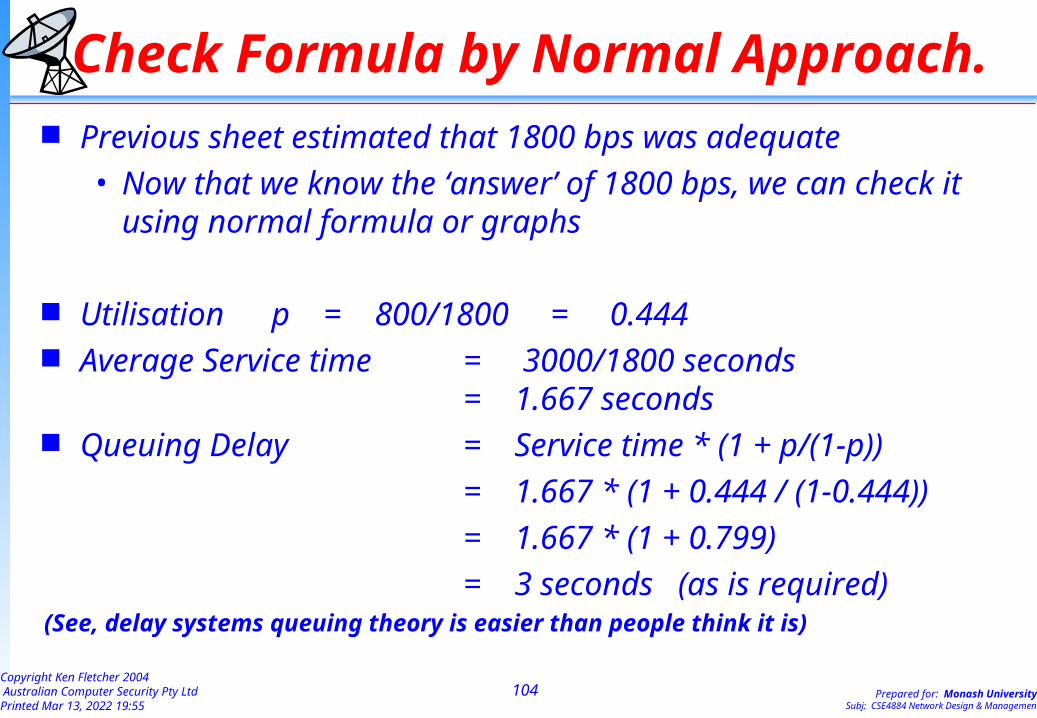
Check Formula by Normal Approach. Previous sheet estimated that 1800 bps was adequate
• Now that we know the ‘answer’ of 1800 bps, we can check it using normal formula or graphs
Utilisation p = 800/1800 = 0.444 Average Service time = 3000/1800 seconds
= 1.667 seconds Queuing Delay = Service time * (1 + p/(1-p))
= 1.667 * (1 + 0.444 / (1-0.444))
= 1.667 * (1 + 0.799)
= 3 seconds (as is required)(See, delay systems queuing theory is easier than people think it is)

105Copyright Ken Fletcher 2004 Australian Computer Security Pty LtdPrinted Apr 18, 2023 15:53
Prepared for: Monash University Subj: CSE4884 Network Design & Management
In Practice This formula can be applied to a communications design problem, in
order to estimate the required minimum line speed. However, as lines and modems are normally usable only at certain discrete speeds (eg 2400, 4800, 9600, 14400, 19200, 28800, 33400, 48000, 64000 bps etc) the designer must use the next higher available speed.
1. First estimate the minimum line speed required
using the formula or graphs, or other method
2. Then choose the next higher available speed, and
3. Finally, estimate the average delays inherent in the system
by recalculating, using the chosen line speed and estimated
loadings.
106Copyright Ken Fletcher 2004 Australian Computer Security Pty LtdPrinted Apr 18, 2023 15:53
Prepared for: Monash University Subj: CSE4884 Network Design & Management
CSE4884 Network Design and Management
Lecturer: Ken Fletcher
Lecture 4
Queueing Theory Part 2
Dispersion of Queueing times
Queue Notation
Call Centre Considerations
Practicalities
107Copyright Ken Fletcher 2004 Australian Computer Security Pty LtdPrinted Apr 18, 2023 15:53
Prepared for: Monash University Subj: CSE4884 Network Design & Management
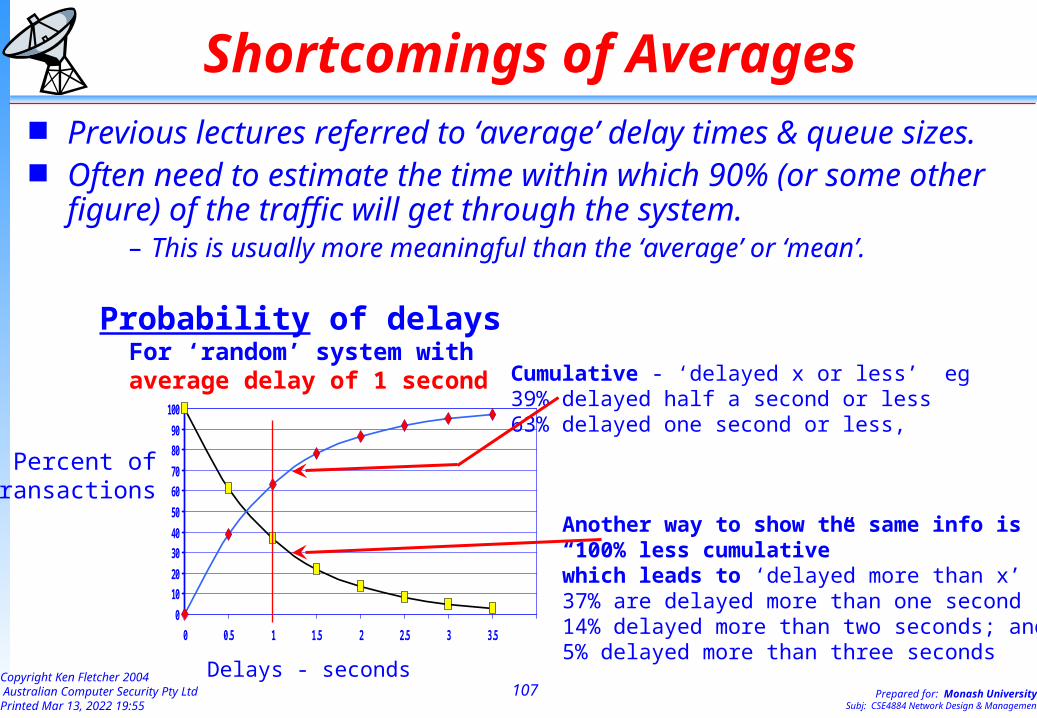
Shortcomings of Averages Previous lectures referred to ‘average’ delay times & queue sizes.
Often need to estimate the time within which 90% (or some other
figure) of the traffic will get through the system. – This is usually more meaningful than the ‘average’ or ‘mean’.
Delays - seconds
0
10
20
30
40
50
60
70
80
90
100
0 0.5 1 1.5 2 2.5 3 3.5
Percent of transactions
Probability of delays For ‘random’ system with average delay of 1 second
Another way to show the same info is“100% less cumulative” which leads to ‘delayed more than x’ eg37% are delayed more than one second14% delayed more than two seconds; and5% delayed more than three seconds
Cumulative - ‘delayed x or less’ eg39% delayed half a second or less63% delayed one second or less,
109Copyright Ken Fletcher 2004 Australian Computer Security Pty LtdPrinted Apr 18, 2023 15:53
Prepared for: Monash University Subj: CSE4884 Network Design & Management
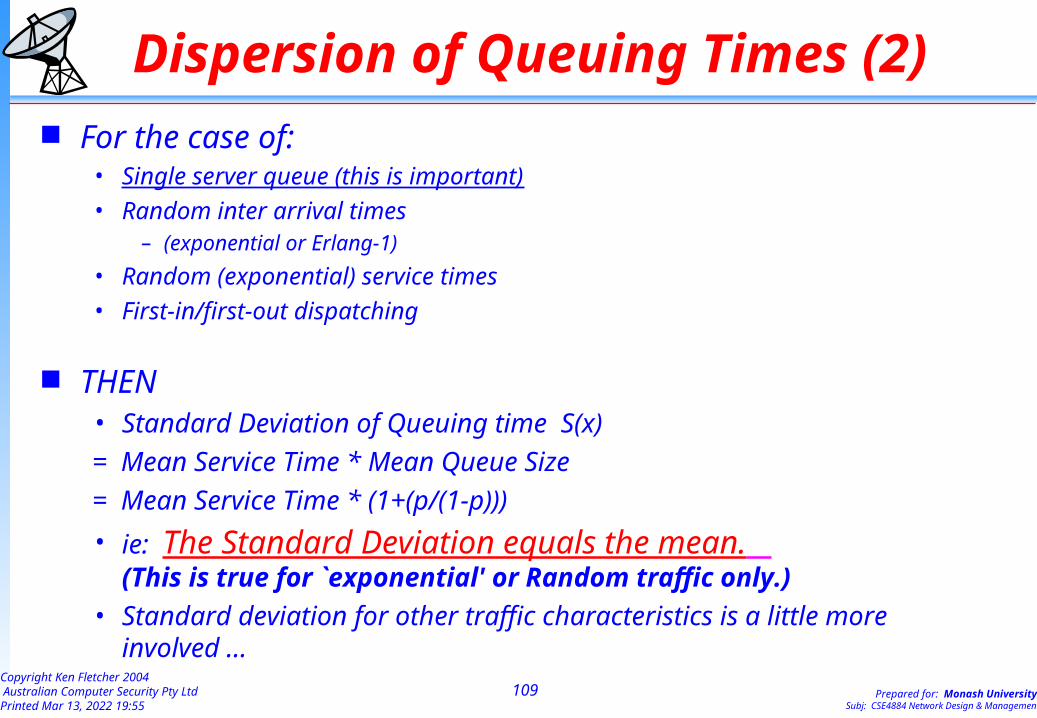
Dispersion of Queuing Times (2) For the case of:
• Single server queue (this is important)
• Random inter arrival times– (exponential or Erlang-1)
• Random (exponential) service times
• First-in/first-out dispatching
THEN • Standard Deviation of Queuing time S(x)
= Mean Service Time * Mean Queue Size
= Mean Service Time * (1+(p/(1-p)))
• ie: The Standard Deviation equals the mean. (This is true for `exponential' or Random traffic only.)
• Standard deviation for other traffic characteristics is a little more involved ...
112Copyright Ken Fletcher 2004 Australian Computer Security Pty LtdPrinted Apr 18, 2023 15:53
Prepared for: Monash University Subj: CSE4884 Network Design & Management
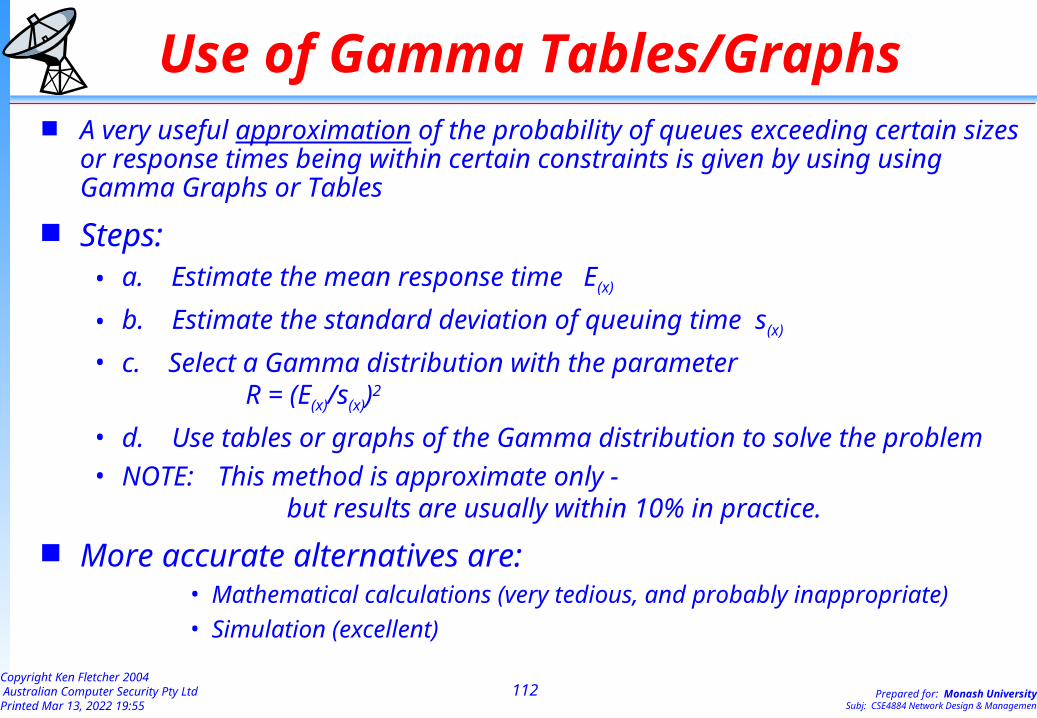
Use of Gamma Tables/Graphs A very useful approximation of the probability of queues exceeding certain
sizes or response times being within certain constraints is given by using using Gamma Graphs or Tables
Steps:• a. Estimate the mean response time E(x)
• b. Estimate the standard deviation of queuing time s(x)
• c. Select a Gamma distribution with the parameter R = (E(x)/s(x))2
• d. Use tables or graphs of the Gamma distribution to solve the problem• NOTE: This method is approximate only -
but results are usually within 10% in practice.
More accurate alternatives are:• Mathematical calculations (very tedious, and probably inappropriate)
• Simulation (excellent)
119Copyright Ken Fletcher 2004 Australian Computer Security Pty LtdPrinted Apr 18, 2023 15:53
Prepared for: Monash University Subj: CSE4884 Network Design & Management
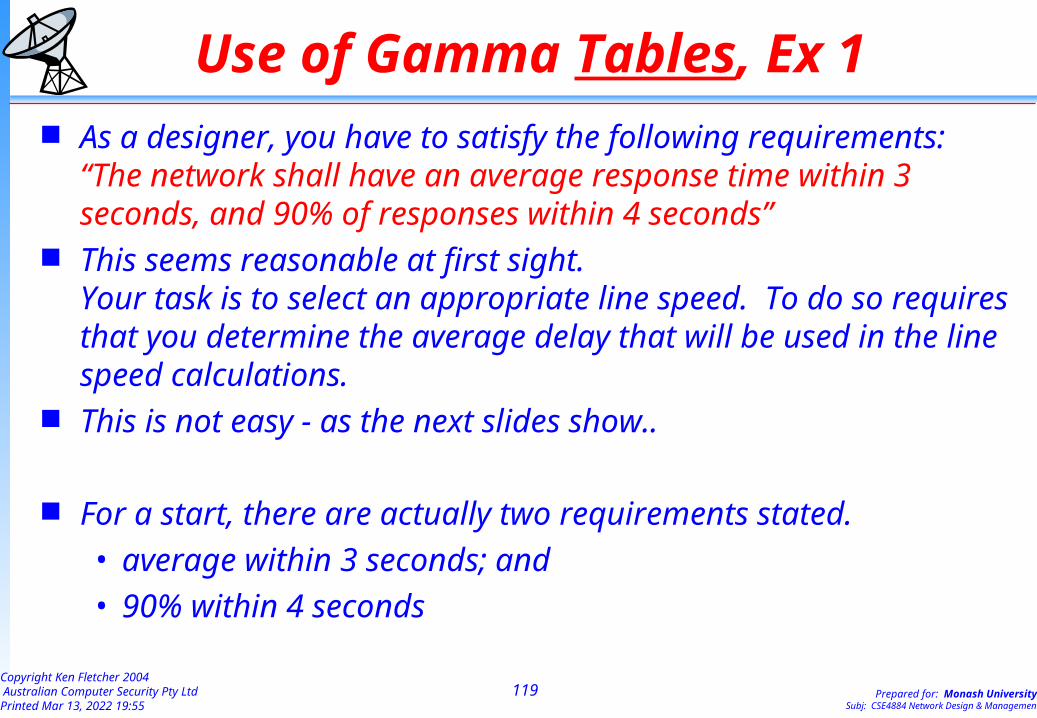
Use of Gamma Tables, Ex 1 As a designer, you have to satisfy the following requirements:
“The network shall have an average response time within 3 seconds, and 90% of responses within 4 seconds”
This seems reasonable at first sight. Your task is to select an appropriate line speed. To do so requires that you determine the average delay that will be used in the line speed calculations.
This is not easy - as the next slides show..
For a start, there are actually two requirements stated.• average within 3 seconds; and• 90% within 4 seconds
120Copyright Ken Fletcher 2004 Australian Computer Security Pty LtdPrinted Apr 18, 2023 15:53
Prepared for: Monash University Subj: CSE4884 Network Design & Management
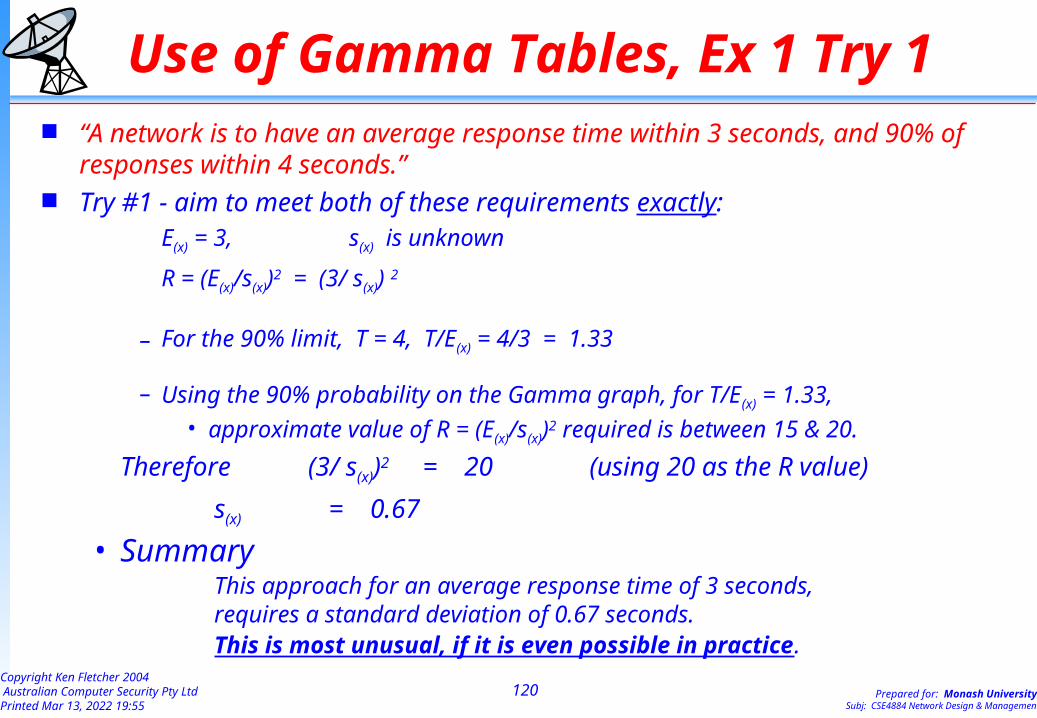
Use of Gamma Tables, Ex 1 Try 1 “A network is to have an average response time within 3 seconds, and 90% of
responses within 4 seconds.” Try #1 - aim to meet both of these requirements exactly:
E(x) = 3, s(x) is unknown
R = (E(x)/s(x))2 = (3/ s(x)) 2
– For the 90% limit, T = 4, T/E(x) = 4/3 = 1.33
– Using the 90% probability on the Gamma graph, for T/E(x) = 1.33, • approximate value of R = (E(x)/s(x))2 required is between 15 & 20.
Therefore (3/ s(x))2 = 20 (using 20 as the R value)
s(x) = 0.67
• SummaryThis approach for an average response time of 3 seconds, requires a standard deviation of 0.67 seconds. This is most unusual, if it is even possible in practice.

123Copyright Ken Fletcher 2004 Australian Computer Security Pty LtdPrinted Apr 18, 2023 15:53
Prepared for: Monash University Subj: CSE4884 Network Design & Management
Summary of the 3 approaches In order to meet the requirements of 90% within 4 seconds, and an average
time within 3 seconds, we have calculated three answers, and now include a fourth for comparison:
Avg Time (Seconds)
Std Deviation (Seconds)
Erlangs constant
R
CommentsIs it achievable in practice?
1.75 1.75 1 Yes, but perhaps too pessimistic
2 1.41 2 Better and more realistic. BE CAREFUL
3 0.67 20 Standard deviation is too tightDO NOT USE for network design
3 0 infinity Constant response time is unachievableNetworks do not operate this way
124Copyright Ken Fletcher 2004 Australian Computer Security Pty LtdPrinted Apr 18, 2023 15:53
Prepared for: Monash University Subj: CSE4884 Network Design & Management
Limitations of These Techniques The techniques used here are effective and adequately accurate
for most cases. However:• They are approximations only • They assume random behaviour
ie random arrivals and service times
• They assume infinite memory to store queues
• Use these techniques to gain a feeling for the system, and how the system will behave under various loads

125Copyright Ken Fletcher 2004 Australian Computer Security Pty LtdPrinted Apr 18, 2023 15:53
Prepared for: Monash University Subj: CSE4884 Network Design & Management
Erlang C formula and Call Centres
Call centres are widely used, but the queuing and occupancy issues are rarely appreciated.
Most organisations do not understand the interaction between staffing levels and customer wait times
126Copyright Ken Fletcher 2004 Australian Computer Security Pty LtdPrinted Apr 18, 2023 15:53
Prepared for: Monash University Subj: CSE4884 Network Design & Management
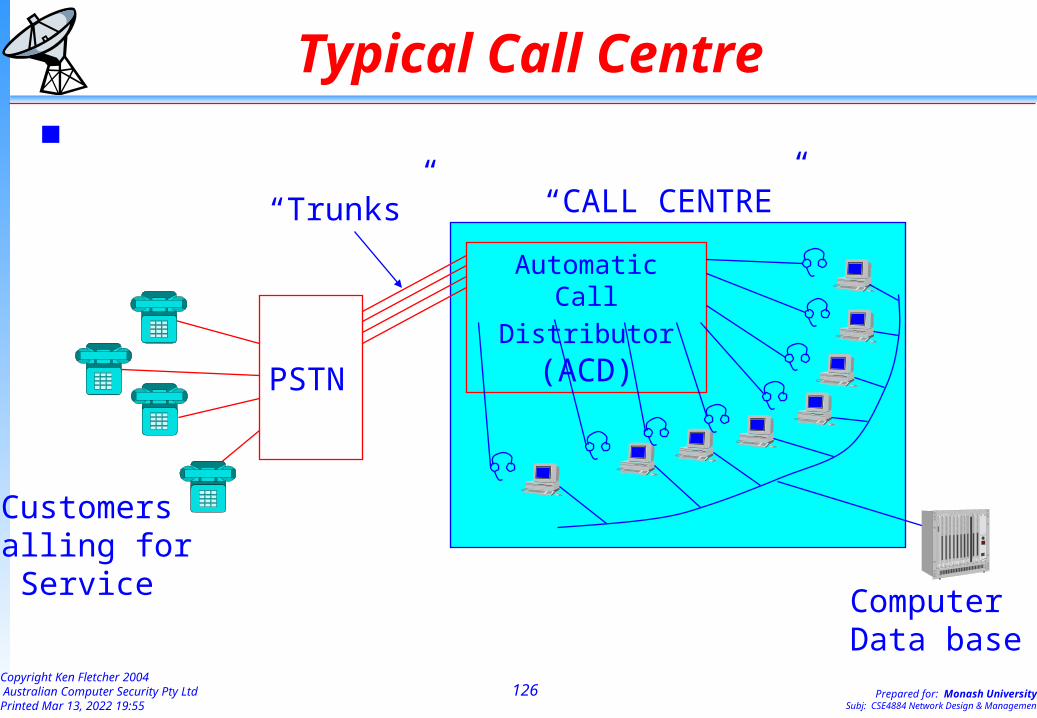
Typical Call Centre
CustomersCalling for
Service
Automatic Call
Distributor (ACD)
PSTN
“Trunks”
ComputerData base
“CALL CENTRE”

127Copyright Ken Fletcher 2004 Australian Computer Security Pty LtdPrinted Apr 18, 2023 15:53
Prepared for: Monash University Subj: CSE4884 Network Design & Management
Call Centres The Call Centre has
• incoming calls from customers/clients • a mechanism to accept the call from the customer, and
distribute it to available operators (ACD or PABX)• operator or ‘agent’ positions, fitted with computers or other
resources to help satisfy customers needs(typically computers and network to database servers)
Incoming calls are accepted and queued (as a single queue) until an operator or ‘agent’ is available• Thus Call Centres are a single queue with multiple servers
128Copyright Ken Fletcher 2004 Australian Computer Security Pty LtdPrinted Apr 18, 2023 15:53
Prepared for: Monash University Subj: CSE4884 Network Design & Management
Call Centres Parameters The significant variables that affect call centre dimensioning
include:• characteristics of input traffic
– variability or randomness of call arrivals– how long the caller is prepared to wait before being served
(Often called “Target Wait Time”)
• characteristics of the service being provided– time taken to service the call,– variability or randomness of service time– time taken between calls for ‘wrap up’ activity, operator rest break etc
The concept of ‘occupied capacity’ applicable to both trunks and operators is important...
134Copyright Ken Fletcher 2004 Australian Computer Security Pty LtdPrinted Apr 18, 2023 15:53
Prepared for: Monash University Subj: CSE4884 Network Design & Management
Erlang C Assumptions and Limitations Erlang C assumes:
– Random (Erlang-1) traffic arrivals– Random (Erlang-1) service times– First-in/first-out (FIFO) queue discipline– All traffic waiting will continue to wait until serviced.
Limitations and practicalities– Above assumptions are somewhat conservative in practice, and lead to
an over-capable installation (ie a call centre designed to the formula can usually handle traffic a little better than the formula indicates)
– Various proprietary formulas are used by specialist companiesThese are usually derived from Erlang C, and take into account ‘baulking’ situations where customers discontinue their wait when it is too long
135Copyright Ken Fletcher 2004 Australian Computer Security Pty LtdPrinted Apr 18, 2023 15:53
Prepared for: Monash University Subj: CSE4884 Network Design & Management
Erlang C Implementations Call Centre Managers usually want to know
– Average wait times– Service levels -
percentage of calls answered within target wait times– Agent or operator busy-ness (Agent occupancy - or “Utilisation”)
Calculating using Erlang C formula is difficult and error prone• There are many Erlang C calculators on the Internet
– These usually give a single answer to a specific set of parameters - which is good, but does not teach the relationships between parameters
• ErlangC spreadsheet (available via the subject web page) plots graphs showing relationships over a range of parameter values
Your assignment requires extensive work on ErlangC problems

136Copyright Ken Fletcher 2004 Australian Computer Security Pty LtdPrinted Apr 18, 2023 15:53
Prepared for: Monash University Subj: CSE4884 Network Design & Management
Queuing Theory in Practice
137Copyright Ken Fletcher 2004 Australian Computer Security Pty LtdPrinted Apr 18, 2023 15:53
Prepared for: Monash University Subj: CSE4884 Network Design & Management
Practical Queuing Theory (1) Remember basic ‘single server’ formulas,
as single server queues are the most common case.• Avg Queue Size = (Util / (1-Util)) items• Avg Delay time = (1+qsize) * (service time)• These formulas give conservative but reasonably accurate
approximation for multiple servers provided that utilisation is less than 50%
Generally don’t plan for more than 30 to 50 per cent utilisation for single server queues.
– Check the graphs to see where multiple server queues turn around the ‘knee’ and always stay below that limit.
– Drawing a line from the 50% utilisation of a single server to the 100 per cent mark on the X axis gives a conservative upper limit for the multiple server curves.
139Copyright Ken Fletcher 2004 Australian Computer Security Pty LtdPrinted Apr 18, 2023 15:53
Prepared for: Monash University Subj: CSE4884 Network Design & Management
Practical Queuing Theory (3) Call Centres are a case of
‘single queue with multiple servers’
Use the traditional queuing theory graphs when dealing with communications equipments or single server queues
Use Erlang C formula (spreadsheet and graphs) for single queue with multiple servers
Both sets of formulas can be useful in other domains - eg– Bank queues, Supermarket queues, Ticket sales queues etc– Printing queues– ISP customer port estimates

140Copyright Ken Fletcher 2004 Australian Computer Security Pty LtdPrinted Apr 18, 2023 15:53
Prepared for: Monash University Subj: CSE4884 Network Design & Management
Practical Queuing Theory (4) Use these techniques in ‘trade off’ studies.
There are some 30 graphs available in the James Martin texts, which cover many other aspects, such as probability of queues exceeding certain sizes.
Remember that for all practical purposes, doubling the line speed of a busy line (eg 60% utilisation) reduces delays to about 1/3rd of the original, and costs about 30% more
However, doubling the load on a busy line (anything above 35% to 40% utilisation) will probably cause system failure due to overload.
141Copyright Ken Fletcher 2004 Australian Computer Security Pty LtdPrinted Apr 18, 2023 15:53
Prepared for: Monash University Subj: CSE4884 Network Design & Management
Queues and Psychology Users expect perceived small tasks to be performed more quickly
than perceived larger tasks
Non linear response times cause problems, eg doubling the load of a lightly loaded line usually trebles the response time.
Variability of response times upsets people– Consistent or constant times (even if somewhat poor) are more
acceptable than wide variations which are sometimes excellent and sometimes very poor.
– Bad response times or unusual delays frustrate users, who often aggravate the problem by making multiple requests for service, or by trying other commands etc.
142Copyright Ken Fletcher 2004 Australian Computer Security Pty LtdPrinted Apr 18, 2023 15:53
Prepared for: Monash University Subj: CSE4884 Network Design & Management
Queueing Theory Summary Mathematical work behind the graphs and spreadsheets is well
proven for the defined situations (eg random traffic etc). – Review this section, using the tools and toys available from the Internet
and the subject web pages to gain an intuitive feeling for network behaviour under load. This is important in understanding user’s reaction to a network.
The strict mathematical approach is not required in practice - using the graphs is accurate enough because:
– In practice, the traffic characteristics and loads that are given as the basis for design work are often little better than guesswork. The actual load is often 50% to 100% more than the customer indicated as the design load
– Traffic loads change (inevitably increase) faster than anticipated.
Simulation approaches are best for complex systems - and the price of simulation software is decreasing steadily.
143Copyright Ken Fletcher 2004 Australian Computer Security Pty LtdPrinted Apr 18, 2023 15:53
Prepared for: Monash University Subj: CSE4884 Network Design & Management
CSE4884 Network Design and Management
Lecturer: Ken Fletcher
Lecture 5
Network Topologies & TypesThis aim of this lecture was to get students thinking about
why some things are the way they are, rather than simply accepting them without thinking.
Along the way we covered some history, and introduced some ideas that may be useful in your future work.
145Copyright Ken Fletcher 2004 Australian Computer Security Pty LtdPrinted Apr 18, 2023 15:53
Prepared for: Monash University Subj: CSE4884 Network Design & Management
Topologies and Types Networks have many possible topologies
• Point to point Styles• Dedicated links
• Inter meshed
• Bus styles
• Broadcast
• Switched Styles• Matrix switching
• Rings and loops
• Hierarchical
• and others - eg hybrid topologies All are based on point-to-point links joining nodes. Inter-action between nodes & ‘data’ provides design flexibility
146Copyright Ken Fletcher 2004 Australian Computer Security Pty LtdPrinted Apr 18, 2023 15:53
Prepared for: Monash University Subj: CSE4884 Network Design & Management
Point-to-Point Links
The basic building blocks
Eg the Lego blocks of networking
148Copyright Ken Fletcher 2004 Australian Computer Security Pty LtdPrinted Apr 18, 2023 15:53
Prepared for: Monash University Subj: CSE4884 Network Design & Management
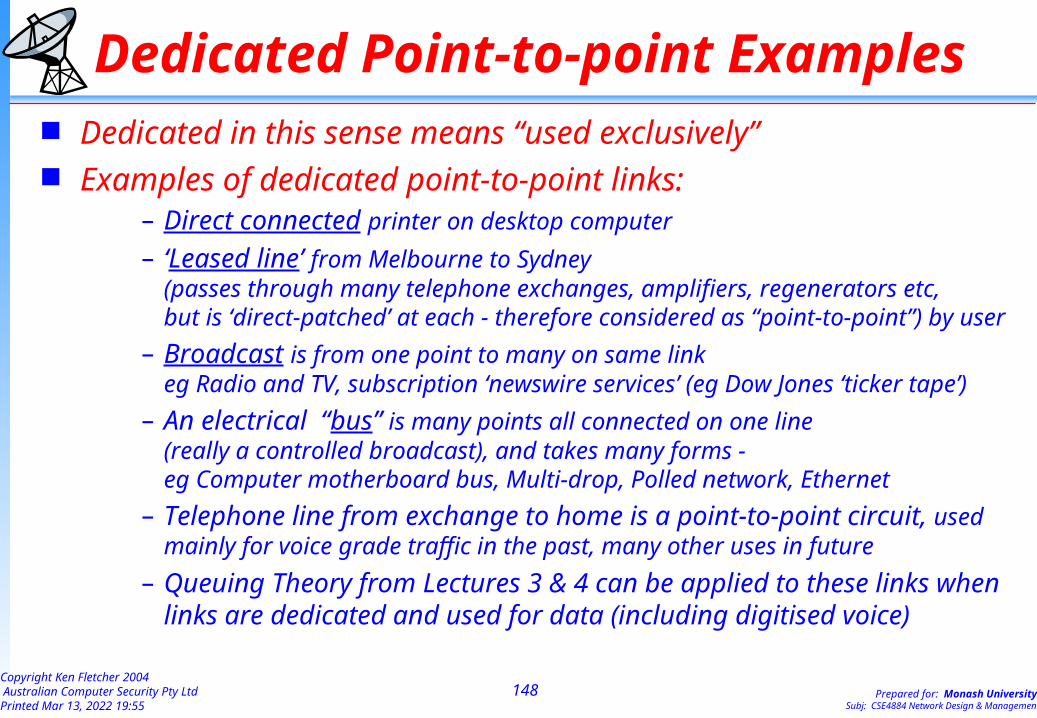
Dedicated Point-to-point Examples Dedicated in this sense means “used exclusively” Examples of dedicated point-to-point links:
– Direct connected printer on desktop computer
– ‘Leased line’ from Melbourne to Sydney (passes through many telephone exchanges, amplifiers, regenerators etc, but is ‘direct-patched’ at each - therefore considered as “point-to-point”) by user
– Broadcast is from one point to many on same linkeg Radio and TV, subscription ‘newswire services’ (eg Dow Jones ‘ticker tape’)
– An electrical “bus” is many points all connected on one line (really a controlled broadcast), and takes many forms - eg Computer motherboard bus, Multi-drop, Polled network, Ethernet
– Telephone line from exchange to home is a point-to-point circuit, used mainly for voice grade traffic in the past, many other uses in future
– Queuing Theory from Lectures 3 & 4 can be applied to these links when links are dedicated and used for data (including digitised voice)

149Copyright Ken Fletcher 2004 Australian Computer Security Pty LtdPrinted Apr 18, 2023 15:53
Prepared for: Monash University Subj: CSE4884 Network Design & Management
Dedicated Point-to-Point Links Traffic may be addressed or unaddressed items
– Addressed traffic is switchable - eg packetised data
– Unaddressed is not, of itself, switchable eg analogue voice
Record formats, lengths and characteristics not constrained Line speed (“bandwidth”) is determined by capability of the circuits
and termination equipment Frequently used as the main trunk routes between nodes in
switched networks– Message switched
– Packet Switched
– Circuit switched
150Copyright Ken Fletcher 2004 Australian Computer Security Pty LtdPrinted Apr 18, 2023 15:53
Prepared for: Monash University Subj: CSE4884 Network Design & Management
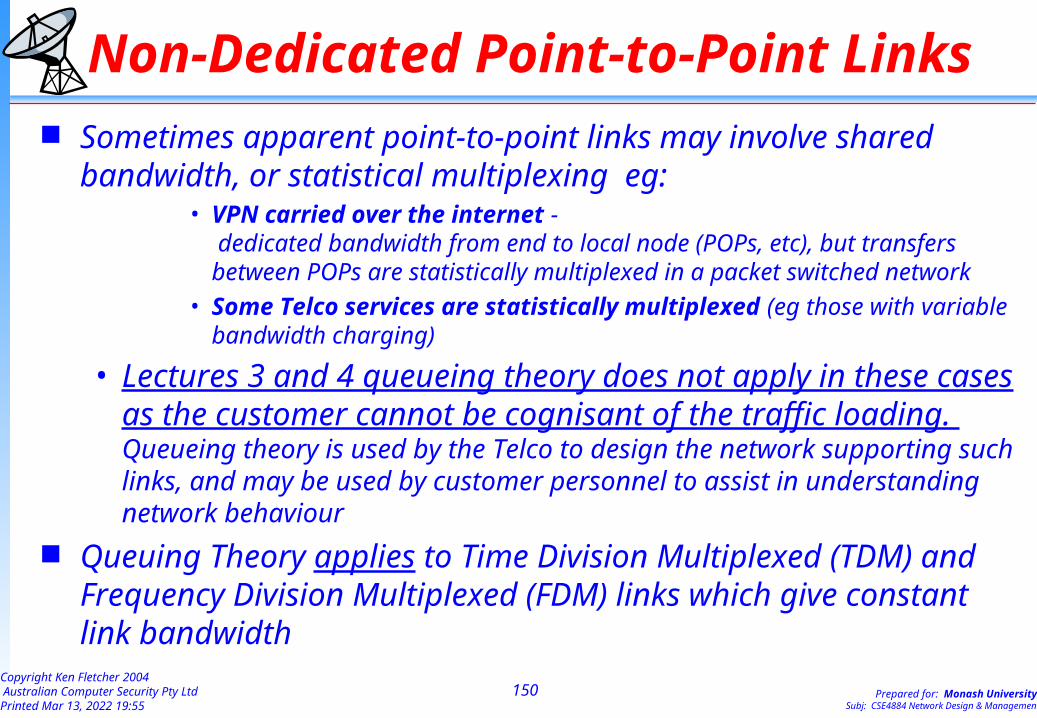
Non-Dedicated Point-to-Point Links Sometimes apparent point-to-point links may involve shared
bandwidth, or statistical multiplexing eg:• VPN carried over the internet -
dedicated bandwidth from end to local node (POPs, etc), but transfers between POPs are statistically multiplexed in a packet switched network
• Some Telco services are statistically multiplexed (eg those with variable bandwidth charging)
• Lectures 3 and 4 queueing theory does not apply in these cases as the customer cannot be cognisant of the traffic loading. Queueing theory is used by the Telco to design the network supporting such links, and may be used by customer personnel to assist in understanding network behaviour
Queuing Theory applies to Time Division Multiplexed (TDM) and Frequency Division Multiplexed (FDM) links which give constant link bandwidth
151Copyright Ken Fletcher 2004 Australian Computer Security Pty LtdPrinted Apr 18, 2023 15:53
Prepared for: Monash University Subj: CSE4884 Network Design & Management
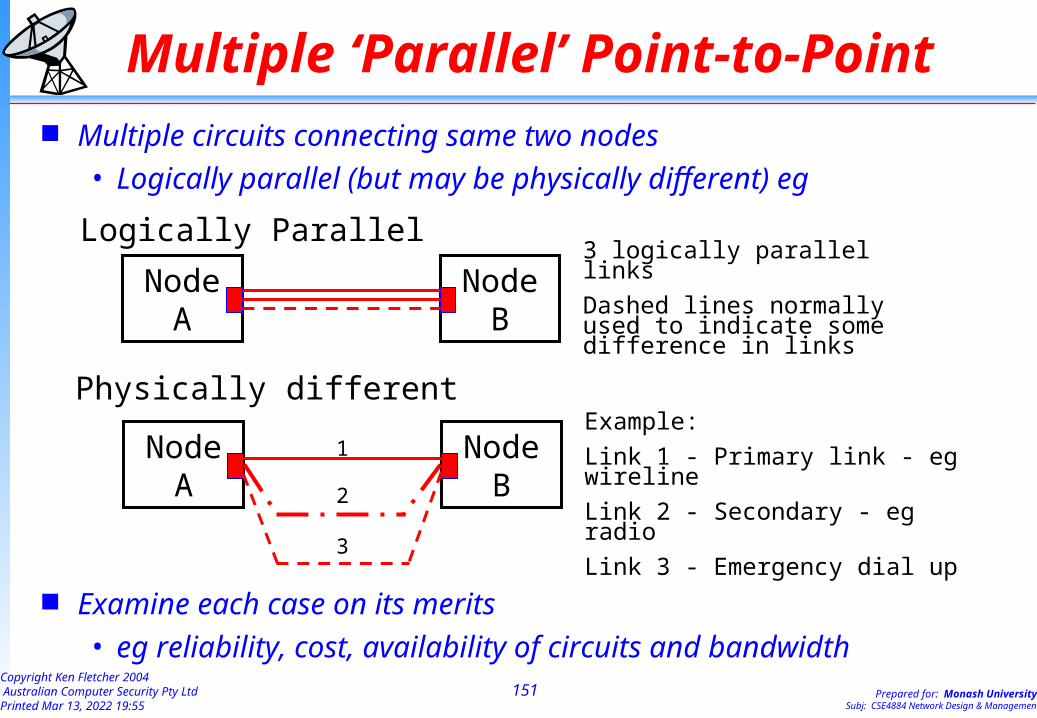
Multiple ‘Parallel’ Point-to-Point Multiple circuits connecting same two nodes
• Logically parallel (but may be physically different) eg
Examine each case on its merits• eg reliability, cost, availability of circuits and bandwidth
Node A
Node B
1
2
3
Physically different
Example:
Link 1 - Primary link - eg wireline
Link 2 - Secondary - eg radio
Link 3 - Emergency dial up
Node A
Node B
Logically Parallel3 logically parallel links
Dashed lines normally used to indicate some difference in links
152Copyright Ken Fletcher 2004 Australian Computer Security Pty LtdPrinted Apr 18, 2023 15:53
Prepared for: Monash University Subj: CSE4884 Network Design & Management
Extending Simple Point-to-Point
“Broadcast”
to disperse widely

154Copyright Ken Fletcher 2004 Australian Computer Security Pty LtdPrinted Apr 18, 2023 15:53
Prepared for: Monash University Subj: CSE4884 Network Design & Management
Broadcast Common Implementations
Radio and TV broadcasting (‘A’ is radio transmitter or cable signal source - B, C, D (and others) are receive only)
Broadcast news services eg ‘Newswire services’ (A is the service provider - B C D are receive only)
Polled networks (A is the master controller - B C D are ‘terminals’ that only transmit in response to polling interrogation from master controller )
Multi-drop networks and Bus networks(A is the master computer - B C D are fundamentally receive only)
Bidding-Contention networks eg Ethernet (All notionally equal, can be prioritised by using differing back-off times)
Node A
Node B
Node C
Node D
155Copyright Ken Fletcher 2004 Australian Computer Security Pty LtdPrinted Apr 18, 2023 15:53
Prepared for: Monash University Subj: CSE4884 Network Design & Management
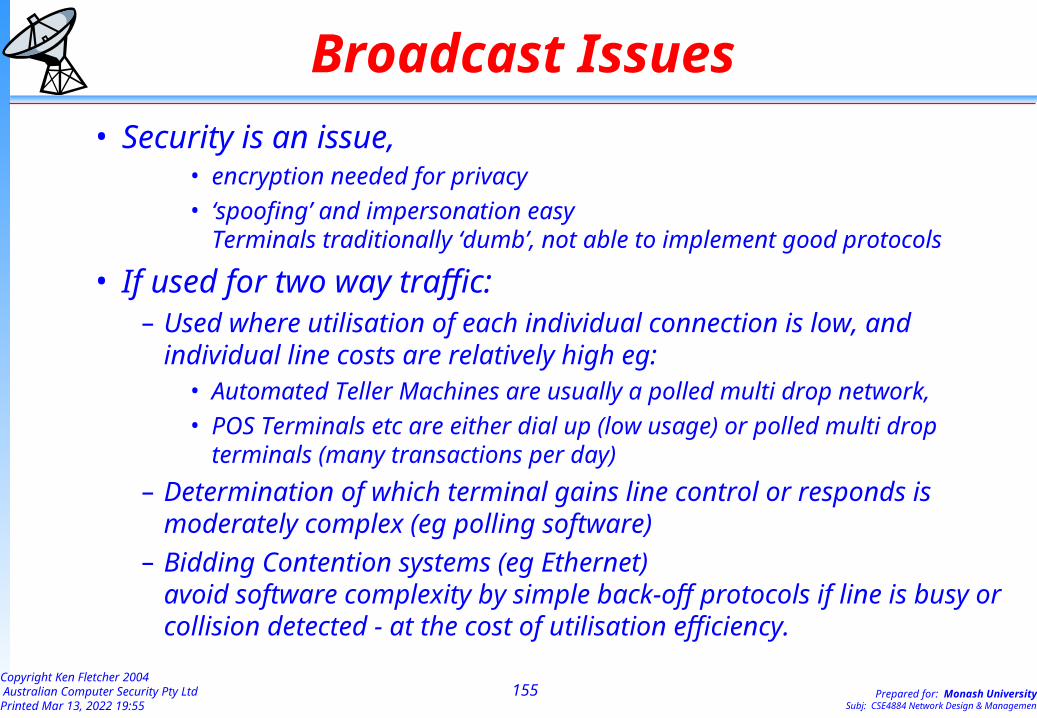
Broadcast Issues
• Security is an issue, • encryption needed for privacy
• ‘spoofing’ and impersonation easy Terminals traditionally ‘dumb’, not able to implement good protocols
• If used for two way traffic:– Used where utilisation of each individual connection is low, and
individual line costs are relatively high eg:• Automated Teller Machines are usually a polled multi drop network,
• POS Terminals etc are either dial up (low usage) or polled multi drop terminals (many transactions per day)
– Determination of which terminal gains line control or responds is moderately complex (eg polling software)
– Bidding Contention systems (eg Ethernet) avoid software complexity by simple back-off protocols if line is busy or collision detected - at the cost of utilisation efficiency.
156Copyright Ken Fletcher 2004 Australian Computer Security Pty LtdPrinted Apr 18, 2023 15:53
Prepared for: Monash University Subj: CSE4884 Network Design & Management
Switched Networks
Inter-action between nodes & ‘data’ provides design flexibility
Traffic may be addressed or unaddressed items– Addressed traffic is switchable - eg packetised data or voice
– Unaddressed traffic is not, of itself, switchable eg analogue voice
157Copyright Ken Fletcher 2004 Australian Computer Security Pty LtdPrinted Apr 18, 2023 15:53
Prepared for: Monash University Subj: CSE4884 Network Design & Management
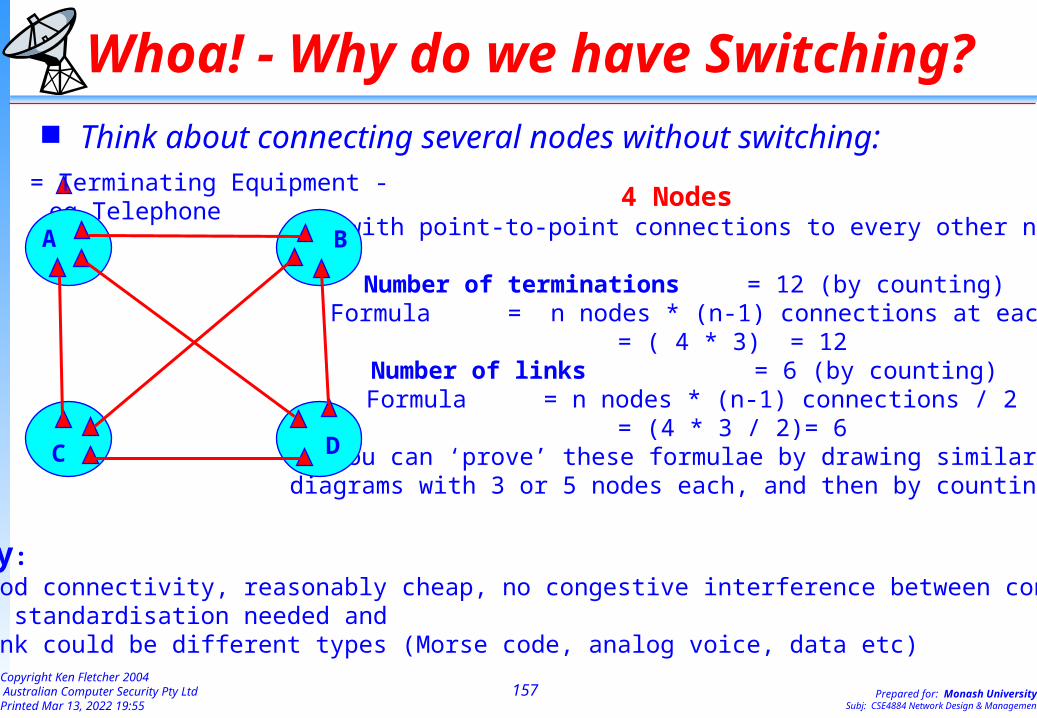
Whoa! - Why do we have Switching? Think about connecting several nodes without switching:
= Terminating Equipment - eg Telephone
4 Nodes all with point-to-point connections to every other node
Number of terminations = 12 (by counting) Formula= n nodes * (n-1) connections at each
= ( 4 * 3) = 12Number of links = 6 (by counting) Formula= n nodes * (n-1) connections / 2
= (4 * 3 / 2)= 6(You can ‘prove’ these formulae by drawing similar
diagrams with 3 or 5 nodes each, and then by counting.)
A
D
B
C
Summary:• Very good connectivity, reasonably cheap, no congestive interference between connections• Minimal standardisation needed and • Each link could be different types (Morse code, analog voice, data etc)
158Copyright Ken Fletcher 2004 Australian Computer Security Pty LtdPrinted Apr 18, 2023 15:53
Prepared for: Monash University Subj: CSE4884 Network Design & Management
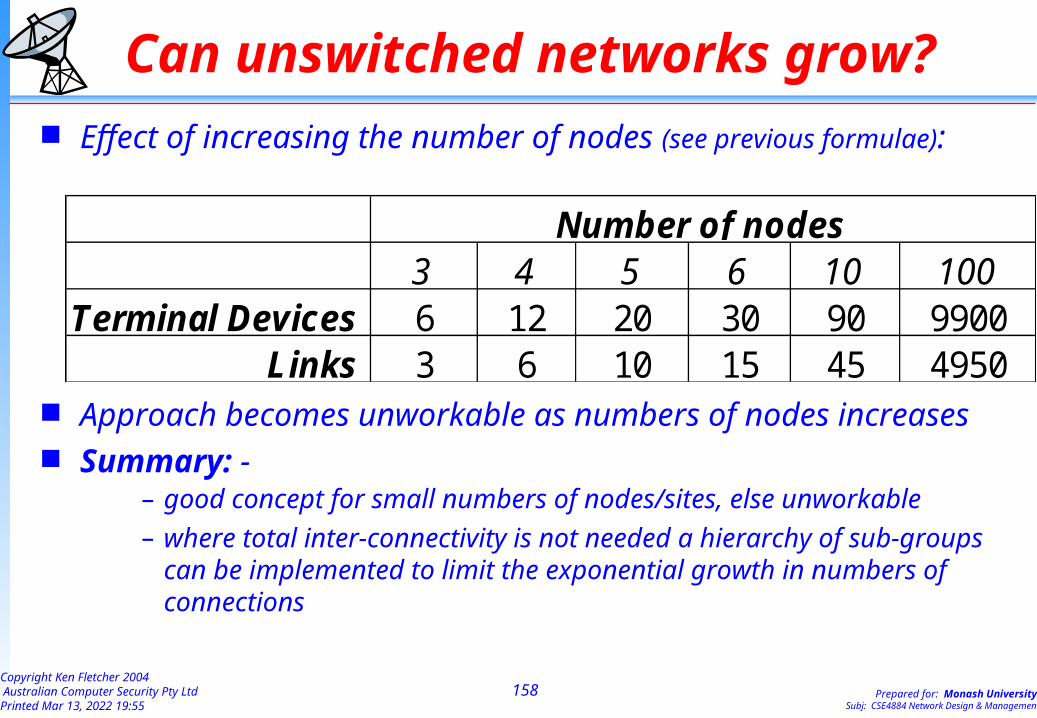
Can unswitched networks grow? Effect of increasing the number of nodes (see previous formulae):
Approach becomes unworkable as numbers of nodes increases Summary: -
– good concept for small numbers of nodes/sites, else unworkable
– where total inter-connectivity is not needed a hierarchy of sub-groups can be implemented to limit the exponential growth in numbers of connections
3 4 5 6 10 100Terminal Devices 6 12 20 30 90 9900
Links 3 6 10 15 45 4950
Number of nodes

162Copyright Ken Fletcher 2004 Australian Computer Security Pty LtdPrinted Apr 18, 2023 15:53
Prepared for: Monash University Subj: CSE4884 Network Design & Management
Switched Networks To switch traffic requires two aspects working together:
– Nodes with switching capability– Something (usually Traffic characteristics) that triggers the node
to switch traffic
Switching nodes:– Circuit Switches eg Telephone exchanges, PABXs– Packet switches eg Routers, ATM Switches etc– Message Switches - eg Email Servers
– Many of the following are switches or have an internal switching aspect to their operation:
• Gateways; firewall and content filters
• Auto Voice Response units (“press 1 for sales, 2 for accounts, 3 for ..”• SOHO ‘multi-function telephone devices - fax, answering machine etc in one unit
163Copyright Ken Fletcher 2004 Australian Computer Security Pty LtdPrinted Apr 18, 2023 15:53
Prepared for: Monash University Subj: CSE4884 Network Design & Management
Switching Triggers Many things may trigger switching, eg
• Data switches:– Packet and message headers (“addressed traffic”)
• Circuit /switches and Pseudo Circuit Switches– Telephone call dialing tones and pulses, – Pilot messages which set up ‘virtual dedicated circuits’
(circuit switches use traffic preamble (dialing tones/pulses, or ‘pilot messages’) to establish the circuit, then traffic switches “unaddressed”)
– SOHO Fax/voice/scanner/printer/ unit uses the presence or absence of fax synchronisation tones to determine if an answered call is voice or fax
• Miscellaneous Something not directly associated with information content of traffic items
– Incoming circuit identification (my home PABX), – Date/time (‘after hours’ switching of telephones in PABX)– Data format etc

166Copyright Ken Fletcher 2004 Australian Computer Security Pty LtdPrinted Apr 18, 2023 15:53
Prepared for: Monash University Subj: CSE4884 Network Design & Management
Message Switching Manual message switching started with the Morse Code
telegraph, and was developed to an art form by the 1970s
Header Body of Message - (50 to 10,000 chars) Trailer
Header contains:• ‘Start of Message’ flag - often “ZCZC”• Message Sequence Number• Recipients Address• Senders Identification• Priority or Precedence• Date and Time Sent etc• end ‘begin text’ flag - usually “BT”
Trailer contains:• ‘End of Message’ flag –
often “NNNN” • followed by about 25 characters which
punched out all paper tape rows
(very obvious to human reader).
Body text was not permitted to contain ‘Start of Message’ or ‘End of Message’ flags
169Copyright Ken Fletcher 2004 Australian Computer Security Pty LtdPrinted Apr 18, 2023 15:53
Prepared for: Monash University Subj: CSE4884 Network Design & Management
Message Switching Issues
• Message Headers & operating procedures human oriented• (1980s message switches began using protocols oriented to computer
based switching)
• 5 Channel paper tape orientation limited character representations (eg 32 character basic set)
• Approx 10000 character limitation per message • Header formats and protocols geared to high line error rates
• (message switching was workable with very poor grade lines - as bad as 3 bits in error per 1000 bits transmitted ie BER = 3 per 1000)
• Excessive delays across multi-hop networks, • Protocols required that an entire message be received at a node before
being forwarded or switched. A 10,000 character message transmitted at 10 char per second took about 12 minutes per hop just for ‘service time’. Handling and queue delays could easily take delay to 2 hours per hop.
A major rethink was needed!
170Copyright Ken Fletcher 2004 Australian Computer Security Pty LtdPrinted Apr 18, 2023 15:53
Prepared for: Monash University Subj: CSE4884 Network Design & Management
Packet Switching History In the early 1950s, the idea was raised of messages using
‘machine oriented’ headers and protocols. By late 1960s, ‘Packet Switching’ was emerging, with concepts of
– 1000 bit packets to reduce both end to end delays and error recovery overheads
– fixed length packets (to reduce software overheads) – automatic breakdown of over-length items to packet sizes– high speeds, even as high as 9600 bps if circuits available – 7 and 8 bit characters to allow for full ASCII/EBCDIC char sets– computer oriented headers/protocols, not manually readable– automated detection and recovery of packets with transmission errors
(garbles) – packet queued for switching as soon as received ‘error free’– “Positive acknowledgments” and receipts (ACKs & NAKs) rather than
the “Implied acknowledgments” of the ‘send and forget’ style

174Copyright Ken Fletcher 2004 Australian Computer Security Pty LtdPrinted Apr 18, 2023 15:53
Prepared for: Monash University Subj: CSE4884 Network Design & Management
Packets and Hops (1) The spreadsheet model ‘Packets and Hops’ shows 5 scenarios
– First as shown on next slide– Then with first hop slow– Then last hop slow– Then middle hop slow– Then two slow hops animated two slides forward from here
Study the spreadsheet and answer the questions yourself
The general formula for delays over multiple hops is shown on a later slide
178Copyright Ken Fletcher 2004 Australian Computer Security Pty LtdPrinted Apr 18, 2023 15:53
Prepared for: Monash University Subj: CSE4884 Network Design & Management
How long does it take?
Total message transfer time of a multi-packet message over a multi hop network is:
– (processing, queueing and service time for all packets of the message) over the ‘slowest’ hop, plus
– one packet service time over each other hop
• In theory, the (queuing time plus service time) for one packet over each other hop should be used, but in practice the service time appears to be more appropriate
See ‘Packets and Hops’ on the ‘Resources’ web page

179Copyright Ken Fletcher 2004 Australian Computer Security Pty LtdPrinted Apr 18, 2023 15:53
Prepared for: Monash University Subj: CSE4884 Network Design & Management
Digital Switching Networks Summary Inter-action between nodes & ‘data’ provides design flexibility
Traffic may be switched from place to place across a network Nodes may be arranged as:
– simple star network• simplest, links may be homogenous or heterogeneous
– hierarchical networks (SNA)• links and protocols usually homogenous (ie “Same Type”),
failure of a nodal point disables all subordinates
– Looped (eg Token Ring, FDDI)• two-way ring raises reliability, at cost of software complexity
– Intermeshed networks• multiple cross links give robustness
• Careful thought is necessary in planning the addressing structure
– Hybrid Networks - multiple types interconnected
182Copyright Ken Fletcher 2004 Australian Computer Security Pty LtdPrinted Apr 18, 2023 15:53
Prepared for: Monash University Subj: CSE4884 Network Design & Management
Summary Point to point link is ‘building block’ for all networks Network flexibility comes from switching capabilities of nodes Nodes normally switch according to information carried in data Network performance limited by congestion at nodes & links
Many topologies and switching styles possible
Packet switching grew from Message Switching experience Overall delay is sum of individual delays Packet switching allows overlaps of delays Total delay = complete transaction over slowest link plus
one packet delay over each other link
Related Documents


![Teori m[PleaseinsertPrerenderUnicode{ø}intopreamble]ter ... · Kasus og verbkongruens i LFG daupja pred daupjan ‘d˝pe 〈subj, obj〉’ subj pers 1 subj num sg ik pred ‘pro’](https://static.cupdf.com/doc/110x72/5e63e9df4bc3df17253e95e0/teori-mpleaseinsertprerenderunicodefintopreambleter-kasus-og-verbkongruens.jpg)

