1 Continuing controversies on Bt cotton in India Revisiting evidence on production, efficiency and employment N.Chandrasekhara Rao Institute of Economic Growth Delhi, India Presentation at the ICABR, 2013 Innovation and policy for the bioeconomy

1 Continuing controversies on Bt cotton in India Revisiting evidence on production, efficiency and employment N.Chandrasekhara Rao Institute of Economic.
Dec 18, 2015
Welcome message from author
This document is posted to help you gain knowledge. Please leave a comment to let me know what you think about it! Share it to your friends and learn new things together.
Transcript

1
Continuing controversies on Bt cotton in India
Revisiting evidence on production, efficiency and employment
N.Chandrasekhara Rao
Institute of Economic Growth
Delhi, India
Presentation at the ICABR, 2013
Innovation and policy for the bioeconomy

Continuing controversies• Committee on agriculture of members of Parliament
• Fresh round of mobilisation by NGOs on Bt cotton
after 1st decade and creative efforts
• Unable to reject turnaround in cotton production
• Other interventions are attributed:
Hybrids, increased irrigation, new pesticide molecules, better germplasm, lower pest populations and Bt effect
• While CSGs on one hand, some research scholars-
Glover (2010 a&b; Stone, 2011, 2012)
2
3
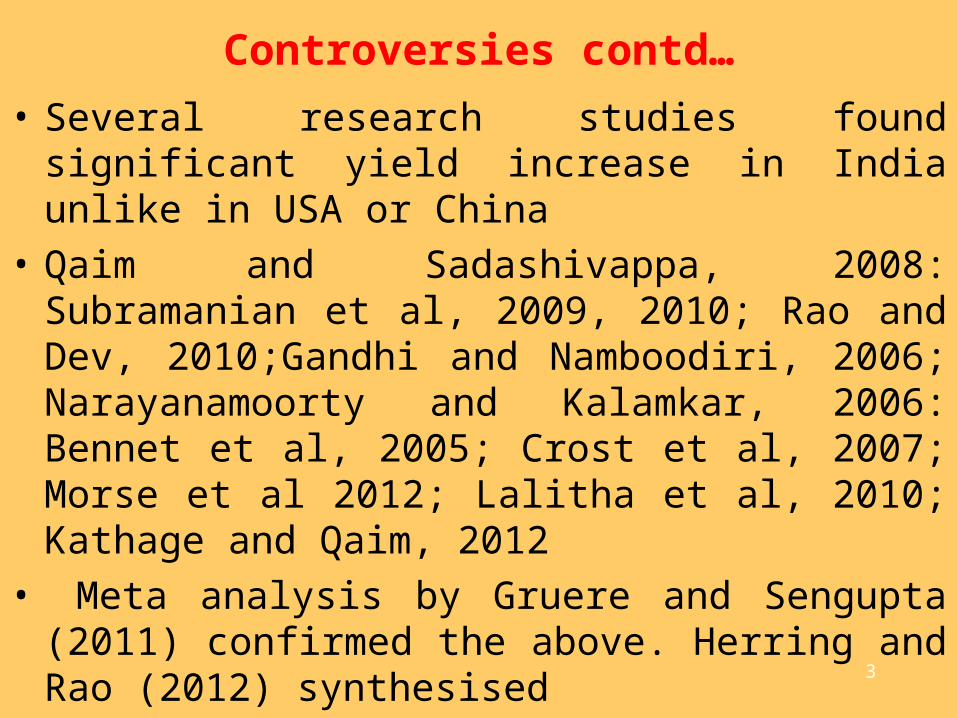
Controversies contd…
• Several research studies found significant yield increase in India unlike in USA or China
• Qaim and Sadashivappa, 2008: Subramanian et al, 2009, 2010; Rao and Dev, 2010;Gandhi and Namboodiri, 2006; Narayanamoorty and Kalamkar, 2006: Bennet et al, 2005; Crost et al, 2007; Morse et al 2012; Lalitha et al, 2010; Kathage and Qaim, 2012
• Meta analysis by Gruere and Sengupta (2011) confirmed the above. Herring and Rao (2012) synthesised
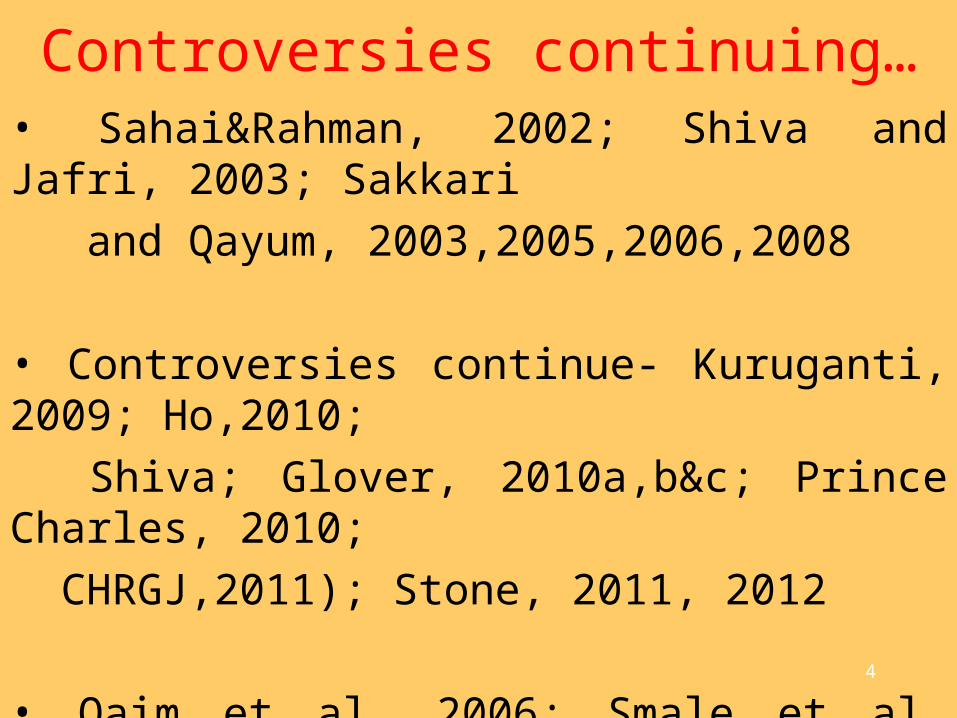
Controversies continuing…• Sahai&Rahman, 2002; Shiva and Jafri, 2003; Sakkari
and Qayum, 2003,2005,2006,2008
• Controversies continue- Kuruganti, 2009; Ho,2010;
Shiva; Glover, 2010a,b&c; Prince Charles, 2010;
CHRGJ,2011); Stone, 2011, 2012
• Qaim et al, 2006; Smale et al, 2009,2012
•2011 Census data on suicides- 16.3/11.1.
• Failure narrative centered on AP & MH
4
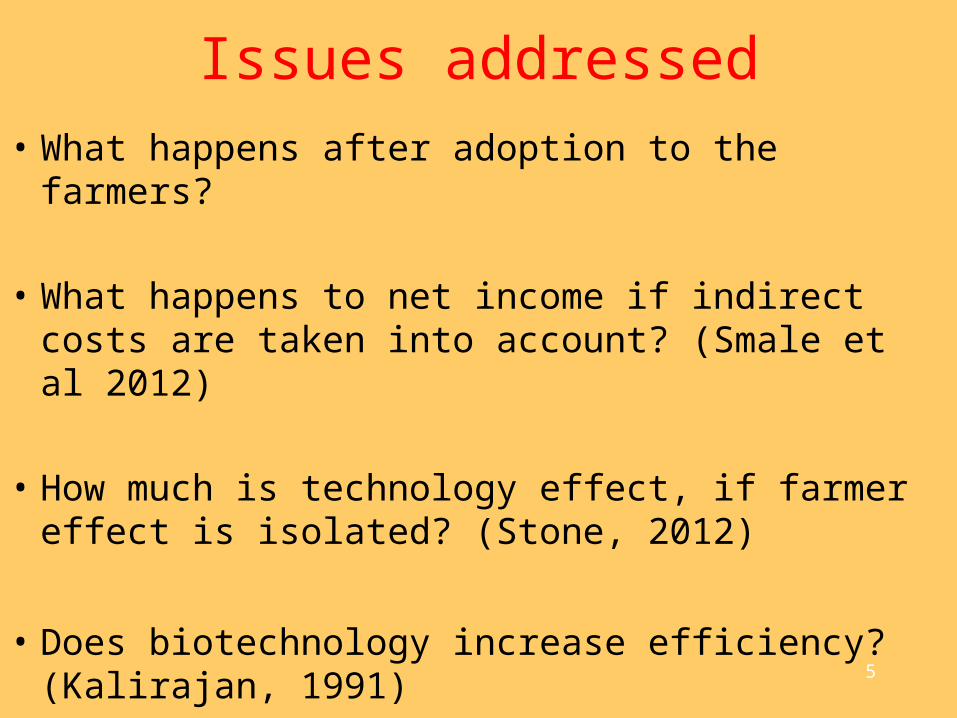
Issues addressed
• What happens after adoption to the farmers?
• What happens to net income if indirect costs are taken into account? (Smale et al 2012)
• How much is technology effect, if farmer effect is isolated? (Stone, 2012)
• Does biotechnology increase efficiency? (Kalirajan, 1991) 5
6
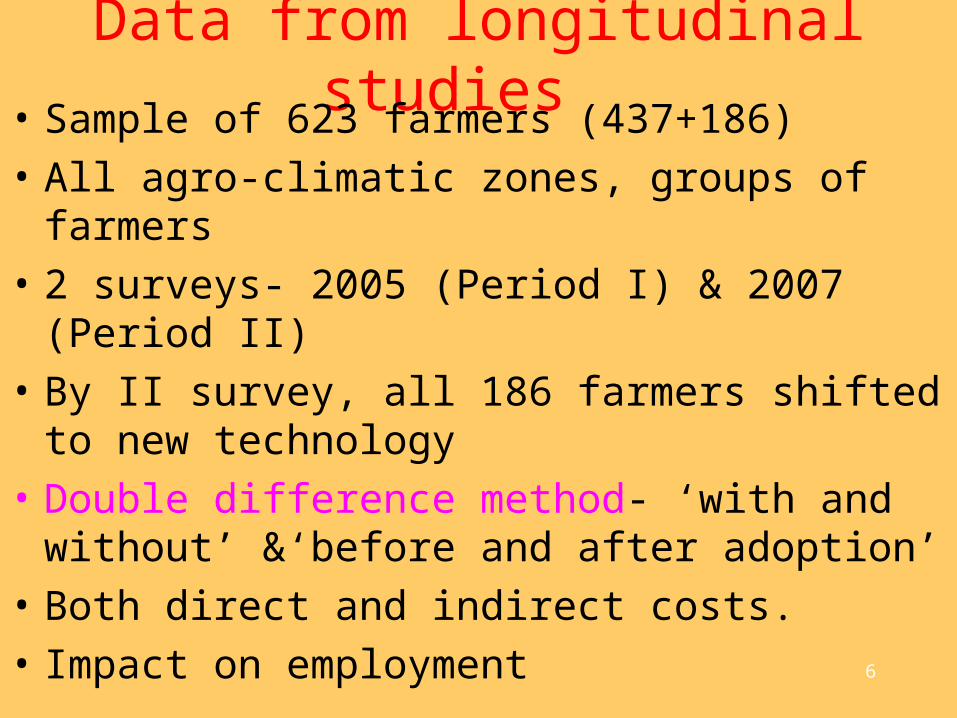
Data from longitudinal studies • Sample of 623 farmers (437+186)
• All agro-climatic zones, groups of farmers
• 2 surveys- 2005 (Period I) & 2007 (Period II)
• By II survey, all 186 farmers shifted to new technology
• Double difference method- ‘with and without’ &‘before and after adoption’
• Both direct and indirect costs.
• Impact on employment
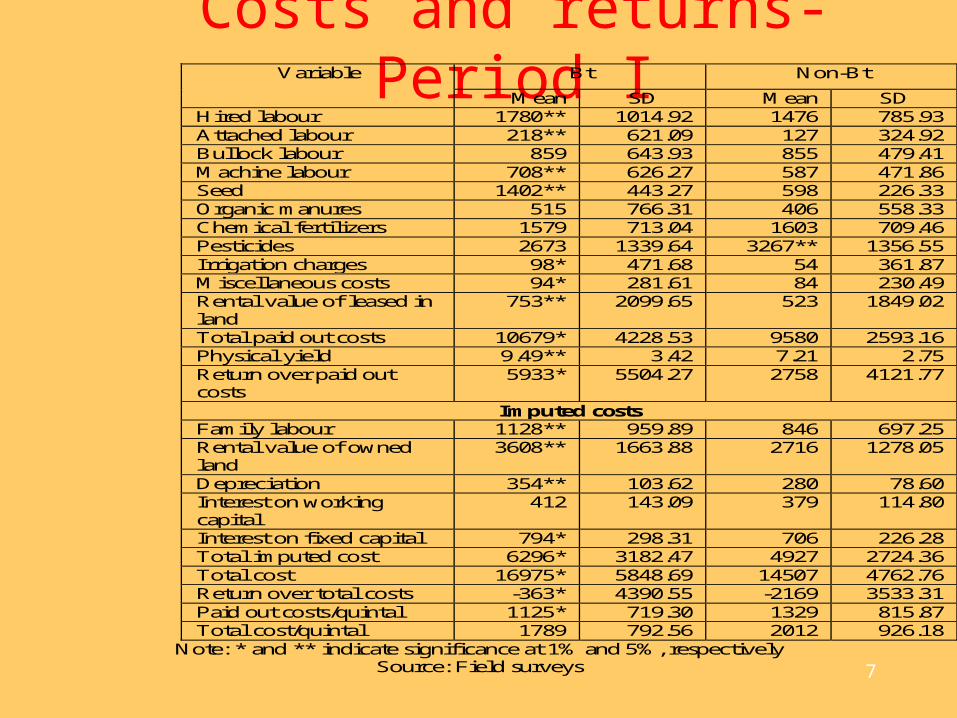
Costs and returns- Period I
7
Variable Bt Non-Bt
Mean SD Mean SD Hired labour 1780** 1014.92 1476 785.93 Attached labour 218** 621.09 127 324.92 Bullock labour 859 643.93 855 479.41 Machine labour 708** 626.27 587 471.86 Seed 1402** 443.27 598 226.33 Organic manures 515 766.31 406 558.33 Chemical fertilizers 1579 713.04 1603 709.46 Pesticides 2673 1339.64 3267** 1356.55 Irrigation charges 98* 471.68 54 361.87 Miscellaneous costs 94* 281.61 84 230.49 Rental value of leased in land
753** 2099.65 523 1849.02
Total paid out costs 10679* 4228.53 9580 2593.16 Physical yield 9.49** 3.42 7.21 2.75 Return over paid out costs
5933* 5504.27 2758 4121.77
Imputed costs Family labour 1128** 959.89 846 697.25 Rental value of owned land
3608** 1663.88 2716 1278.05
Depreciation 354** 103.62 280 78.60 Interest on working capital
412 143.09 379 114.80
Interest on fixed capital 794* 298.31 706 226.28 Total imputed cost 6296* 3182.47 4927 2724.36 Total cost 16975* 5848.69 14507 4762.76 Return over total costs -363* 4390.55 -2169 3533.31 Paid out costs/quintal 1125* 719.30 1329 815.87 Total cost/quintal 1789 792.56 2012 926.18
Note: * and ** indicate significance at 1% and 5%, respectively Source: Field surveys

Costs and returns in Period II
8
Variable Bt Non-Bt Mean SD Mean SD
Hired labour 1790* 1172.79 1337 1094.31 Attached labour 111** 346.64 53 289.52 Bullock labour 816* 626.81 532 485.23 Machine labour 913* 839.62 623 502.95 Seed 909* 423.31 428 267.51 Organic manures 407* 681.00 267 599.39 Chemical fertilizers 1813* 1092.0 1259 681 Pesticides 1811 1609.35 2102** 1806.49 Irrigation charges 52 1864.67 56 1444.38 Miscellaneous costs 100 200.43 118 400.31 Rental value of leased land
698** 110.26 400 98.25
Total paid out costs 9420* 4142.78 7175 4922.54 Physical yield 10.63* 3.66 5.89 3.76 Return over paid out costs
11154 7885.81 3560 6178.89
Imputed costs Family labour 1383* 1028.24 1867 1342.61 Rental value of owned land
4058* 3210.85 2376 1838.64
Depreciation 954* 3024.81 874 3439.85 Interest on working capital
363 144.64 282 156.97
Interest on fixed capital 393 636.21 617 1582.54 Total imputed cost 7151* 4622.54 6016 5050 Total cost 16751* 7175.71 13191 8017.33 Return over total costs 4003* 6493.84 -2456 6725.03 Paid out costs/quintal 886* 2007.11 1218 1394.90 Total cost/quintal 1559* 2136.44 2240 1778.23 Gross income 20754 9129.96 10735 6764.84

Costs and returns after adoption
9
After adoption 2006-07
(Bt)
Before adoption 2004-05
(Non- Bt) Hired labour 1726 1075.28 1476 785.93 Attached labour 67 252.81 127 324.92 Bullock labour 906 672.30 855* 479.41 Machine labour 886* 777.85 587 471.86 Seed 897* 320.74 598 226.33 Organic manures 380 634.77 406** 558.33 Chemical fertilizers 1723*** 691.76 1603 709.46 Pesticides 1599 921.31 3267* 1356.55 Irrigation charges 55 95.98 54 361.87 Miscellaneous costs 88 173.05 84* 230.49 Rental value of leased land
656 1711.20 523 1849.02
Total paid out costs 8983 4098.13 9580* 3593.16 Return over paid out costs
10739* 7303.17 2758 4121.77
Imputed costs Family labour 1456* 997.99 846 697.25 Rental value of owned land
4091* 2606.07 2716 1278.05
Depreciation 797* 2548.51 280 78.60 Interest on working capital
346 102.40 379 114.80
Interest on fixed capital
383 590.44 706 226.28
Total imputed cost 7073* 3639.42 4927 2724..6 Total cost 16056** 5084.71 14507 4762.76 Physical yield 10.27* 3.70 7.21 2.75 Return over total costs
3666 6248.99 -2169 3533.31
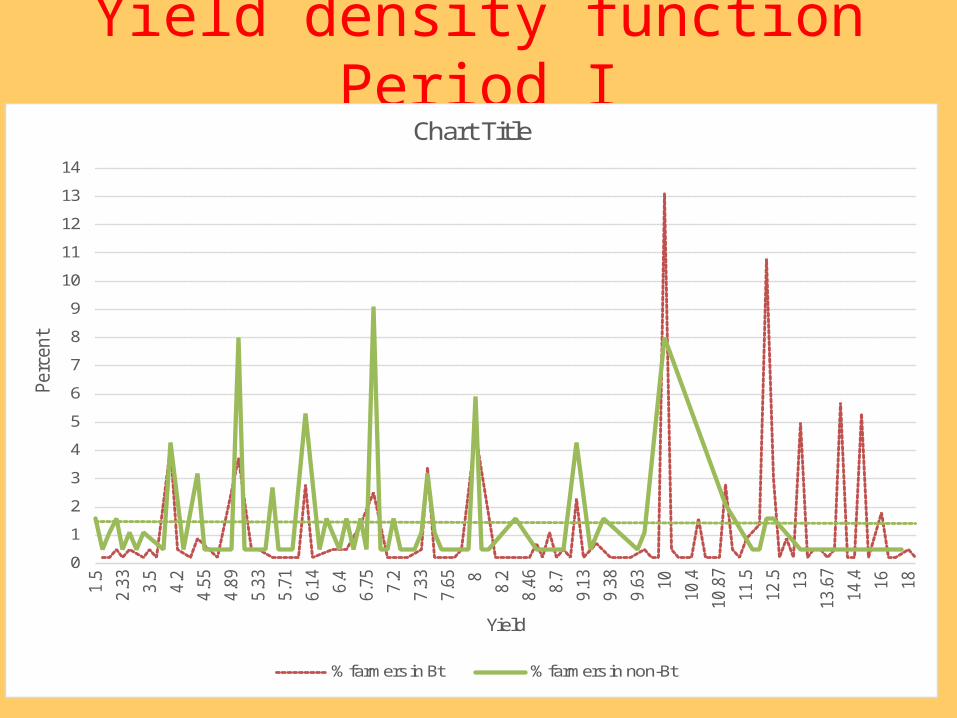
Yield density function Period I
10
0
1
2
3
4
5
6
7
8
9
10
11
12
13
14
1.5
2.33 3.5
4.2
4.55
4.89
5.33
5.71
6.14 6.4
6.75 7.2
7.33
7.65 8
8.2
8.46 8.7
9.13
9.38
9.63 10
10.4
10.8
7
11.5
12.5 13
13.6
7
14.4 16 18
Perc
ent
Yield
Chart Title
% farmers in Bt % farmers in non-Bt

Yield density function in Period II
11
0
2
4
6
8
10
12
0.25
0.83
1.43
2.17
2.67
3.33 4
4.36 4.
85.
4 66.
43 77.
58.
18.
48.
759.
339.
7510
.33
10.6
3
11.1
411
.511
.83
12.2
512
.75
13.0
813
.67
14.3
314
.71
15.3
316
.25
17.5 21
Perc
ent
Yield
Bt
Non-Bt
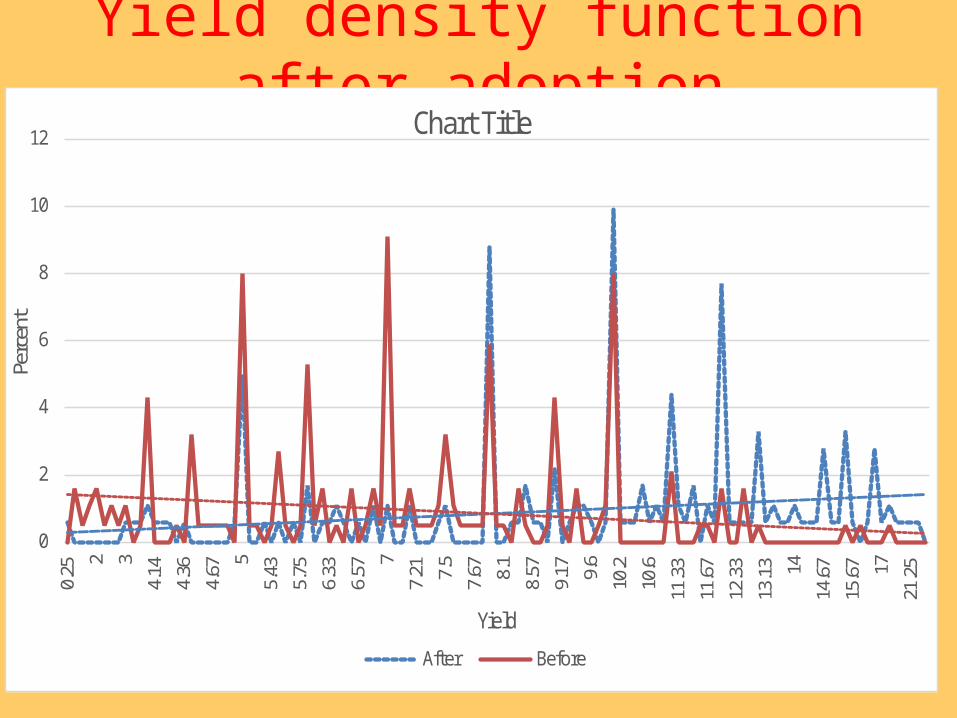
Yield density function after adoption
12
0
2
4
6
8
10
12
0.25 2 3
4.14
4.36
4.67 5
5.43
5.75
6.33
6.57 7
7.21 7.
57.
67 8.1
8.57
9.17 9.
610
.210
.611
.33
11.6
712
.33
13.1
3 1414
.67
15.6
7 1721
.25
Perc
ent
Yield
Chart Title
After Before

Fixed effects model• Endogeneity problem in yield estimates if the
explanatory variables are correlated with error term
• Socioeconomic variables of farm level variables
• Unobserved heterogeneity causing self selection bias
Yit = α + xit β +δit + γt+(ci +uit)
Yit = Physical output in qtls/ac of farmer ‘i’ in period ‘t’
ci -impact of socioeconomic & farm level characteristics
γt -season specific production shocks; δit- Bt dummy
Uit - idiosyncratic disturbance; xit-variables influencing output
13

Panel data fixed effects model for yield
14
Pooled model Fixed effects Coefficient SE Coefficient SE
Constant 1.116*** 0.208 1.1***
0.232 2006 dummy -0.089***
0.023 -0.013
0.026 Inputs Bt dummy 0.401***
0.026
0.263***
0.046 Seeds (Rs/acre) 0.022***
0.007 -0.006
0.012 Fertilisers Rs/acre 0.016
0.01
0.051***
0.019 Pesticides (Rs./acre) 0.008***
0.003 0.013**
0.007 Irrigation (Rs./acre) 0.002*
0.001 0.004***
0.001 Labour (Rs./acre) 0.068***
0.015 0.058***
0.021 Household characteristics Age in years -0.007
0.042 Experience in years 0.016
0.024
Education in years 0.001
0.001 Community dummy 0.009
0.025
Irrigation dummy 0.117***
0.023 Warangal dummy -0.111***
0.034 Nalgonda dummy -0.316***
0.035 Kurnool dummy -0.245***
0.043 Hausman test 25.52 R2 adjusted 0.36 0.22 ***, **, * indicate statistical significance at 1%, 5% and 10% respectively
Stochastic frontier analysis: Why?• Yield is a partial measure of productivity• Efficiency of using the technology matters for raising production.• Ruttan (1977): Efficiency differentials among farmers disappear in the long-run•Kalirajan (1991) showed time invariance in rice• Xu and Jeffrey (1995) showed TE may even decline with new technology due to socioeconomic factors• Ruttan (1977)&(Hayami 1981) technology per se size neutral•Glover (2010) questions this.
15
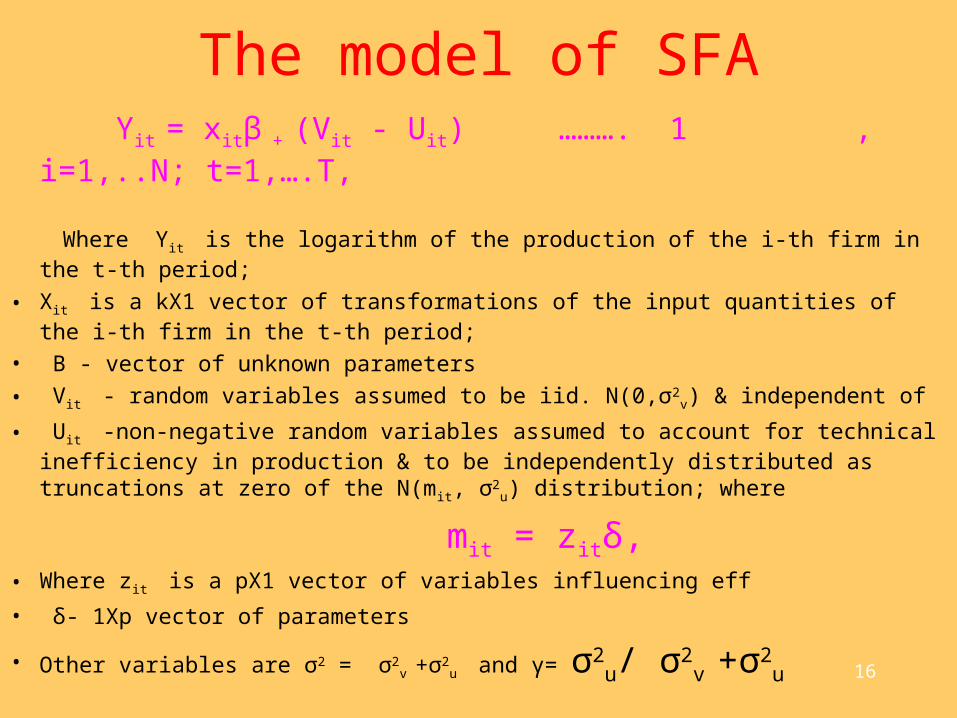
The model of SFA Yit = xitβ + (Vit - Uit) ………. 1 , i=1,..N; t=1,….T,
Where Yit is the logarithm of the production of the i-th firm in the t-th period;
• Xit is a kX1 vector of transformations of the input quantities of the i-th firm in the t-th period;
• Β - vector of unknown parameters
• Vit - random variables assumed to be iid. N(0,σ2v) & independent of
• Uit -non-negative random variables assumed to account for technical inefficiency in production & to be independently distributed as truncations at zero of the N(mit, σ2
u) distribution; where
mit = zitδ,• Where zit is a pX1 vector of variables influencing eff
• δ- 1Xp vector of parameters
• Other variables are σ2 = σ2v +σ2
u and γ= σ2u/ σ2
v +σ2u
16
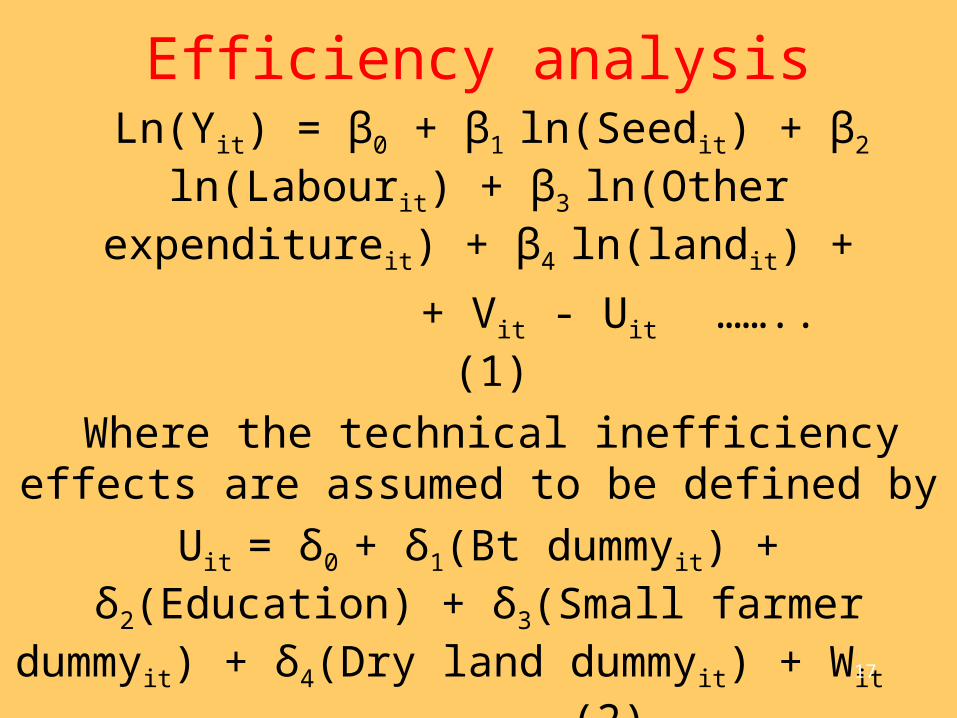
Efficiency analysis Ln(Yit) = β0 + β1 ln(Seedit) + β2 ln(Labour it) + β3
ln(Other expenditureit) + β4 ln(landit) +
+ Vit - Uit …….. (1)
Where the technical inefficiency effects are assumed to be defined by
Uit = δ0 + δ1(Bt dummyit) + δ2(Education) + δ3(Small farmer dummyit) + δ4(Dry land dummyit) + Wit
……………… (2)
17
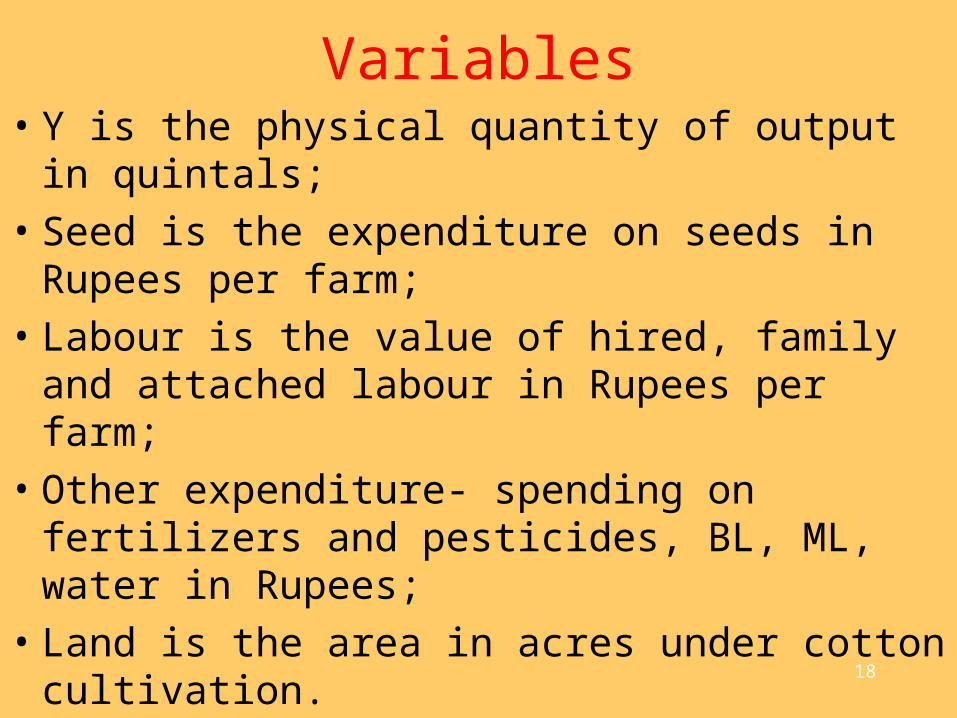
Variables• Y is the physical quantity of output in quintals;
• Seed is the expenditure on seeds in Rupees per farm;
• Labour is the value of hired, family and attached labour in Rupees per farm;
• Other expenditure- spending on fertilizers and pesticides, BL, ML, water in Rupees;
• Land is the area in acres under cotton cultivation.
18
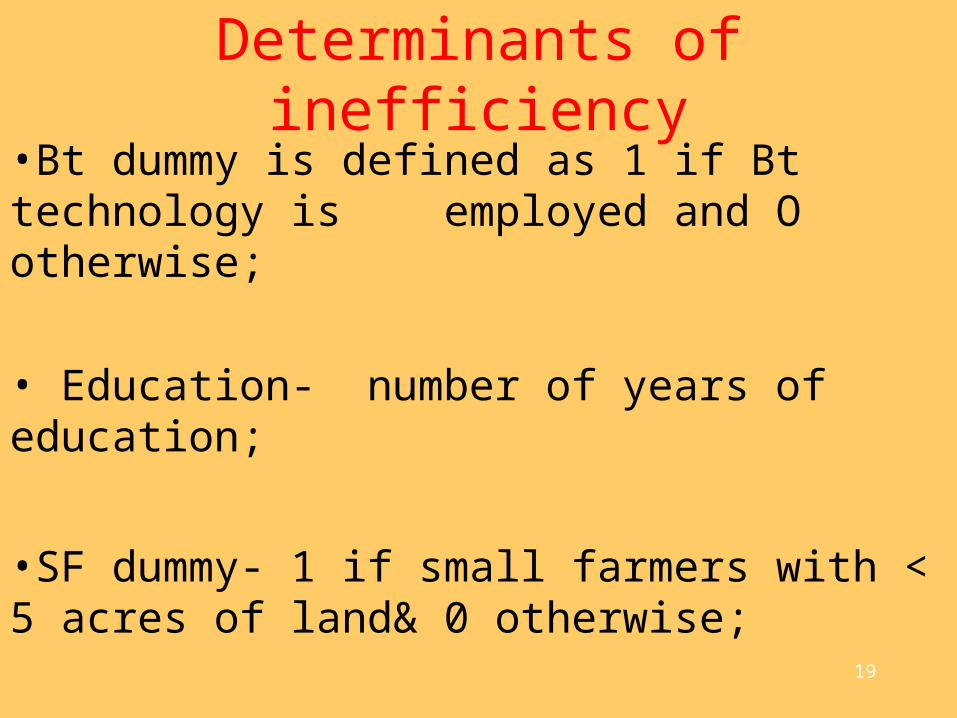
Determinants of inefficiency•Bt dummy is defined as 1 if Bt technology is employed and O otherwise;
• Education- number of years of education;
•SF dummy- 1 if small farmers with < 5 acres of land& 0 otherwise;
•DD dummy- 1 if in semi-arid and scanty rainfall zones and 0 otherwise 19
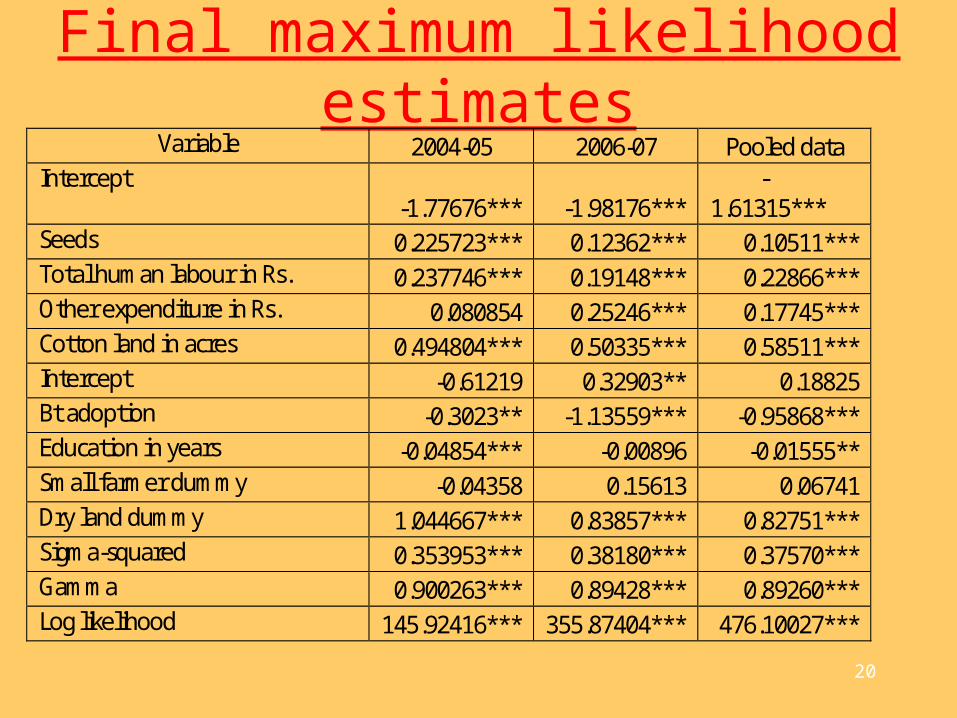
Final maximum likelihood estimates
20
Variable 2004-05 2006-07 Pooled data Intercept
-1.77676*** -1.98176*** -1.61315***
Seeds 0.225723*** 0.12362*** 0.10511*** Total human labour in Rs. 0.237746*** 0.19148*** 0.22866*** Other expenditure in Rs. 0.080854 0.25246*** 0.17745*** Cotton land in acres 0.494804*** 0.50335*** 0.58511*** Intercept -0.61219 0.32903** 0.18825 Bt adoption -0.3023** -1.13559*** -0.95868*** Education in years -0.04854*** -0.00896 -0.01555** Small farmer dummy -0.04358 0.15613 0.06741 Dry land dummy 1.044667*** 0.83857*** 0.82751*** Sigma-squared 0.353953*** 0.38180*** 0.37570*** Gamma 0.900263*** 0.89428*** 0.89260*** Log likelihood 145.92416*** 355.87404*** 476.10027***

Technical efficiency
21
Type of farmers
2004-05 2006-07 Pooled data
Bt Non-Bt
Bt Non-Bt Bt Non-Bt
Small 77.89 71.91 70.56 47.53 73.58 52.89
Non-small 76.89 70.39 75.60 40.33 74.33 50.98
Semiarid 67.63 60.86 63.02 36.54 64.39 42.81
Non-Semiarid 83.16 78.45 80.18 51.53 80.79 58.82
All 76.89 70.73 73.05 45.01 74.06 51.29

22
Benefits across Groups of Farmers in 2004
-40
-20
0
20
40
60
80
100
Pesticides Yield
23
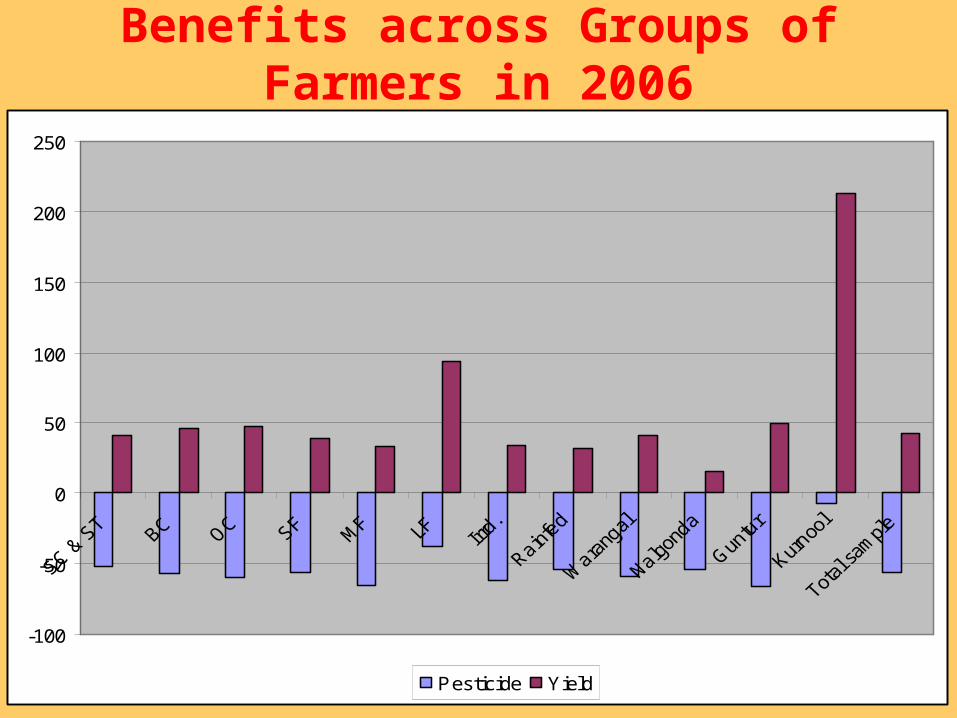
Benefits across Groups of Farmers in 2006
-100
-50
0
50
100
150
200
250
Pesticide Yield

24
Human Labour Utilisation- 2004 & 2006
Item Bt Cotton Non-Bt Cotton 2004-05
Male 21.49* 18.82 Female 62.92** 51.33 Children 5.71* 3.82 Total man-days equivalent
66.29** 54.95
After Adoption Male (Days) 18.20 18.82 Female (Days) 53.45 51.33 Children (Days) 0.67 3.82 Total man-days equivalent
54.16 54.95
25
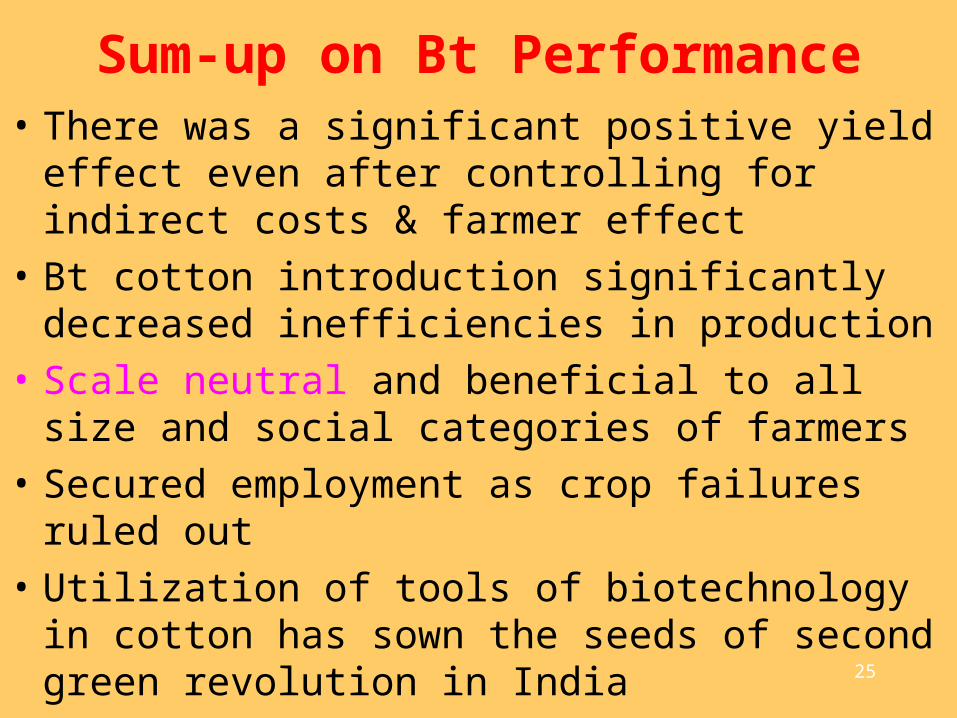
Sum-up on Bt Performance• There was a significant positive yield effect even
after controlling for indirect costs & farmer effect
• Bt cotton introduction significantly decreased inefficiencies in production
• Scale neutral and beneficial to all size and social categories of farmers
• Secured employment as crop failures ruled out
• Utilization of tools of biotechnology in cotton has sown the seeds of second green revolution in India

26
THANK YOU
Related Documents