1 Clean Cities & Fuel Economy David Greene Oak Ridge National Laboratory Clean Cities Fuel Economy Webcast February 16, 2005

1 Clean Cities & Fuel Economy David Greene Oak Ridge National Laboratory Clean Cities Fuel Economy Webcast February 16, 2005.
Jan 01, 2016
Welcome message from author
This document is posted to help you gain knowledge. Please leave a comment to let me know what you think about it! Share it to your friends and learn new things together.
Transcript

1
Clean Cities&
Fuel Economy
David GreeneOak Ridge National Laboratory
Clean Cities Fuel Economy Webcast
February 16, 2005
Our transportation system remains petroleum dependent.
U.S. Transportation Energy Use, 1950-2000
0
5000
10000
15000
20000
25000
30000
1950 1960 1970 1980 1990 2000
Th
ou
sa
nd
s o
f b
arr
els
pe
r d
ay
Other
Petroleum
More than half (56%) of that oil is imported.
U. S. Petroleum Production and Net Imports1950-2003
0
5
10
15
20
25
1950 1960 1970 1980 1990 2000
Mill
ion
s o
f B
arre
ls p
er D
ay
Imports
Production

Transportation consumes for 2/3 of U.S. petroleum.
Petroleum Use by End Use Sector
0
5
10
15
20
25
1973 1978 1983 1988 1993 1998 2003
Mill
ion
s o
f B
arr
els
pe
r D
ay
Utilities
Industrial
Commercial
Residential
Percentage
Transportation
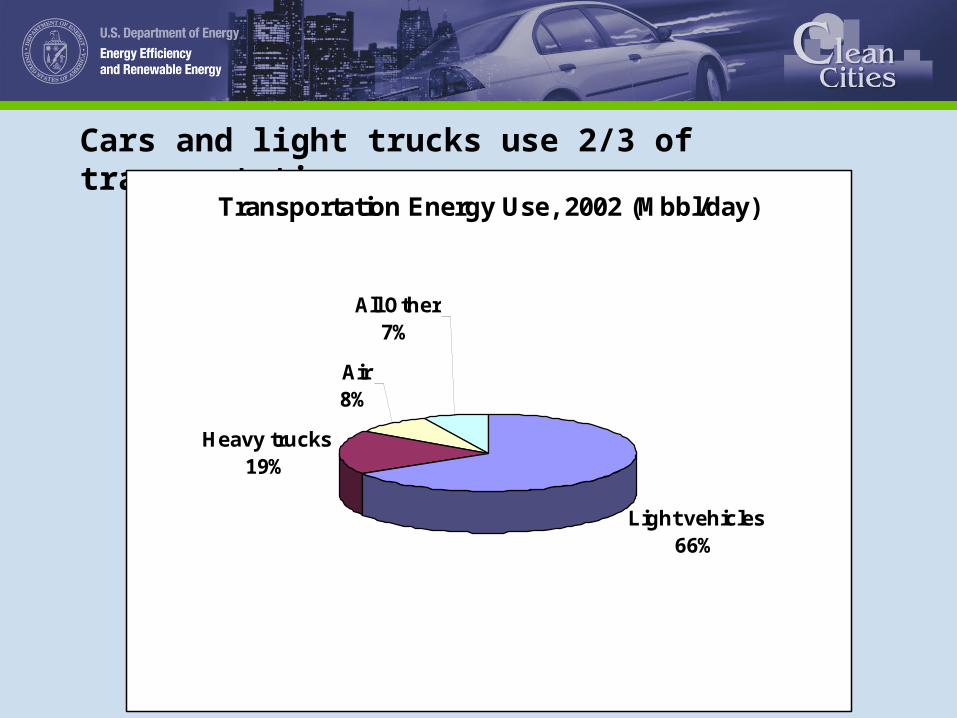
Cars and light trucks use 2/3 of transportation energy.
Transportation Energy Use, 2002 (Mbbl/day)
Light vehicles66%
Air8%
All Other7%
Heavy trucks19%

Every 1% increase in fuel economy saves 85,000 barrels of petroleum per day and 1.3 million tons of CO2 per year.
• Motorist behavior– Driving tips: can save up to 10%– Maintenance: can save 5% or more
• Vehicle choice– 1 MPG is a 4% improvement– Encourage consumer demand for fuel efficient technology
• Over 4 million user sessions in 2004• How many reached via web, print, & TV?• How have we affected their decisions?• We will present our estimates at the CC
Conference

4 million users visited fueleconomy.gov in MY 2004. Our goal: 10 million/yr by 2008.
User Sessions on www.fueleconomy.gov
0.0
1.0
2.0
3.0
4.0
5.0
6.0
7.0
8.0
9.0
Use
r S
essi
on
s p
er Y
ear
(mill
ion
s)
MY 2000MY 2001 MY 2002
MY 2003
MY 2004
MY 2005

Key to our success to date has been active promotion of fueleconomy.gov and the Guide.
Website
Indirect- On-line media- Print media- MotorWeek-TV affiliates- CC projects
Fuel Economy Guide
Promotion
Consumers
PurchaseUse
FuelSavings

An incomplete count of media links shows their importance.
National Internet News Sites (includes Yahoo, MSN, Wired.com, etc) 35
National Newspaper (e.g. NY Times, USA Today, Washington Post) 91
Local Newspapers 141
College and Alternative Newspapers 8
National Television Web Sites (CNN, CBS, PBS) 14
Local TV News Sites 61
Radio Web Sites 3
On-line Magazines 37
Automotive News and Web Sites 37
Miscellaneous Newsletters (AAA, Credit Unions, Industry Sites, Environmental Sites, etc.)
98
State and Federal Government 43
International News 7

Over 140 national newspaper, TV and radio web sites linked to fueleconomy.gov in 2004/2005.

Magazines use our web content and also publish our URL.

Our most popular feature, side-by-side comparisons allow users to find the cleanest, most fuel efficient vehicles that meet their needs…like the new Ford Escape Hybrid.
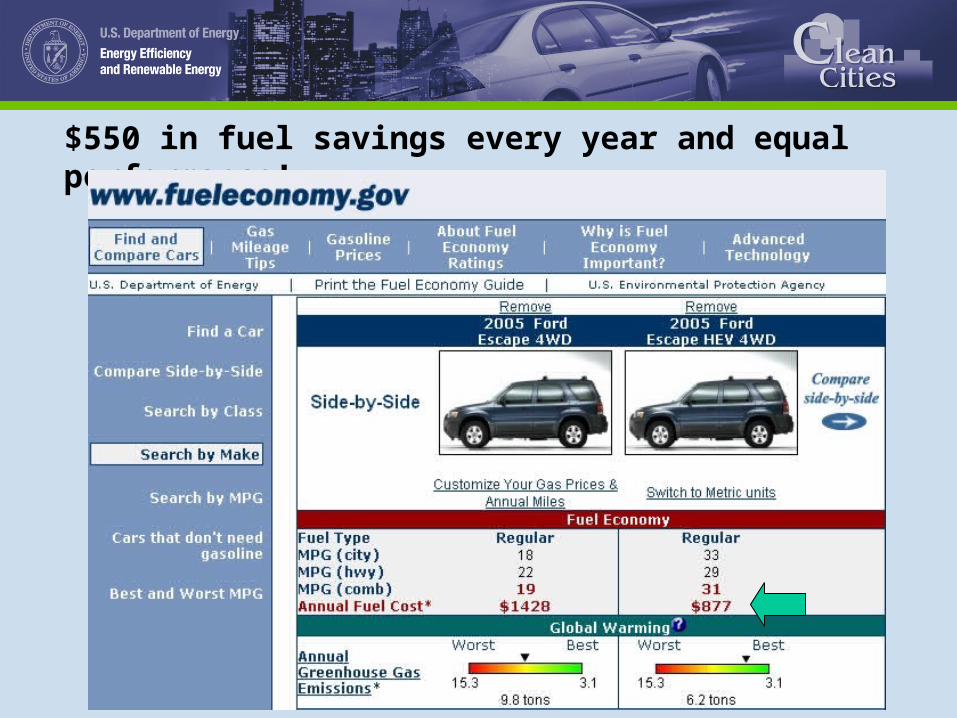
$550 in fuel savings every year and equal performance!

We have expanded and enhanced our Hybrid Vehicle section.
• Side-by-side comparison of available hybrids
• News on available and upcoming hybrids
• How HEVs work• HEV animation• Tax incentives• HEV Links

Our HEV Animation illustrates how different types of hybrids work.• Shows energy flow
among components for different driving modes
• Three types– Hybrid– Full– Stop/Start
• Up to six driving modes per vehicle
• Includes description of HEV components View Animation

#1 Question: Why doesn’t my car get the EPA-rated MPG?
• How Vehicles are Tested
• Fuel Economy Test Schedules
• Why MPG estimates are not available for bigger trucks and SUVs

“Your MPG” will launch March 1, 2005

Your MPG helps users:
• Calculate and track their fuel economy
• Compare their MPG to EPA’s test ratings
• Share their experience with others
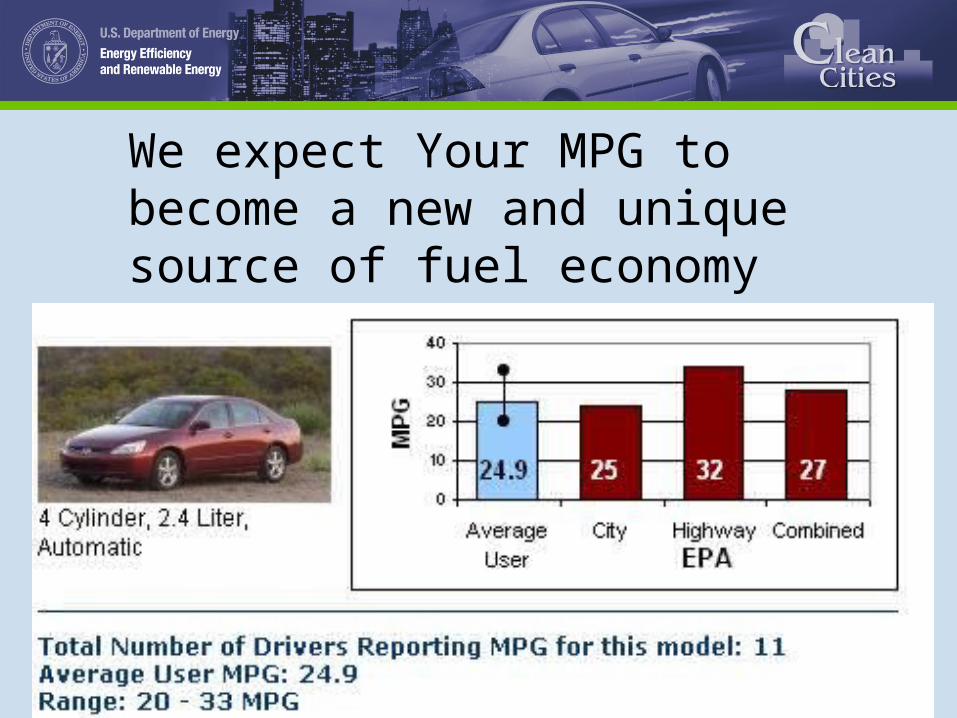
We expect Your MPG to become a new and unique source of fuel economy information.

UC Davis completed a groundbreaking study of fuel economy and household vehicle purchase decisions that points the way to more effective marketing.
• Households do not directly estimate the value of fuel savings.– Annual fuel costs are unfamiliar– Consumers know the cost of a tank of gas
• For most,– Fuel economy = small, cheap– Energy efficiency = high tech, quality
• Hybrid buyers more interested in environmental lifestyle than saving fuel.
• More than half of households know their vehicles’ fuel economy (Your MPG!).
• Financial support of Energy Foundation was essential.

In the future, consumers will have more and more high-tech, fuel-efficient options.• No compromise fuel efficient hybrids
– Max efficiency (Prius, Escape)– Power + efficiency (Lexus, Accord)
• Clean diesels that meet emissions standards with 30-50% better MPG and more torque
• Displacement-on-Demand offering 10% more MPG with no change in performance
• Stop-Start systems boosting fuel efficiency by 10% and providing high-voltage electricity
• Camless valve systems with up to 10-15% better efficiency and better performance
Where are we going from here?
• Build to 10 million users in 2008.• Continue promoting our products.• Launch new data product “Your MPG”• Develop and execute marketing strategy
around energy efficiency• Work with Clean Cities Coalitions to promote
fuel economy locally.• Continuous improvement of fueleconomy.gov
and Fuel Economy Guide
Related Documents