1 Chapter 2 Analysis of Financial Statements © 2007 Thomson/South-Western

1 Chapter 2 Analysis of Financial Statements © 2007 Thomson/South-Western.
Dec 27, 2015
Welcome message from author
This document is posted to help you gain knowledge. Please leave a comment to let me know what you think about it! Share it to your friends and learn new things together.
Transcript
1
Chapter 2Analysis of Financial Statements
© 2007 Thomson/South-Western

2
Essentials ofChapter 2
What financial statements do corporations publish, and what information does each provide?
How do investors utilize financial statements?
What is ratio analysis and why are the results important to both managers and investors?
What are some potential problems associated with financial statement analysis?
What is the most important factor in financial statement analysis?

3
The Annual Report
Verbal SectionUsually a letter from the chairman
Financial StatementsThe Income StatementThe Balance SheetStatement of Cash FlowsStatement of Retained Earnings

4
Financial Statements
The Balance Sheet
The Income Statement
Statement of Cash Flows
Statement of Retained Earnings
5
The Balance Sheet
Represents a picture taken on a specific date that shows a firm’s assets and how those assets are financed (debt or equity)
6
The Balance Sheet
Cash & equivalents versus other assetsAll assets stated in dollars - only cash and equivalents
represent money that can be spent
Accounting alternatives – e.g., FIFO versus LIFO
Breakdown of the common equity accountCommon stock at par, paid-in capital & retained
earnings
Book values often do not equal market values
The time dimensionA snapshot of the firm’s financial position during a
specified period of time

7
Unilate Textiles: Dec. 31 Balance Sheets ($ millions, except per share data)
2009 2008
Amount
Percent of Total
AssetsAmount
Percent of Total
Assets
Assets
Cash and equivalents $ 15.0 1.8% $ 40.0 5.4%Accounts receivables 180.0 21.3 160.0 21.3Inventory 270.0 32.0 200.0 26.7
Total current assets $465.0 55.0%b $400.0 53.3%b
Net plant and equipmenta 380.0 45.0 350.0 46.7Total assets $845.0 100.0% $750.0 100.0%
Liabilities and Equity
Accounts payable $ 30.0 3.6% $ 15.0 2.0%Accruals 60.0 7.1 55.0 7.3Notes payable 40.0 4.7 35.0 4.7
Total current liabilities $130.0 15.4% $105.0 14.0%Long–term bonds 300.0 35.5 255.0 34.0
Total liabilities (debt) $430.0 50.9% $360.0 48.0%Common stock (25,000,000 shares) 130.0 15.4 130.0 17.3Retained earnings 285.0 33.7 260.0 34.7
Total common equity $415.0 49.1% 390.0 52.0Total liabilities and equity $845.0 100.0% $750.0 100.0%
Book value per share = (Common equity)/Shares $16.60 $15.60
Market value per share (stock price) $23.00 $25.00
8
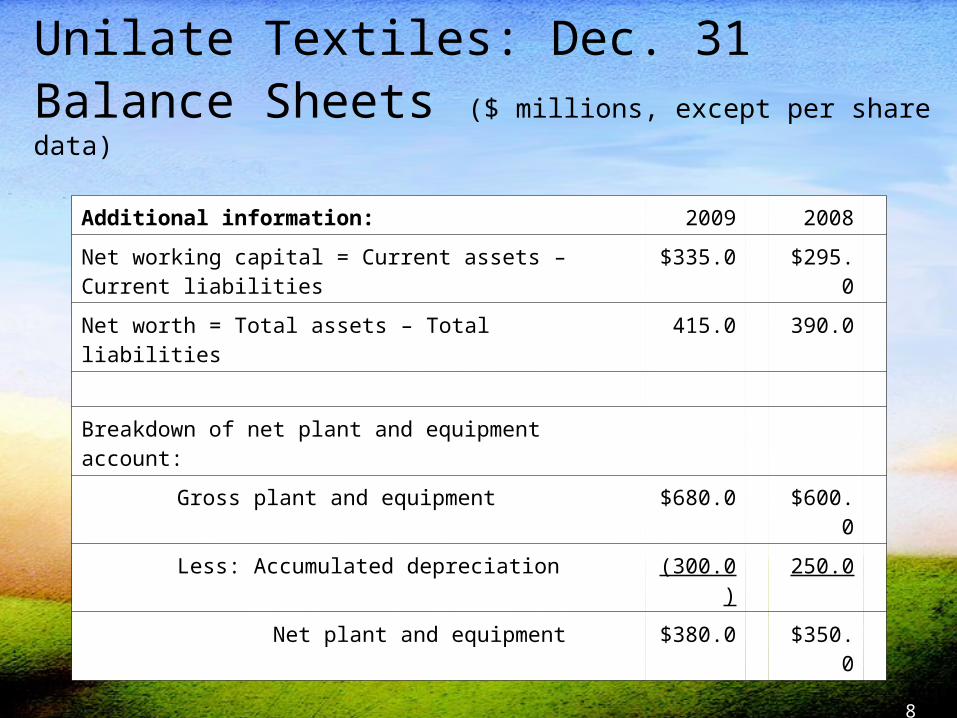
Unilate Textiles: Dec. 31 Balance Sheets ($ millions, except per share data)
Additional information: 2009 2008
Net working capital = Current assets – Current liabilities $335.0 $295.0
Net worth = Total assets – Total liabilities 415.0 390.0
Breakdown of net plant and equipment account:
Gross plant and equipment $680.0 $600.0
Less: Accumulated depreciation (300.0) 250.0
Net plant and equipment $380.0 $350.0
9
The Income Statement
Presents the results of business operations during a specified period of time
Summarizes the revenues generated and the expenses incurred

10
Unilate Textiles: Income Statements for Years Ending Dec. 31 ($ millions, except per shares data)
2009 2008
Amount Percent of Total Sales
Amount Percent ofTotal Sales
Net sales $1,500.0 100.0% $1,435.0 100.0%
Variable operating costs (82% of sales) (1,230.0) 82.0 (1,176.7) 82.0
Gross profit $ 270.0 18.0 $ 258.3 18.0
Fixed operating costs except depreciation ( 90.0) 6.0 ( 85.0) 5.9
Earnings before interest, taxes, depreciation, and amortization (EBITDA
$ 180.0 12.0 173.3 12.1
Depreciation ( 50.0) 3.3 ( 40.0) 2.8
Net Operating income (NOI) =
Earnings before interest and taxes (EBIT) $ 130.0 8.8 133.3 9.3
Interest ( 40.0) 2.7 ( 35.0) 2.4
Earnings before taxes (EBT) $ 90.0 6.0 98.3 6.9
Taxes (40%) ( 36.0) 2.4 ( 39.3) 2.7
Net income $ 54.0 3.6 $ 59.0 4.1
Preferred dividends 0.0 0.0
Earnings available to common stockholders (EAC) $ 54.0 59.0
Common dividends ( 29.0) ( 27.0)
Addition to retained earnings $ 25.0 32.0
Per share data (25,000,000 shares):
Earnings per share = (Net income)/Shares $2.16 $2.36
Dividends per share = (Common dividends)/Shares $1.16 $1.08

11
Statement of Cash Flows
Designed to show how the firm’s operations have affected its cash position
Examines investment decisions (uses of cash)
Examines financing decisions (sources of cash)

12
Unilate Textiles: Cash Sources and Uses, 2009 ($ million)
Account Balances as of: Change
12/31/09 12/31/08 Source Uses
Balance Sheet Effects (Adjustments)
Cash and marketable securities $ 15.0 $ 40.0 $ 25.0
Accounts receivable 180.0 160.0 $ 20.0
Inventory 200.0 270.0 70.0
Gross plant and equipment 680.0 600.0 80.0
Accounts payable 30.0 15.0 15.0
Accruals 60.0 55.0 5.0
Notes payable 40.0 35.0 5.0
Long-term bonds 300.0 255.0 45.0
Common stock (11,000,000 shares) 130.0 130.0
Income Statement Information
Net income $ 54.0
Add: depreciation 50.0
Gross cash flow from operations $104.0 104.0
Dividend payment 29.0 29.0
Totals $199.0 $199.0

13
Unilate Textiles: Statement of Cash Flows for the Period Ending December 31, 2009 ($ million)
Cash Flows from Operating Activities
Net income $ 54.0
Additions (adjustments) to net income
Depreciation 50.0
Increase in accounts payable 15.0
Increase in accruals 5.0
Subtractions (adjustments) from net income
Increase in accounts receivable (20.0)
Increase in inventory (70.0)
Net cash flow from operations $ 34.0
Cash Flows from Long-Term Investing Activities
Acquisition of fixed assets $ (80.0)
Cash Flows from Financing Activities
Increase in notes payable $ 5.0
Increase in bonds 45.0
Dividend payment (29.0)
Net cash flow from financing $ 21.0
Net change in cash $ (25.0)
Cash at the beginning of the year 40.0
Cash at the end of the year $ 15.0

14
Statement of Retained Earnings
Changes in the common equity accounts between balance sheet dates
15
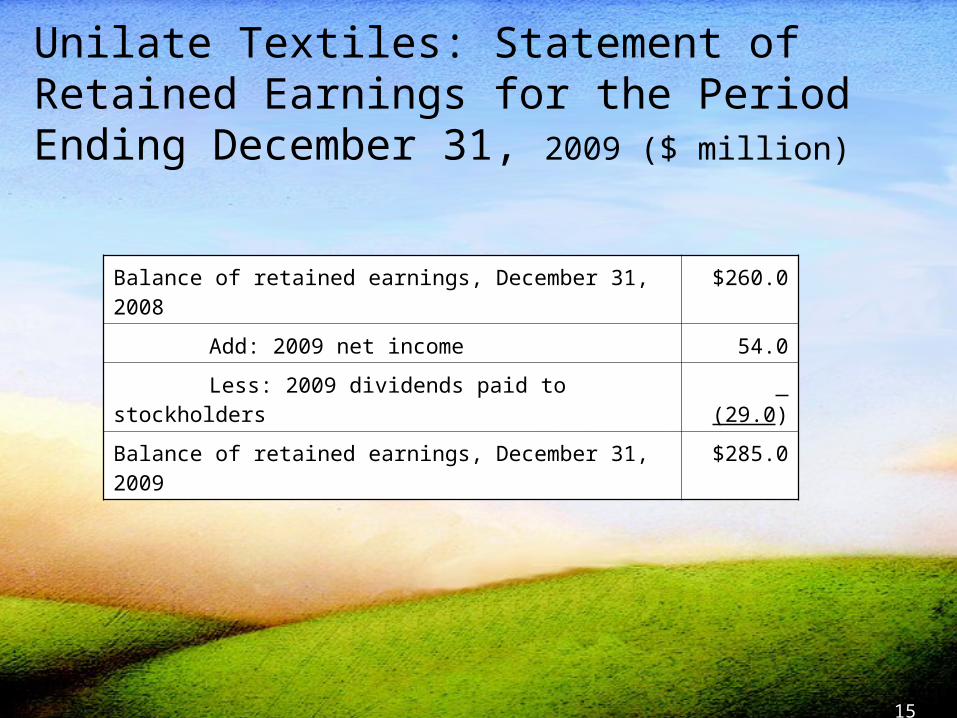
Unilate Textiles: Statement of Retained Earnings for the Period Ending December 31, 2009 ($ million)
Balance of retained earnings, December 31, 2008 $260.0
Add: 2009 net income 54.0
Less: 2009 dividends paid to stockholders (29.0)
Balance of retained earnings, December 31, 2009 $285.0

16
What Information Do Investors Use from Financial Statements
Net working capital = NWC = Current assets - Current liabilities
Operating cash flow = NOI (1-Tax rate) + Depreciation and amortization expense = Net operating profit after taxes + Depreciation and amortization
expense
Free cash flow = FCF = operating cash flow - Investments = Operating cash flow - (in fixed assets + NOWC)
Economic Value Added =EVA = NOI (1 - Tax rate) - [(Invested capital) X (After-tax cost of
capital as a percent)]
17
Financial Statement (Ratio) Analysis
Ratios are accounting numbers translated into relative values
Ratios are designed to show relationships between financial statement accounts within firms and between firms
18
The Purpose of Ratio Analysis
Gives an idea of how well the company is doing
Standardizes numbers; facilitates comparisons
Used to highlight weaknesses and strengths
19
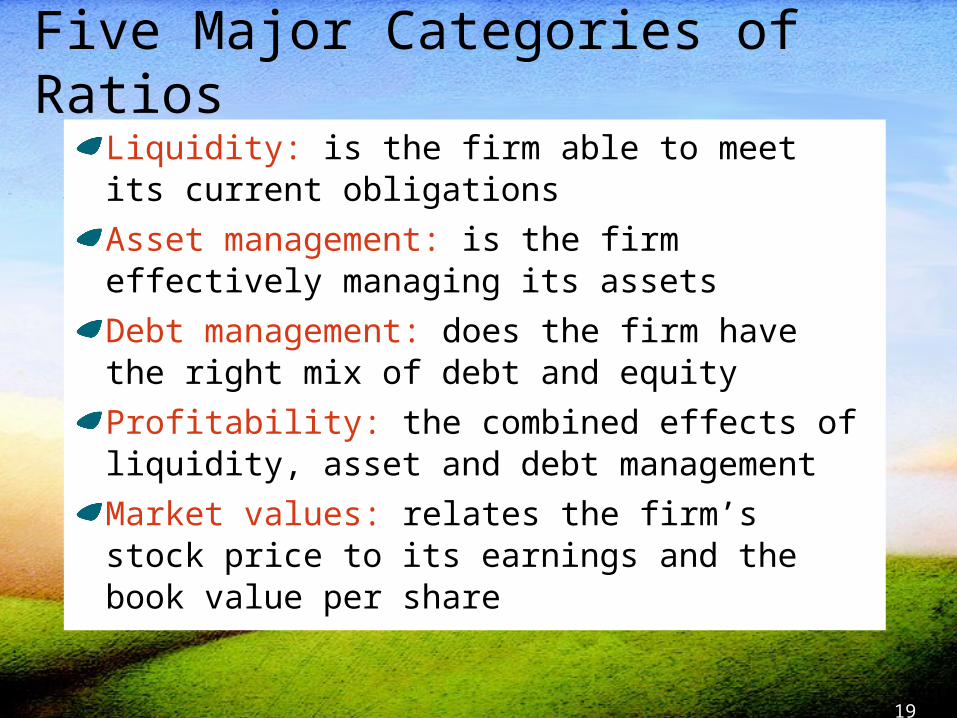
Five Major Categories of Ratios
Liquidity: is the firm able to meet its current obligations
Asset management: is the firm effectively managing its assets
Debt management: does the firm have the right mix of debt and equity
Profitability: the combined effects of liquidity, asset and debt management
Market values: relates the firm’s stock price to its earnings and the book value per share

20
Liquidity Ratios
Current ratio
Quick (Acid test) ratio
21
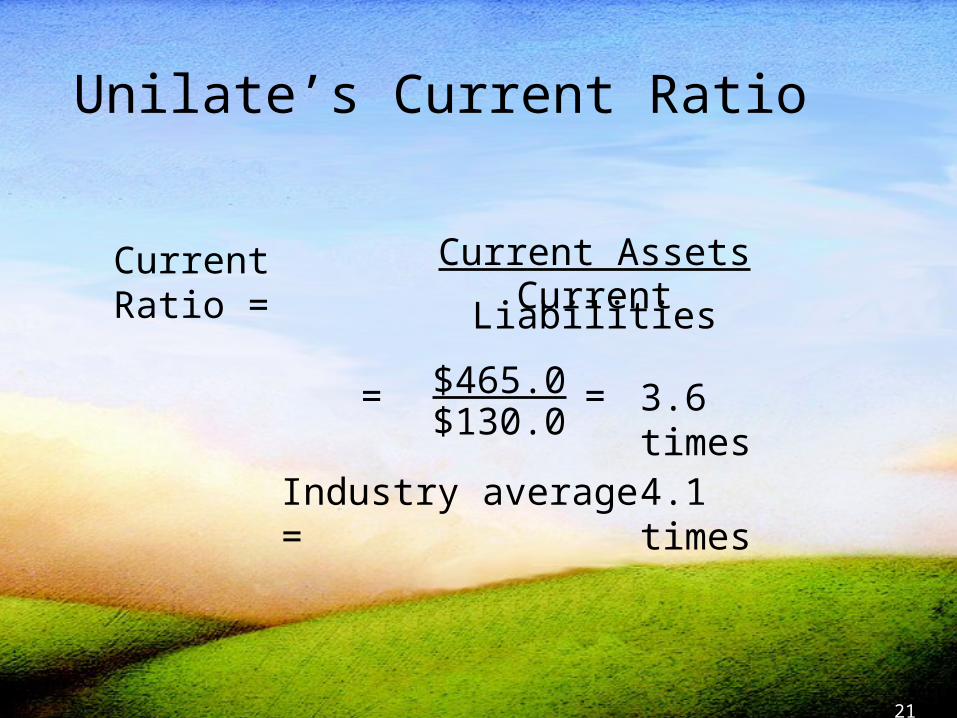
Unilate’s Current Ratio
Current Ratio = Current AssetsCurrent Liabilities
$465.0$130.0
= = 3.6 times
Industry average = 4.1 times
22
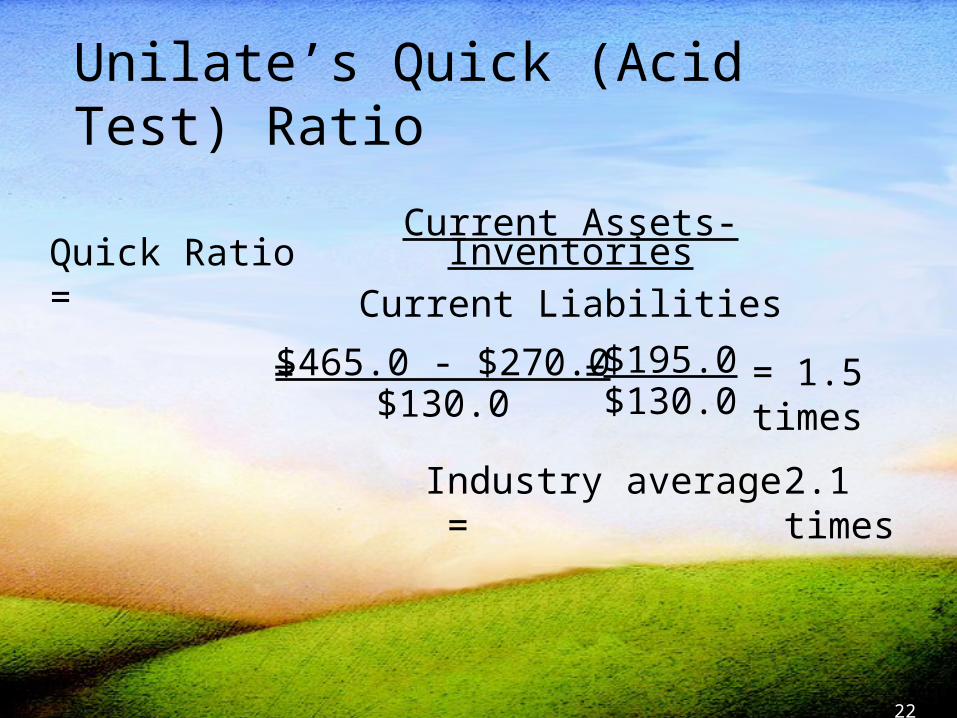
Unilate’s Quick (Acid Test) Ratio
Industry average = 2.1 times
$465.0 - $270.0$130.0
Quick Ratio = Current Assets- Inventories
Current Liabilities
= = = 1.5 times$195.0$130.0
23
Unilate’s Liquidity Position
Liquidity ratios suggest that Unilate’s liquidity position is fairly poor
24
Asset Management Ratios
Inventory Turnover Ratio
Days Sales Outstanding (DSO)
Fixed Assets Turnover Ratio
Total Assets Turnover Ratio

25
=$1,230.0$270.0
= 4.66. times
Inventory turnover =Cost of goods sold
Inventory
Industry average = 7.4 times
Unilate’s Inventory Turnover Ratio

26
Industry average = 32.1 days
days 43.2$4.167
$180.0
360
$1,500.0
$180.0
360
Sales Annual
sReceivable
SalesDaily
sReceivableDSO
Unilate’s Days Sales Outstanding Ratio
27
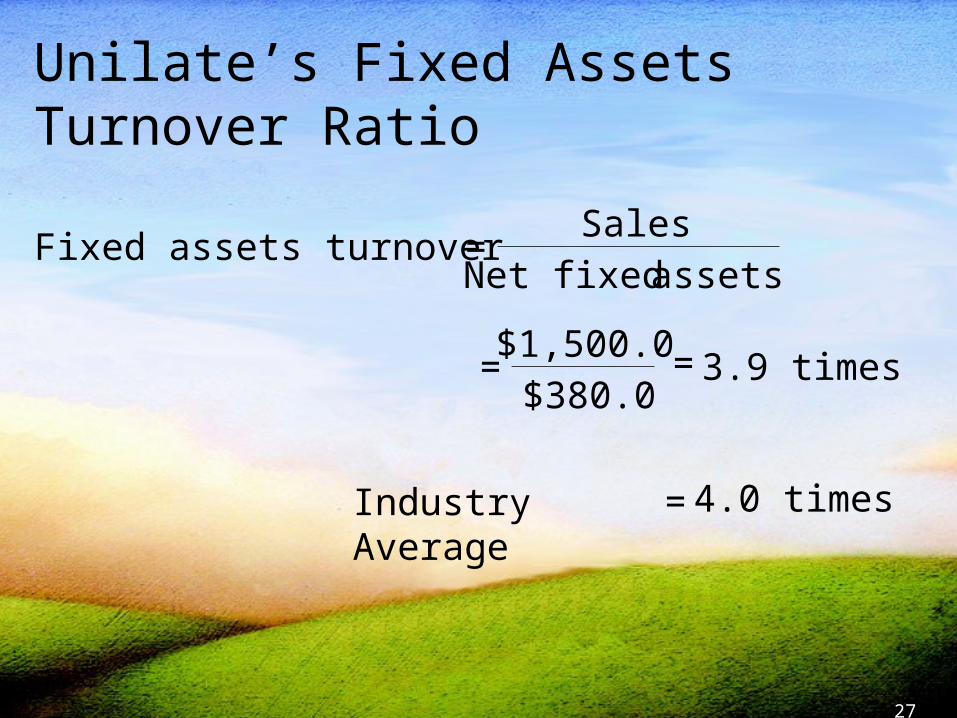
Fixed assets turnover =Sales
Net fixed assets
=$1,500.0$380.0
= 3.9 times
= 4.0 timesIndustry Average
Unilate’s Fixed Assets Turnover Ratio

28
Total assets turnover =Sales
Total assets
=$1,500.0$845.0 = 1.8 times
= 2.1 timesIndustry Average
Unilate’s Total Assets Turnover Ratio

29
Debt Management Ratios
Debt Ratio
Times-Interest-Earned Ratio
Fixed Charge Coverage Ratio
30
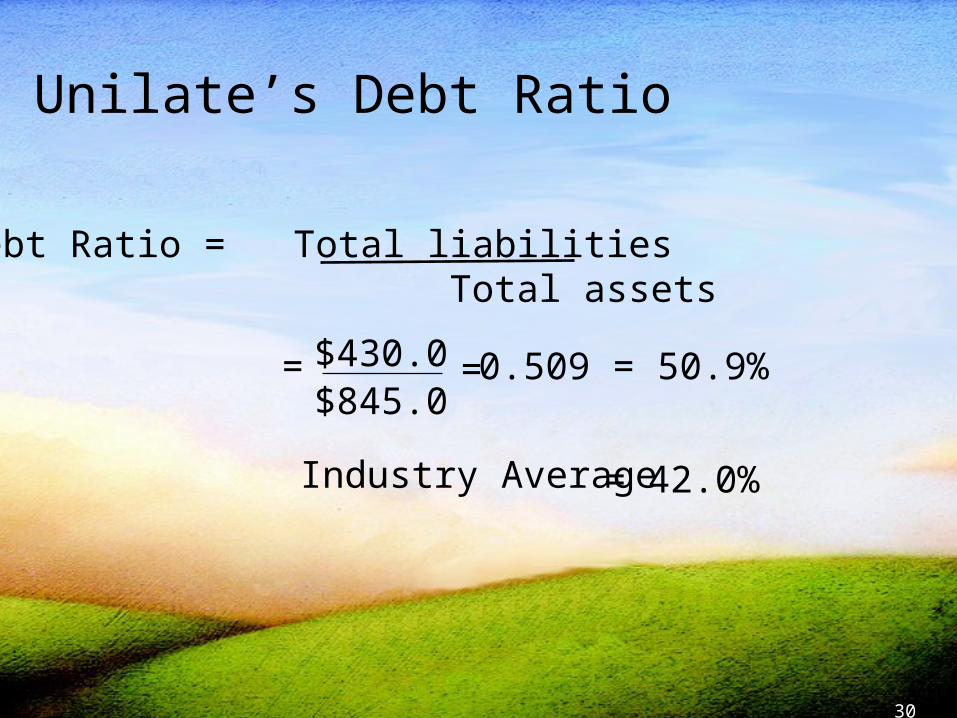
Debt Ratio = Total liabilities Total assets
= 42.0%
= $430.0$845.0
=0.509 = 50.9%
Industry Average
Unilate’s Debt Ratio

31
TIE = EBIT Interest charges
3.3 times$40.0
$130.0==
Industry Average = 6.5 times
Unilate’s Times-Interest-Earned Ratio

32
rateTax 1
payment fund Sinkingpayments
LeasechargesInterest
payments LeaseEBITFCC
2.2
3.63$
0.140$
0.10$0.400.41
$8.0$
$10.0$130.0
Industry Average = 5.8 times
Unilate’s Fixed Charge Coverage Ratio
33
Profitability Ratios
Net Profit Margin
Return on Total Assets
Return on Common Equity

34
4.9%Industry Average =
Profit margin = Net income
Sales
$54.0$1,500
0.036 = 3.6%==
Unilate’s Profit Margin Ratio

35
10.3%Industry Average =
$54.0$845.0
= 0.064 = 6.4%
=
ROA = Net incomeTotal assets
Unilate’s Return on Total Assets
36
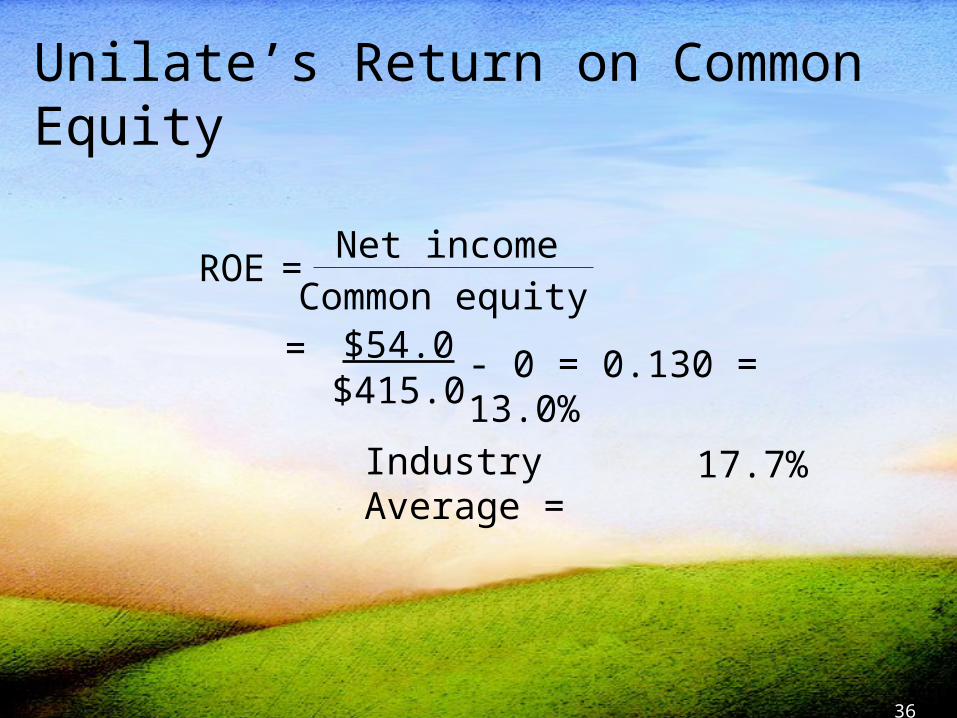
17.7%Industry Average =
$54.0$415.0
- 0 = 0.130 = 13.0%=
ROENet income
=Common equity
Unilate’s Return on Common Equity

37
Market Value Ratios
Price/Earnings Ratio
Market/Book Ratio

38
10.6 times $2.16$23.00
==
Price/Earnings Ratio =Price per share
Earnings per share
15.0 timesIndustry Average =
Unilate’s Price/Earnings Ratio
39
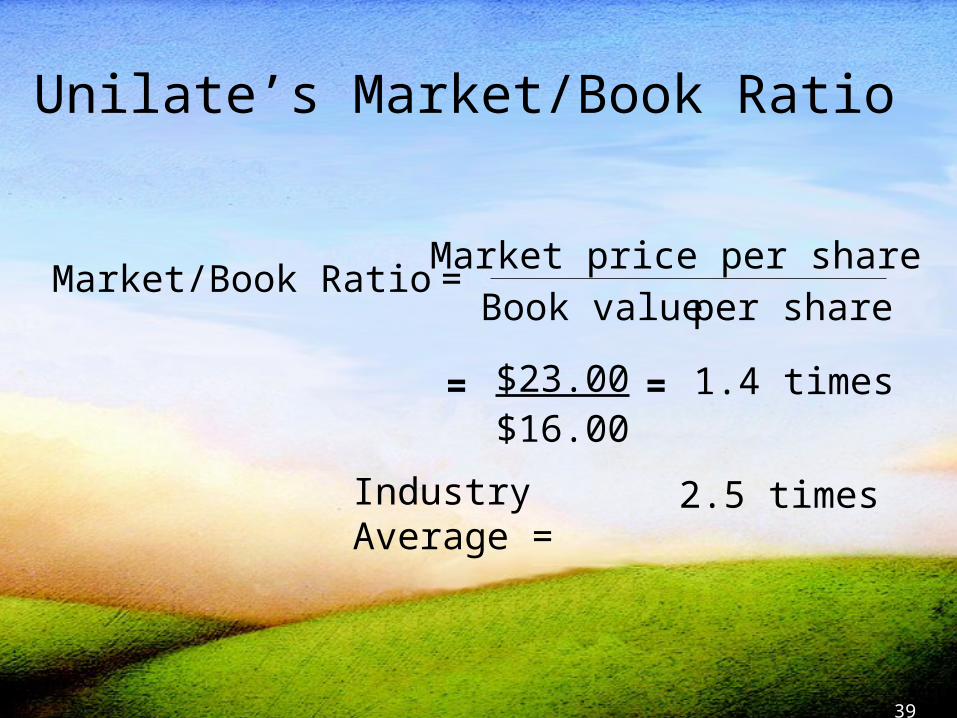
Market/Book Ratio = Market price per shareBook value per share
=$23.00$16.00
1.4 times=
2.5 timesIndustry Average =
Unilate’s Market/Book Ratio

40
ROA = Net Profit Margin X Total Assets TurnoverNet Income
Sales
Sales Total Assets
X=
$54.0$1,500.0
X=$1,500.0$845.0
= 3.6% X 1.8 = 6.4%
Summary of Ratio Analysis:The DuPont Analysis

41
Rate of Return on Common Equity (ROE), 2005-2009
Unilate
9.0
10.0
11.0
12.0
13.0
14.0
15.0
16.0
17.0
18.0
2005 2006 2007 2008 2009
Industry

42
DuPont Equation Provides Overview
Firm’s profitability (measured by ROA)
Firm’s expense control (measured by profit margin)
Firm’s asset utilization (measured by total asset turnover)
43
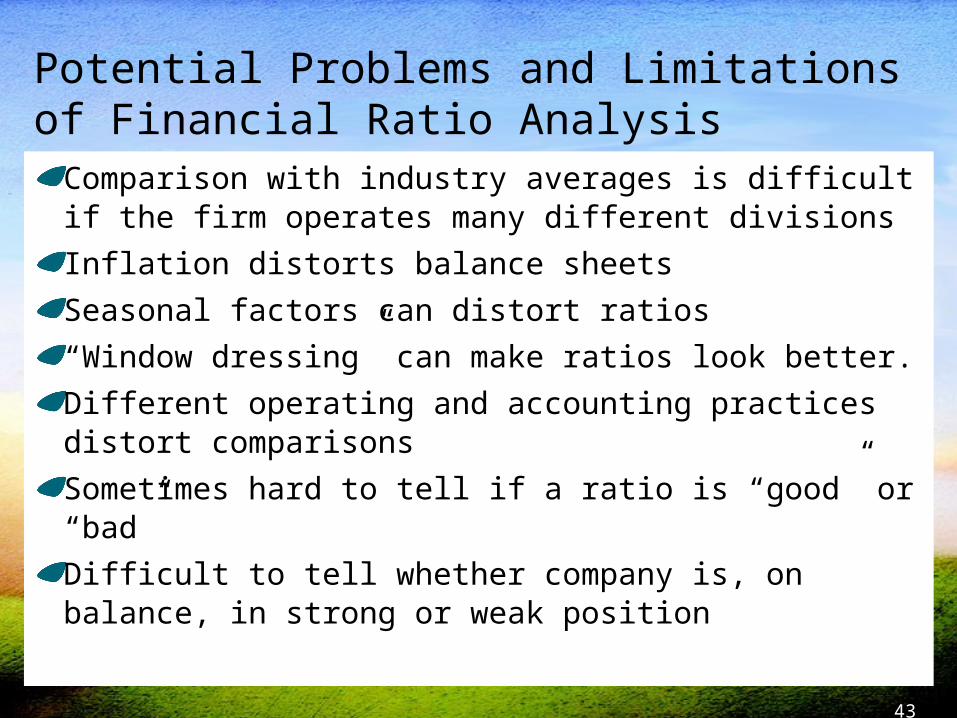
Potential Problems and Limitations of Financial Ratio Analysis
Comparison with industry averages is difficult if the firm operates many different divisions
Inflation distorts balance sheets
Seasonal factors can distort ratios
“Window dressing” can make ratios look better.
Different operating and accounting practices distort comparisons
Sometimes hard to tell if a ratio is “good” or “bad”
Difficult to tell whether company is, on balance, in strong or weak position

44
Chapter 2 Essentials
What financial statements do corporations publish?Balance sheet, income statement, statement of cash
flows, and statement of retained earnings
How do investors utilize financial statements?Debtholders estimate future cash flows to determine
whether the debt contracts will be honored
Stockholders estimate future cash flows to determine the value of the firm’s common stock.
45
Chapter 2 Essentials
What is ratio analysis and why are the results important to both managers and investors?Ratio analysis is used to evaluate a firm’s current financial
position and the direction this position is expected to take in
the future.
What is the most important factor in financial statement analysis?To form general impressions about a firm’s financial
position, judgment must be used when interpreting financial ratios
Related Documents