1 Chapter 15 Capital Structure Decisions

1 Chapter 15 Capital Structure Decisions. 2 Topics in Chapter Overview and preview of capital structure effects Business versus financial risk The impact.
Dec 16, 2015
Welcome message from author
This document is posted to help you gain knowledge. Please leave a comment to let me know what you think about it! Share it to your friends and learn new things together.
Transcript

1
Chapter 15
Capital Structure Decisions

2
Topics in Chapter Overview and preview of capital
structure effects Business versus financial risk The impact of debt on returns Capital structure theory, evidence,
and implications for managers Example: Choosing the optimal
structure
3
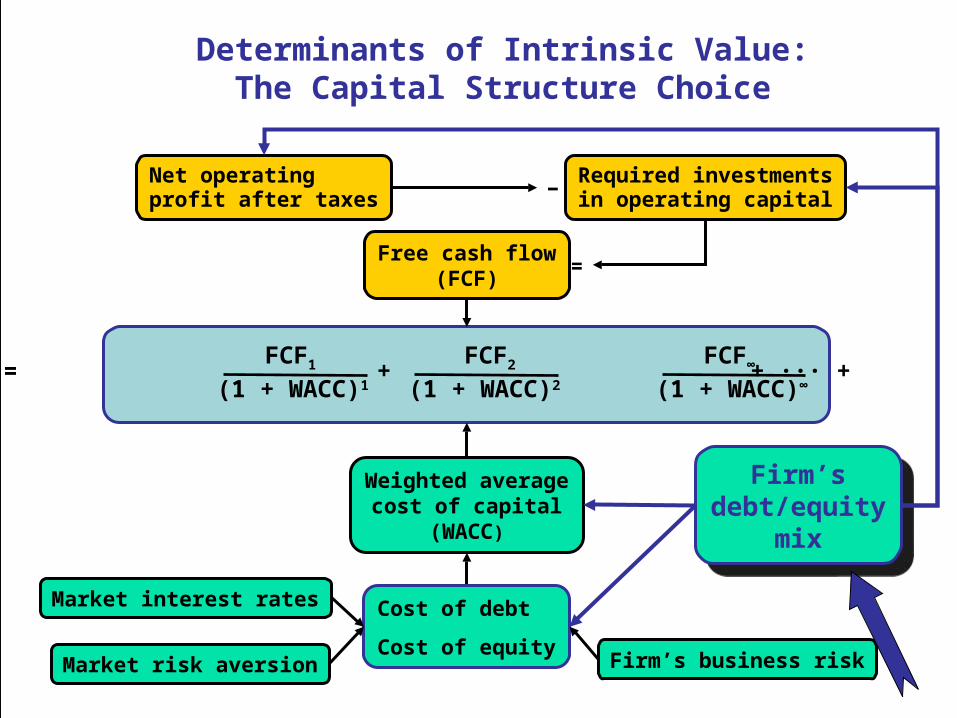
Value = + + ··· +FCF1 FCF2 FCF∞
(1 + WACC)1 (1 + WACC)∞
(1 + WACC)2
Free cash flow(FCF)
Market interest rates
Firm’s business riskMarket risk aversion
Firm’sdebt/equity
mix
Firm’sdebt/equity
mix
Cost of debt
Cost of equity
Weighted averagecost of capital
(WACC)
Net operatingprofit after taxes
Required investmentsin operating capital−
=
Determinants of Intrinsic Value:The Capital Structure Choice
4
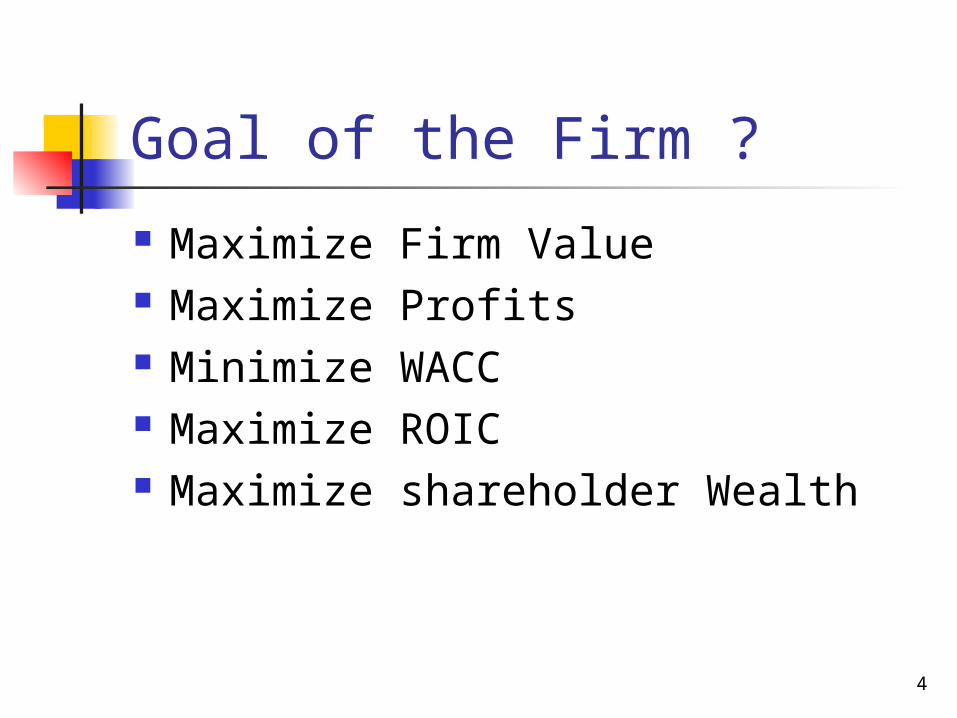
Goal of the Firm ?
Maximize Firm Value Maximize Profits Minimize WACC Maximize ROIC Maximize shareholder Wealth

5
Goal of the Firm is
Maximize Firm Value Minimize WACC
Thru: Lowering risk Increasing CFs Maximize Op. Profits Growth Business Reduce Taxes

6
Factors Affecting Capital Structure:
Business Risk Debt’s tax deductibility Ability to raise capital under adverse terms Managerial decisions:
Conservative vs. Aggressive Minimize WACC Thru:
Lowering risk Increasing CFs Maximize Op. Profits Growth Business Reduce Taxes

7
Basic Definitions
V = value of firm FCF = free cash flow WACC = weighted average cost of
capital rs and rd are costs of stock and debt ws and wd are percentages of the firm
that are financed with stock and debt.

8
How can capital structure affect value?
V = ∑∞
t=1
FCFt
(1 + WACC)t
WACC= wd (1-T) rd + wsrs

9
A Preview of Capital Structure Effects
The impact of capital structure on value depends upon the effect of debt on: WACC FCF
(Continued…)

10
The Effect of Additional Debt on WACC Debtholders have a prior claim on cash
flows relative to stockholders. Debtholders’ “fixed” claim increases risk of
stockholders’ “residual” claim. Cost of stock, rs, goes up.
Firm’s can deduct interest expenses. Reduces the taxes paid Frees up more cash for payments to investors Reduces after-tax cost of debt
(Continued…)
11
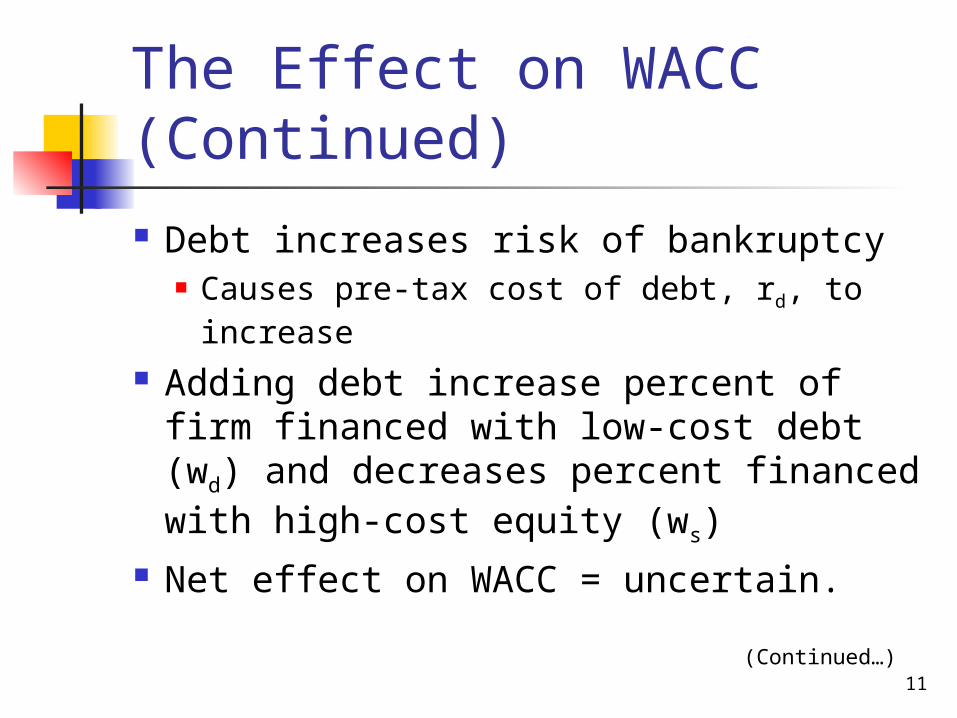
The Effect on WACC (Continued)
Debt increases risk of bankruptcy Causes pre-tax cost of debt, rd, to
increase Adding debt increase percent of
firm financed with low-cost debt (wd) and decreases percent financed with high-cost equity (ws)
Net effect on WACC = uncertain.(Continued…)

12
The Effect of Additional Debt on FCF
Additional debt increases the probability of bankruptcy. Direct costs: Legal fees, “fire” sales,
etc. Indirect costs: Lost customers,
reduction in productivity of managers and line workers, reduction in credit (i.e., accounts payable) offered by suppliers
(Continued…)

13
Impact of indirect costs NOPAT goes down due to lost
customers and drop in productivity Investment in capital goes up due to
increase in net operating working capital (accounts payable goes down as suppliers tighten credit).
(Continued…)
14
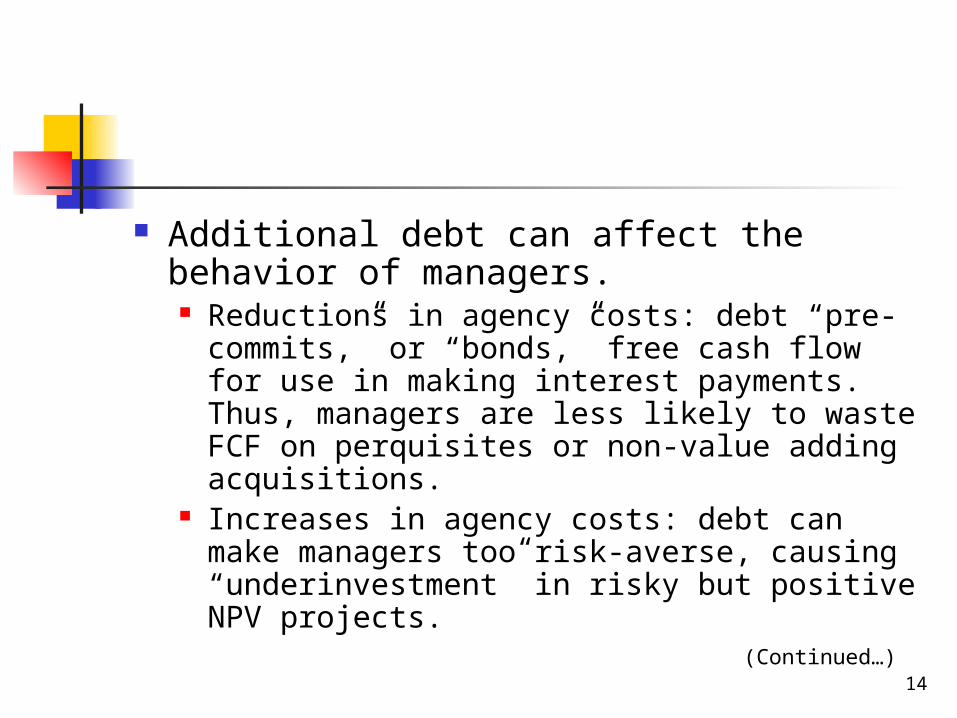
Additional debt can affect the behavior of managers. Reductions in agency costs: debt “pre-
commits,” or “bonds,” free cash flow for use in making interest payments. Thus, managers are less likely to waste FCF on perquisites or non-value adding acquisitions.
Increases in agency costs: debt can make managers too risk-averse, causing “underinvestment” in risky but positive NPV projects.
(Continued…)
15
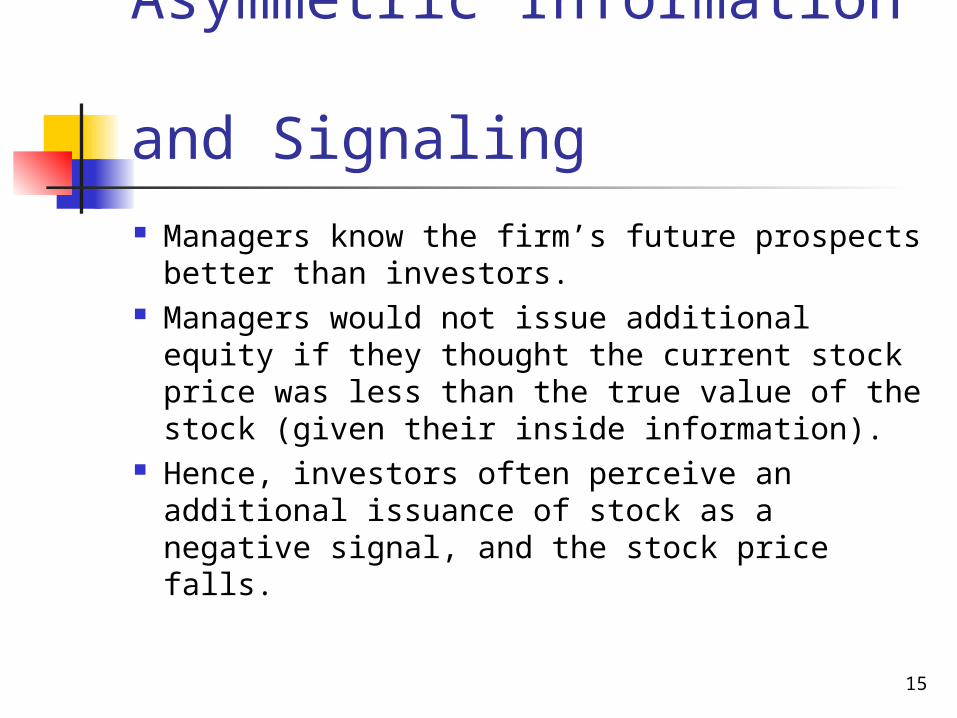
Asymmetric Information and Signaling Managers know the firm’s future
prospects better than investors. Managers would not issue additional
equity if they thought the current stock price was less than the true value of the stock (given their inside information).
Hence, investors often perceive an additional issuance of stock as a negative signal, and the stock price falls.

16
Business Risk: Uncertainty in EBIT, NOPAT, and ROIC
Uncertainty about demand (unit sales).
Uncertainty about output prices. Uncertainty about input costs. Product and other types of liability. Degree of operating leverage
(DOL).
17
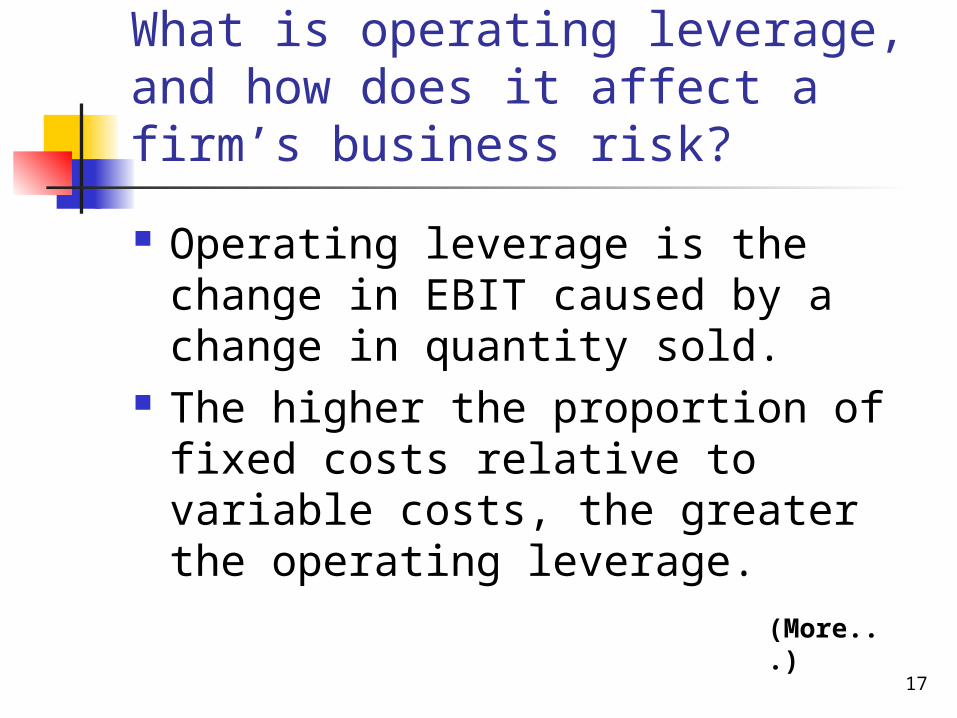
What is operating leverage, and how does it affect a firm’s business risk?
Operating leverage is the change in EBIT caused by a change in quantity sold.
The higher the proportion of fixed costs relative to variable costs, the greater the operating leverage.
(More...)

18
Higher operating leverage leads to more business risk: small sales decline causes a larger EBIT decline.
(More...)
Sales
$ Rev.TC
F
QBE
EBIT}$
Rev.
TC
F
QBESales

19
Operating Breakeven
Q is quantity sold, F is fixed cost, V is variable cost, TC is total cost, and P is price per unit.
Operating breakeven = QBE
QBE = F / (P – V) Example: F=$200, P=$15, and
V=$10: QBE = $200 / ($15 – $10) = 40.
(More...)

20
Business Risk versus Financial Risk Business risk:
Uncertainty in future EBIT, NOPAT, and ROIC. Depends on business factors such as
competition, operating leverage, etc. Financial risk:
Additional business risk concentrated on common stockholders when financial leverage is used.
Depends on the amount of debt and preferred stock financing.

21
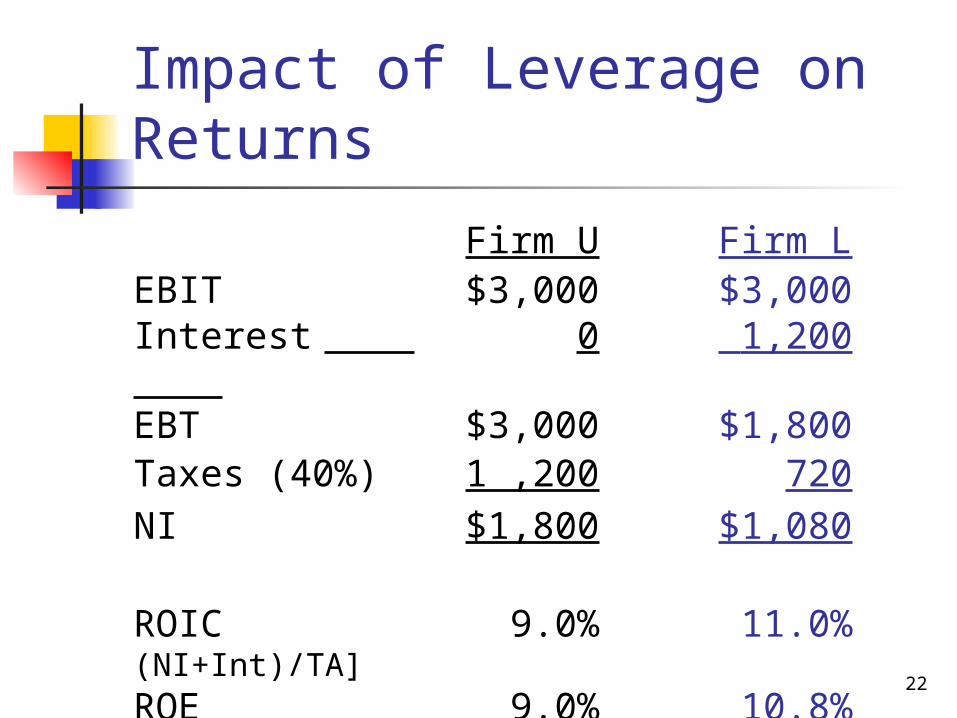
Consider Two Hypothetical Firms Identical Except for Debt
Firm U Firm LCapital $20,000 $20,000Debt $0 $10,000 (12%
rate)Equity $20,000 $10,000Tax rate 40% 40%EBIT $3,000 $3,000NOPAT $1,800 $1,800ROIC 9% 9%
22
Impact of Leverage on Returns
Firm U Firm LEBIT $3,000 $3,000Interest 0 1,200EBT $3,000 $1,800Taxes (40%) 1 ,200 720NI $1,800 $1,080
ROIC (NI+Int)/TA]
9.0% 11.0%
ROE (NI/Equity)
9.0% 10.8%

23
Why does leveraging increase return? More cash goes to investors of Firm
L. Total dollars paid to investors:
U: NI = $1,800. L: NI + Int = $1,080 + $1,200 = $2,280.
Taxes paid: U: $1,200 L: $720.
In Firm L, fewer dollars are tied up in equity.

24
Impact of Leverage on Returns if EBIT Falls
Firm U Firm L
EBIT $2,000 $2,000
Interest
0 1,200
EBT $2,000 $800
Taxes (40%)
800 320
NI $1,200 $480
ROIC 6.0% 6.0%
ROE 6.0% 4.8%
Leverage magnifies risk and return!
25
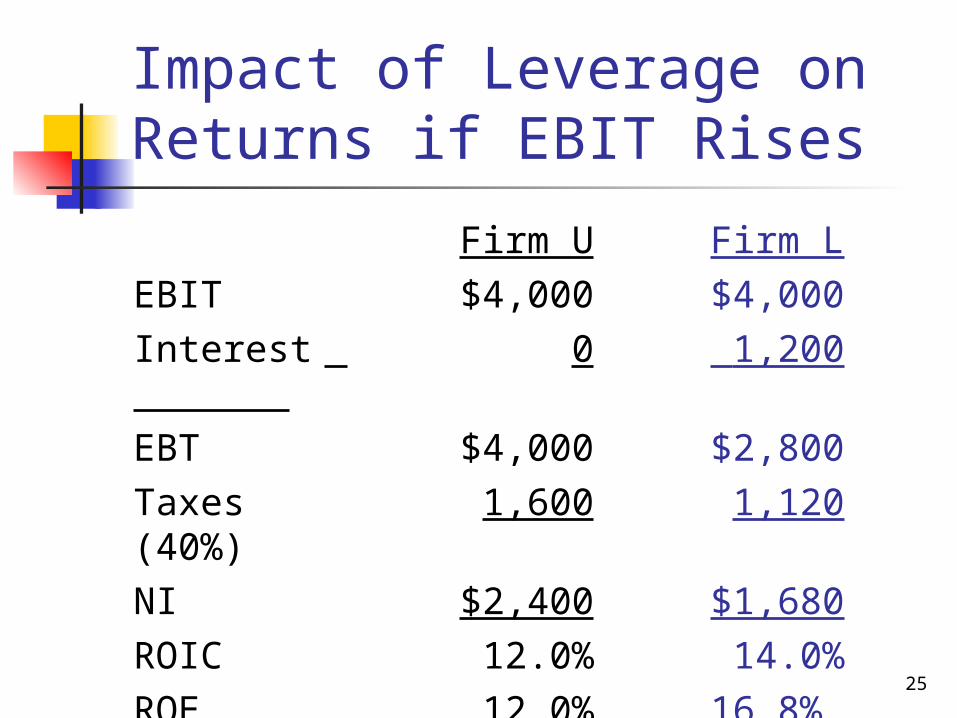
Impact of Leverage on Returns if EBIT Rises
Firm U Firm L
EBIT $4,000 $4,000
Interest
0 1,200
EBT $4,000 $2,800
Taxes (40%)
1,600 1,120
NI $2,400 $1,680
ROIC 12.0% 14.0%
ROE 12.0% 16.8%
Leverage magnifies risk and return!

26
Capital Structure Theory MM theory
Zero taxes Corporate taxes Corporate and personal taxes
Trade-off theory Signaling theory Pecking order Debt financing as a managerial constraint Windows of opportunity

27
Modigliani-Miller (MM) Theory: Zero Taxes
Firm U Firm L
EBIT $3,000 $3,000
Interest
0 1,200
NI $3,000 $1,800
CF to shareholder
$3,000 $1,800
CF to debtholder
0 $1,200
Total CF $3,000 $3,000
Notice that the total CF are identical for both firms.

28
MM Results: Zero Taxes MM assume: (1) no transactions costs; (2) no
restrictions or costs to short sales; and (3) individuals can borrow at the same rate as corporations.
MM prove that if the total CF to investors of Firm U and Firm L are equal, then arbitrage is possible unless the total values of Firm U and Firm L are equal:
VL = VU. Because FCF and values of firms L and U are
equal, their WACCs are equal. Therefore, capital structure is irrelevant.

29
MM Theory: Corporate Taxes
Corporate tax laws allow interest to be deducted, which reduces taxes paid by levered firms.
Therefore, more CF goes to investors and less to taxes when leverage is used.
In other words, the debt “shields” some of the firm’s CF from taxes.

30
MM Result: Corporate Taxes
MM show that the total CF to Firm L’s investors is equal to the total CF to Firm U’s investor plus an additional amount due to interest deductibility: CFL = CFU + rdDT.
What is value of these cash flows? Value of CFU = VU MM show that the value of rdDT = TD Therefore, VL = VU + TD.
If T=40%, then every dollar of debt adds 40 cents of extra value to firm.
31
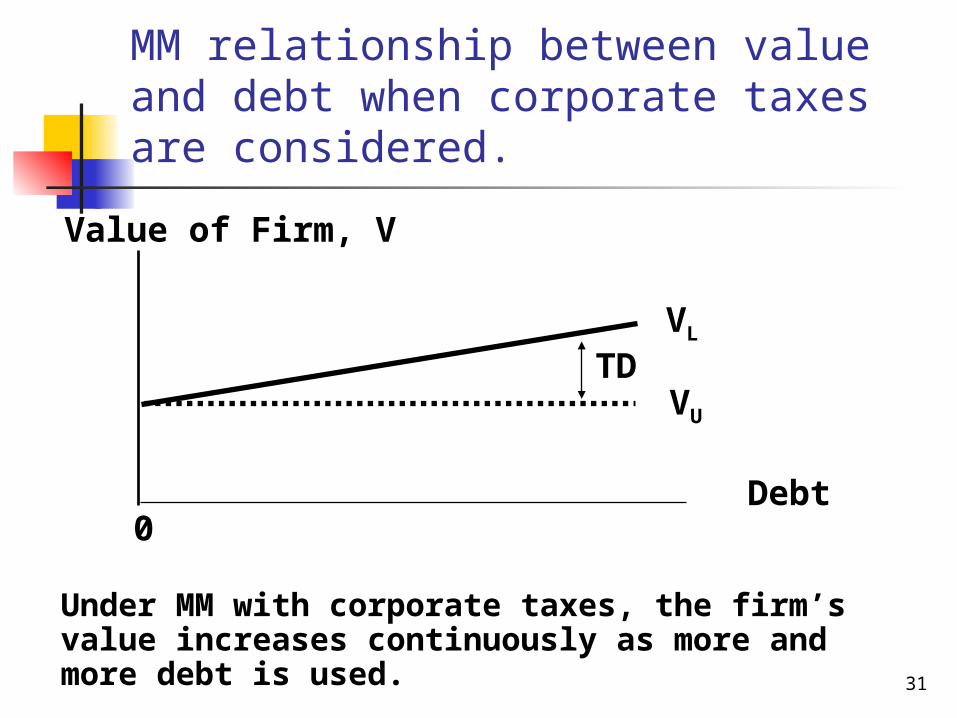
Value of Firm, V
0Debt
VL
VU
Under MM with corporate taxes, the firm’s value increases continuously as more and more debt is used.
TD
MM relationship between value and debt when corporate taxes are considered.

32
Miller’s Theory: Corporate and Personal Taxes
Personal taxes lessen the advantage of corporate debt: Corporate taxes favor debt financing
since corporations can deduct interest expenses.
Personal taxes favor equity financing, since no gain is reported until stock is sold, and long-term gains are taxed at a lower rate.
33
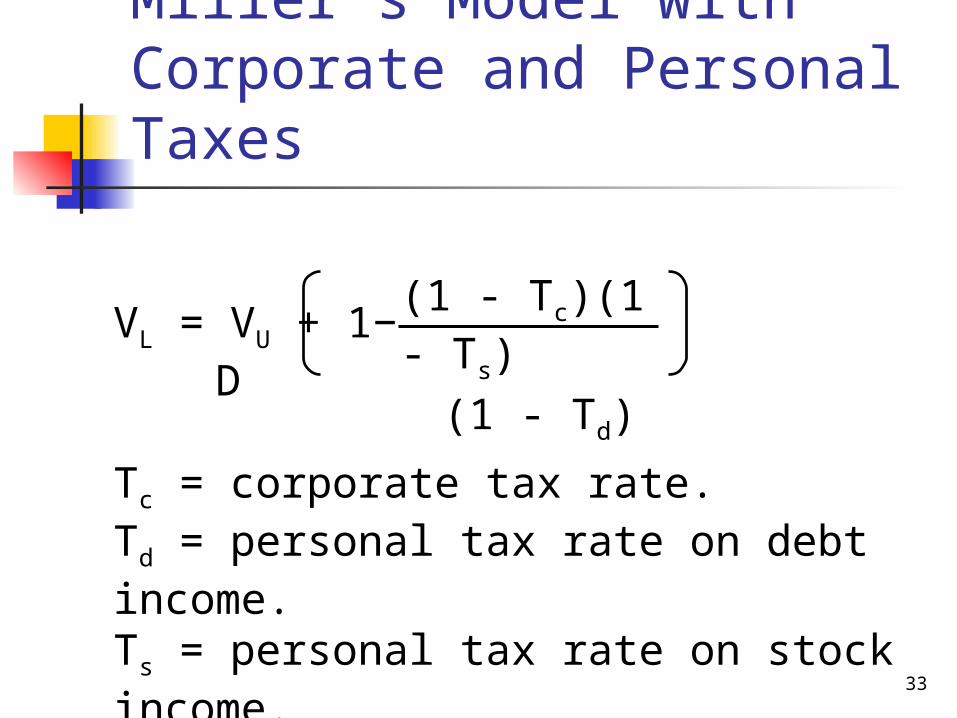
Miller’s Model with Corporate and Personal Taxes
VL = VU + 1− D
Tc = corporate tax rate.Td = personal tax rate on debt income.Ts = personal tax rate on stock income.
(1 - Tc)(1 - Ts)
(1 - Td)
34
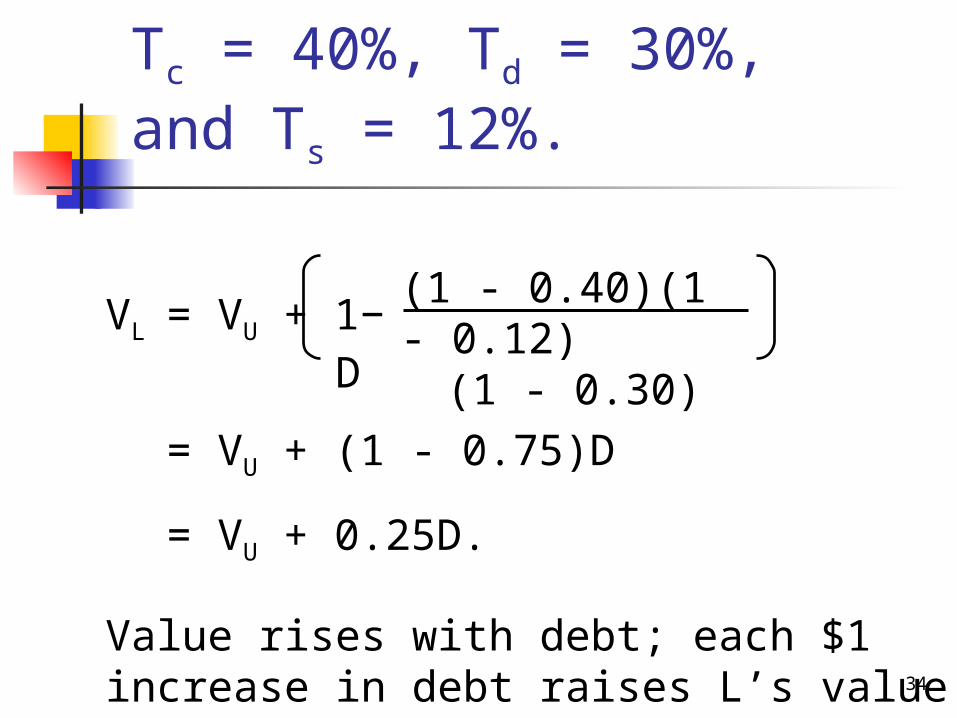
Tc = 40%, Td = 30%, and Ts = 12%.
VL = VU + 1− D
= VU + (1 - 0.75)D
= VU + 0.25D.
Value rises with debt; each $1 increase in debt raises L’s value by $0.25.
(1 - 0.40)(1 - 0.12)(1 - 0.30)
35
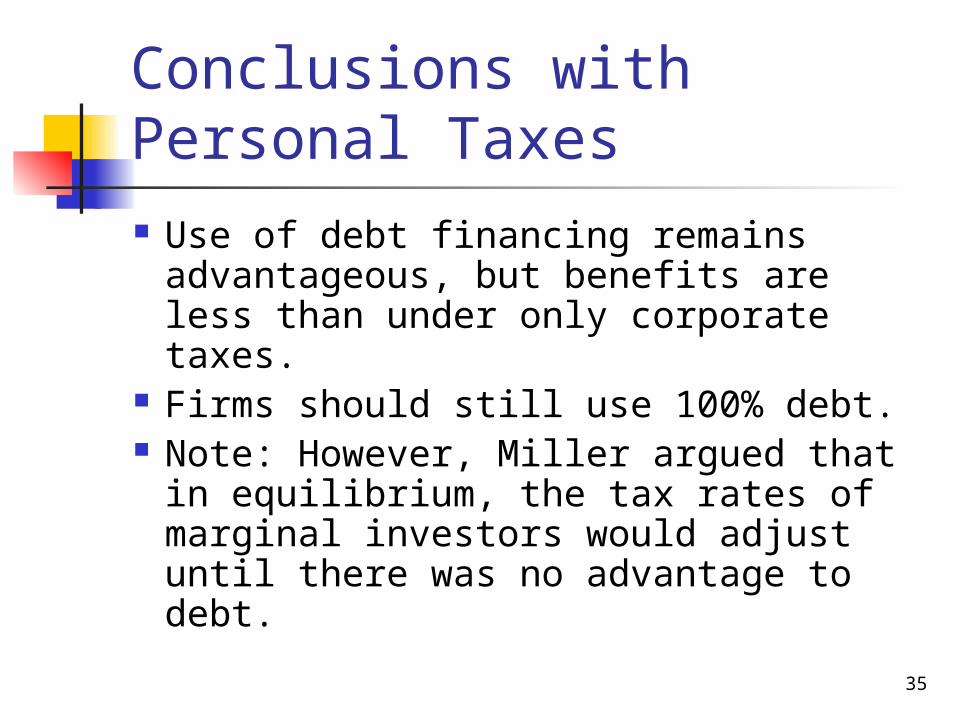
Conclusions with Personal Taxes Use of debt financing remains
advantageous, but benefits are less than under only corporate taxes.
Firms should still use 100% debt. Note: However, Miller argued that in
equilibrium, the tax rates of marginal investors would adjust until there was no advantage to debt.

36
Trade-off Theory MM theory ignores bankruptcy (financial
distress) costs, which increase as more leverage is used.
At low leverage levels, tax benefits outweigh bankruptcy costs.
At high levels, bankruptcy costs outweigh tax benefits.
An optimal capital structure exists that balances these costs and benefits.

37
Tax Shield vs. Cost of Financial Distress
Value of Firm, V
0 Debt
VL
VU
Tax Shield
Distress Costs

38
Signaling Theory MM assumed that investors and
managers have the same information. But, managers often have better
information. Thus, they would: Sell stock if stock is overvalued. Sell bonds if stock is undervalued.
Investors understand this, so view new stock sales as a negative signal.
Implications for managers?
39
Pecking Order Theory
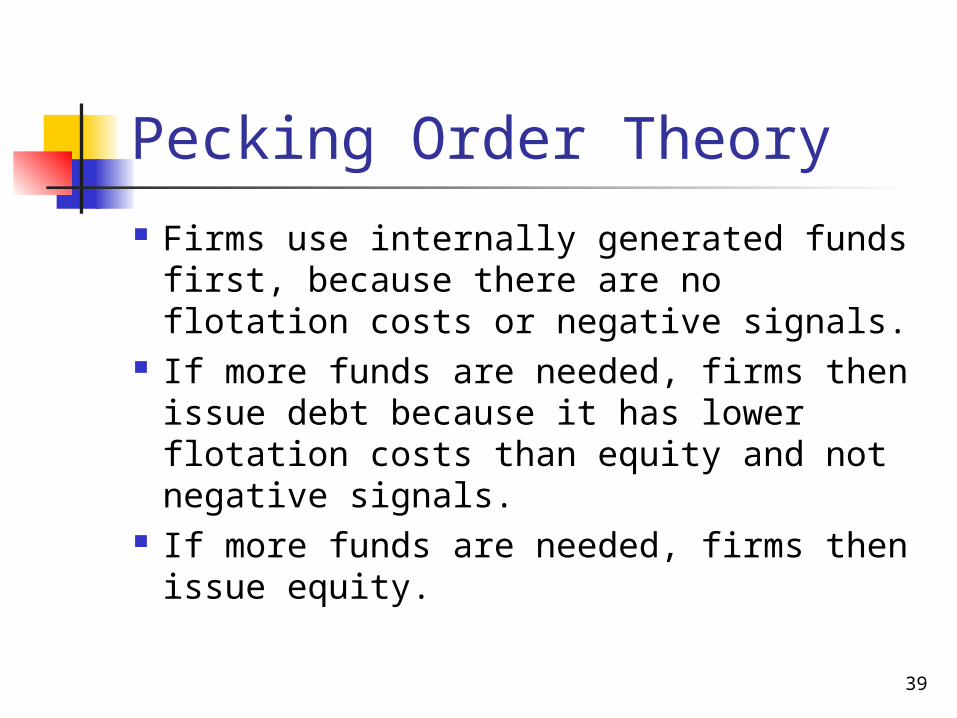
Firms use internally generated funds first, because there are no flotation costs or negative signals.
If more funds are needed, firms then issue debt because it has lower flotation costs than equity and not negative signals.
If more funds are needed, firms then issue equity.
40
Debt Financing and Agency Costs
One agency problem is that managers can use corporate funds for non-value maximizing purposes.
The use of financial leverage: Bonds “free cash flow.” Forces discipline on managers to
avoid perks and non-value adding acquisitions.
(More...)

41
A second agency problem is the potential for “underinvestment”. Debt increases risk of financial
distress. Therefore, managers may avoid risky
projects even if they have positive NPVs.

42
Investment Opportunity Set and Reserve Borrowing Capacity
Firms with many investment opportunities should maintain reserve borrowing capacity, especially if they have problems with asymmetric information (which would cause equity issues to be costly).
43
Windows of Opportunity Managers try to “time the market” when
issuing securities. They issue equity when the market is
“high” and after big stock price run ups. They issue debt when the stock market is
“low” and when interest rates are “low.” The issue short-term debt when the term
structure is upward sloping and long-term debt when it is relatively flat.

44
Empirical Evidence
Tax benefits are important– $1 debt adds about $0.10 to value.
Bankruptcies are costly– costs can be up to 10% to 20% of firm value.
Firms don’t make quick corrections when stock price changes cause their debt ratios to change– doesn’t support trade-off model.

45
Empirical Evidence (Continued)
After big stock price run ups, debt ratio falls, but firms tend to issue equity instead of debt. Inconsistent with trade-off model. Inconsistent with pecking order. Consistent with windows of opportunity.
Many firms, especially those with growth options and asymmetric information problems, tend to maintain excess borrowing capacity.
46
Implications for Managers
Take advantage of tax benefits by issuing debt, especially if the firm has: High tax rate Stable sales Low operating leverage

47
Implications for Managers (Continued)
Avoid financial distress costs by maintaining excess borrowing capacity, especially if the firm has: Volatile sales High operating leverage Many potential investment opportunities Special purpose assets (instead of
general purpose assets that make good collateral)
48
Implications for Managers (Continued)
If manager has asymmetric information regarding firm’s future prospects, then avoid issuing equity if actual prospects are better than the market perceives.
Always consider the impact of capital structure choices on lenders’ and rating agencies’ attitudes
49
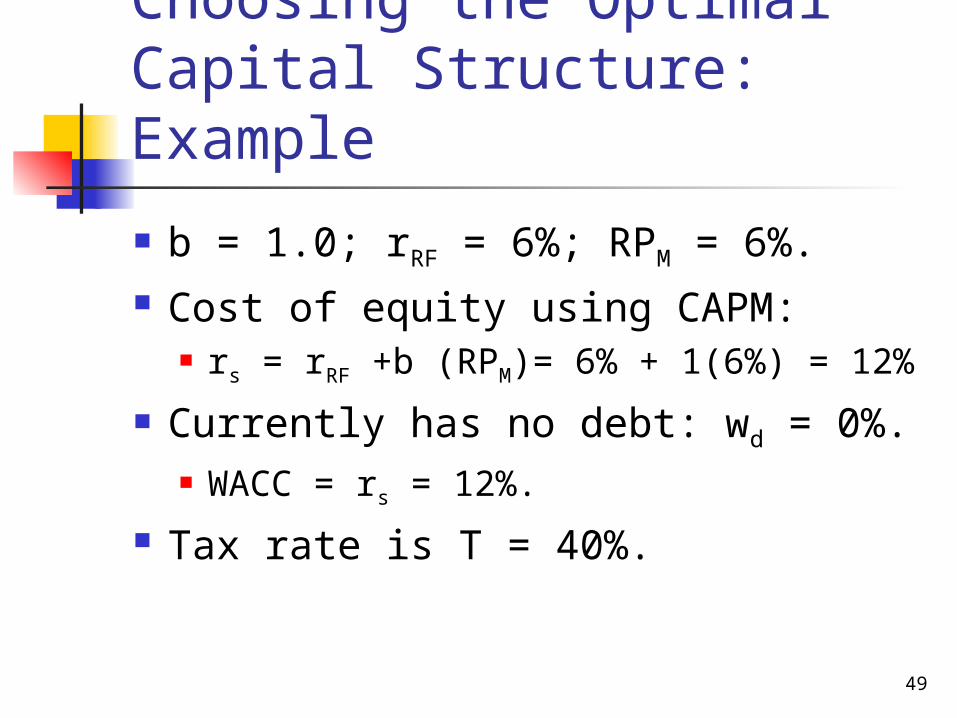
Choosing the Optimal Capital Structure: Example
b = 1.0; rRF = 6%; RPM = 6%. Cost of equity using CAPM:
rs = rRF +b (RPM)= 6% + 1(6%) = 12%
Currently has no debt: wd = 0%. WACC = rs = 12%.
Tax rate is T = 40%.

50
Current Value of Operations
Expected FCF = $30 million. Firm expects zero growth: g = 0. Vop = [FCF(1+g)]/(WACC − g)
Vop = [$30(1+0)]/(0.12 − 0)
Vop = $250 million.
51
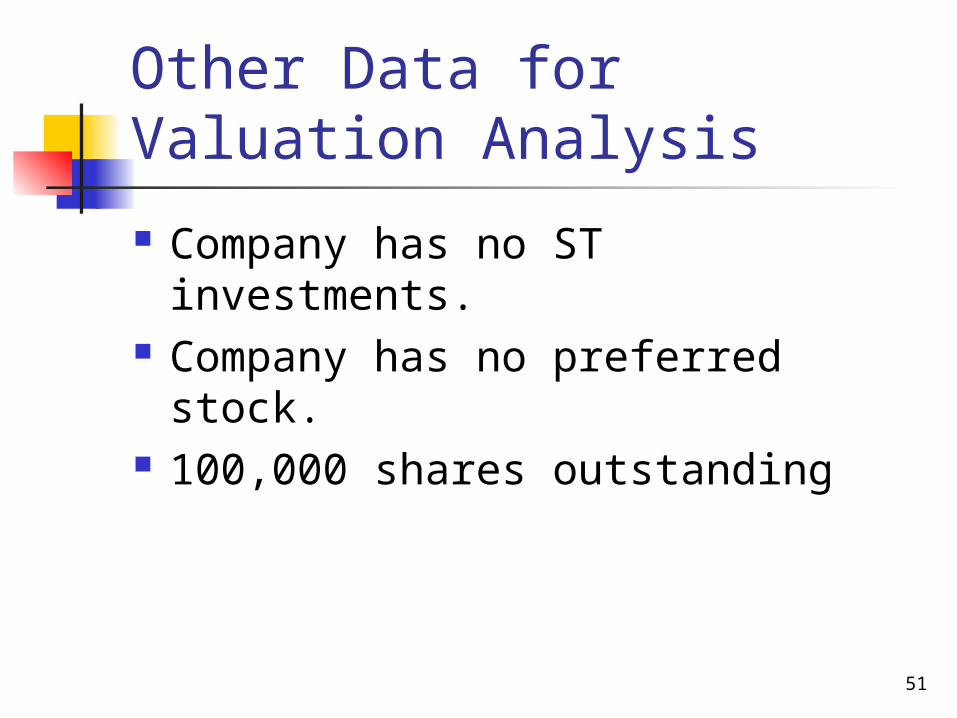
Other Data for Valuation Analysis
Company has no ST investments. Company has no preferred stock. 100,000 shares outstanding

52
Current Valuation Analysis
Vop $250
+ ST Inv. 0 VTotal $250
− Debt 0S $250
÷ n 10 P $25.00

53
Investment bankers provided estimates of rd for different capital structures.
wd 0% 20% 30% 40% 50%
rd 0.0% 8.0% 8.5% 10.0% 12.0%
If company recapitalizes, it will use proceeds from debt issuance to repurchase stock.

54
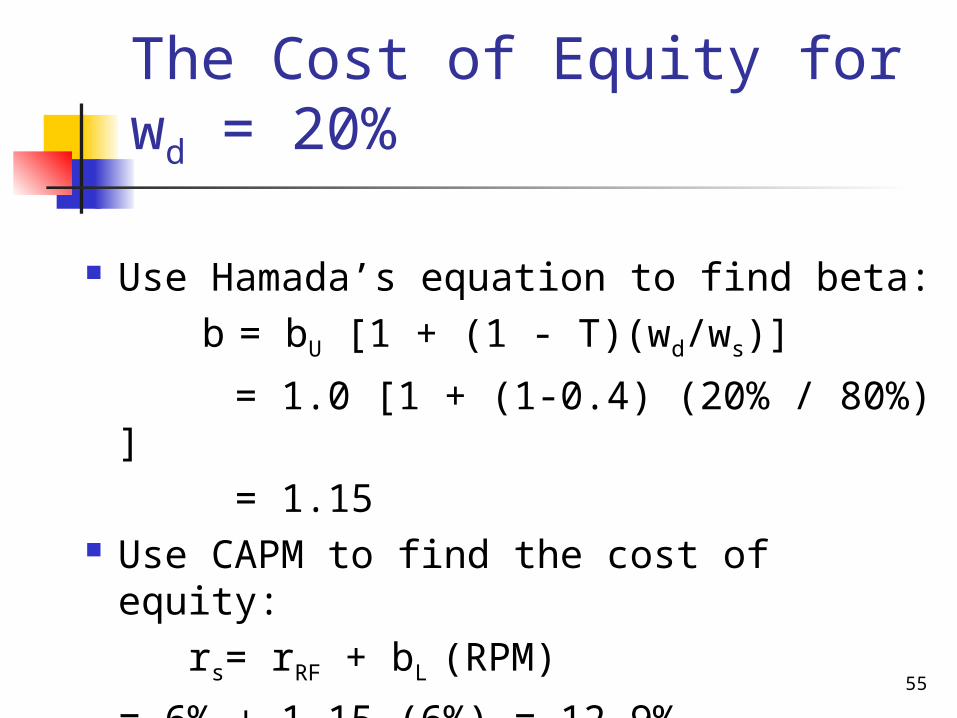
The Cost of Equity at Different Levels of Debt: Hamada’s Formula
MM theory implies that beta changes with leverage.
bU is the beta of a firm when it has no debt (the unlevered beta)
b = bU [1 + (1 - T)(wd/ws)]
55
The Cost of Equity for wd = 20%
Use Hamada’s equation to find beta: b = bU [1 + (1 - T)(wd/ws)]
= 1.0 [1 + (1-0.4) (20% / 80%) ] = 1.15
Use CAPM to find the cost of equity: rs= rRF + bL (RPM)
= 6% + 1.15 (6%) = 12.9%
56
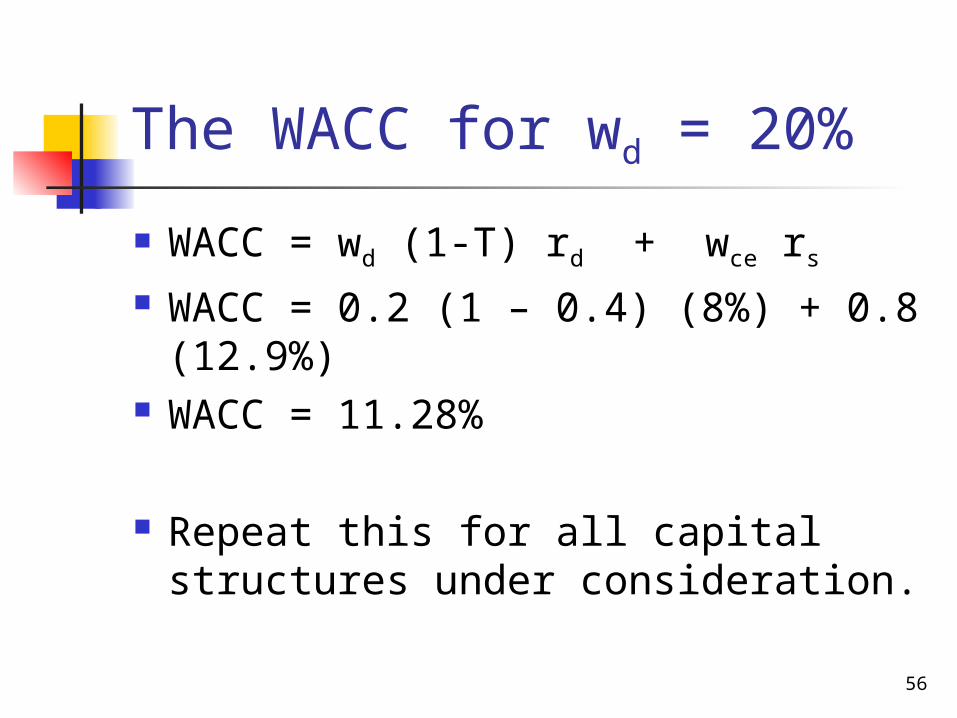
The WACC for wd = 20%
WACC = wd (1-T) rd + wce rs
WACC = 0.2 (1 – 0.4) (8%) + 0.8 (12.9%)
WACC = 11.28%
Repeat this for all capital structures under consideration.

57
Beta, rs, and WACC
wd 0% 20% 30% 40% 50%
rd 0.0% 8.0% 8.5% 10.0% 12.0%
ws 100% 80% 70% 60% 50%
b 1.000 1.150 1.257 1.400 1.600
rs 12.00% 12.90% 13.54% 14.40% 15.60%
WACC 12.00% 11.28% 11.01% 11.04% 11.40%
The WACC is minimized for wd = 30%. This is the optimal capital structure.

58
Corporate Value for wd = 20%
Vop = [FCF(1+g)]/(WACC − g)
Vop = [$30(1+0)]/(0.1128 − 0)
Vop = $265.96 million.
Debt = DNew = wd Vop
Debt = 0.20(265.96) = $53.19 million.
Equity = S = ws Vop
Equity = 0.80(265.96) = $212.77 million.

59
Value of Operations, Debt, and Equity
wd 0% 20% 30% 40% 50%
rd 0.0% 8.0% 8.5% 10.0% 12.0%
ws 100% 80% 70% 60% 50%
b 1.000 1.150 1.257 1.400 1.600
rs 12.00% 12.90% 13.54% 14.40% 15.60%
WACC 12.00% 11.28% 11.01% 11.04% 11.40%
Vop $250.00 $265.96 $272.48
$271.74 $263.16
D $0.00 $53.19 $81.74 $108.70 $131.58
S $250.00 $212.77 $190.74 $163.04 $131.58
Value of operations is maximized at wd = 30%.
60
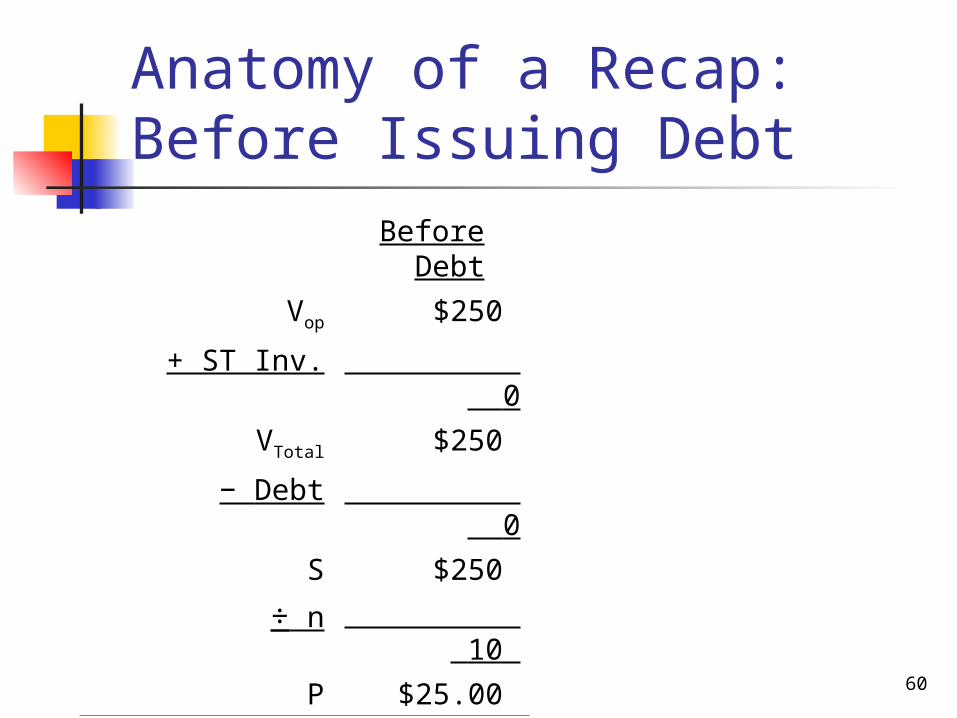
Anatomy of a Recap: Before Issuing Debt
Before Debt
Vop $250
+ ST Inv. 0
VTotal $250
− Debt 0
S $250
÷ n 10
P $25.00
Total shareholder
wealth: S + Cash $250
61
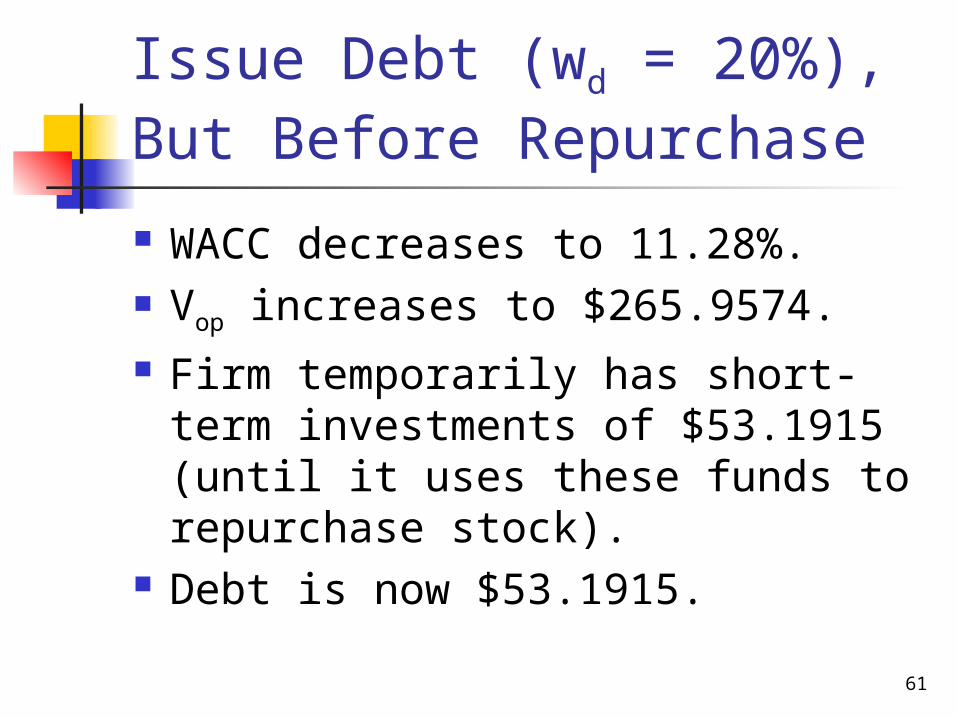
Issue Debt (wd = 20%), But Before Repurchase
WACC decreases to 11.28%. Vop increases to $265.9574. Firm temporarily has short-term
investments of $53.1915 (until it uses these funds to repurchase stock).
Debt is now $53.1915.
62
Anatomy of a Recap: After Debt, but Before Repurchase
Before DebtAfter Debt,
Before Rep.
Vop $250 $265.96
+ ST Inv. 0 53.19
VTotal $250 $319.15
− Debt 0 53.19
S $250 $265.96
÷ n 10 10
P $25.00 $26.60
Total shareholder
wealth: S + Cash $250 $265.96

63
After Issuing Debt, Before Repurchasing Stock
Stock price increases from $25.00 to $26.60.
Wealth of shareholders (due to ownership of equity) increases from $250 million to $265.96 million.
64
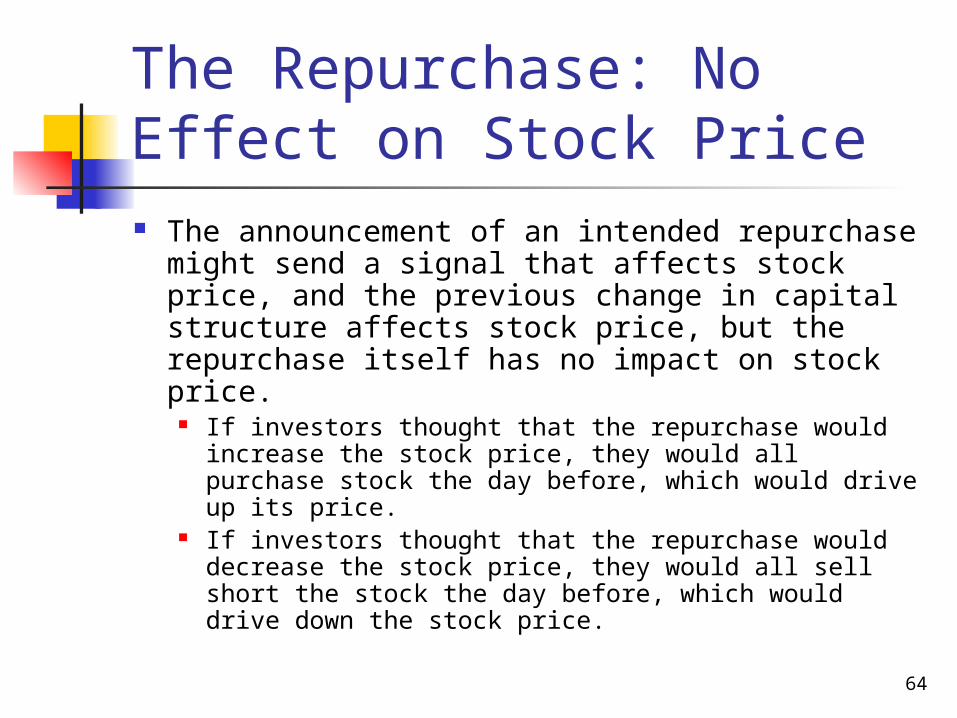
The Repurchase: No Effect on Stock Price The announcement of an intended repurchase
might send a signal that affects stock price, and the previous change in capital structure affects stock price, but the repurchase itself has no impact on stock price.
If investors thought that the repurchase would increase the stock price, they would all purchase stock the day before, which would drive up its price.
If investors thought that the repurchase would decrease the stock price, they would all sell short the stock the day before, which would drive down the stock price.
65
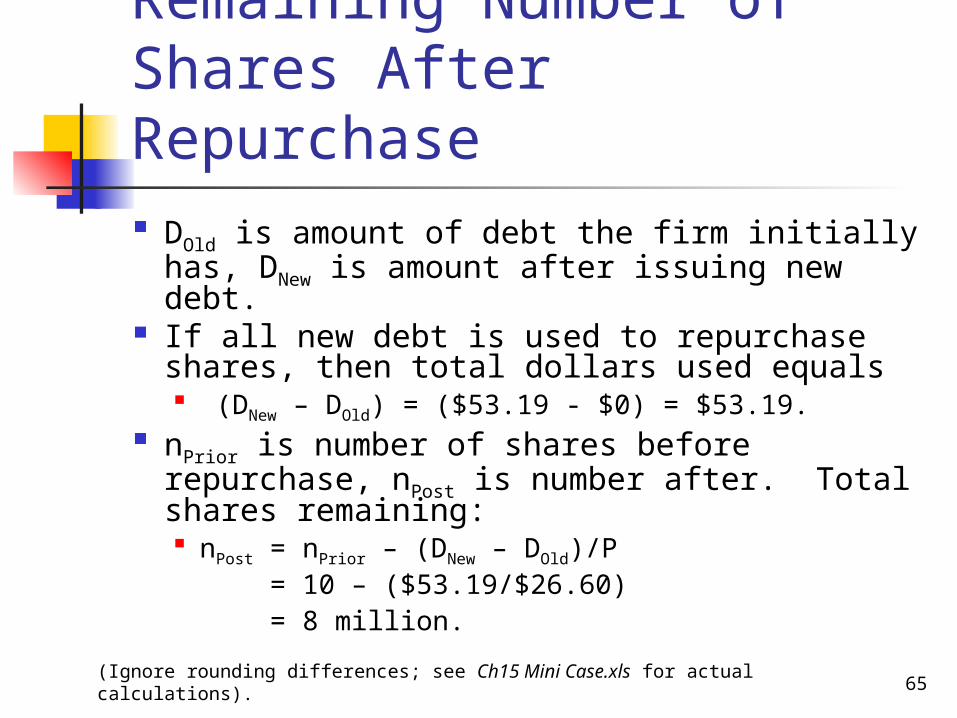
Remaining Number of Shares After Repurchase DOld is amount of debt the firm initially has,
DNew is amount after issuing new debt. If all new debt is used to repurchase shares,
then total dollars used equals (DNew – DOld) = ($53.19 - $0) = $53.19.
nPrior is number of shares before repurchase, nPost is number after. Total shares remaining: nPost = nPrior – (DNew – DOld)/P
nPost = 10 – ($53.19/$26.60)nPost = 8 million.
(Ignore rounding differences; see Ch15 Mini Case.xls for actual calculations).
66
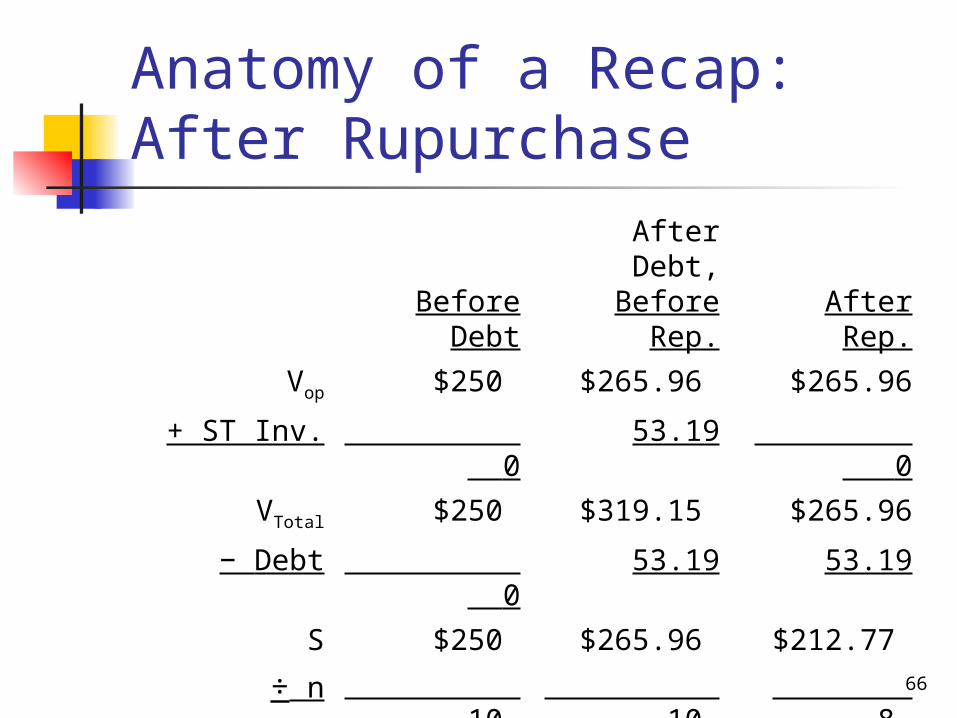
Anatomy of a Recap: After Rupurchase
Before DebtAfter Debt,
Before Rep. After Rep.
Vop $250 $265.96 $265.96
+ ST Inv. 0 53.19 0
VTotal $250 $319.15 $265.96
− Debt 0 53.19 53.19
S $250 $265.96 $212.77
÷ n 10 10 8
P $25.00 $26.60 $26.60
Total shareholder
wealth: S + Cash $250 $265.96 $265.96

67
Key Points ST investments fall because they are
used to repurchase stock. Stock price is unchanged. Value of equity falls from $265.96 to
$212.77 because firm no longer owns the ST investments.
Wealth of shareholders remains at $265.96 because shareholders now directly own the funds that were held by firm in ST investments.

68
Intrinsic Stock Price Maximized at Optimal Capital Structure
wd 0% 20% 30% 40% 50%
rd 0.0% 8.0% 8.5% 10.0% 12.0%
ws 100% 80% 70% 60% 50%
b 1.000 1.150 1.257 1.400 1.600
rs 12.00% 12.90% 13.54% 14.40% 15.60%
WACC 12.00% 11.28% 11.01% 11.04% 11.40%
Vop $250.00 $265.96 $272.48
$271.74 $263.16
D $0.00 $53.19 $81.74 $108.70 $131.58
S $250.00 $212.77 $190.74 $163.04 $131.58
n 10 8 7 6 5
P $25.00 $26.60 $27.25 $27.17 $26.32
69
Shortcuts
The corporate valuation approach will always give the correct answer, but there are some shortcuts for finding S, P, and n.
Shortcuts on next slides.
70
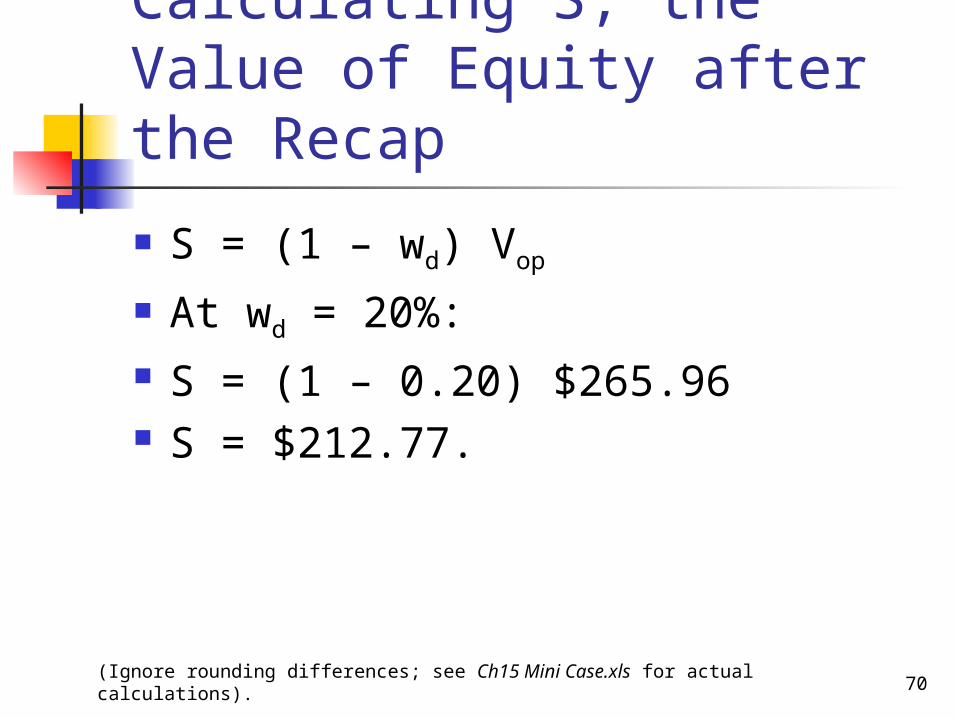
Calculating S, the Value of Equity after the Recap
S = (1 – wd) Vop
At wd = 20%: S = (1 – 0.20) $265.96 S = $212.77.
(Ignore rounding differences; see Ch15 Mini Case.xls for actual calculations).
71
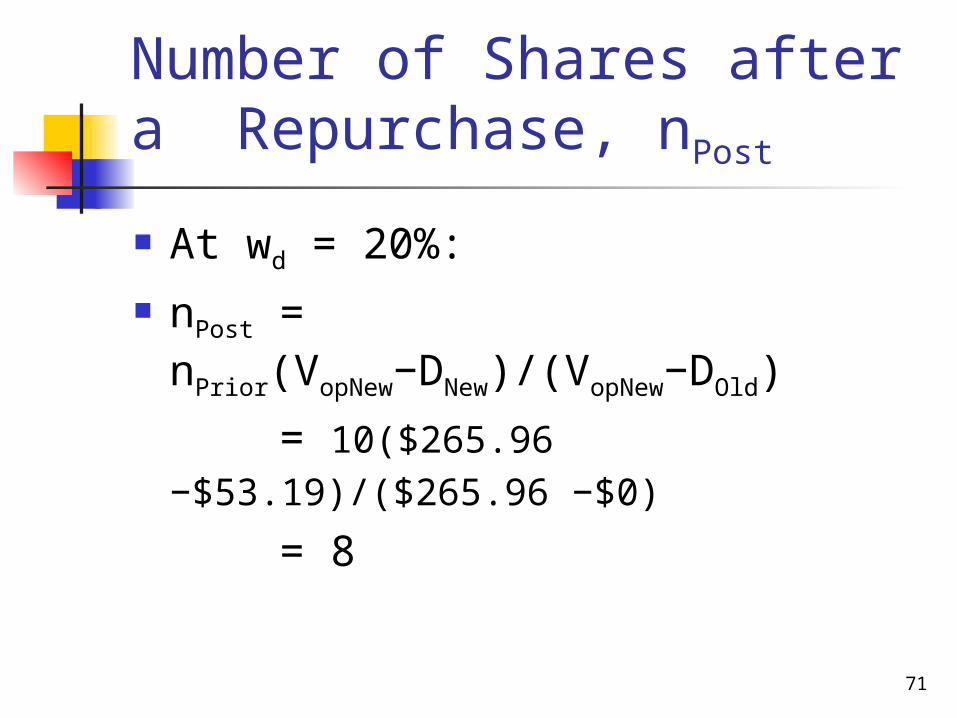
Number of Shares after a Repurchase, nPost
At wd = 20%: nPost = nPrior(VopNew−DNew)/(VopNew−DOld)
nPost = 10($265.96 −$53.19)/($265.96 −$0)
nPost = 8
72
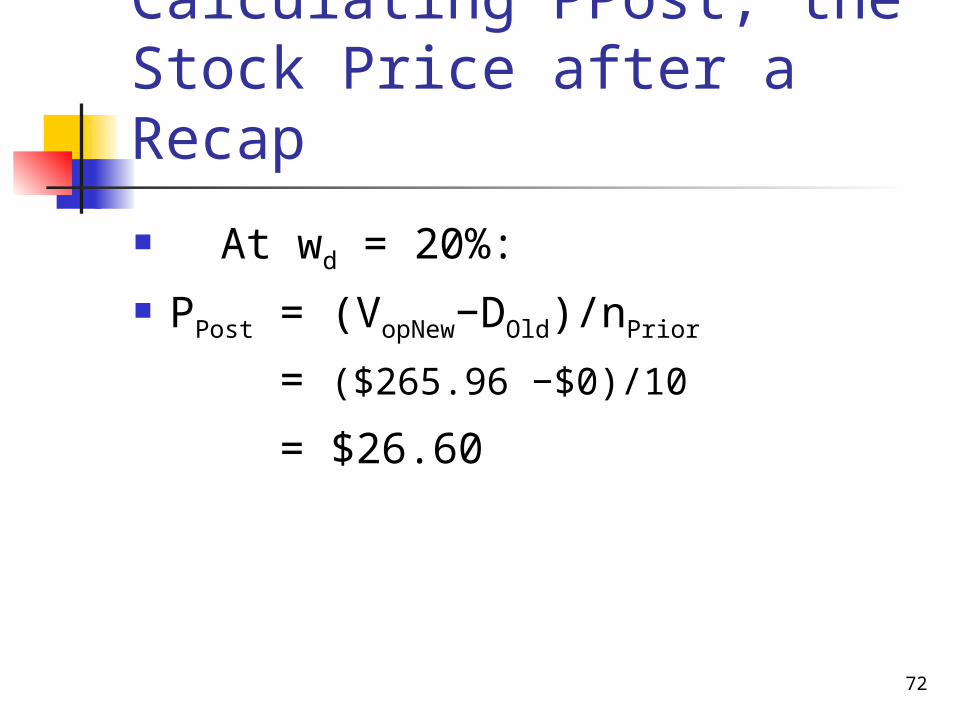
Calculating PPost, the Stock Price after a Recap
At wd = 20%: PPost = (VopNew−DOld)/nPrior
nPost = ($265.96 −$0)/10
nPost = $26.60

73
Optimal Capital Structure
wd = 30% gives: Highest corporate value Lowest WACC Highest stock price per share
But wd = 40% is close. Optimal range is pretty flat.

Part B
74
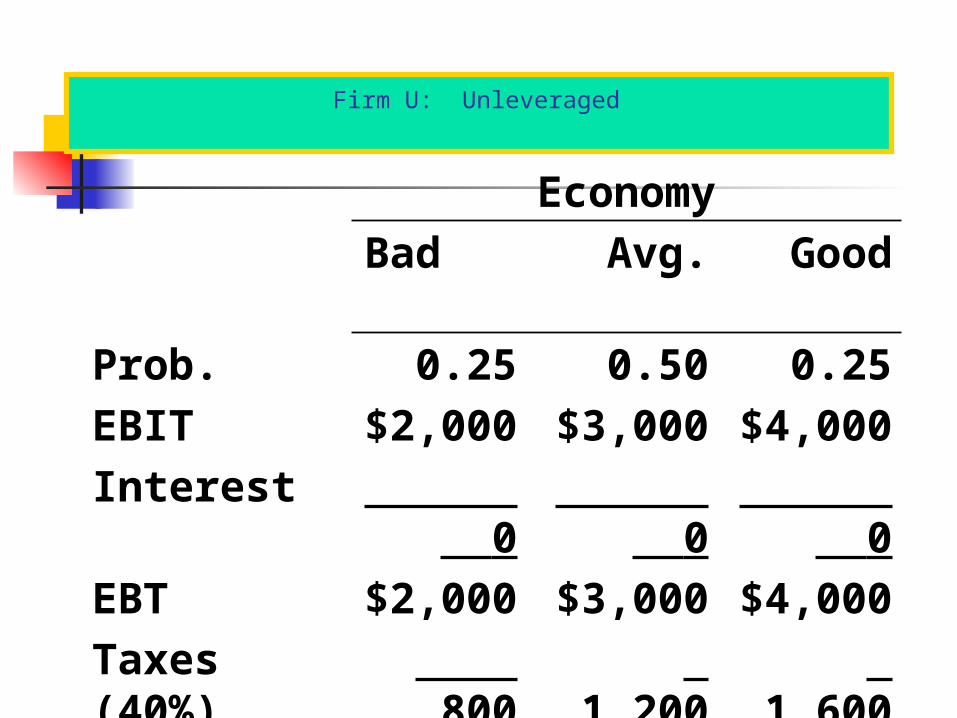
Firm U: Unleveraged
Economy
Bad Avg. Good
Prob. 0.25 0.50 0.25
EBIT $2,000 $3,000 $4,000
Interest 0 0 0
EBT $2,000 $3,000 $4,000
Taxes (40%) 800 1,200 1,600
NI $1,200 $1,800 $2,400

Firm L: Leveraged
*Same as for Firm U.
EconomyBad Avg. Good
Prob.* 0.25 0.50 0.25
EBIT* $2,000 $3,000 $4,000
Interest 1,200 1,200 1,200
EBT $ 800 $1,800 $2,800
Taxes (40%) 320 720 1,120
NI $ 480 $1,080 $1,680

*ROI = (NI + Interest)/Total financing.
8 8 8
Firm U Bad Avg. Good
BEP 10.0% 15.0% 20.0%
ROI* 6.0% 9.0% 12.0%
ROE 6.0% 9.0% 12.0%
TIE
Firm L Bad Avg. Good
BEP 10.0% 15.0% 20.0%
ROI* 8.4% 11.4% 14.4%
ROE 4.8% 10.8% 16.8%
TIE 1.7x 2.5x 3.3x
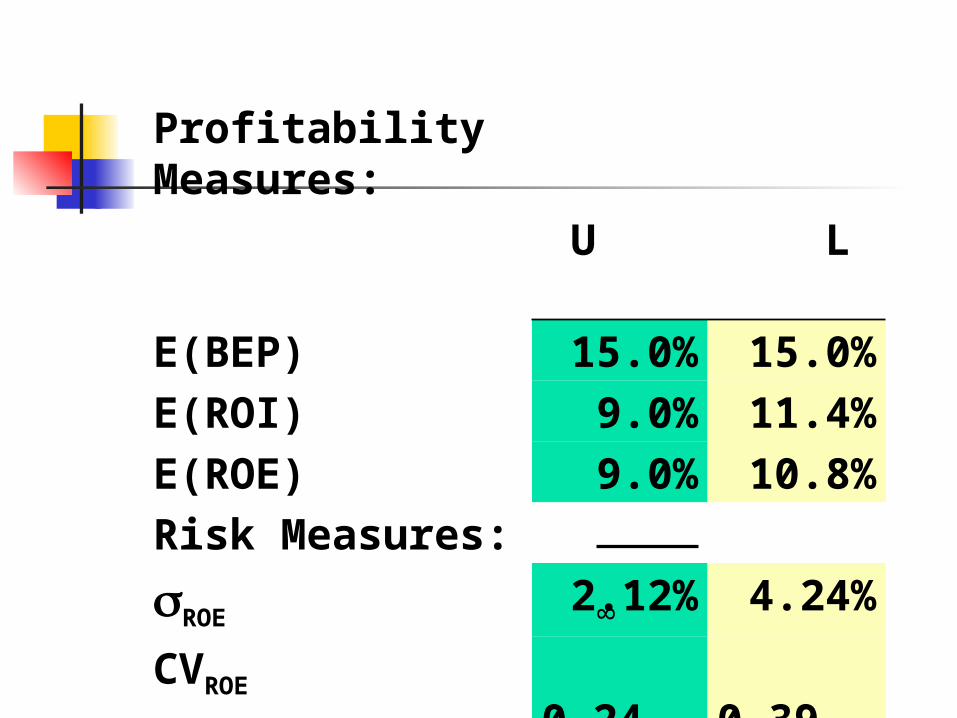
Profitability Measures:
U L
E(BEP) 15.0% 15.0%
E(ROI) 9.0% 11.4%
E(ROE) 9.0% 10.8%
Risk Measures:
ROE2.12% 4.24%
CVROE 0.24 0.39
E(TIE) 2.5x8

Conclusions Basic earning power = BEP =
EBIT/Total assets is unaffected by financial leverage.
L has higher expected ROI and ROE because of tax savings.
L has much wider ROE (and EPS) swings because of fixed interest charges. Its higher expected return is accompanied by higher risk.
(More...)

In a stand-alone risk sense, Firm L’s stockholders see much more risk than Firm U’s. U and L: ROE(U) = 2.12%.
U: ROE = 2.12%.
L: ROE = 4.24%.
L’s financial risk is ROE - ROE(U) = 4.24% - 2.12% = 2.12%. (U’s is zero.)
(More...)
For leverage to be positive (increase expected ROE), BEP must be > kd.
If kd > BEP, the cost of leveraging will be higher than the inherent profitability of the assets, so the use of financial leverage will depress net income and ROE.
In the example, E(BEP) = 15% while interest rate = 12%, so leveraging “works.”

The Optimal Capital Structure
Calculate the cost of equity at each level of debt.
Calculate the value of equity at each level of debt.
Calculate the total value of the firm (value of equity + value of debt) at each level of debt.
The optimal capital structure maximizes the total value of the firm.
Sequence of Events in a Recapitalization
Firm announces the recapitalization.
Investors reassess their views and estimate a new equity value.
New debt is issued and proceeds are used to repurchase stock at the new equilibrium price.
(More...)

Shares Debt issued Bought New price/share
After recapitalization firm would have more debt but fewer common shares outstanding.
An analysis of several debt levels is given next.
= .

Cost of Equity at Zero Debt
Since the firm has 0 growth, its current value, $2,000,000, is given by
Dividends/kS = (EBIT)(1-T)/kS = 500,000 (1 - 0.40)/kS
kS = 15.0% = unlevered cost of equity.
bU = (kS - kRF)/RPM = (15 - 6)/4 = 2.25

Cost of Equity at Each Debt Level Hamada’s equation says that
bL = bU (1 + (1-T)(D/E))
Debt(000s) D/E bL kS
0 0 2.25 15.00%
250 0.142 2.44 15.77
500 0.333 2.70 16.80
750 0.600 3.06 18.24
1,000 1.000 3.60 20.40

D = $250, kd = 10%, ks = 15.77%.
S1 =
= = $1,807.
V1 = S1 + D1 = $1,807 + $250 = $2,057.
P1 = = $20.57.
[$500 - 0.1($250)](0.6)0.1577
$2,057 100
(EBIT - kdD)(1 - T)ks

Shares $250 repurchased $20.57
Shares remaining
Check on stock price:
P1 = = = $20.57.
Other debt levels treated similarly.
S1
n1
$1,80787.85
= = 12.15.
= n1 = 100 - 12.15 = 87.85.

Value of Equity at Each Debt Level Equity Value = Dividends/kS
Debt(000s) kD Divs kS E
0 na 300 15.00% 2,000
250 10% 285 15.77 1,807
500 11% 267 16.80 1,589
750 13% 241.5 18.24 1,324
1,000 16% 204 20.40 1,000
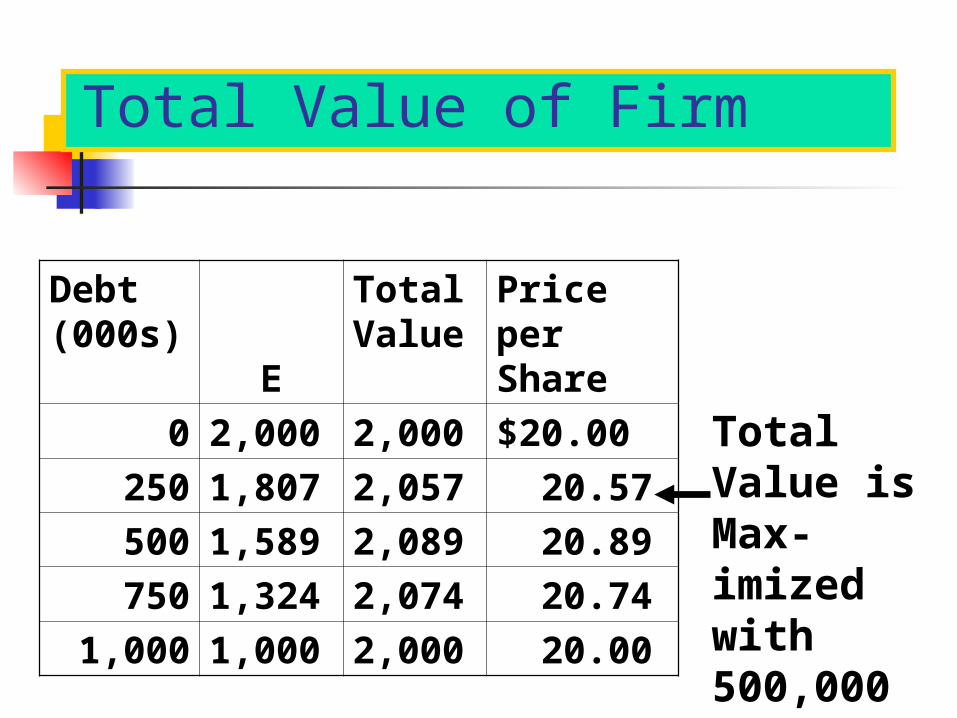
Total Value of Firm
Total Value is Max-imized with 500,000 in debt.
Debt (000s) E
Total Value
Price per Share
0 2,000 2,000 $20.00
250 1,807 2,057 20.57
500 1,589 2,089 20.89
750 1,324 2,074 20.74
1,000 1,000 2,000 20.00

Calculate EPS at debt of $0, $250K, $500K, and $750K, assuming that the firm begins at zero debt and recap-italizes to each level in a single step.
Net income = NI = [EBIT - kd D](1 - T).EPS = NI/n.
D NI n EPS
$ 0 $300 100.00 $3.00250 285 87.85 3.24
500 267 76.07 3.51750 242 63.84 3.78

EPS continues to increase beyond the $500,000 optimal debt level.
Does this mean that the optimal debt level is $750,000, or even higher?

Find the WACC at each debt level.
e.g. D = $250:WACC = ($250/$2,057)(10%)(0.6)
+ ($1,807/$2,057)(15.77%)= 14.6%.
D S V kd Ks WACC
$ 0 $2,000 $2,000 -- 15.00% 15.0%
250 1,807 2,057 10% 15.77 14.6
500 1,589 2,089 11.0 16.80 14.4
750 1,324 2,074 13.0 18.24 14.5
1,000 1,000 2,000 13.0 20.40 15.0
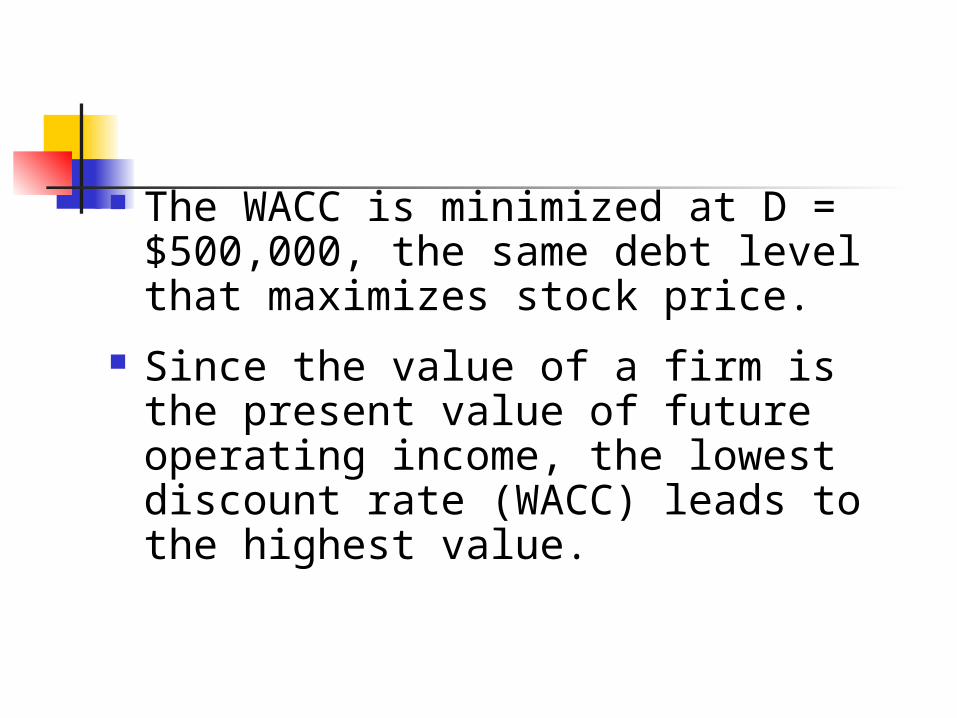
The WACC is minimized at D = $500,000, the same debt level that maximizes stock price.
Since the value of a firm is the present value of future operating income, the lowest discount rate (WACC) leads to the highest value.

At any debt level, the firm’s probability of financial distress would be higher. Both kd and ks would rise faster than before. The end result would be an optimal capital structure with less debt.
Lower business risk would have the opposite effect.
How would higher or lowerbusiness risk affect
the optimal capital structure?

No. The analysis above was based on the assumption of zero growth, and most firms do not fit this category.
Further, it would be very difficult, if not impossible, to estimate ks with any confidence.
Is it possible to do an analysis exactly like the one above for most firms?
Financial forecasting models can help show how capital structure changes are likely to affect stock prices, coverage ratios, and so on.
What type of analysis should firms conduct to help find their optimal, or target, capital structure?
(More...)

Forecasting models can generate results under various scenarios, but the financial manager must specify appropriate input values, interpret the output, and eventually decide on a target capital structure.
In the end, capital structure decision will be based on a combination of analysis and judgment.

Debt ratios of other firms in the industry.
Pro forma coverage ratios at different capital structures under different economic scenarios.
Lender and rating agency attitudes(impact on bond ratings).
What other factors would managers consider when setting the target
capital structure?

Reserve borrowing capacity.
Effects on control.
Type of assets: Are they tangible, and hence suitable as collateral?
Tax rates.
Related Documents