1 ‘Changing Face of Global Footwear Sourcing and Distribution’ – China and Beyond EXPOPELE 2015, New PT Leather Industry Event Multiusos Pavilion, Alcanena, Portugal May 2, 2015 Peter T. Mangione Managing Director Global Footwear Partnerships LLC [email protected]

1 ‘Changing Face of Global Footwear Sourcing and Distribution’ – China and Beyond EXPOPELE 2015, New PT Leather Industry Event Multiusos Pavilion, Alcanena,
Jan 03, 2016
Welcome message from author
This document is posted to help you gain knowledge. Please leave a comment to let me know what you think about it! Share it to your friends and learn new things together.
Transcript

1
‘Changing Face of Global Footwear Sourcing and Distribution’ – China and Beyond
EXPOPELE 2015, New PT Leather Industry EventMultiusos Pavilion, Alcanena, PortugalMay 2, 2015
Peter T. MangioneManaging DirectorGlobal Footwear Partnerships [email protected]

Global Footwear Overview
• Supply and Demand: Big Picture• Demand Details: US, EU, China• Sourcing Details: China and Beyond• Demographics: Race to get rich before getting
old• Summary

Shoe Sector – What’s Next?

4
Country Production Exports Imports
China India VietnamBrazil
14,500 (2.1)2,065 (0)1,035 (15.0)900 (4.1)
10,740 (1.5)130 (10.0)920 (15.0)130 (5.4)
73 (32)90 (10.0)40 (10)37(-6.0)
Indonesia EUMexico ThailandRussiaKoreaJapanTaiwanUS
725 (0)570 (-5.0)230 (-6.0)250 (0)11485 (6.3)69.2(-6.5)40 (0)40(8.0)
332 (0)225.6 (-1.4)26 (0)100 (-9.0)4.830 (22.0)1.2 (0)17.2 (3.6)18.0(5.0)
33 (10.0)2,592.4 (8.3)100(17.0)45 (0)354.4169 (30.0)629 (1.6)75 (5.6)2,332.7(-0.3)
March 2015
World Footwear Supply, Selected Countries (millions of pairs), 2014 Source: Industry estimates. ( ) % of change

5
Country Consumption Pairs Per Person Import Penetration
China 3,833 (4.1) 3.0(3.5) 1.9 (27)EU 2,936 (6.8) 5.9(2.0) 88 (1.5)US 2,332.7 (-0.3) 7.4(-2.0) 99 (0)India 2,029.1(0) 1.7 (0) 4 (0)BrazilJapanIndonesiaRussiaMexicoKoreaThailandCanadaVietnamAustralia Taiwan
807 (-1.0)697 (0)426 (0)463.6330 (8.6)224 (20)195 (5.0)164 (0)172 (15)100 (0)98 (3.2)
4.0(-4.7)5.5 (0)2.2(0)3.252.7(3.6)4.6 (21)3.0(10)5.2 (0)1.9 (12)4.6 (0)4.3 (4.9)
4.6 (-4.2)90 (1.1)6 (-10)7630(7.1)75 (7.1)24 (0)99 (0)58(-3)95 (0)77 (0)
March 2015
World Footwear Consumption, Selected Countries (millions of pairs), 2014Source: Industry estimates, ( ) % of change

•
6
Decline of Leather Shoes Accelerates
Share of leather shoes in exports
vol% value%
US Consumption by Upper Material 2011 (Pairs)
LeatherPlastic/rubberTextileWaterproofOther
0%
32%
32%
1%35%

EU 27 Consumption by Upper Material 2011 (Pairs)
LeatherPlastic/rubberTextileWaterproofOther
5%
29%
39%
2.5%24.5%

Total US Imports US Imports
from China
Category 2014 2013 % Change 2014 2013 % Change
Footwear 12,690.4 12,238 3.7 7,250.0 7,230.6 0.3
Apparel 542.1 560.4 -3.3 235.5 263.0 -11.7
Gloves 445.7 391.9 13.7 319.6 286.5 11.5
Other 624.7 580.8 7.6 396.7 374.5 5.9
Finished 2,171.6 2,099.2 3.4 66.5 72.3 -8.7
Total 16,477.0 15,870.3 3.8 8,268.3 8,226.9 0.5
9
US Imports of Leather Goods 2014
All amounts are in millions of US dollars

President Obama – Did you lose power?

11
• US economy slowly growing, but with 9 million unemployed, it will take years to recover – 2.4% GDP growth for 2014 and maybe 3.0% in 2015
• Banks are starting to lend to businesses and consumers --- auto and housing sales are up but credit is still tight
• Hiring held back due to government imposed costs for health care, financial regulation, and prospect of higher taxes
•Lack of confidence and uncertainty still restraining investment
• Massive injections of Fed money in banking system raise specter of future inflation and slow growth, trend back to normal interest rates, when? Impact of souring dollar?
•New CULTURE OF THRIFT has taken hold in the US, and spending levels by consumers, that accounts for 70% of GDP, may never reach pre-crisis rates
Growth and Jobs Picking Up
11

12
US Growth Looks Good – But …

•Some $60 billion in annual retail shoe sales•On average, some 7 pair person sold annually, more than 2.2 billion pair
•Highly concentrated retail and brands, dominated by mega firms•Nearly half of all retail shoe sales by Wal-mart, Payless, Target, K-mart, etc.
•Some 45% of all shoe sales are athletic, mostly Nike, adidas, New Balance
•National brands, those sold by numerous retailers, have less than 50% market share
•All national brands sold in the US are US based, just a handful of exceptions
•Only about a third of shoe sales are leather items, rest are synthetic and textile
US Footwear Market: The Fundamentals
13

US Footwear Imports 2014Country Pairs % Change Value % Change Unit Value % Change
China (79.0%) 1,841.7 -2.7 16,678.2 0.3 9.05 3.1
Vietnam (11.2%)* 273.2 18.1 3,532.5 22.6 12.93 3.3
Indonesia (3.7%) 85.6 0.5 1,218.4 5.9 14.23 5.4
India (0.8%)* 18.1 10.3 336.6 17.6 18.60 6.5
Mexico (0.8%) 17.7 -9.2 446.1 -7.9 25.20 1.7
Italy (0.7%) 16.6 9.7 1,427.6 8.3 86.02 7.3
Cambodia (0.6%)* 13.6 134.5 123.8 118.0 9.10 -7.0
Brazil (0.5%)* 12.7 18.7 203.5 3.5 16.02 -12.8
Dom Rep (0.4%) 10.0 10.4 255.4 9.8 25.54 -1.0
Thailand (0.3%) 7.2 -3.3 109.3 3.0 15.18 5.9
Spain (0.2%) 3.8 10.4 211.8 14.5 55.73 5.6
Bangladesh (0.1%) 2.6 55.3 61.6 83.8 23.69 17.3
Portugal (0.1%) 2.1 27.0 104.3 28.8 49.99 0.9
Ethiopia (0.1%) 1.6 22.1 NA NA 11.75 NA
Nicaragua (0.1%) .916 82.0 NA NA 15.00 (Est) NA
World Total 2,332.7 -0.3 25,309.6 4.7 10.85 4.5
14

US Leather Footwear Imports 2014Country Pairs % Change Value % Change Unit Value % Change
China (65.0%) 381.8 -6.5 7,250.1 -1.0 18.99 5.9
Vietnam (15.8%)* 92.8 14.7 1,643.6 21.3 17.71 5.7
Indonesia (7.0%) 41.0 -2.3 636.5 0.0 15.52 4.9
India (2.5%)* 14.4 21.0 310.0 18.4 21.53 5.2
Italy(1.9%)* 10.9 8.4 1,214.0 7.2 111.38 -1.6
Dom Rep(1.4%)* 8.4 3.0 233.6 7.3 27.74 3.5
Mexico (1.4%) 8.1 -13.7 379.7 -9.6 46.88 1.7
Brazil (0.8%) 4.9 -1.1 163.6 0.5 33.39 2.6
Thailand (0.7%) 4.2 -11.1 73.1 -2.9 17.40 10.9
Spain (0.5%)* 2.9 8.7 179.6 15.5 61.93 7.6
Cambodia (0.5%)* 2.7 28.6 43.8 53.7 16.22 19.5
Bangladesh (0.4%)* 2.2 67.2 58.7 93.7 26.68 14.5
Portugal (0.3%)* 1.9 29.5 95.3 26.6 50.16 -5.9
Ethiopia (0.2%)* 1.4 57.9 17.2 14.7 12.29 -29.4
Nicaragua (0.1%) .916 82.0 NA NA 15.00 (Est) NA
World Total 587.5 -1.8 12,690.4 3.7 21.60 5.6
15

US Footwear Consumer Distribution – Radical Changes
• US shoe sales to consumers up 7% (about $3.5 billion) to $56 billion since 2011 – largely driven by strong performance of branded athletic items, surging boot sales (both women and men) and fashion sandals
• Since 2011, nearly half the shoe sales growth has been in the age group 55 and above – the ‘boomers’ seem unstoppable!
• During 2013, retail store customer traffic fell by some 3% (May and June 2014 down 8% and 10%)
• Three quarters of the growth in shoe sales since 2011 has been on line!• Overall in 2013, on line accounted for about 20% of all shoe sales or some
$10.5 billion (Germany by contrast, 12% of shoe sales are online)• About 60% of on line shoe sales are by companies that operate retail stores,
while 40% is pure internet players like Zappos• Women’s 51% Men’s 36% and Kids 13% (Germany: 69%,19% and 7%)• NPD data for US

Leading US Department Stores
17
2014 Same Store Sales 4/3/2/1 Q
2013Same Store Sales 4/3/2/1 Q
Average Square Footage
Shoes %of Total Sales
Store Count
Sales 2014/2013
Total
Nordstrom's 4.7/3.9/3.3/3.92.2/0.1/-0.7/3
130,000 21% 292$13.1/12.2
Macy's 2.5/-0.7/3.4/-1.6
2.3/3/-0.8/4182,000 36%* 833 $28.1/27.9
Dillard's 3.0/-1.0/1.0/2.0
2.0/1/1/1
171,000 14% 277 $6.6/6.5
Wal-Mart US 1.5/0.5/0.0/-0.8 -.4/-.3/-.3/-1.4 180,000 1-2% 4,203 $288/279
Target 3.8/1.2/0.0/-0.3 -2.5/-.9/1.2/-.6 160,000 2-4% 1,790 $71.3/72.0
Kohl's 3.7/-1.6/1.3/-3.4 -2/-1.6/-.9/-1.9 100,000 4-5% 1,162 $19.0/19.0
*Includes women’s accessories, cosmetics, and intimate apparel as well as shoes. Note that sales percent of change is based on
comparable sales for the entire store, not just shoe sales. Comp store sales excludes units opened/closed during the year.
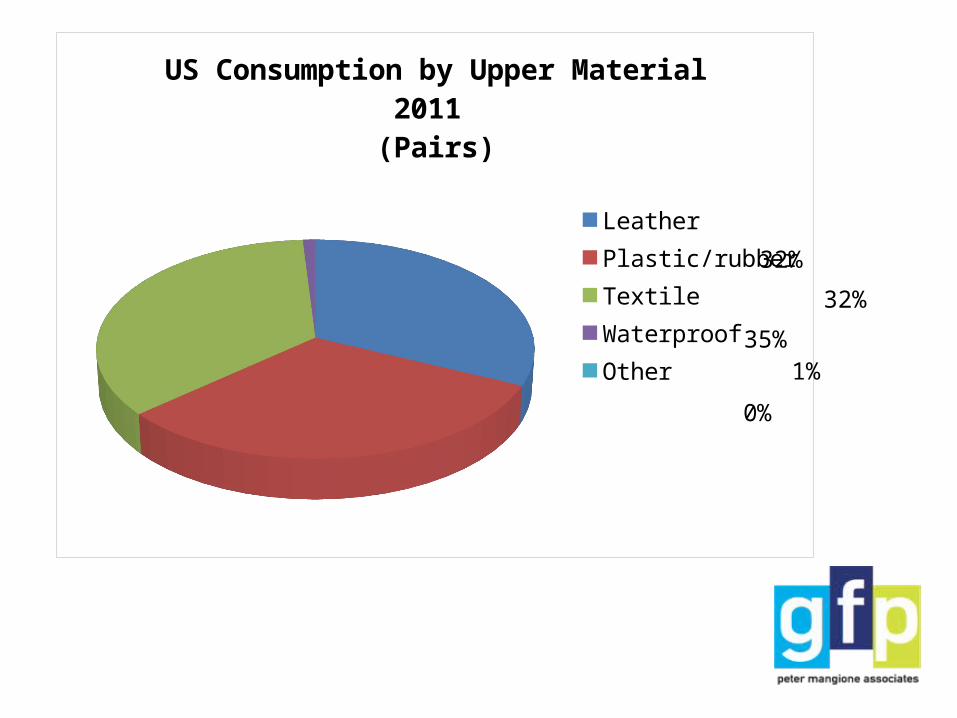
Company4th/ 3rd/2nd/1st Q
2014 2013 4th Q/3nd Q
2013 2nd Q/1st Total Stores Sales 2014
DSW* 7.6/2.6/0.8/-3.7 0/-0.7 4.4/-2.4 433 $2,500.0Famous* 4.0/-0.2/1.6/1.3 -1.8/4.9 6.8/1.1 1,129 $1,589.3Genesco* 10/1.0/4.0/1.0 0/-2 -1.0/-2.0 2,824 $2,860.0
Finish Line*2.6/4.5/1.5/5.0
6.3/0.9 2.4/0.7 1,167 $1,670.0
Footlocker*10.2/6.9/7.0/7.6
5.3/4.1 1.8/5.2 3,473 $7,151.0Brands
Nike+ 7.0/18/15/10.9
13/8 8/7 384 $25,300.0adidas+ 6.0/6.2/10/-6.0 12/-7 -4/-2 3,446 $15,987.0Brown Shoe(|) 6.3/18.2/7.7/5.6 13.5/4.5 12/-3 306 $982.5
Steve Madden+ -6.3/-0.7/0.0/ 9.2
9/11 3/5 121 $1,330.0
Sketchers+ 26.4/31/37/21.0
14/20 11/28 204 $2,337.6WWW+ 9.2/-0.8/4.4/-2.8 14/9 6/8 444 $2,760.0
U.S. Footwear Retail/BrandsPercent of Change 2014 - 2013
18
*Comparable stores sales for retailers.(|) Wholesale only. +Wholesale and retail.Retail year ends January 30, while brands have various closings.

Nike’s Dominance Accelerates

US shoe store landscape -- like no other in the world
It is dominated by mega store chains. There is only a modest share for independents. It is mostly a multi-brand retail environment. US consumers seem to prefer multi-brand formats to mono brand concepts -- the former being
more ‘destination –oriented’ and more convenient as a consequence. It is also heavily penetrated by self-service shoe retailers, both in mass market low price
environments, as well as better grade nationally branded shoes. The latter stands out as a unique US practice and is the fastest growing segment in a highly competitive and constantly shifting sales environment.
Remarkably, the powerhouse department stores and the big box self-service sellers of nationally branded shoes have found a modus vivendi.
Both now work in harmony -- and along with the athletic and non- athletic specialists and the mass market self-service retailers -- contribute to the un-paralleled choice and value in shoe offerings that are available today to US consumers and as yet, in the world, only to them.
What’s next for this market? o More consolidation? o More internet and fewer retail shops? o Invasion of foreign stores, brands, concepts? o More of the same?

Year Production Imports Exports (IP)20142013201220112010
570.0 (est)600.0(est)592.0582.0549.1
2,592.52,381.72,287.52,544.82,423.5
225.6 (88%)228.7(87%)217.0 (86%)194.0 (87%)154.4 (86%)
2009 549.1 2,233.6 154.4 (85%)2008 577.7 2,436.3 177.2 (86%)2007** 573.3 2,489.3 186.9 (87%)2006*200520032002
587.8609.0710.6803.2
2,158.51,939.71,296.11,050.0
173.4 (84%)161.5 (81%)192.6 (72%)220.6 (64%)
*EU 25** EU 27
EUROPEAN SHOE MARKET 2014-2002Units in millions of pairs. Only countries of the European Union. IP is import penetration proportion.

EU Footwear Imports 2014Country Pairs % Change Value/Euros % Change Unit Value % Change
China (74.1%) 1,921.2 6.1 8,027.5 6.1 4.18 0.0
Vietnam (9.5%)* 246.5 20.8 2,613.8 23.1 10.61 1.9
Indonesia (3.9%)* 100.5 1.1 1,174.8 0.1 11.69 -1.1
India (3.2%)* 82.8 14.6 1,132.2 15.4 13.67 0.7
Cambodia (1.2%)* 32.1 8.3 348.3 12.3 10.86 1.1
Turkey (1.2%)* 30.9 38.1 131.4 28.0 4.25 -7.3
Bangladesh (0.9%) 22.8 31.3 214.9 34.8 9.42 2.7
Brazil (0.7%) 19.0 65.5 118.8 0.1 7.26 -14.5
Tunisia (0.7%) 18.9 1.3 295.5 3.5 15.65 2.2
Bosnia & Hertz (0.7%) 18.8 11.1 275.5 18.1 14.60 6.4
Hong Kong (0.6%) 16.4 65.5 118.8 0.1 7.26 -39.6
Albania (0.6%) 15.4 31.8 184.6 31.8 11.97 0.0
Morocco (0.6%) 14.7 -3.0 246.6 -0.1 16.73 3.0
World Total 2,592.5 8.3 15,897.2 9.6 6.13 1.2
22

China – What’s Next?

China’s Major Challenges • Rising wages• Aging population• Declining productivity• Bloated and inefficient state enterprises• Internal party corruption• Dilemma of ‘tightening and loosening’ at the same time
– Restrain real estate speculation while keeping growth strong– Fluctuating value of RMB may discourage speculation but saps
stability need to drive investment. – Too much govt. stimulus spending, tripled money supply to $20
trillion since 2008 and now more money circulating in China than in US with an economy twice the size of China!
25
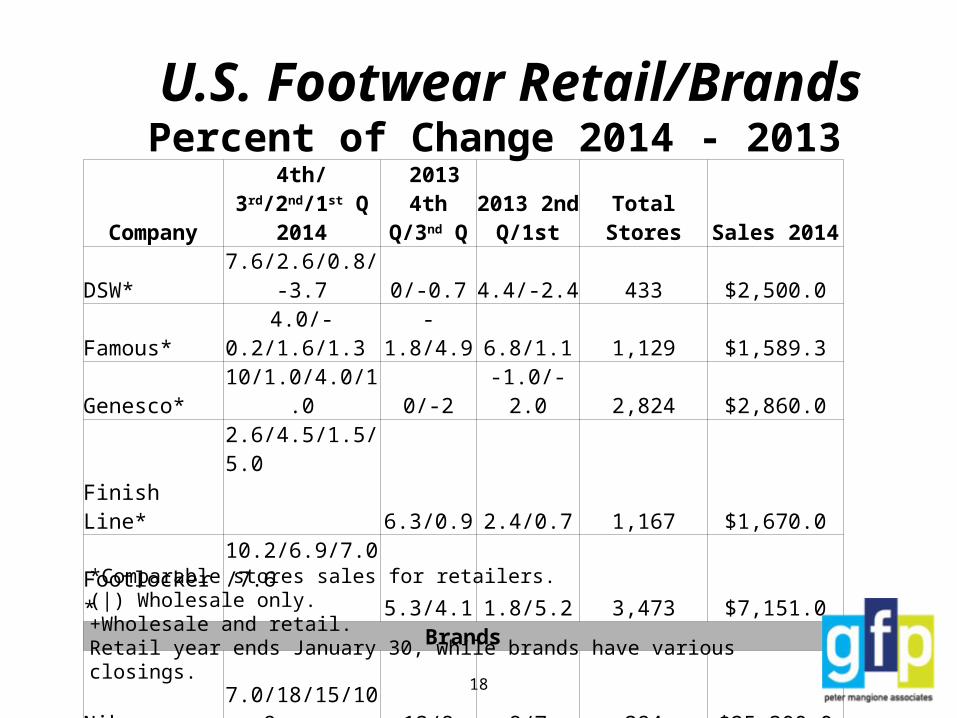
China’s Growth Slows
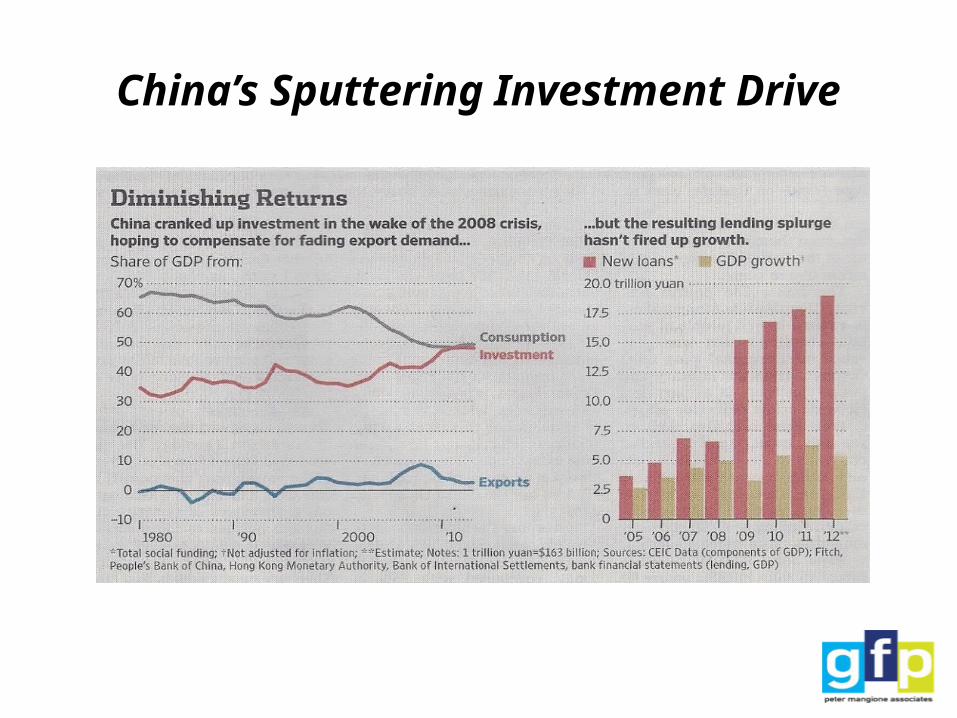
China’s Sputtering Investment Drive

27
Country Cost per Hour 2014/2013 (all costs included)
Cost % of Change 2014/2013
Exchange Rate USD 2014/2013 (% of change)
Ethiopia BangladeshCambodiaIndiaVietnam
0.36/0.320.71/0.440.85/0.610.85/0.801.14/0.90
12.5%61.4%41.0% 6.3%26.0%
19.4/18.8 (3.2%)76.25/78 (-2.2%)3,988/3,945 (1.1%)58/59 (0%)21,218/21,223 (0%)
Nicaragua 1.27/1.22 4.1% 25.5/24.7 (3.3%)Thailand Indonesia Dominican RepublicChina El Salvador BrazilMexicoPortugalItalyJapan
1.34/1.321.60/1.751.88/1.812.09/1.903.05/NA3.48/3.593.75/3.876.37/6.3518.68/18.2625.66/32.48
1.5%-9.4% 3.5%10% NA-3.1%-3.1% 0.0%2.3% -21.0%
32.48/31.27 (3.8%)11,800/10,200 (15.7%) 42.61/41.89(1.7%)6.25/6.1 (2.5%) 1.00/1.00 (0%)2.25/2.22 (1.4%)12.93/12.69 (1.9%) 1.36/1.32 (-3.0%) 1.36/1.32 (-3.0%) 100/79 (26.6%)
June data, costs in USDs
Shoe Worker Cost Comparison 2014
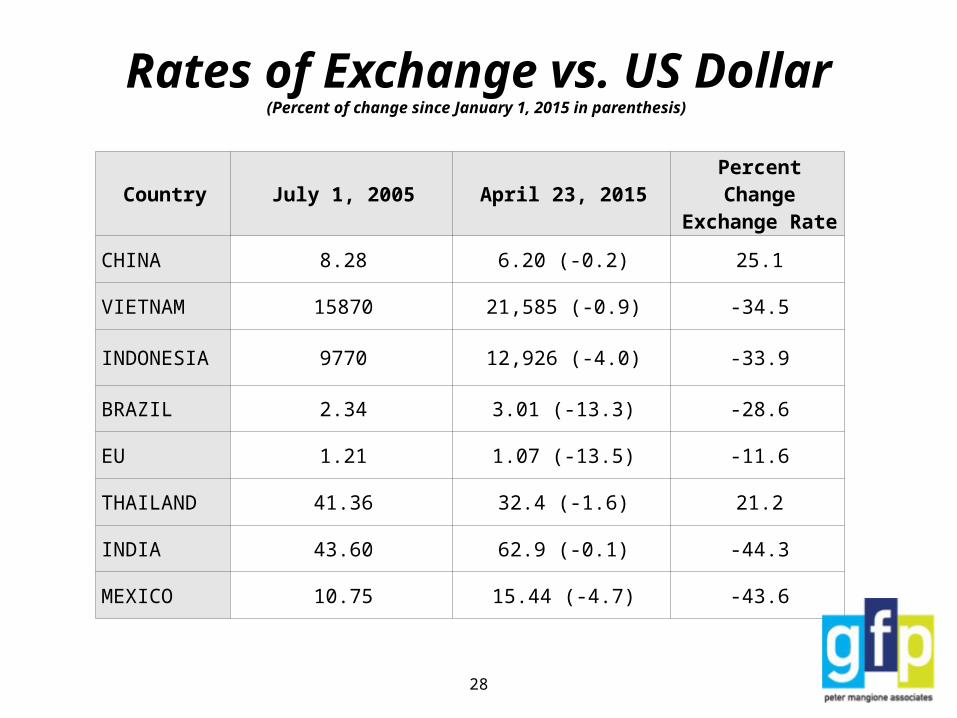
Rates of Exchange vs. US Dollar(Percent of change since January 1, 2015 in parenthesis)
Country July 1, 2005 April 23, 2015 Percent Change Exchange Rate
CHINA 8.28 6.20 (-0.2) 25.1
VIETNAM 15870 21,585 (-0.9) -34.5
INDONESIA 9770 12,926 (-4.0) -33.9
BRAZIL 2.34 3.01 (-13.3) -28.6
EU 1.21 1.07 (-13.5) -11.6
THAILAND 41.36 32.4 (-1.6) 21.2
INDIA 43.60 62.9 (-0.1) -44.3
MEXICO 10.75 15.44 (-4.7) -43.6
28

29
China
• Major challenge today: Unprecedented cost spiral– Minimum wage increases– Social insurance costs– Inflation: food, fuel, electricity and water – Labor contract law empowers workers, strikes– Chronic, systemic labor shortages– Higher corporate taxes for JVs – Environmental regulations, energy and water conservation– Appreciation of the RMB/$– Power of domestic consumption– Worker Unrest

‘Paradise Lost’

2005 2006 2007 2008 2009 2010 2011 2012 2013 2014$0.00
$0.20
$0.40
$0.60
$0.80
$1.00
$1.20
$1.40
$1.60
$1.80
$2.00
$2.20
2014 Shoe Worker Cost Per Hour in China
$0.45
$0.51$0.60
$0.70
$1.10$1.16
$1.50$1.60
$1.90
$2.09

Year Production Imports Exports (% of change)
20142013201220112010
14,50014,20013,60013,30013,200
73.055.550.341.432.9
10,740 (1.5)10,577.2 (5.0)10,071.2(2.0)9,872.7 (-0.6)9,929.9(21.5)
2009 11,500 29.0 8.170.0(0.6)2008 10,000 34.0 8,120.0(-0.6)2007 10,000 22.0 8,170.0(6.1)2006200520042002
9,600 9,000 7,000 6,500
13.810.6 8.6 3.8
7,700.8(11.4)6,913.6(38.3)5,000.0 (29.3)3,866.0 (NA)
China SHOE MARKET 2014-2002Units in millions of pairs.

China Shoe Exports Grow Again

The ‘scramble’ continues

Vietnam• Pro1. Low cost work force, large shoe making infrastructure with
dozens of industrial factories, mostly branded sport shoes.2. Hospitable to Taiwan/China entrepreneurs – until recently!• Con1. Limited potential for new investment in labor intensive, low
value added industries, like shoes, that have energy and pollution issues.
2. Severe labor and land limitations especially in HCHC area.3. Competition for land/workers from high value added sectors.4. Weak port facilities, and uncertain political climate, but
China/Taiwan investors are rebuilding.

Cambodia • Pro1. Ample, but limited, and low cost labor. 2. Good start up tax incentives.3. Hospitable to China/Taiwan entrepreneurs.4. Zero duties to Canada, GSP for EU.
• Con1. All inputs must be imported, lead times several weeks longer than
China.2. Active labor unions press for higher wages, new dormitories, and
shorter hours.3. Small country (about 15.0 million people) – limited potential for
factory expansion, and much competition from higher value added industries.

India• Pro1. Abundant and low cost labor.2. Good supplies of local leather.• Con1. Lacking in foreign investment in production and sector
infrastructure – only a few pilot programs to date.2. Labor laws are not flexible enough on hiring/firing.3. Shoe clusters are not located near one another – adding
buyer costs/challenges.4. Local production is heavily in men’s leather and women’s
sandals – more experience in tailored women’s, athletic or synthetic items would help.

Bangladesh
• Pro1. Ample and low cost labor, and attractive tax advantages.2. Good supplies of certain local leather.3. Access to South Asia shipping lanes.
• Con 1. Many CSR/political issues – strikes, demonstrations, etc. 2. Lead times around 30 days more than China.3. Most inputs must be imported.4. Only a few leading China investors have taken the plunge –
Golden Chang, Stella and Pou Chen.

Ethiopia • Pro1. Ample, low cost labor, favorable currency, US zero duties.2. Good supplies of some leather types.3. Supportive/stable government – new industrial park, social
stability, pro-investment regulations, etc.
• Con1. Expensive and long time/distance logistics, but improving.2. Language and culture require workforce training.3. Inputs other than leather must be imported.4. Foreign investment is essential to competitive production.

Burma in our future?WSJ June 2014

Mexico• Pro1. Large shoe making infrastructure with many capable factories
making leather shoes and boots – Western and women’s items.2. Good supplies of locally tanned leathers.3. Zero duties and proximity to US -- fast delivery/reorders.• Con1. High labor costs and footwear inputs could be improved.2. Financial issues for some factories and not all have competitive
management. 3. Currency fluctuations create uncertainties for buyers4. Despite recent success with key US brands, past failures still weigh
on some buyers, and large segments of the sector are factories that are too small for the capacity needs of US buyers.

Nicaragua – Very small (6.0), poorest country in Latin America, has no footwear infrastructure
and foreign investment is essential. Low costs, decent shipping and supportive government. Duty free to US.
El Salvador – Small (6.0) like Nicaragua but more developed and higher cost. Again, there is
not much in the way of footwear infrastructure but some good local factories and input suppliers with decent shipping and supportive government. Duty free to US.
Dominican Republic – This is a small country (10.0 million) with a long history of foreign
investment – WWW, Timberland, Rocky and now Paqueta from Brazil. Some are now working with Haiti as well. Duty free like all the Central American countries, but costs close to China. Quick shipping to the US.
Guatemala – Very similar to El Salvador.

Footwear Overview – China Still Rules
• While costs and labor issues will continue to plague shoe production in China, they will not derail its dominance anytime soon.
• No where else will draw the massive infrastructure investment needed to supplant China’s un-paralleled inventory of shoe supply chain investment.
• China remains the irreplaceable source for many shoe categories – women’s fashion, low price, etc.
• Sport shoes and outdoor items for export have accelerated their move out of China.
• Niche shoe production will strengthen in some emerging shoe markets – Vietnam, Cambodia, Bangladesh, India, as will as in Ethiopia, Latin America.

44
Population Implosion


China’s Workforce Decline

Tough Path to Passage (TPP)
• Trans-Pacific Partnership (TPP)• Participants -- Australia, Brunei Darussalam,
Canada, Chile, Japan, Malaysia, Mexico, New Zealand, Peru, Singapore, the United States, and Vietnam. (The US has FTAs with everyone except Brunei, Japan, Malaysia, New Zealand, and Vietnam.)
• Complex negotiation especially with Japan on farm products, and others with IP, environment, labor issues and services.

Obama Makes TPP Priority
• Three tough hurdles to passage– Congress must pass trade promotion authority (TPA), ‘fast track’ so deal
cannot be changed by Congress, no filibuster and no amendments – tough sell to most Democrats in House, need 217 votes and many GOP will not support Obama.
– Negotiations with 11 others can only be completed with TPA, otherwise no one will come forward with final position if the know Congress could change it, but even with TPA final deal is tough for Japan, Vietnam, etc.
– Passage by Congress of final negotiated deal. Even with TPA vote could be very close in House. Many ‘wild’ card issues – currency manipulation, mistrust of Obama, holding out for GOP president in 2017 to fix a better deal, etc.
– Overall, many hurdles, weak president who has never in his terms put together a bipartisan deal, so hard to predict outcome.

Summing Up
• China still rules the shoe sourcing world.• This is true especially for the US which is so dependent on it
big factory capacities and infrastructure investment to service its mega retail and brand buyers.
• Niche producers in Asia, Latin America and Africa will grow and sports shoes will grow the most out of China.
• US shoe business is still expanding, although not at break out levels.
• Internet sales now are 20% of total sales with the bulk from companies that have their own stores. MORE TO COME!

50
Thank you.
Related Documents