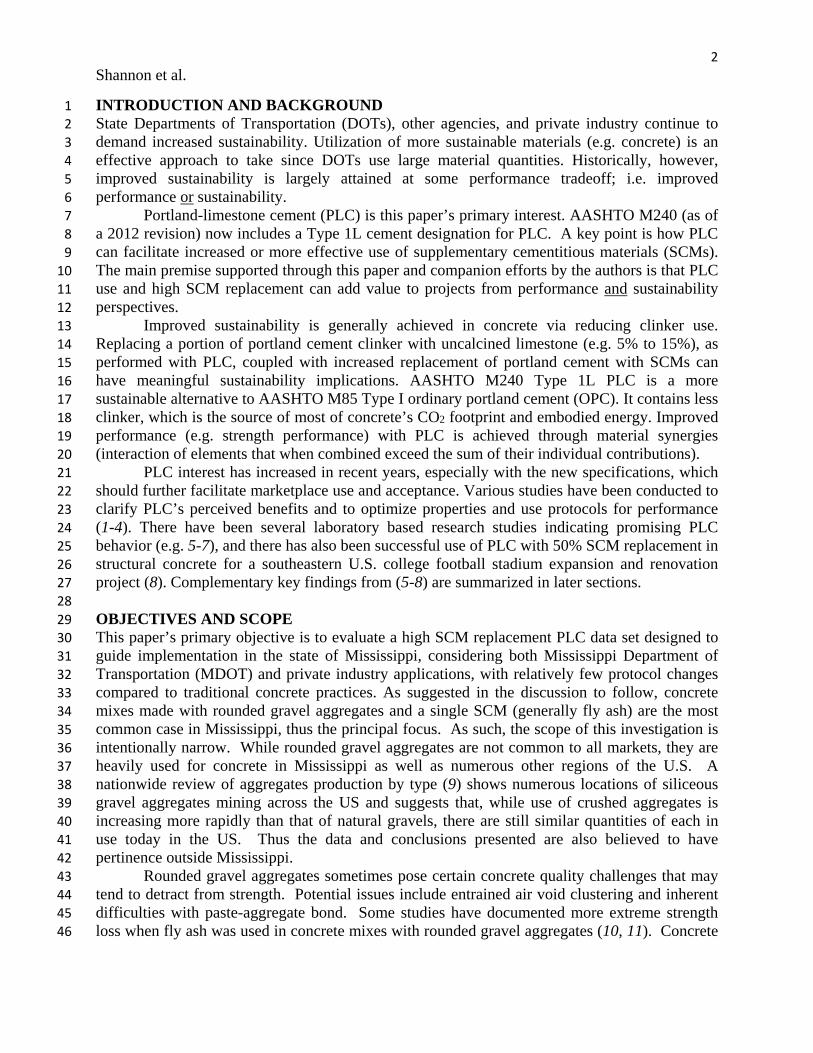
BENEFITS OF PORTLAND-LIMESTONE CEMENT FOR CONCRETE 1 WITH ROUNDED GRAVEL AGGREGATES AND 2 HIGHER FLY ASH REPLACEMENT RATES 3 4 Jay Shannon 5 Graduate Research Assistant 6 Civil and Environmental Engineering 7 Mississippi State University (MSU) 8 501 Hardy Road-Mail Stop 9546, Mississippi State, MS 39762 9 662-325-3050 (ph) 662-325-7189 (fax) [email protected] 10 11 Isaac L. Howard, PhD, PE 12 Associate Professor 13 Materials and Construction Industries Chair 14 Civil and Environmental Engineering 15 Mississippi State University (MSU) 16 501 Hardy Road-Mail Stop 9546, Mississippi State, MS 39762 17 662-325-7193 (ph) 662-325-7189 (fax) [email protected] 18 Corresponding Author 19 20 V. Tim Cost, PE, F.ACI 21 Senior Technical Service Engineer 22 Holcim (US) Inc. 23 121 Hampton Hills Blvd., Canton, MS 39046 24 601-856-2487 (ph) [email protected] 25 26 Wayne M. Wilson, PE, LEED AP 27 Senior Technical Service Engineer 28 Holcim (US) Inc. 29 4678 Arbor Crest Place, Suwanee, GA 30024 30 770-789-3254 (ph) [email protected] 31 32 Paper Prepared for Consideration for Presentation and Publication at the 94 th Annual Meeting of 33 the Transportation Research Board. 34 35 Original Submission: August 1, 2014 36 Revised Submission: November 9, 2014 37 38 5,490 Words, 5 Figures (1250 words), 3 Tables (750 words) = 7,490 Total Equivalent Words 39 40 41 42 43 44 45 46

Welcome message from author
This document is posted to help you gain knowledge. Please leave a comment to let me know what you think about it! Share it to your friends and learn new things together.
Transcript

BENEFITS OF PORTLAND-LIMESTONE CEMENT FOR CONCRETE 1
WITH ROUNDED GRAVEL AGGREGATES AND 2
HIGHER FLY ASH REPLACEMENT RATES 3
4
Jay Shannon 5 Graduate Research Assistant 6
Civil and Environmental Engineering 7
Mississippi State University (MSU) 8
501 Hardy Road-Mail Stop 9546, Mississippi State, MS 39762 9
662-325-3050 (ph) 662-325-7189 (fax) [email protected] 10
11
Isaac L. Howard, PhD, PE 12 Associate Professor 13
Materials and Construction Industries Chair 14
Civil and Environmental Engineering 15
Mississippi State University (MSU) 16
501 Hardy Road-Mail Stop 9546, Mississippi State, MS 39762 17
662-325-7193 (ph) 662-325-7189 (fax) [email protected] 18
Corresponding Author 19
20
V. Tim Cost, PE, F.ACI 21 Senior Technical Service Engineer 22
Holcim (US) Inc. 23
121 Hampton Hills Blvd., Canton, MS 39046 24
601-856-2487 (ph) [email protected] 25
26
Wayne M. Wilson, PE, LEED AP 27 Senior Technical Service Engineer 28
Holcim (US) Inc. 29
4678 Arbor Crest Place, Suwanee, GA 30024 30
770-789-3254 (ph) [email protected] 31
32
Paper Prepared for Consideration for Presentation and Publication at the 94th Annual Meeting of 33
the Transportation Research Board. 34
35
Original Submission: August 1, 2014 36
Revised Submission: November 9, 2014 37
38 5,490 Words, 5 Figures (1250 words), 3 Tables (750 words) = 7,490 Total Equivalent Words 39
40
41
42
43
44
45
46

1
Shannon et al.
ABSTRACT 1 Recently, portland-limestone cement (PLC) has garnered increased interest in the US due to 2
potentially greater environmental sustainability and enhancement of certain concrete properties 3
and/or performance. Combined with supplementary cementitious materials (SCMs), these 4
benefits can be further extended. This paper builds on past works of the authors, tailored to 5
Mississippi’s current concrete practices, by evaluating concrete mixtures with rounded gravel 6
aggregates and greater replacement of cement with SCMs (primarily fly ash). 7
In total, 15 different cementitious combinations were used in concrete and cement paste 8
mixtures. Concrete specimens from 30 mixtures (360 specimens) were tested, featuring various 9
combinations of cements, SCMs, and admixtures. Replicates of these 30 mixtures were created 10
in cement paste mixtures (540 specimens). Major variables included SCM type, replacement 11
rate, and cement source. Mixtures were tested for compressive strength, time of setting or 12
thermal setting indication, and slump and air content, in the case of concrete mixtures. A small 13
subsection of concrete mixtures was also examined using petrography. 14
Results indicated that use of PLC vs. ordinary portland cement (OPC) resulted in notable 15
compressive strength improvements in mixtures with high Class C fly ash replacement 16
(especially 40%). Slump and air content were not statistically different in PLC vs. OPC 17
mixtures; however time of setting was lower in mixtures with PLC. Hydration-related 18
distinctions (PLC vs. OPC mixtures) were evident in petrographic images, with some observed 19
differences in cement paste character and the paste-to-aggregate interfacial transition zone (ITZ). 20
21
2
Shannon et al.
INTRODUCTION AND BACKGROUND 1 State Departments of Transportation (DOTs), other agencies, and private industry continue to 2
demand increased sustainability. Utilization of more sustainable materials (e.g. concrete) is an 3
effective approach to take since DOTs use large material quantities. Historically, however, 4
improved sustainability is largely attained at some performance tradeoff; i.e. improved 5
performance or sustainability. 6
Portland-limestone cement (PLC) is this paper’s primary interest. AASHTO M240 (as of 7
a 2012 revision) now includes a Type 1L cement designation for PLC. A key point is how PLC 8
can facilitate increased or more effective use of supplementary cementitious materials (SCMs). 9
The main premise supported through this paper and companion efforts by the authors is that PLC 10
use and high SCM replacement can add value to projects from performance and sustainability 11
perspectives. 12
Improved sustainability is generally achieved in concrete via reducing clinker use. 13
Replacing a portion of portland cement clinker with uncalcined limestone (e.g. 5% to 15%), as 14
performed with PLC, coupled with increased replacement of portland cement with SCMs can 15
have meaningful sustainability implications. AASHTO M240 Type 1L PLC is a more 16
sustainable alternative to AASHTO M85 Type I ordinary portland cement (OPC). It contains less 17
clinker, which is the source of most of concrete’s CO2 footprint and embodied energy. Improved 18
performance (e.g. strength performance) with PLC is achieved through material synergies 19
(interaction of elements that when combined exceed the sum of their individual contributions). 20
PLC interest has increased in recent years, especially with the new specifications, which 21
should further facilitate marketplace use and acceptance. Various studies have been conducted to 22
clarify PLC’s perceived benefits and to optimize properties and use protocols for performance 23
(1-4). There have been several laboratory based research studies indicating promising PLC 24
behavior (e.g. 5-7), and there has also been successful use of PLC with 50% SCM replacement in 25
structural concrete for a southeastern U.S. college football stadium expansion and renovation 26
project (8). Complementary key findings from (5-8) are summarized in later sections. 27
28
OBJECTIVES AND SCOPE 29 This paper’s primary objective is to evaluate a high SCM replacement PLC data set designed to 30
guide implementation in the state of Mississippi, considering both Mississippi Department of 31
Transportation (MDOT) and private industry applications, with relatively few protocol changes 32
compared to traditional concrete practices. As suggested in the discussion to follow, concrete 33
mixes made with rounded gravel aggregates and a single SCM (generally fly ash) are the most 34
common case in Mississippi, thus the principal focus. As such, the scope of this investigation is 35
intentionally narrow. While rounded gravel aggregates are not common to all markets, they are 36
heavily used for concrete in Mississippi as well as numerous other regions of the U.S. A 37
nationwide review of aggregates production by type (9) shows numerous locations of siliceous 38
gravel aggregates mining across the US and suggests that, while use of crushed aggregates is 39
increasing more rapidly than that of natural gravels, there are still similar quantities of each in 40
use today in the US. Thus the data and conclusions presented are also believed to have 41
pertinence outside Mississippi. 42
Rounded gravel aggregates sometimes pose certain concrete quality challenges that may 43
tend to detract from strength. Potential issues include entrained air void clustering and inherent 44
difficulties with paste-aggregate bond. Some studies have documented more extreme strength 45
loss when fly ash was used in concrete mixes with rounded gravel aggregates (10, 11). Concrete 46
3
Shannon et al.
data produced in previous studies by the authors has suggested that PLC may help to relieve or 1
even reverse such strength loss trends, making a more complete study of performance associated 2
with this set of materials of even greater interest. 3
While PLC has a longer history of use in several other countries where its performance 4
has been well researched and documented, the combinations of materials featured in this study 5
present a somewhat unique research opportunity. PLC synergies that enhance performance are 6
fineness related (4, 5), and cements are typically produced at lower Blaine fineness values (i.e. 7
they are coarser) in most other countries. Class C fly ash is also generally unique to the US, 8
thanks to the chemical composition of coal from the western US. PLC’s interaction with fly ash 9
has not been heavily studied, especially relating to strength synergies and higher replacement 10
rates. PLC’s use in concrete with Class C fly ash and rounded gravel aggregates is even less 11
documented. 12
13
RELEVANT CONCRETE PRACTICES IN MISSISSIPPI 14 Materials and protocols selected for testing considered the current state of practice for concrete 15
in Mississippi. The most common ready-mix plant configuration would include two cementitious 16
material silos, one for cement and one for an SCM. Additional silos are less common. Thus use 17
of a single SCM in the mix design is most common, and this choice seemed especially 18
appropriate for the study since many state DOTs (including MDOT, presently) do not yet allow 19
multiple SCMs in concrete. 20
SCM selection in Mississippi is driven almost entirely by economics. Though slag 21
cement is recognized as having higher potential concrete performance attributes and usually 22
costs somewhat less than portland cement, fly ash is widely available in the state and is generally 23
far lower in cost than slag cement. While there are occasional justifications for slag cement based 24
on performance requirements in projects, the need for special durability measures in Mississippi 25
concrete (mitigation of alkali-aggregate reactivity or potential sulfate attack, etc.) that would 26
suggest slag cement are less common than in many states. While ternary concrete mixes with 27
both fly ash and slag cement and higher total cementitious replacement have become somewhat 28
common in adjacent states (esp. LA), this trend has not become prevalent in Mississippi. 29
MDOT’s Central Materials Laboratory provided information related to concrete practices 30
on MDOT projects from mid fall of 2007 to mid summer of 2014. During that time frame, 31
approximately 1700 structural concrete mixtures were submitted for approval and approximately 32
96% contained fly ash, 1% contained slag cement, and 93% contained rounded gravel 33
aggregates. Note that the number of mixes approved and the amount of concrete placed are not 34
necessarily related, and the database does not necessarily reflect unique mix designs, as the same 35
mix may be used on multiple projects. Non-structural applications are not reflected here. 36
The three largest concrete producers in Mississippi provided information related to 37
aggregate and SCM use (MDOT or non-MDOT work) that was in general agreement with the 38
information from MDOT. Gravel was the predominant coarse aggregate. Limestone is used in a 39
few areas where economics are favorable, and may also be used even at a higher cost when 40
requested, justified based on project type (e.g. for joint sawing purposes), or for other 41
performance requirements. 42
MDOT currently allows up to 25% fly ash replacement of cement in concrete mixtures. 43
Many states are reported to be considering moving toward higher replacement rate limits in the 44
interest of sustainability, performance, and innovation. These trends considered, along with the 45
documented synergistic effects of PLC with Class C fly ash at higher replacement levels (5, 7), 46

4
Shannon et al.
40% SCM replacement of cement with Class C fly ash was selected as a main focus. Some data 1
with slag cement are also included, for comparison. 2
The following section provides PLC vs. OPC test data related to SCM replacement rates, 3
mostly at 40%(+). Concrete economics in Mississippi would be well served with mix designs 4
that use higher fly ash replacement and rounded gravel aggregates, and the premise of this paper 5
is that PLC use stands to enhance the performance and applicability of such mix designs. 6
7
COMPANION RESEARCH 8 Cementitious blends containing portland cement, fly ash, and slag cement (i.e. two SCM 9
systems), have recent documented success with PLC (7, 8). While not directly applicable to this 10
paper, key aspects of companion efforts with two SCM systems have been presented to show 11
PLC’s versatility in terms of increased SCM use potential. Companion comparisons with single 12
SCM systems are also provided. 13
Cost et al. (5) investigated PLC largely via laboratory cement paste testing. Cementitious 14
systems included 0% SCM, 25% Class F fly ash, and 25% Class C fly ash. Some concrete data 15
was available that used gravel aggregates. Linear trendlines with regression through the origin 16
(RTO) were performed with OPC on the x-axis and PLC on the y-axis (i.e. slopes larger than 1 17
indicate PLC performs better). Concrete compressive strength slopes were 0.97, 1.07, and 1.13 18
for 0% SCM, 25% Class F fly ash, and 25% Class C fly ash, respectively. Pertinent conclusions 19
and recommendations of (5) were that higher than traditional replacement rates with some SCMs 20
appear possible without performance loss, and that additional research should be performed to 21
explore practical limits of improving concrete performance with extended SCM use. 22
Cost et al. (6) tested concrete mixes produced with Georgia granite (Size 57) and 23
alluvial/marine sand. Cementitious systems included 0% SCM, 25% fly ash (C and F), and 40% 24
slag cement, with characteristics common to DOT applications. Complimentary OPC and PLC 25
were supplied from five plants and handled as source-blind samples. The key conclusion was 26
that the PLCs supplied performed almost identically to corresponding OPCs. 27
Cost et al. (7) tested cement paste and concrete produced with Alabama limestone (Size 28
57), intermediate size rounded gravel (Size 8), and natural sand. Cementitious systems included 29
0% SCM, 40% fly ash (C and F), and 30% slag cement with 20% Class C fly ash (50% total 30
replacement). Complimentary OPC and PLC were supplied from four plants and handled as 31
source-blind samples (some of the same materials from (6) were used). The study evaluated 32
increasing SCM replacement levels via PLC. With 0% SCMs, OPC and PLC behavior was very 33
similar for a given plant. Consistent concrete strength benefits were observed with PLCs relative 34
to OPCs for 40% Class C fly ash and 30% slag cement with 20% Class C fly ash. Strength 35
benefits were modest for 40% Class F fly ash. PLC lowered time of setting relative to OPC. 36
Howard et al. (8) evaluated 50% SCM replacement (30% slag cement and 20% Class C 37
fly ash) using the same aggregate sources as (7). One of the study’s most meaningful findings 38
was that PLC strength gain at 7 days or earlier with 50% SCM replacement was noticeably better 39
than OPC. Concrete with 50% SCM replacement of PLC was produced and successfully used on 40
a concrete project over a several month period. Cost (11) documented strength challenges with 41
rounded gravel aggregates and fly ash in concrete that seemed to be mitigated via use of PLC. 42
43
EXPERIMENTAL PROGRAM 44 The experimental program explored the potential for PLCs in concrete with high cementitious 45
replacement rates to improve concrete sustainability, economy, and performance. Concrete 46

5
Shannon et al.
mixtures were designed to be similar to typical general-purpose mixes in Mississippi and those 1
being produced at a nearby ready-mixed concrete facility. Specimens included 540 cement paste 2
(CP) cylinders and 360 concrete cylinders. Tests included traditional fresh concrete properties, 3
compressive strength, time of setting, and petrography. Cement paste batches were proportioned 4
similarly to the concrete mixtures but with no coarse or fine aggregates. These have been found 5
to be useful as a quick indicator of performance trends including setting, but were also included 6
in this plan of work to potentially help distinguish concrete trends influenced by paste-aggregate 7
bond from trends that were the result of paste enhancements alone. 8
With the exception of high cementitious replacement rates, the test mixtures would 9
generally meet category requirements for several MDOT concrete classes. Note that not all 10
requirements for these concrete classes were included in mix design focus (e.g. sulfate 11
resistance), but proportions were similar to those required in MDOT specifications. 12
13
Materials Incorporated 14 Materials included 8 cement samples from 4 sources (OPC and PLC from each), 2 SCMs (Class 15
C fly ash and slag cement), 3 aggregates (1 coarse, 1 intermediate, and 1 fine), and 3 admixtures 16
(mid-range water reducer, high-range water reducer, and a workability retainer). Properties of 17
these materials are provided in Tables 1 to 3. 18
19
TABLE 1. Properties of OPC and PLC Cements 20
Cement ID A-1 A-2 C-1 C-2 D-1 D-3 E-1 E-2 Al2O3 (%) 5.5 5.3 5.0 4.5 4.4 4.0 4.6 4.0 Cl (%) 0.023 0.021 0.008 0.018 0.007 0.010 0.010 0.009CaO (%) 63.9 63.4 64.2 64.3 63.1 63.1 63.1 63.9 Fe2O3 (%) 3.4 3.4 3.5 3.3 3.3 3.2 3.2 2.9 K2O (%) 0.65 0.61 0.35 0.43 0.67 0.71 0.52 0.44 MgO (%) 0.8 0.8 1.0 1.1 2.8 2.7 3.1 3.1 Na2O (%) 0.13 0.12 0.18 0.16 0.09 0.07 0.07 0.07 SiO2 (%) 19.1 17.8 20.3 19.1 20.3 17.9 19.0 16.7 SO3 (%) 3.2 3.9 3.1 3.2 3.2 3.4 3.3 3.3 Na eq (%) 0.56 0.52 0.41 0.44 0.52 0.54 0.41 0.36 Limestone (%) 2.19 8.83 0.10 8.46 0.27 14.02 4.07 15.69LOI (%) 2.37 4.71 1.18 4.2 1.54 6.95 2.63 7.29 Blaine (m2/kg) 422 522 403 549 421 556 407 681 Vicat Initial (min) 95 95 115 105 140 100 105 90 Vicat Final (min) 170 160 190 170 250 225 205 175 1 Day Strength (MPa) 18.2 19.9 18.0 20.9 15.2 17.1 15.0 20.1 3 Day Strength (MPa) 29.7 31.8 25.9 30.7 27.0 27.4 25.8 29.2 7 Day Strength (MPa) 34.6 38.0 31.6 37.9 30.2 32.3 31.8 35.6 28 Day Strength (MPa) 41.4 42.8 44.0 45.3 39.3 39.7 42.1 41.2 Strength data collected with C109. 21 22
While this paper focuses on mixtures with Class C fly ash, data from some concrete using 23
slag cement were also reported for comparison. The 4 cement sources are all approved for 24
MDOT projects and supply cement in Mississippi. These 4 plants are located in Calera, 25
Demopolis, Leeds, and Theodore, Alabama. Cement sources were each given a random 26
6
Shannon et al.
designation (A through E). Note that source IDs reflect multiple samples from some sources used 1
in other studies, though only data using one OPC and one PLC from each source is reported in 2
this paper. Chemical and physical analysis data for each of the cements was developed in testing 3
conducted at the laboratories of the Holcim Theodore, AL plant. 4
There are several acceptable testing alternatives provided for documentation of limestone 5
content in cement specifications, but for consistency only one measurement type, based on CO2 6
content, was used for comparative analyses of limestone content; results are listed in Table 1. 7
This method is one of those used for reporting limestone contents according to AASHTO M85, 8
but is not required by M240 or ASTM C1157. It should be noted that CO2 calculations may give 9
slightly higher values for limestone content than those documented by actual production data, 10
due to other minor sources of CO2 present in cement besides limestone. Each of the PLCs 11
included in this study contained limestone percentages within the 5% to 15% range specified by 12
M240 for Type 1L cements, based on production data. 13
The SCM sources selected are commonly used in Mississippi. The slag cement is 14
supplied as ASTM C989, Grade 100, and was provided by Holcim from a location near 15
Birmingham, Alabama. The ASTM C618, Class C fly ash was provided by Headwaters, also 16
near Birmingham, Alabama. 17
18
TABLE 2. Properties of Supplementary Cementitious Materials 19 Property Fly Ash Property Slag ASTM C618 Class C Ash ASTM C989 Grade 100 SiO2 (%) 38.3 S (%) 0.5 Al2O3 (%) 20.5 SO3 (%) 0.8 Fe2O3 (%) 6.3 Fineness (%) 0.5 SO3 (%) 1.6 Blaine (m2/kg) 574 CaO (%) 22.1 Air content (%) 4.7 Moisture (%) 0.04 Strength Activity Index 7 Day (%) 84 LOI (%) 0.4 Strength Activity Index 28 Day (%) 128 Available Akalies (%) 1.5 Fineness (%) 15.7 Strength Activity Index 7 day (% of control)
101
Strength Activity Index 28 Day (% of control)
107
Water Requirement (% control) 95 Density (Mg/m3) 2.63 20 Aggregates included size 57 rounded gravel, size 8 rounded gravel, and natural sand, all 21
selected as typical aggregates used in Mississippi. The size 57 material was re-sieved prior to 22
testing to ensure that segregation did not occur. 23
Admixtures used were BASF products: Pozzolith 322 N (ASTM C494 Type A/B/D 24
water reducer), RheoTEC Z-60 (ASTM C494 Type S workability retainer), and Glenium 7500 25
(ASTM C494 Type A/F high-range water reducer). Dosage rates selected were based on 26
manufacturer’s suggested dosage per cementitious content and past experience. Two different 27
admixture scenarios were used: Dosage [1] – 419 ml/m3 (320 ml/yd3) Pozzolith 322 N, 1046 28
ml/m3 (800 ml/yd3) RheoTEC Z-60, 1256 ml/m3 (960 ml/yd3) Glenium 7500, and Dosage [2] – 29
837 ml/m3 (640 ml/yd3) Glenium 7500 alone. 30 31
7
Shannon et al.
TABLE 3. Properties of Aggregates 1 Material Size 57 Gravel Size 8 Rounded Gravel Natural SandLocation Columbus, MS Columbus, MS Columbus, MSBulk Specific Gravity (Gsb) - SSD 2.47 2.46 2.61 Bulk Specific Gravity (Gsb) - OD 2.39 2.39 2.59 F.M. 6.82 5.70 2.61 Absorption 3.15 3.08 0.66 Unit Weight (kg/m3) 1525 --- --- Sand Equivalency --- --- 86.8%
Percent Passing
3.81 cm (1.50 in) 100 --- --- 3.18 cm (1.25 in) 100 --- --- 2.54 cm (1.00 in) 95.4 --- --- 1.90 cm (0.75 in) 82.4 --- --- 1.27 cm (0.50 in) 51.7 100 100 0.97 cm (0.38 in) 30.3 100 100 No. 4 4.3 29.3 99.3 No. 8 0.7 0.3 83.1 No. 16 --- 0.3 72.8 No. 30 --- --- 61.1 No. 40 --- --- 44.2 No. 50 --- --- 20.9 No. 100 --- --- 1.5
Values based on typical aggregate properties as reported by source. Individual batch values differed insignificantly 2 3
Test Methods 4
Cement Paste Preparation, Compressive Strength, and Setting Indication 5
CP specimens were 5.1 cm by 10.2 cm cylinders. CP specimens contained only cementitious 6
materials, water, and admixtures, and were fabricated as described in (5), using a w/cm ratio of 7
0.50, with admixture dosage [1] except as noted. Compressive strength (fcp) testing was 8
conducted at 1, 7, 14, 28, 56, and 180 days using a hydraulic load frame with attachments to 9
accommodate cylinder size. Unbonded caps were used in accordance with ASTM C1231. 10
Specimens tested for compressive strength at 1 day were also used for setting time indication; all 11
other specimens were stored in a moist curing room meeting ASTM C192. Setting time 12
indication was determined from thermal data using procedures summarized in (5). 13
14
Concrete Fabrication, Compressive Strength, Time of Setting, and Fresh Property Testing 15
Concrete mix designs were of similar proportions as the CP batches, with aggregates added. The 16
majority of concrete mixes used a w/cm ratio of 0.43 and admixture dosage [1]. Several mixes 17
from a different data set were of similar proportions except for the use of a w/cm ratio of 0.52 18
and admixture dosage [2]. Aggregate quantities for each mixture were approximately 890 kg/m3 19
size 57 gravel, 208 kg/m3 size 8 gravel, and 841 kg/m3 natural sand, based on saturated surface 20
dry moisture conditions. Total cementitious content was approximately 320 kg/m3 (540 lb/yd3). 21
The indicated cement replacement rate is in each case the percentage by weight of the total 22
cementitious content (e.g. 50% fly ash indicates 160 kg/m3 fly ash content and 160 kg/m3 cement 23
content). 24
Concrete specimens were 10.2 cm by 20.3 cm cylinders fabricated in accordance with 25
ASTM C192. Concrete was mixed in batches of 0.05 m3 in a laboratory concrete mixer, each 26
batch producing 12 cylinders. Immediately after mixing, concrete was tested for slump, air 27
8
Shannon et al.
content, and unit weight in accordance with C143, C231, and C138, respectively. Cylinders 1
were then fabricated at the mixing site, covered, and initial curing began. A small portion of the 2
batch was used to conduct time of setting testing according to C403. After initial curing, the 3
specimens were removed from molds and stored in a curing room meeting the curing 4
environment requirements of C192 until testing. Concrete compressive strength (fc) testing, using 5
the unbonded caps as described in C1231, was conducted at 7, 14, 28, and 56 days in accordance 6
with C39. 7
8
Petrographic Investigation 9
Four specimens that were subjected to compressive testing after a 56 day cure were evaluated via 10
petrography, with special attention to distinctions in the ITZ that might suggest differences in 11
paste-aggregate bond of OPC vs. PLC mixtures. These test cylinder specimens were prepared by 12
removing any sections damaged in testing using a standard block saw, and cutting to a sample 13
size of 9.5 cm (3.75 in) by 12.7 cm (5 in), 2.5 cm (1 in) thick. Each specimen was prepared for 14
optical microscopic examination according to ASTM C856. Observations were made and 15
reference images collected using a digital microscope with magnification up to 200X. 16
17
TEST RESULTS 18
19
Fresh Concrete Property Trends 20 Comparisons of fresh concrete properties of otherwise similar OPC and PLC mixtures provide 21
some insight into PLC vs. OPC early performance distinctions. Concrete slump and air for the 22
baseline mixtures were predicted to be about 20.3 cm (8.0 in) and 2.0%, respectively, based on 23
mix designs. In total 15 matched pairs were used in t-tests to determine significant differences in 24
properties. These matched pairs included multiple sources, multiple replacement levels, and 25
multiple admixture dosages as indicated in Figures 1-4. Mean values for slump were 20.5 cm for 26
OPC and 20.1 cm for PLC. Test results found a p-value of 0.3280 indicating that these slumps 27
were not statistically different. Mean air contents were 2.53% for both OPC and PLC. 28
Time of setting trends were evaluated using the same 15 concrete pairs and an additional 29
14 CP pairs. Mean concrete time of setting was 6.56 hr for OPC and 5.87 hr for PLC, and test 30
results found a p-value of 0.0003, indicating that the times of setting were indeed statistically 31
different. CP setting indication results yielded means of 15.57 hr for OPC and 12.89 hr for PLC, 32
with a p-value of 0.0092, again indicating that the CP setting indication was statistically 33
different. 34
35
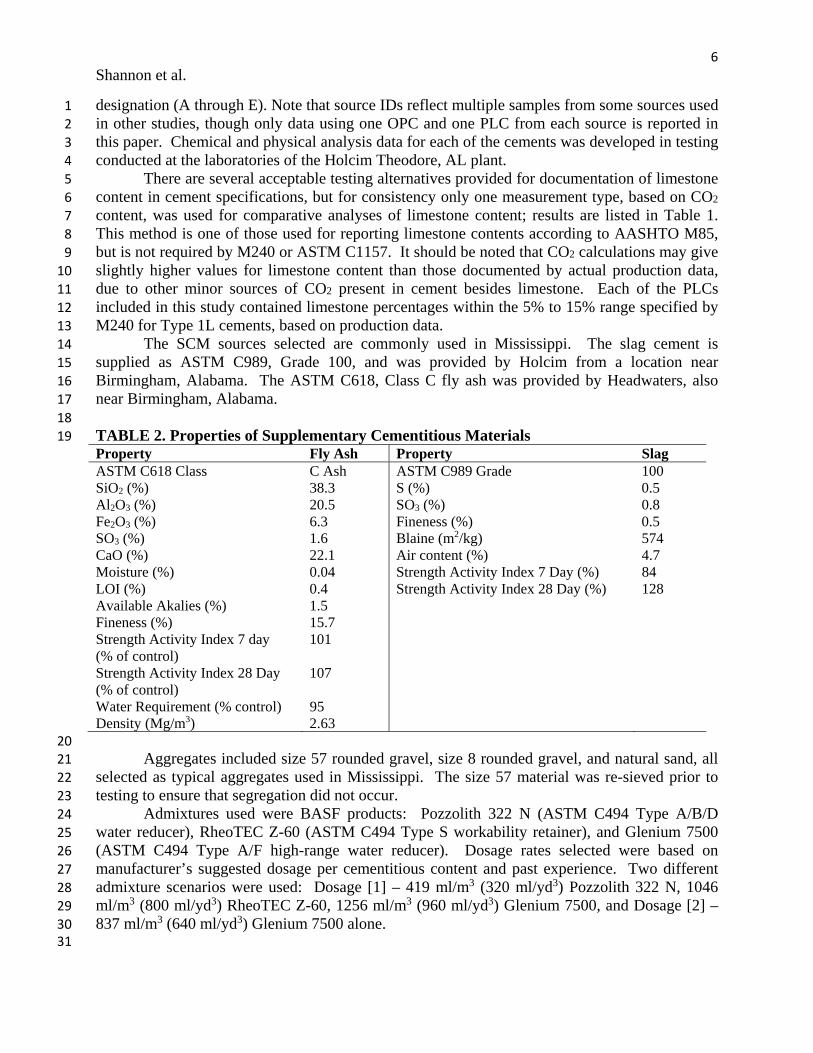
SCM Replacement Rate Effects for Class C Fly Ash and Slag Cement 36 One cement source (source C) was used for OPC vs. PLC comparisons in mixtures using Class C 37
fly ash or slag cement at varying replacement rates (40%, 50%, and 60% for fly ash and 50%, 38
60%, and 70% for slag cement). Figure 1 shows concrete fc and CP fcp data for fly ash mixtures. 39
Parts (a) and (c) illustrate fc and fcp differences between fly ash replacement rates at test days of 40
7, 14, 28, and 56 days. In total 14 concrete mixtures (168 specimens) and 14 CP mixtures (252 41
specimens) were used to produce the data shown in these bar charts. An equality plot of OPC to 42
PLC trends is included in parts (b) and (d). Note that part (b) includes all data from part (a) as 43
well as the small sample of 0.52 w/cm mixtures with the alternate [2] admixture dosage. Part (d) 44
also includes more data than part (c) in the form of fcp from the additional paste test ages (1 and 45
180) not included in bar charts and the small set of mixtures with admixture dosage [2]. 46

9
Shannon et al.
1
2 a) Concrete fc b) Concrete Equality 3
4 c) Cement Paste fcp d) Cement Paste Equality 5
FIGURE 1. Incremental Replacement Rate Class C Fly Ash Results 6
7 Figure 1 parts (b) and (d) show that on average, all 3 fly ash replacement rates resulted in 8
higher compressive strengths with PLC than OPC. The overall percent increase, as illustrated in 9
the equality plots, was similar in both concrete and CP specimens, though there are clearly 10
different trends when similar replacement rates are compared, concrete vs. CP. In concrete 11
mixtures, 40% replacement produced the greatest fc values and ratio of PLC to OPC fc. As 12
replacement levels increased, both fc and the ratio of PLC to OPC fc decreased. In CP mixtures 13
this trend was essentially reversed, on average, as higher replacement mixtures generally 14
outgained lower replacement in both areas. This observation (different trends, concrete vs. CP) 15
may suggest different concrete paste-aggregate bond effects as influenced by the percentage of 16
fly ash in the mix. The mixtures with different w/cm and admixture dosage fell within a 17
reasonable range of the other PLC to OPC ratios portrayed in the equality plots. 18
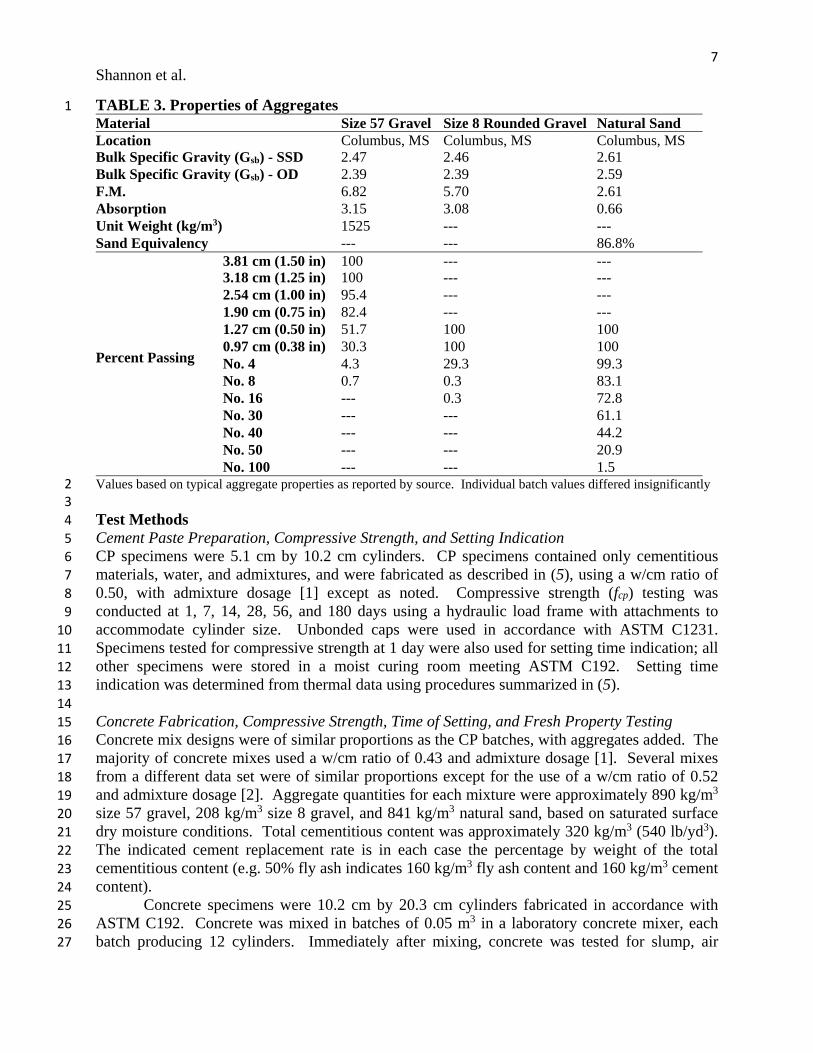
Figure 2 shows concrete fc and CP fcp data for slag cement mixtures in the same format as 19
Figure 1. While the focus of the paper is on Class C fly ash replacement effects, slag cement 20
comparison trends may also be of interest and may help add to the understanding of performance 21
synergies of SCM-PLC systems in concrete as influenced by both chemistry and physical 22
0
10
20
30
40
50
60
7 14 28 56 7 14 28 56 7 14 28 56
f c(M
Pa)
Test Day
OPC
PLC
50% Ash 60% Ash40% Ash
y = 1.28xR² = 0.71
0
10
20
30
40
50
60
0 10 20 30 40 50 60
PL
C f
c(M
Pa)
OPC fc (MPa)
w/cm 0.43, Admix 1w/cm 0.52, Admix 2
0
10
20
30
40
50
60
70
80
90
7 14 28 56 7 14 28 56 7 14 28 56
f cp
(MP
a)
Test Day
OPC
PLC
50% Ash 60% Ash40% Ash
y = 1.23xR² = 0.90
0
10
20
30
40
50
60
70
80
90
0 10 20 30 40 50 60 70 80 90
PL
Cf c
p(M
Pa)
OPC fcp (MPa)
w/cm 0.50, Admix 1
w/cm 0.50, Admix 2

10
Shannon et al.
(fineness) cementitious properties. In this case only a single w/cm ratio (0.43 for concrete) and 1
admixture dosage [1] were used. Concrete and CP with slag cement reflected PLC strength 2
benefits at 7 days (note circled data points on equality plots, parts (b) and (d)), but at later ages 3
the benefits were usually less pronounced. Concrete performance at later ages was actually quite 4
similar, PLC vs. OPC. There are still some interesting trends and distinctions in trends between 5
concrete and CP performance, however. 6
Concrete strengths are on average noticeably greater for slag cement mixtures than fly 7
ash mixtures, especially at higher replacement rates, even though CP strengths are generally 8
lower. This suggests better inherent paste-aggregate bond with slag cement in all cases than with 9
fly ash, possibly related, in part, to the higher fineness of slag cement and relative coarseness of 10
fly ash particles. These impacts in fly ash mixtures are somewhat mitigated with PLC, which 11
contributes a high proportion of very fine (limestone) particles that enhance the overall particle 12
size distribution. 13
14
15 a) Concrete fc b) Concrete fc Equality 16
17 c) Cement Paste fcp d) Cement Paste fc Equality 18
FIGURE 2. Incremental Replacement Rate Slag Cement Results 19
20
Multiple Cement Sources Compared in 0% and 40% Class C Fly Ash Mixtures 21 The question may be posed whether the beneficial trends observed for PLC (vs. OPC) from one 22
source will be common to other cement sources. To address this and to contrast general 23
0
10
20
30
40
50
60
7 14 28 56 7 14 28 56 7 14 28 56
f c(M
Pa)
Test Day
OPCPLC
70% Slag60% Slag50% Slag
y = 1.00xR² = 0.49
0
10
20
30
40
50
60
0 10 20 30 40 50 60
PL
C f
c(M
Pa)
OPC fc (MPa)
0
10
20
30
40
50
60
7 14 28 56 7 14 28 56 7 14 28 56
f cp
(MP
a)
Test Day
OPCPLC
70% Slag60% Slag50% Slag
y = 1.12xR² = 0.78
0
10
20
30
40
50
60
70
80
90
0 10 20 30 40 50 60 70 80 90
PL
C f c
p(M
Pa)
OPC fcp (MPa)
7 Day
7 Day

11
Shannon et al.
performance trend differences of mixtures with no SCMs and those with 40% Class C fly ash, 1
mixtures with OPC and PLC samples from each of the 4 sources have been used to develop the 2
comparisons shown in Figures 3 and 4. 3
Figure 3 shows OPC and PLC data for all cement sources with no SCM (100% of the 4
cementitious content is cement) and 40% fly ash for both concrete and CP. A total of 16 5
concrete mixtures (192 specimens) and 16 paste mixtures (288 specimens) are represented. All 6
mixtures were made at a w/cm of 0.43 and admixture dosage [1]. In “No SCM” concrete 7
mixtures, part (a), OPC fc was slightly greater than PLC for cement sources A and C, but very 8
slightly lower for cement sources D and E. Overall, these differences (without fly ash) were 9
essentially negligible, which is consistent with other published data sets. Similar mixtures in CP 10
specimens, as seen in part (c), favored OPC with source A and PLC with source C and somewhat 11
with sources D and E. Though CP trends show more variability, again these overall differences 12
are not especially meaningful. In 40% fly ash mixtures, PLC strengths clearly excelled beyond 13
those of OPC in all CP (part (d)) and concrete (part (b)) comparisons, and by similar, meaningful 14
margins, in most cases. 15
16
17 a) Concrete fc No SCM b) Concrete fc 40% Ash 18
19 c) Cement Paste fcp No SCM d) Cement Paste fcp 40% Ash 20
FIGURE 3. 0% and 40% Class C Fly Ash Strength Results, 4 Cement Sources 21 22
23
0
10
20
30
40
50
60
7 14 28 56 7 14 28 56 7 14 28 56 7 14 28 56
f c(M
Pa)
Test Day
OPC PLC
"D""C""A" "E"
0
10
20
30
40
50
60
7 14 28 56 7 14 28 56 7 14 28 56 7 14 28 56
f c(M
Pa)
Test Day
OPC PLC
"D""C""A" "E"
0
10
20
30
40
50
60
70
80
7 14 28 56 7 14 28 56 7 14 28 56 7 14 28 56
f cp
(MP
a)
Test Day
OPC PLC
"D""C""A" "E"
0
10
20
30
40
50
60
7 14 28 56 7 14 28 56 7 14 28 56 7 14 28 56
f cp
(MP
a)
Test Day
OPC PLC
"D""C""A" "E"

12
Shannon et al.
Figure 4 presents equality plots for the mixtures depicted in Figure 3, with results for all sources 1
shown without differentiation. In parts (a) and (c), concrete and CP mixtures without SCMs 2
show little or no difference in strength performance on average, OPC vs. PLC. Figure 4 (a) 3
shows a modest favoring toward PLC, but with considerable scatter, this isn’t believed to be 4
especially meaningful. In parts (b) and (d), 40% fly ash mixtures indicate considerable 5
advantages with PLC, with much greater benefits in concrete (equality line slope of 1.46 and 6
every data point favoring PLC) than CP. Again, this is thought to be somewhat related to the 7
particle size contributions of PLC to the fly ash concrete mixtures and possibly to associated 8
improvements in paste-aggregate bond. 9 10
11 a) Concrete No SCM b) Concrete 40% Fly Ash 12
13 c) Cement Paste No SCM d) Cement Paste 40% Fly Ash 14
FIGURE 4. 0% and 40% Class C Fly Ash Equality Plots, 4 Cement Sources 15
16
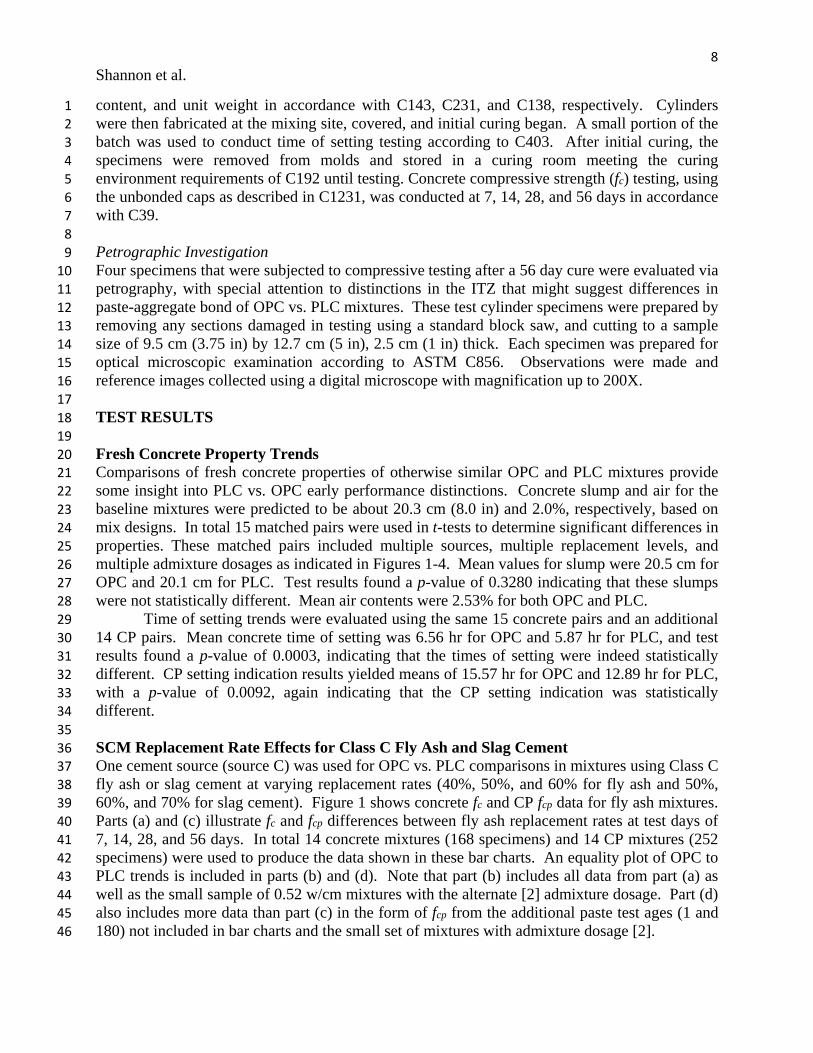
Concrete Petrography Results 17 Concrete Petrography was performed on 4 specimens (No SCM OPC, No SCM PLC, 40% fly 18
ash OPC, and 40% fly ash PLC) from mixtures using cement source C, in the interest of 19
exploring observed strength trends thought to be possibly related to paste-aggregate bond 20
differences. Results are presented in Figure 5 along with an example specimen in part (a). In the 21
“No SCM” mixtures, the OPC paste portion was generally darker in color with a less uniform, 22
more mottled appearance than the PLC paste portion. OPC paste appeared coarser with a 23
medium texture, while PLC paste looked finer with a more medium fine texture ((b) and (c)). 24
25
26
27
y = 0.98xR² = 0.74
0
10
20
30
40
50
60
0 10 20 30 40 50 60
PL
C f
c(M
Pa)
OPC fc (MPa)
y = 1.46xR² = 0.64
0
10
20
30
40
50
60
0 10 20 30 40 50 60
PL
C f
c(M
Pa)
OPC fc (MPa)
y = 1.07xR² = 0.67
0
10
20
30
40
50
60
70
0 10 20 30 40 50 60 70
PL
C f p
(MP
a)
OPC fcp (MPa)
y = 1.22xR² = 0.91
0
10
20
30
40
50
60
70
0 10 20 30 40 50 60 70
PL
C f c
p(M
Pa)
OPC fcp (MPa)

13
Shannon et al.
1
2 a) Example Specimen b) No SCM OPC 20X c) No SCM PLC 20X 3
4 d) 40% Ash OPC 20X e) 40% Ash PLC 20X f) 40% Ash OPC 200X 5
6 g) 40% Ash PLC 200X h) No SCM OPC 50X i) No SCM PLC 50X 7
FIGURE 5. Petrography Images 8

14
Shannon et al.
In the fly ash mixtures, general paste texture appeared finer with a slight chalky like 1
appearance relative to the no SCM mixtures. The OPC with fly ash appeared slightly coarser 2
overall relative to the PLC fly ash mixture ((d) and (e)). The presence of white to translucent, 3
irregularly-shaped particles was observed in both OPC and PLC fly ash mixtures. The material 4
composition of these particles was not determined; however, the material volume of the particles 5
did appear slightly higher in the OPC fly ash mixture. The volume of unhydrated fly ash 6
particles appeared slightly higher in the OPC fly ash paste portion than the PLC fly ash paste 7
portion ((f) and (g)). These observations suggest more uniform and complete cementitious 8
material hydration in the PLC mixtures. 9
Paste portions of the No SCM PLC near the paste-aggregate ITZ were notably lighter in 10
color, softer, and of a higher w/cm ratio than similar areas in the PLC mixture ((h) and (i)). In 11
fly ash mixtures, the lighter color paste-aggregate rings observed in the No SCM OPC mixture 12
were less pronounced and the relative difference in the paste-aggregate ITZ was less apparent. 13
Both OPC and PLC mixtures had similar color, hardness, and w/cm characteristics in the paste-14
aggregate ITZ. These observations are inconclusive with respect to explaining any paste-15
aggregate bond differences (PLC vs. OPC with fly ash), though it should be pointed out that PLC 16
vs. OPC strength trends were similar for concrete and CP mixtures with these materials, and the 17
other petrography observations discussed above do suggest more complete hydration conditions 18
in the PLC concrete mixtures. 19
20
SUMMARY AND CONCLUSIONS 21 Data presented clearly supports that PLC can be used to enhance the performance (e.g. strength 22
performance) of concrete containing rounded gravel aggregates and increased Class C fly ash 23
replacement of portland cement. Implementation benefits would appear to be many, including 24
increased sustainability by way of an economically competitive and well performing concrete 25
mixture. These benefits could be realized for Mississippi, and other applicable areas as well. 26
PLC produced higher strengths than OPC in essentially all mixtures with fly ash 27
replacement, and concrete at the 40% replacement level notably excelled. Strengths of concrete 28
mixtures with slag cement were higher than those with fly ash overall, though OPC vs. PLC 29
distinctions were less apparent. There were differing trends for concrete and cement paste (CP) 30
in both cases. 31
When cements from 4 sources were compared, CP fcp results for mixtures without SCMs 32
varied by source, with OPC favored for some sources and PLC for others. Concrete fc results 33
without SCMs also showed variability by source, with 2 sources moderately favoring OPC and 2 34
sources moderately favoring PLC. In mixtures with 40% fly ash, notably higher strength results 35
were produced with PLC than OPC for all sources, in both concrete and CP. 36
Fresh concrete properties of slump and air content were not statistically different between 37
PLC and OPC mixtures. Time of setting was found to be lower in PLC mixtures by 38
approximately 0.7 hr in concrete and setting indication lower by about 2.7 hr in CP.39
Petrography revealed lighter, less uniform paste portions in OPC compared to PLC, 40
possibly indicative of more complete cementitious hydration with PLC. The addition of fly ash 41
appeared to lessen the differences between OPC and PLC paste appearance. OPC mixtures also 42
appeared to have higher w/cm at the paste-aggregate ITZ. 43
The differences in performance trends of concrete and CP may suggest that paste-44
aggregate bond is a component of some strength differences seen in mixtures with SCMs, which 45

15
Shannon et al.
could be associated with particle size distribution effects influenced by significant fineness 1
differences of the SCMs, as well as cement types (OPC vs. PLC). 2
3
ACKNOWLEDGEMENTS 4
The MSU Cement and Concrete Industries Excellence Fund supported a portion of the efforts 5
presented. During the time frame of the work presented, Argos USA, CEMEX, Holcim (US), 6
and an anonymous donor made financial contributions. Holcim (US) also supported a portion of 7
the efforts presented through research grants. Materials were donated by: Argos USA, CEMEX, 8
Headwaters Resources, Holcim (US), Lehigh Cement Company, and MMC Materials. Cement 9
testing services were performed in-kind by Holcim at the Theodore, AL plant. Industry and 10
agency data were provided by B&B Concrete Co., Delta Industries, MMC Materials, and 11
MDOT. Individuals who have supported the effort include Dr. Imad Aleithawe, Adam Browne, 12
Alissa Collins, David Collins, Bill Goodloe, Rodney Grogan, Doug Gruber, Les Howell, Al 13
Innis, Gary Knight, Mark Stovall, Bill Waters, and Stephen Wilcox. 14
15
REFERENCES 16
17 1. Hawkins, P., P.D. Tennis, and R.J. Detwiler. The Use of Limestone in Portland Cement: A 18
State of the Art Review. EB2227, Portland Cement Association, Skokie, IL, 2003. 19
2. Tennis, P.D., M.D.A. Thomas, and W.J. Weiss. State of the Art Report on Use of Limestone 20
in Cements at Levels of up to 15%. PCA R&D SN3148, Portland Cement Association, 21
Skokie, IL, 2011. 22
3. Thomas, M.D.A. and R.D. Hooton. The Durability of Concrete Produced with Portland-23
Limestone Cement: Canadian Studies. PCA R&D SN3142, Portland Cement Association, 24
Skokie, IL, 2010. 25
4. Irassar, E.F., D. Violini, V.F. Rahhal, C. Milanesi, M.A. Trezza, and V.L. Bonavetti. 26
Influence of Limestone Content, Gypsum Content and Fineness on Early Age Properties of 27
Portland Limestone Cement Produced by Inter-grinding. Cement and Concrete Composites, 28
Vol. 33, No. 2, 2011, pp. 192-200. 29
5. Cost, V.T., I.L. Howard, and J. Shannon. Improving Concrete Sustainability and 30
Performance with Use of Portland-Limestone Cement Synergies. In Transportation 31
Research Record: Journal of the Transportation Research Board, No. 2342, Transportation 32
Research Board of the National Academies, Washington, D.C., 2013, pp. 26-34. 33
6. Cost, V.T., G. Knight, W. Wilson, J. Shannon, and I.L. Howard. Performance of Typical 34
Concrete Mixtures for Transportation Structures as Influenced by Portland-Limestone 35
Cements from Five Sources. Proc. of 2013 International Concrete Sustainability 36
Conference, San Francisco, CA, 2013, 11 pp. 37
7. Cost, V.T., T. Matschei, J. Shannon, and I.L. Howard. Extending the Use of Fly Ash and 38
Slag Cement in Concrete Through the use of Portland-Limestone Cement, Proc. of 2014 39
International Concrete Sustainability Conference, May 12-15, 2014, Boston, MA, 15 pp. 40
8. Howard, I.L., J. Shannon, V.T. Cost, and M. Stovall. Davis Wade Stadium Expansions and 41
Renovation: Performance of Concrete Produced with Portland-Limestone Cement. Journal 42
of Materials in Civil Engineering, In Review. 43
9. USGS. Natural Aggregates-Foundation of America’s Future. USGS Fact Sheet FS 144-97, 44
Reprinted February 1999. 45

16
Shannon et al.
10. Draft report, Evaluation of Paste-Aggregate Bond, CTL Group Project Number 109159, 1
testing program commissioned by Holcim (US) Inc., November 2009. 2
11. Cost, T. High Limestone Cements for Performance as Well As Sustainability. Proc. of 3
Concrete Technology Forum-Focus on Sustainable Development, Denver, CO, 2008, 11 pp. 4
Related Documents