1 Beam e ’s from antineutrinos using the pME and LE beams David Jaffe, Pedro Ochoa December 8 th 2006 Part 1: Reminder and update Part 2: Change in technique Part 3: Systematics

1 Beam e ’s from antineutrinos using the pME and LE beams David Jaffe, Pedro Ochoa December 8 th 2006 Part 1: Reminder and update Part 2: Change in.
Dec 21, 2015
Welcome message from author
This document is posted to help you gain knowledge. Please leave a comment to let me know what you think about it! Share it to your friends and learn new things together.
Transcript
1
Beam e’s from antineutrinos using the pME and LE beams
David Jaffe, Pedro Ochoa
December 8th 2006
Part 1: Reminder and update Part 2: Change in technique Part 3: Systematics
2
Reminder
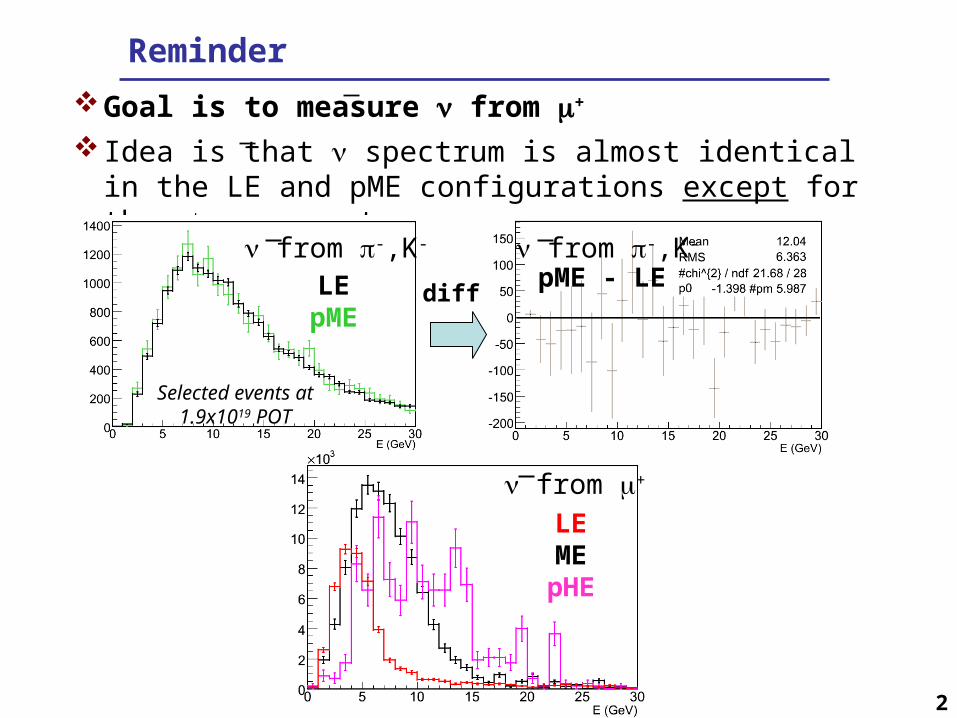
Goal is to measure from +
Idea is that spectrum is almost identical in the LE and pME configurations except for the + component:
from -,K-
LEpME
Selected events at 1.9x10¹⁹ POT
from -,K-
pME - LE
from +
LEMEpHE
diff
3
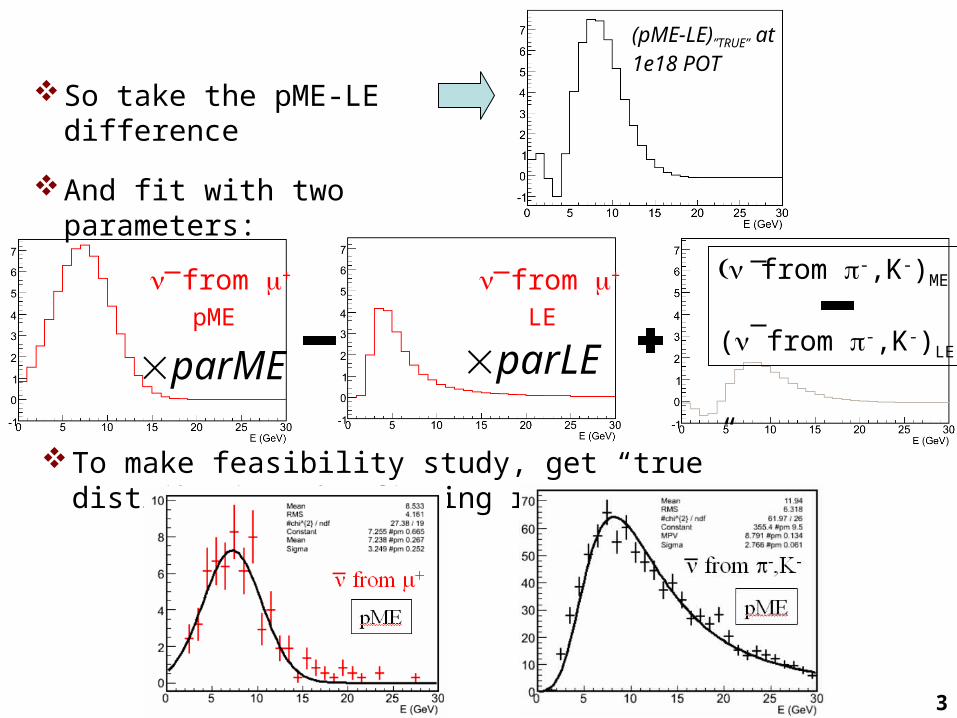
So take the pME-LE difference
from +
pME
parME
from +
LE
parLE
from -,K-)ME
( from -,K-)LE
(pME-LE)”TRUE” at 1e18 POT
And fit with two parameters:
To make feasibility study, get “true” distributions by fitting raw MC:
4
i D
ii
i
parMEparLEEDparMEparLE
2
22 )),((
),(
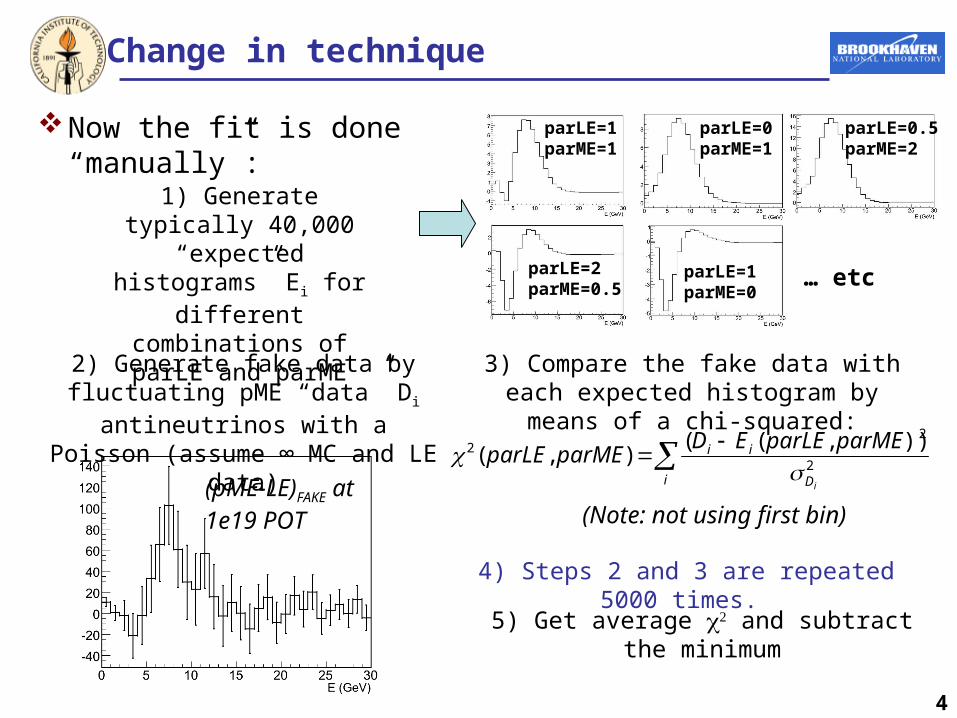
Now the fit is done “manually”:
Change in technique
2) Generate fake data by fluctuating pME “data” Di antineutrinos with a
Poisson (assume ∞ MC and LE data)
1) Generate typically 40,000 “expected histograms” Ei for
different combinations of parLE and parME
3) Compare the fake data with each expected histogram by means of a chi-squared:
(pME-LE)FAKE at 1e19 POT
4) Steps 2 and 3 are repeated 5000 times.
parLE=1parME=1
parLE=0parME=1
parLE=0.5parME=2
parLE=2parME=0.5
parLE=1parME=0
… etc
5) Get average and subtract the minimum
(Note: not using first bin)
5
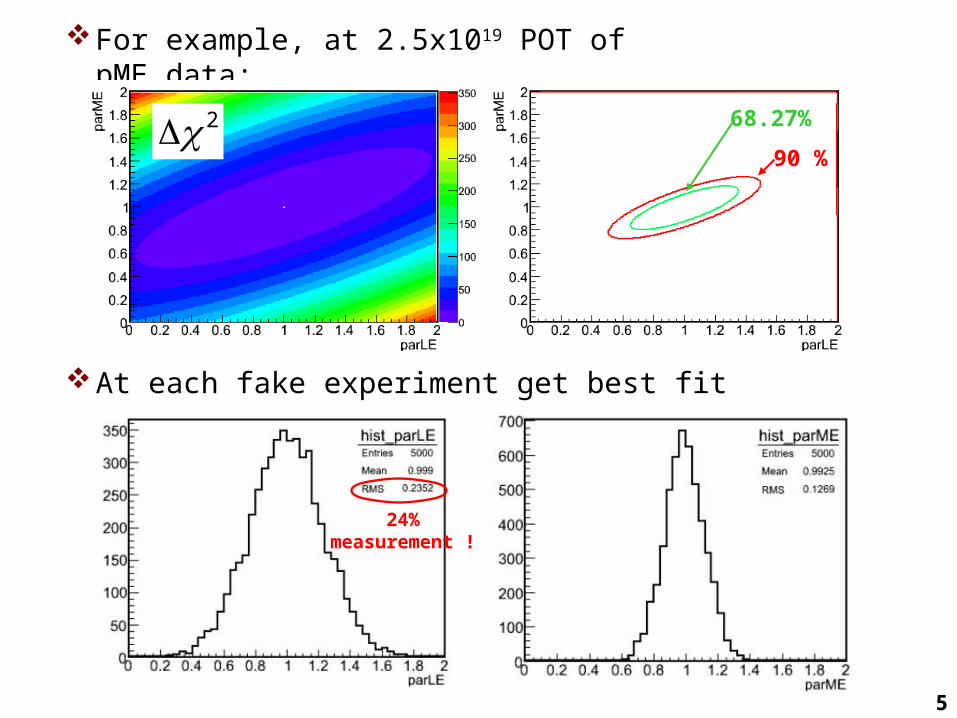
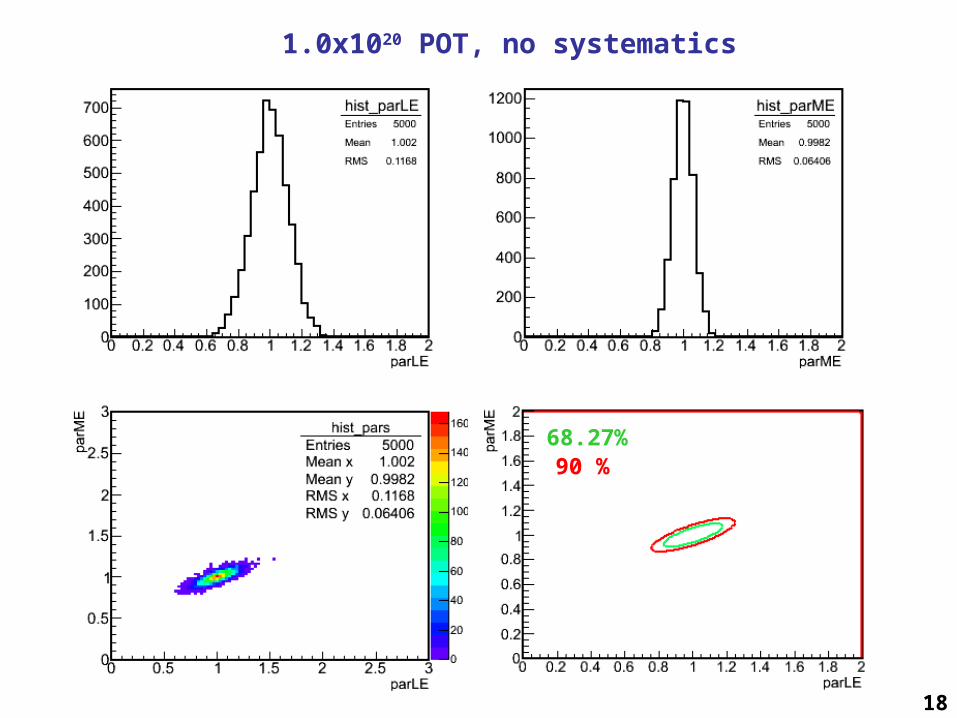
For example, at 2.5x10¹⁹ POT of pME data:
2 68.27%
90 %
At each fake experiment get best fit parameters:
24% measurement !
6
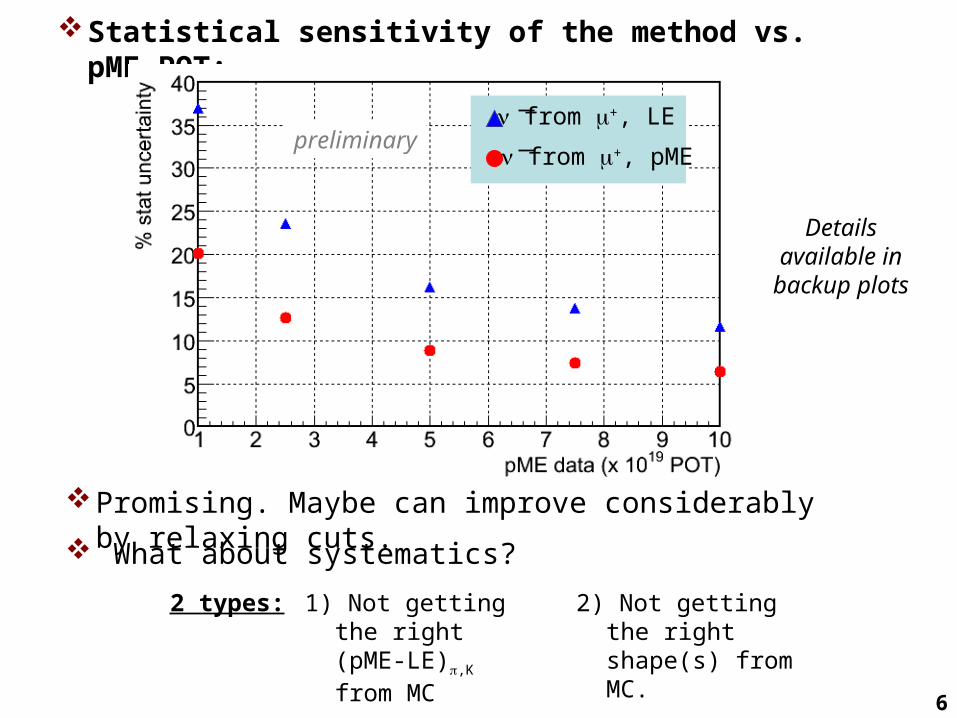
Statistical sensitivity of the method vs. pME-POT:
Promising. Maybe can improve considerably by relaxing cuts.
Details available in
backup plots
2 types: 1) Not getting the right (pME-LE),K
from MC
2) Not getting the right shape(s) from MC.
from +, LE
from +, pMEpreliminary
What about systematics?
7
Systematics
from -,K-)ME
( from -,K-)LE
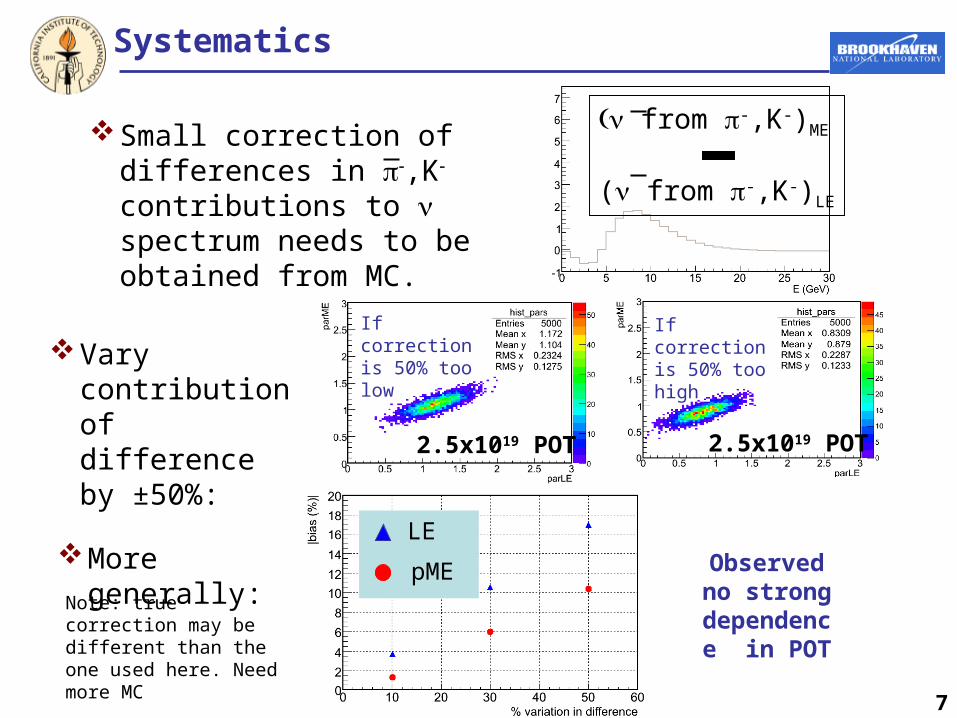
Small correction of differences in ,K contributions to spectrum needs to be obtained from MC.
Vary contribution of difference by ±50%:
More generally: Observed no strong
dependence in POT
If correction is 50% too low
2.5x10¹⁹ POT
If correction is 50% too high
2.5x10¹⁹ POT
Note: true correction may be different than the one used here. Need more MC
LE
pME
8
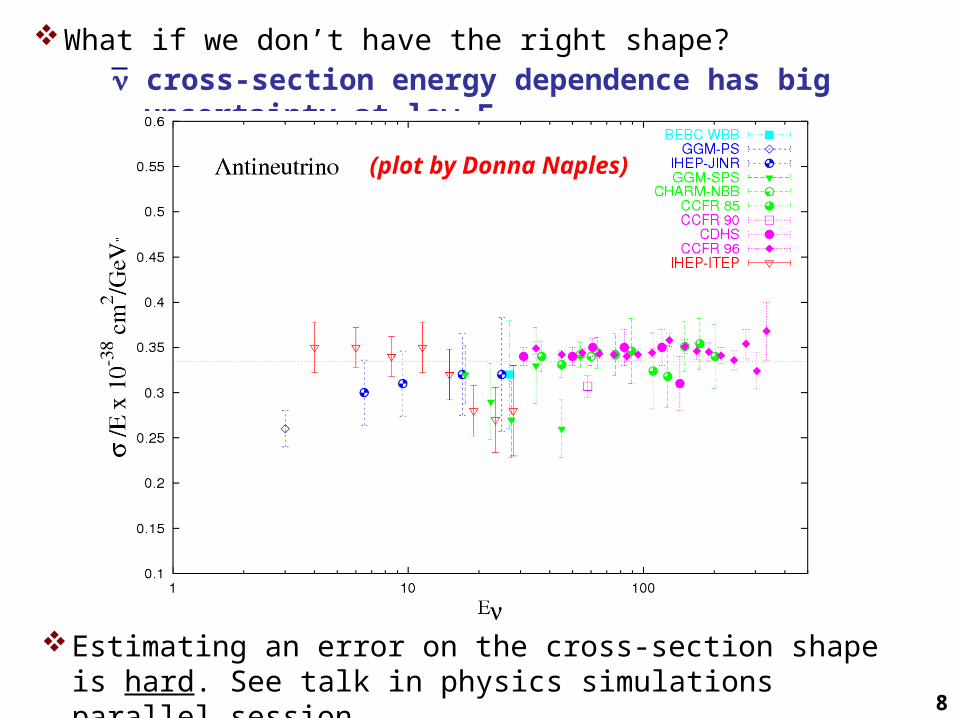
What if we don’t have the right shape? cross-section energy dependence has big uncertainty at low E
(plot by Donna Naples)
Estimating an error on the cross-section shape is hard. See talk in physics simulations parallel session.
9
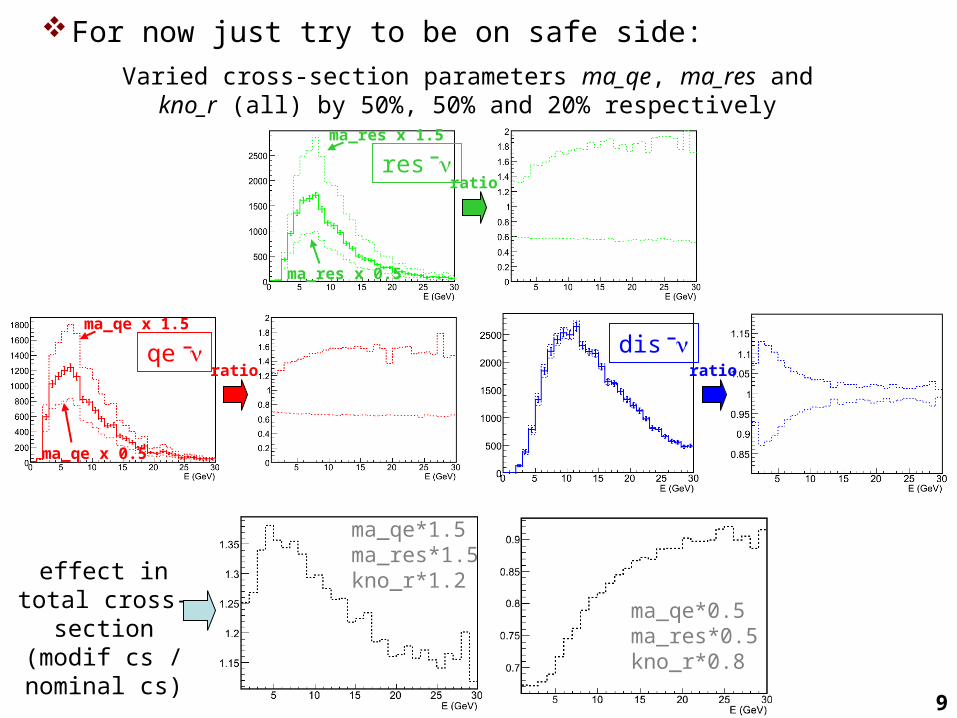
For now just try to be on safe side:
Varied cross-section parameters ma_qe, ma_res and kno_r (all) by 50%, 50% and 20% respectively
qe dis ma_qe x 1.5
ma_qe x 0.5
ratio ratio
res ratio
ma_res x 1.5
ma_res x 0.5
effect in total cross-section(modif cs / nominal cs)
ma_qe*1.5ma_res*1.5kno_r*1.2
ma_qe*0.5ma_res*0.5kno_r*0.8
10
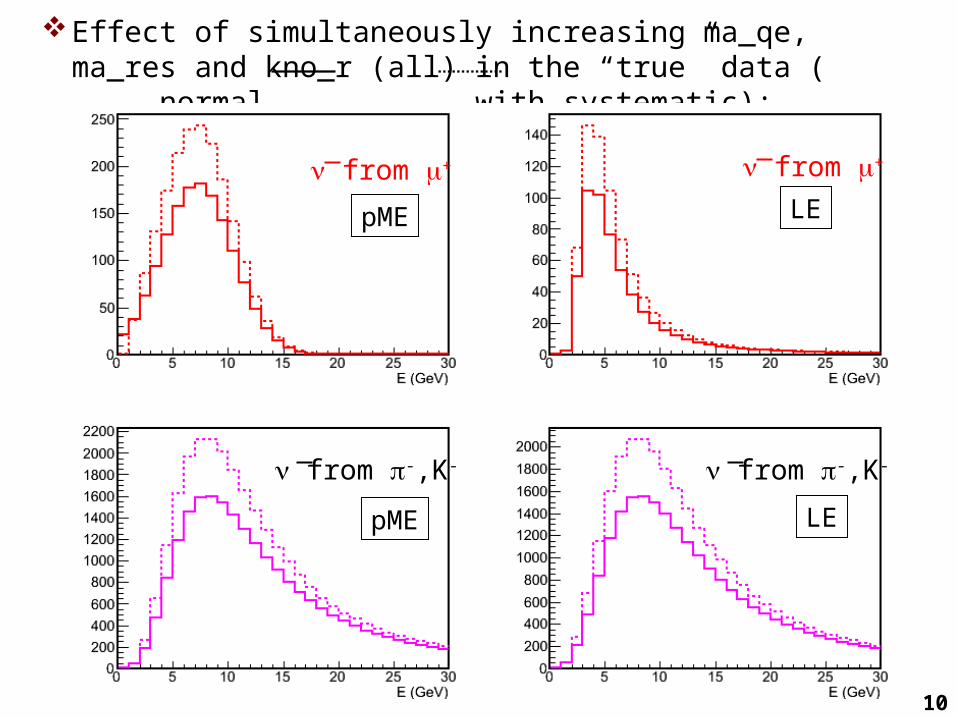
Effect of simultaneously increasing ma_qe, ma_res and kno_r (all) in the “true” data ( normal, with systematic):
from -,K- from -,K-
from + from +
pME
pME LE
LE
11
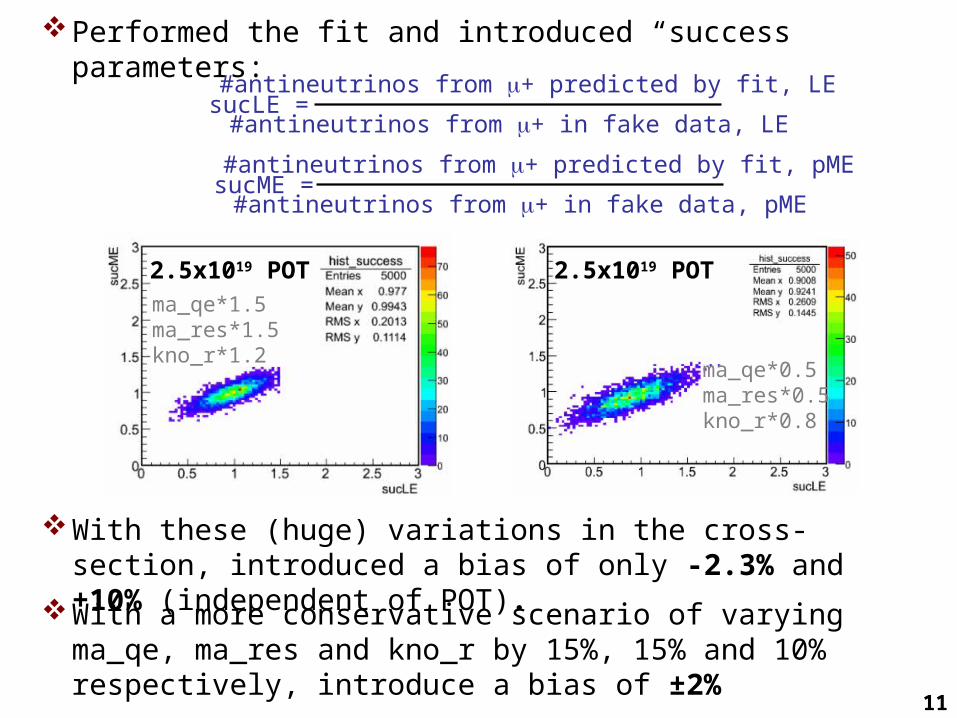
Performed the fit and introduced “success” parameters:
sucLE =#antineutrinos from + predicted by fit, LE
#antineutrinos from + in fake data, LE
sucME =#antineutrinos from + predicted by fit, pME
#antineutrinos from + in fake data, pME
2.5x10¹⁹ POT
With these (huge) variations in the cross-section, introduced a bias of only -2.3% and +10% (independent of POT).
ma_qe*1.5ma_res*1.5kno_r*1.2
2.5x10¹⁹ POT
ma_qe*0.5ma_res*0.5kno_r*0.8
With a more conservative scenario of varying ma_qe, ma_res and kno_r by 15%, 15% and 10% respectively, introduce a bias of ±2%
12
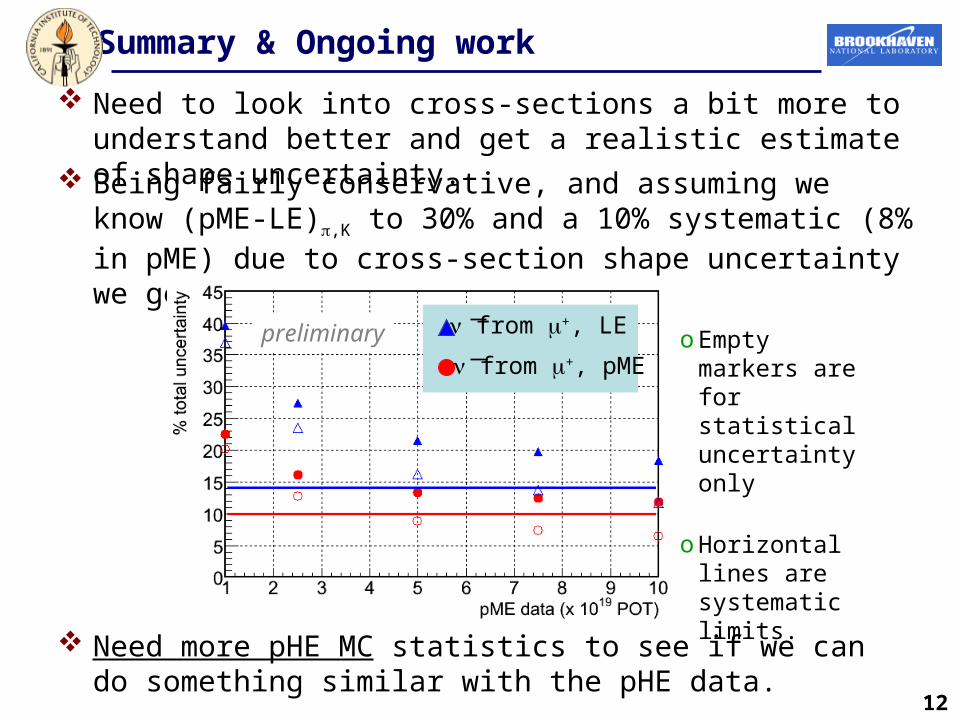
Summary & Ongoing work
Being fairly conservative, and assuming we know (pME-LE),K to 30% and a 10% systematic (8% in pME) due to cross-section shape uncertainty we get:
Need more pHE MC statistics to see if we can do something similar with the pHE data.
Need to look into cross-sections a bit more to understand better and get a realistic estimate of shape uncertainty.
o Empty markers are for statistical uncertainty only
o Horizontal lines are systematic limits.
from +, LE
from +, pMEpreliminary

13
Backup
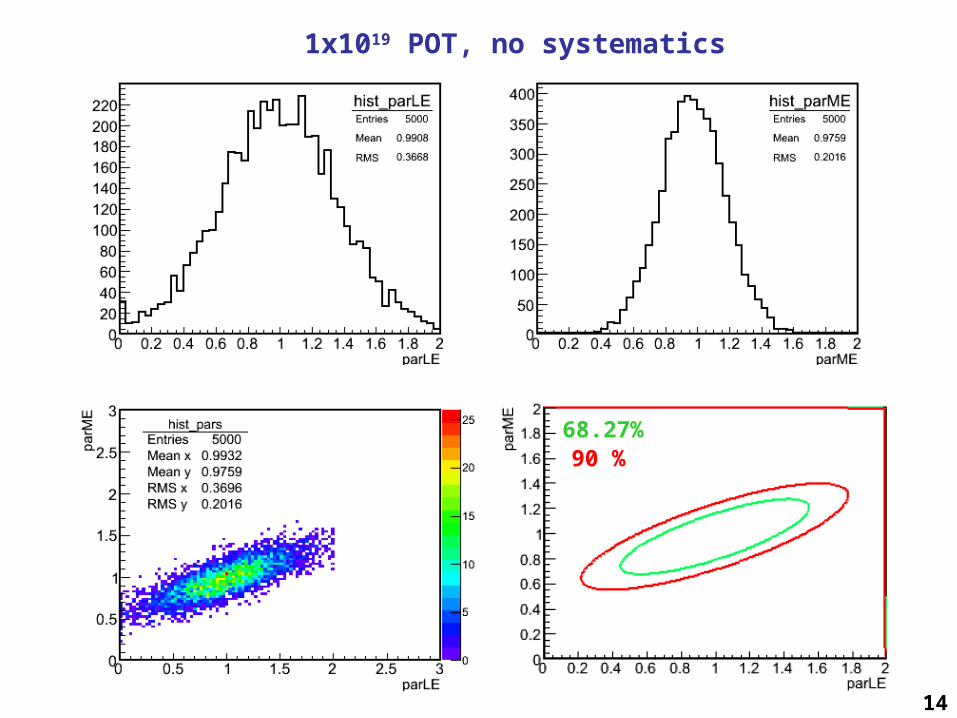
14
1x10¹⁹ POT, no systematics
68.27% 90 %
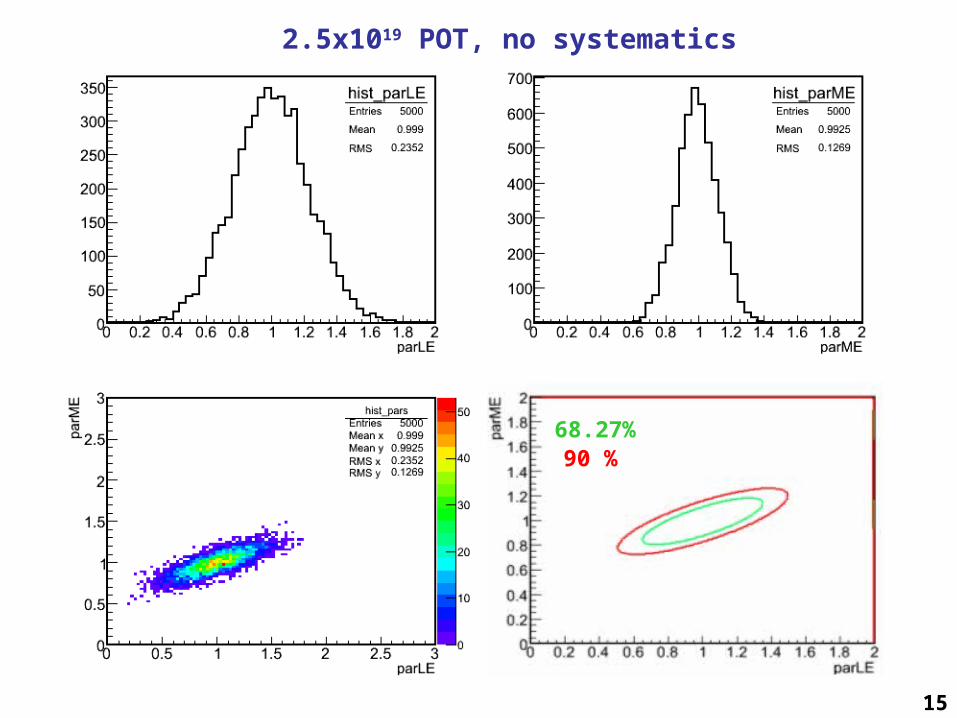
15
2.5x10¹⁹ POT, no systematics
68.27% 90 %
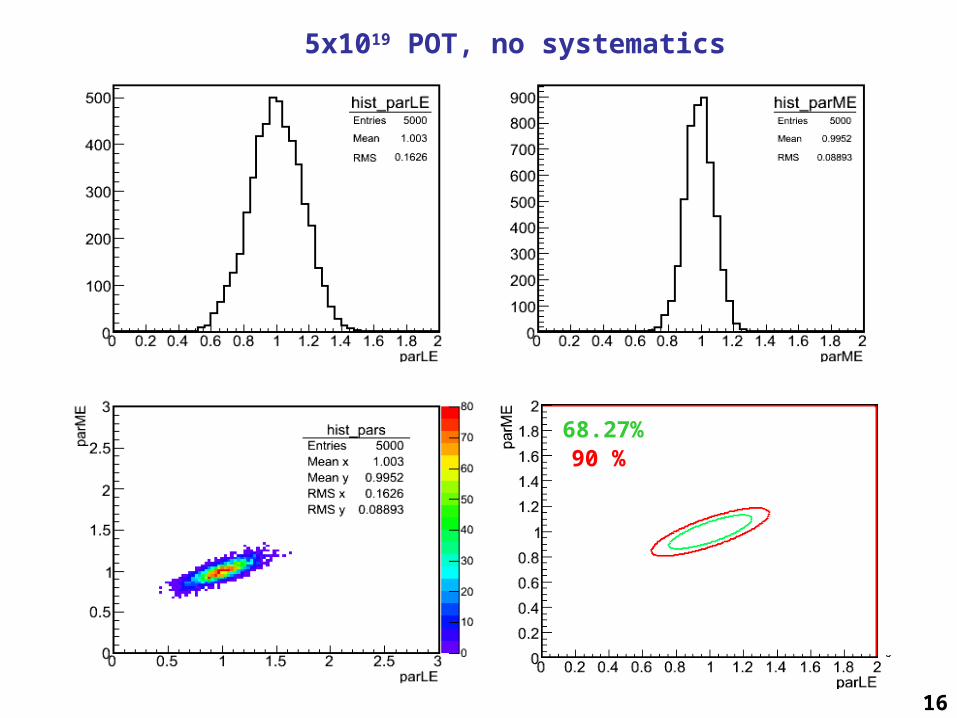
16
5x10¹⁹ POT, no systematics
68.27% 90 %
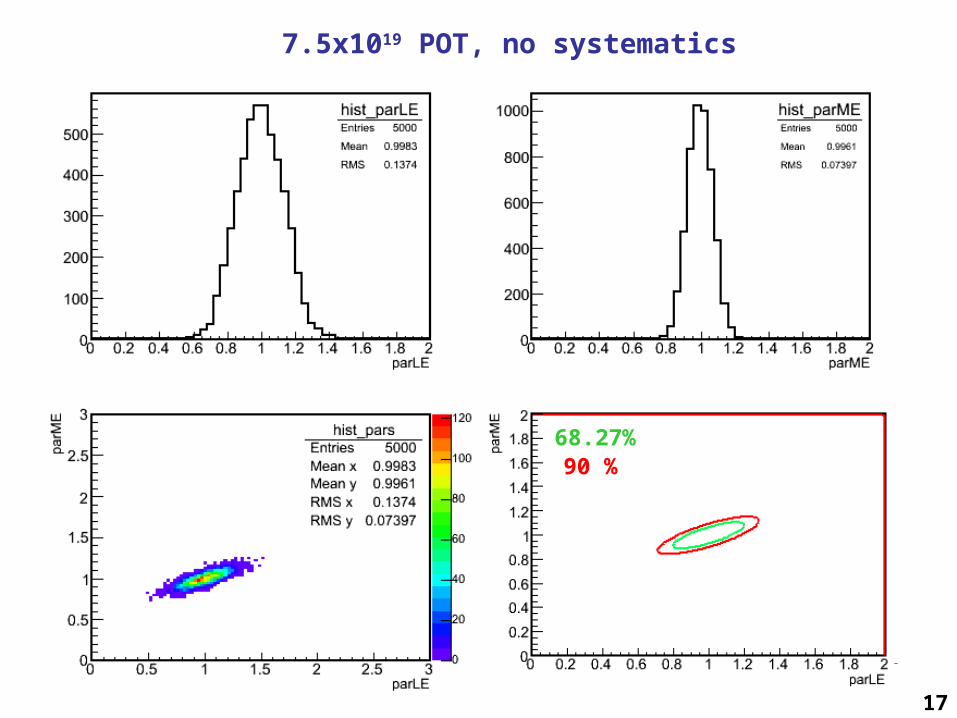
17
7.5x10¹⁹ POT, no systematics
68.27% 90 %
18
1.0x10²⁰ POT, no systematics
68.27% 90 %
19
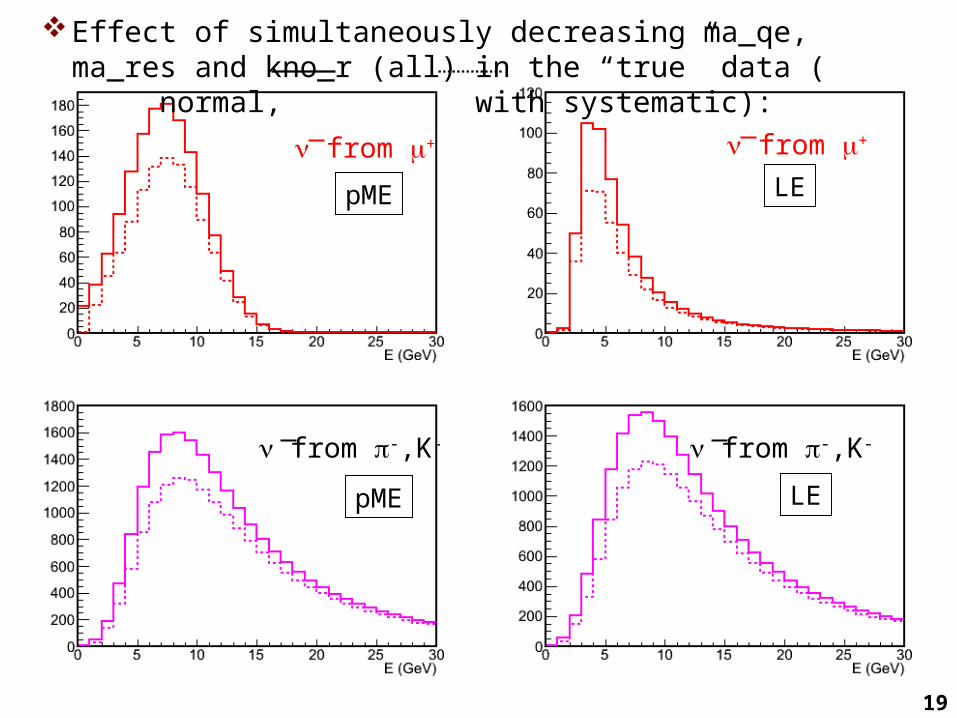
from -,K- from -,K-
from + from +
pME
pME LE
LE
Effect of simultaneously decreasing ma_qe, ma_res and kno_r (all) in the “true” data ( normal, with systematic):
20
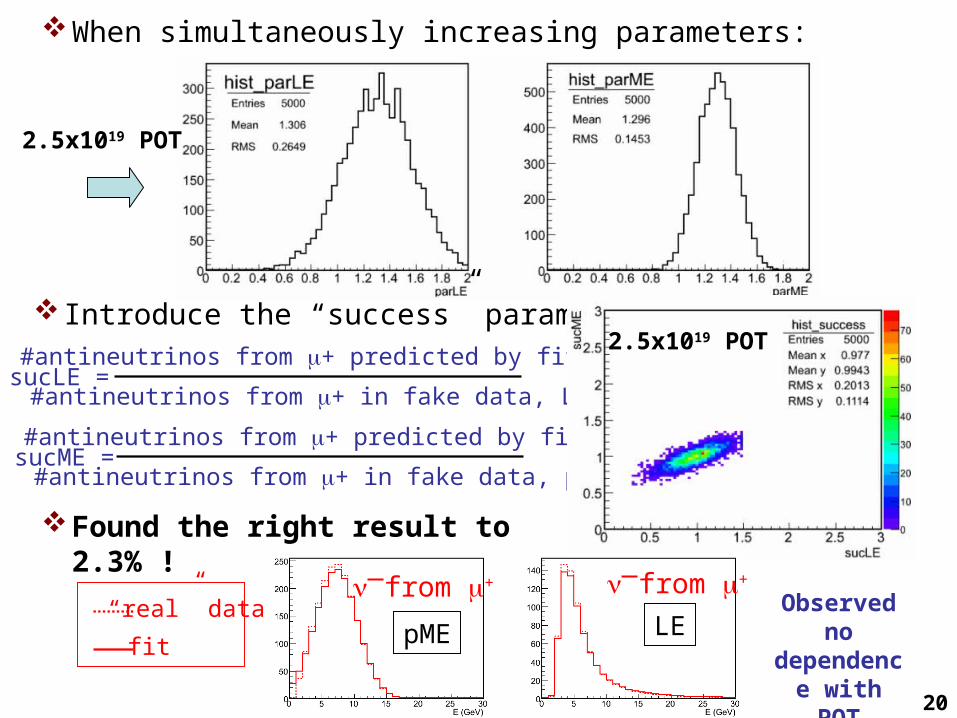
When simultaneously increasing parameters:
Introduce the “success” parameters:
sucLE =#antineutrinos from + predicted by fit, LE
#antineutrinos from + in fake data, LE
sucME =#antineutrinos from + predicted by fit, pME
#antineutrinos from + in fake data, pME
Found the right result to 2.3% !
“real” data
fit
from + from +
pME LEObserved no dependence with POT
2.5x10¹⁹ POT
2.5x10¹⁹ POT
21
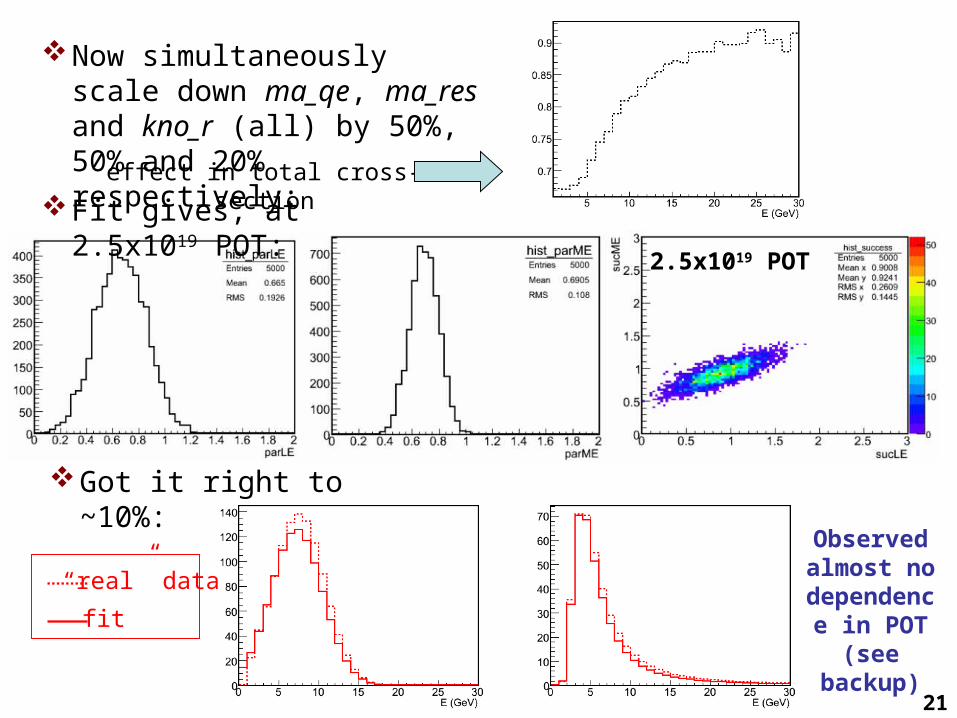
Now simultaneously scale down ma_qe, ma_res and kno_r (all) by 50%, 50% and 20% respectively:
effect in total cross-section
Fit gives, at 2.5x10¹⁹ POT:
Got it right to ~10%:
“real” data
fit
Observed almost no
dependence in POT
(see backup)
2.5x10¹⁹ POT
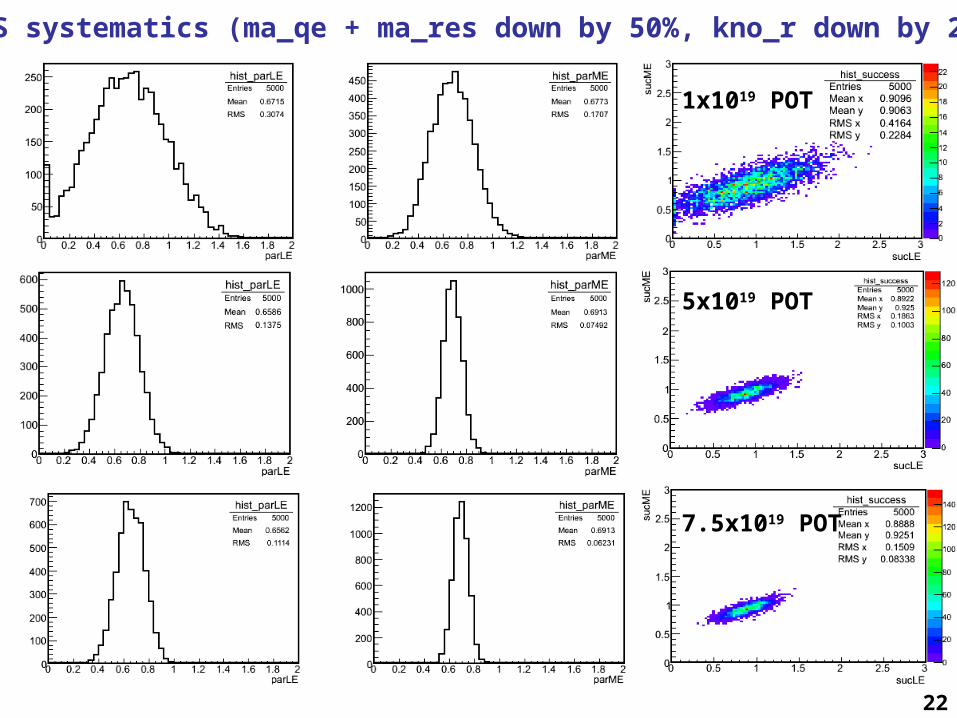
22
CS systematics (ma_qe + ma_res down by 50%, kno_r down by 20%)
1x10¹⁹ POT
5x10¹⁹ POT
7.5x10¹⁹ POT
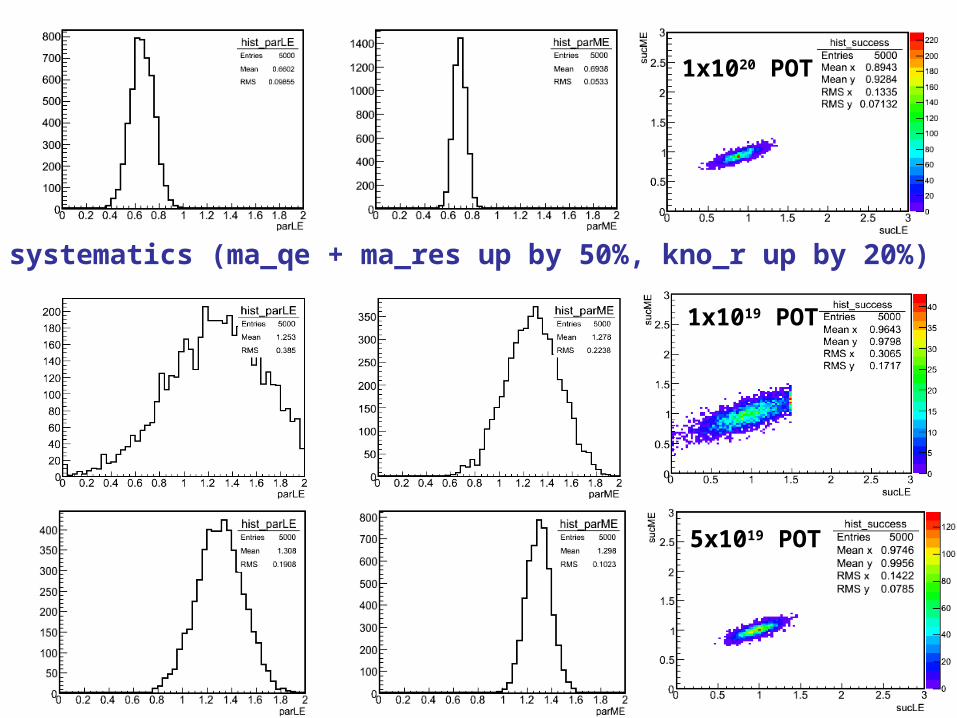
23
1x10²⁰ POT
CS systematics (ma_qe + ma_res up by 50%, kno_r up by 20%)
1x10¹⁹ POT
5x10¹⁹ POT
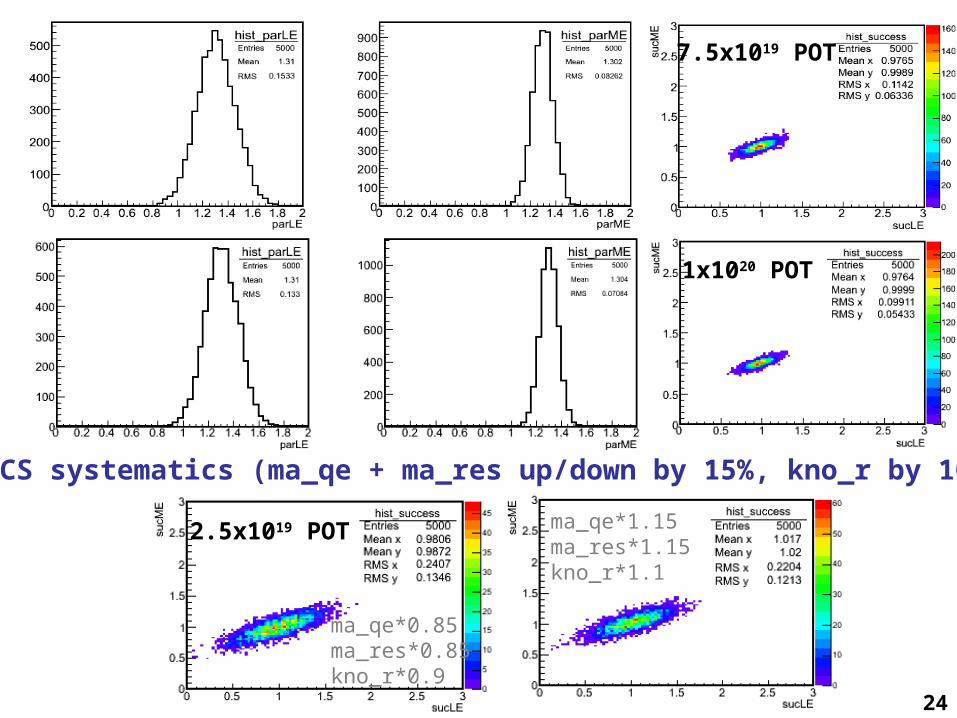
24
7.5x10¹⁹ POT
1x10²⁰ POT
CS systematics (ma_qe + ma_res up/down by 15%, kno_r by 10%)
2.5x10¹⁹ POT
ma_qe*0.85ma_res*0.85kno_r*0.9
ma_qe*1.15ma_res*1.15kno_r*1.1
Related Documents


![[New Symmetry Issue] Multiverse; Left-handed W Bosons; Antineutrinos at T2K](https://static.cupdf.com/doc/110x72/563db7e6550346aa9a8f00fe/new-symmetry-issue-multiverse-left-handed-w-bosons-antineutrinos-at-t2k.jpg)
