1 Arizona Renewable Arizona Renewable Transmission Task Transmission Task Force Force BTA Response BTA Response Chairman of SWAT RTTF Chairman of SWAT RTTF Peter Krzykos Peter Krzykos ACC Meeting ACC Meeting Oct23. 2008 Oct23. 2008

1 Arizona Renewable Transmission Task Force BTA Response Chairman of SWAT RTTF Peter Krzykos Peter Krzykos ACC Meeting Oct23. 2008.
Jan 20, 2016
Welcome message from author
This document is posted to help you gain knowledge. Please leave a comment to let me know what you think about it! Share it to your friends and learn new things together.
Transcript
11
Arizona Renewable Arizona Renewable Transmission Task Transmission Task
ForceForceBTA ResponseBTA ResponseChairman of SWAT RTTFChairman of SWAT RTTF
Peter KrzykosPeter KrzykosACC Meeting ACC Meeting Oct23. 2008Oct23. 2008
22
BTA Order Decision BTA Order Decision No.69389No.69389
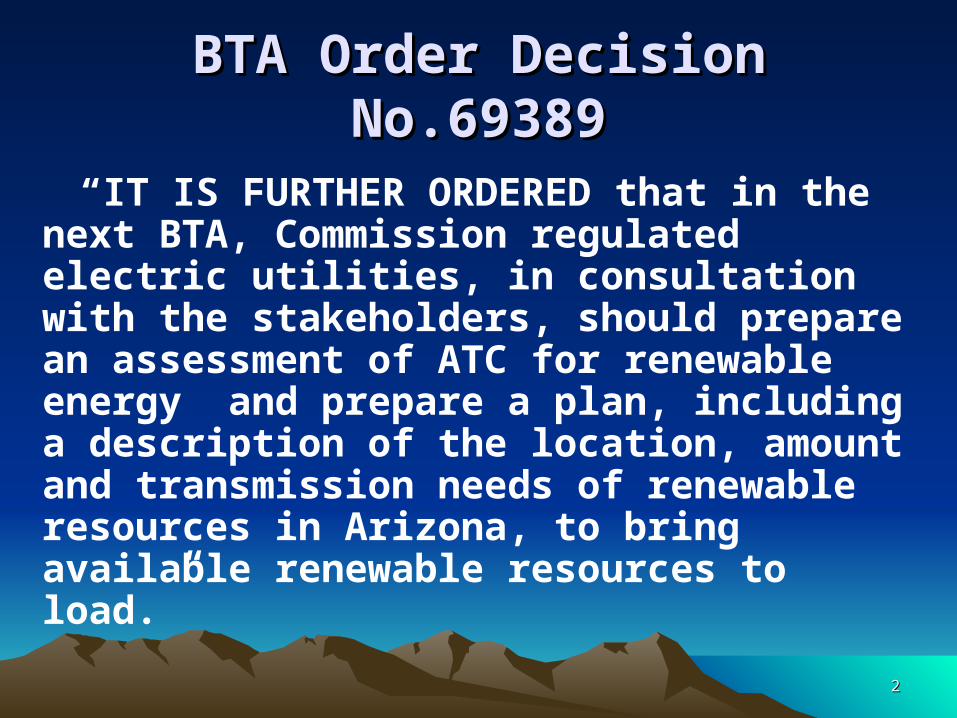
“IT IS FURTHER ORDERED that in the next BTA, Commission regulated electric utilities, in consultation with the stakeholders, should prepare an assessment of ATC for renewable energy and prepare a plan, including a description of the location, amount and transmission needs of renewable resources in Arizona, to bring available renewable resources to load.”

33
SWAT RTTF Phase #1SWAT RTTF Phase #1Integration of Renewable Resources into Integration of Renewable Resources into
Arizona Transmission NetworkArizona Transmission NetworkBTA ResponseBTA Response
• Three Parts to the BTA Response– Assessment of ATC in Arizona– Assessment of maximum potential of renewable resources in Arizona– Develop potential transmission configuration to deliver
the renewable resources in Arizona• To comply with FERC 890 order it was decided
to use the Southwest Area Transmission (SWAT) open stakeholder process to address BTA Order
• Renewable Transmission Task Force (RTTF) was formed as a subcommittee of SWAT.
44
SWAT RTTF Phase #1SWAT RTTF Phase #1AZ BTA Order Response Task Force MeetingsAZ BTA Order Response Task Force Meetings
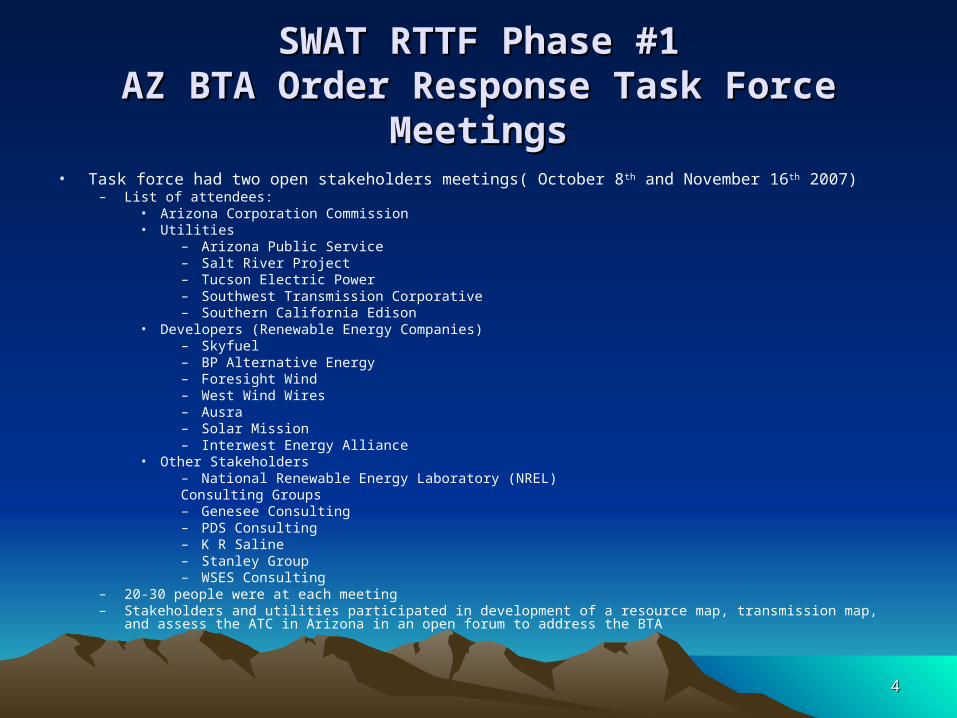
• Task force had two open stakeholders meetings( October 8th and November 16th 2007)– List of attendees:
• Arizona Corporation Commission• Utilities
– Arizona Public Service– Salt River Project– Tucson Electric Power– Southwest Transmission Corporative– Southern California Edison
• Developers (Renewable Energy Companies)– Skyfuel– BP Alternative Energy– Foresight Wind– West Wind Wires– Ausra– Solar Mission– Interwest Energy Alliance
• Other Stakeholders– National Renewable Energy Laboratory (NREL)Consulting Groups– Genesee Consulting– PDS Consulting– K R Saline– Stanley Group– WSES Consulting
– 20-30 people were at each meeting– Stakeholders and utilities participated in development of a resource map, transmission map, and assess the ATC in
Arizona in an open forum to address the BTA

55
SWAT RTTFSWAT RTTFPart 1 -ATC AssessmentPart 1 -ATC Assessment
This information was developed during stakeholder workshops held October 8th and November 16th 2007 and includes utility (APS, SRP, SWTC, and TEP) ACC staff and stakeholder input.
Available Transfer Capability (ATC) has been gathered for each utility in Arizona as of June 2007
ATC is a dynamic number that can change from day to day and reflects current market condition

66
Arizona EHV Transmission ATC Arizona EHV Transmission ATC (as of June 2007)(as of June 2007)
Phoenix230 kVSystem
NavajoGlenCanyon
North Gila
PaloVerde
SilverKingKyrene
PinnaclePeakWestwing
Liberty
South
Saguaro
Vail
Greenlee
Cholla
Moenkopi
PreacherCanyon
McCullough
Eldorado
Mead
Tucson138 kVSystem
Devers
ImperialValley
Coronado
Four Corners
Shiprock
Tortolito
102
372
356
125 556
0
0
0
Marketplace0
0 0
75
0
BrowningRudd
787
0
Springerville
Transmission Line
Voltage Level500 kV 345 kV
ATC in MW
77
SWAT RTTFSWAT RTTFPart 2 - Resource Part 2 - Resource
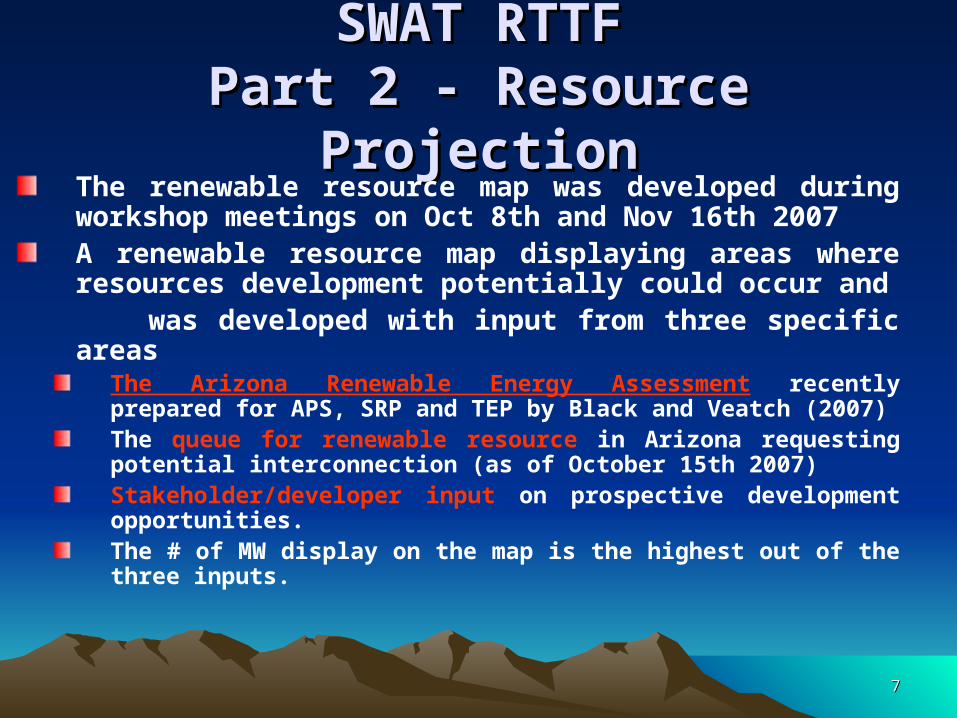
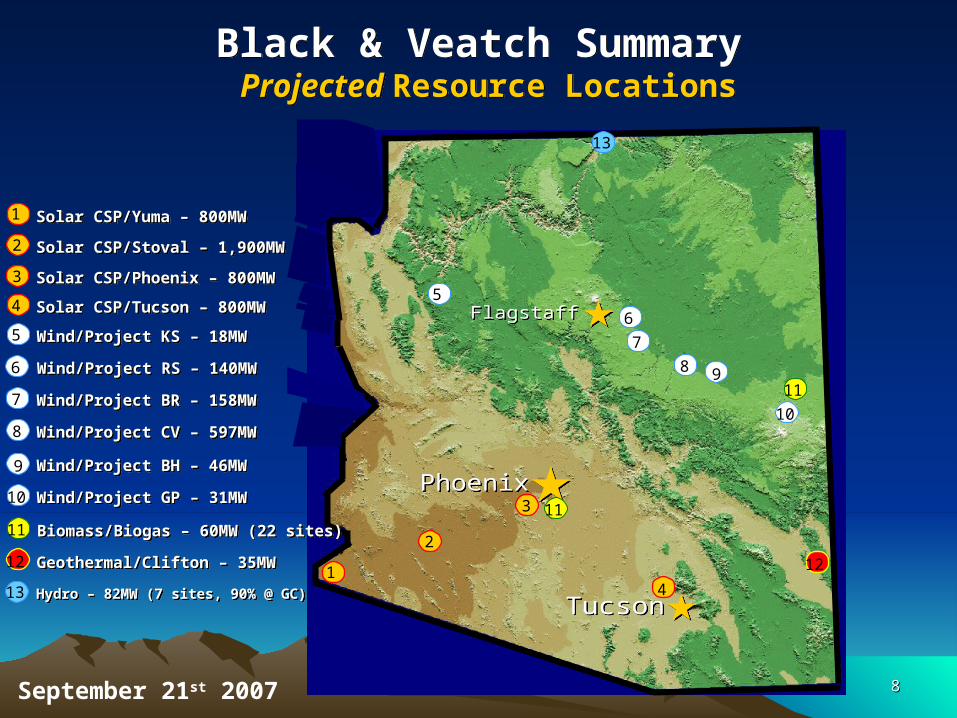
ProjectionProjectionThe renewable resource map was developed during workshop meetings on Oct 8th and Nov 16th 2007A renewable resource map displaying areas where resources development potentially could occur and
was developed with input from three specific areasThe Arizona Renewable Energy Assessment recently prepared for APS, SRP and TEP by Black and Veatch (2007)The queue for renewable resource in Arizona requesting potential interconnection (as of October 15th 2007)Stakeholder/developer input on prospective development opportunities. The # of MW display on the map is the highest out of the three inputs.
88
Black & Veatch Summary Projected Resource Locations
Black & Veatch Summary Projected Resource Locations
Geothermal/Clifton – 35MWGeothermal/Clifton – 35MW
Solar CSP/Yuma – 800MW Solar CSP/Yuma – 800MW
Biomass/Biogas – 60MW (22 sites)Biomass/Biogas – 60MW (22 sites)
Wind/Project KS – 18MWWind/Project KS – 18MW
Hydro – 82MW (7 sites, 90% @ GC)Hydro – 82MW (7 sites, 90% @ GC)
Solar CSP/Stoval – 1,900MWSolar CSP/Stoval – 1,900MW
Solar CSP/Phoenix – 800MW Solar CSP/Phoenix – 800MW
Solar CSP/Tucson – 800MWSolar CSP/Tucson – 800MW
Wind/Project RS – 140MWWind/Project RS – 140MW
Wind/Project BR – 158MWWind/Project BR – 158MW
Wind/Project CV – 597MW Wind/Project CV – 597MW
Wind/Project BH – 46MWWind/Project BH – 46MW
Wind/Project GP – 31MWWind/Project GP – 31MW
1
2
3
4
5
6
7
8
9
10
11
12
131
2
3
4
5
6
7
8 9
10
12
11
11
13
September 21st 2007
99
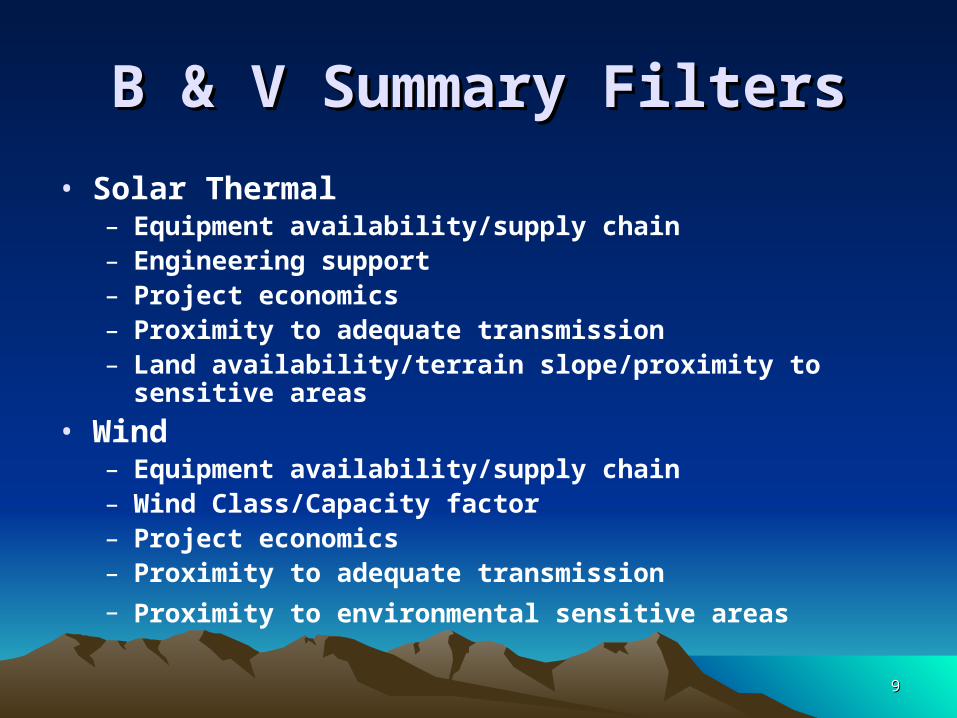
B & V Summary FiltersB & V Summary Filters
• Solar Thermal– Equipment availability/supply chain– Engineering support– Project economics– Proximity to adequate transmission – Land availability/terrain slope/proximity to sensitive areas
• Wind– Equipment availability/supply chain– Wind Class/Capacity factor– Project economics– Proximity to adequate transmission
– Proximity to environmental sensitive areas
1010
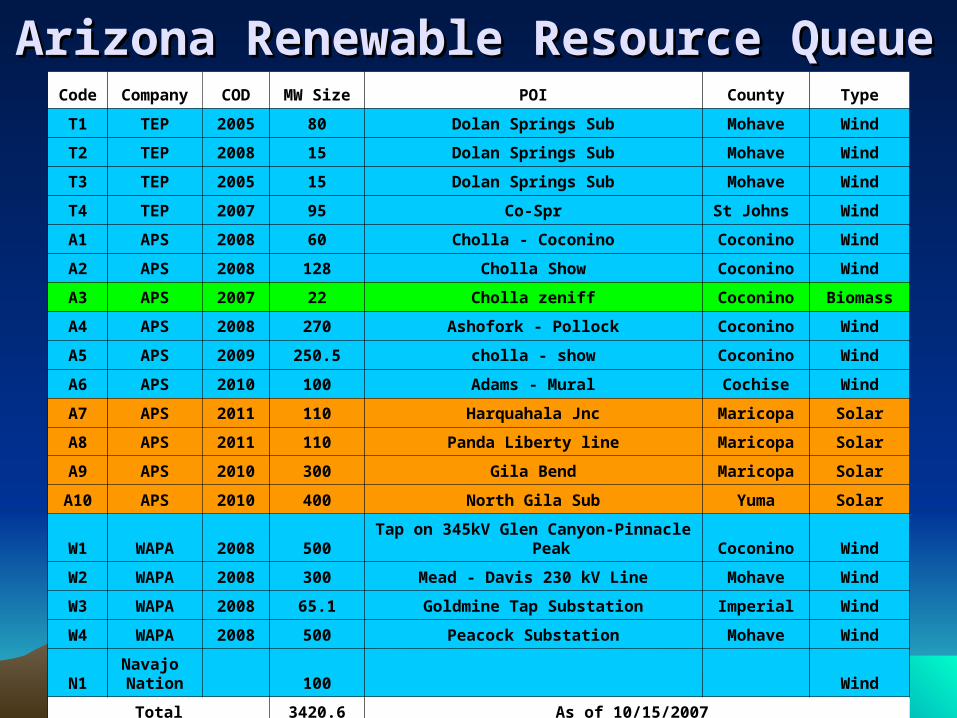
Arizona Renewable Resource QueueArizona Renewable Resource QueueCode Company COD MW Size POI County Type
T1 TEP 2005 80 Dolan Springs Sub Mohave Wind
T2 TEP 2008 15 Dolan Springs Sub Mohave Wind
T3 TEP 2005 15 Dolan Springs Sub Mohave Wind
T4 TEP 2007 95 Co-Spr St Johns Wind
A1 APS 2008 60 Cholla - Coconino Coconino Wind
A2 APS 2008 128 Cholla Show Coconino Wind
A3 APS 2007 22 Cholla zeniff Coconino Biomass
A4 APS 2008 270 Ashofork - Pollock Coconino Wind
A5 APS 2009 250.5 cholla - show Coconino Wind
A6 APS 2010 100 Adams - Mural Cochise Wind
A7 APS 2011 110 Harquahala Jnc Maricopa Solar
A8 APS 2011 110 Panda Liberty line Maricopa Solar
A9 APS 2010 300 Gila Bend Maricopa Solar
A10 APS 2010 400 North Gila Sub Yuma Solar
W1 WAPA 2008 500Tap on 345kV Glen Canyon-Pinnacle
Peak Coconino Wind
W2 WAPA 2008 300 Mead - Davis 230 kV Line Mohave Wind
W3 WAPA 2008 65.1 Goldmine Tap Substation Imperial Wind
W4 WAPA 2008 500 Peacock Substation Mohave Wind
N1Navajo Nation 100 Wind
Total 3420.6 As of 10/15/2007

1111
Arizona Renewable Resource Arizona Renewable Resource QueueQueue
Code MW Size
T1 80
T2 15
T3 15
T4 95
A1 60
A2 128
A3 22
A4 270
A5 250.5
A6 100
A7 110
A8 110
A9 300
A10 400
W1 500
W2 300
W3 65.1
W4 500
N1 100
As of 10/15/2007
1212
SWAT RTTFSWAT RTTFPart 2 - Resource Part 2 - Resource
ProjectionProjectionThe map is intended to provide an overview of the potential, renewable resources within Arizona, which include wind, solar, biomass, hydro and/or geothermal and identifies those resources as clusters.
Since both geothermal and biomass/biogas opportunities are small relative to both solar and wind opportunities, they have been included within the total which is described as generally wind and solar clusters.

1313
Potential Arizona Renewable ResourcesPotential Arizona Renewable Resources
SOLAR RESOURCE
WIND RESOURCE
DEVERS
MIGUELIMPERIALVALLEY
500 KV
NEVADA
CALIFORNIA
500 KV
ELDORADO
MEAD
MOHAVE
500 KV
230KV
TO SIGURD
(PACE)
GLEN CANYON
345
KV
345 KV
CALIFORNIA
ARIZONA
NORTHGILA
YUMA
ARIZONA
MEXI CO
500 KV
345 KV
SOUTH345 KV
345
KV
BICKNELL
SAGUARO
TORTOLITA
VAIL
LIBERTY
PHOENIX
KYRENE
500 KV
500
KV
PINNACLE PEAKWESTWING
500 KV
500 KV
CHOLLA
CORONADO
345 KV
SPRINGERVILLE
345
KV
345
KV
345
KV
500 K
V
COCONINO
500
KV
500
KV
500 KV
NAVAJO
MOENKOPI
345
KV
345KV
TO HUNGINGTON
(PACE)
345
KV
345 KV
230KV
TO CURECANTI
SHIPROCK
FOUR CORNERS
SAN JUAN
345
KV
McKINLEY
NEW
MEXICO
COLORADOUTAH
ARIZONA
345 KV
McCULLOUGH
REDHAWKGILA
RIVER
GILABEND
JOJOBA
RUDD
YAVAPAI
PALO VERDE/HASSAYAMPA
GREEN LEE
230 KV TOSWTC
TUCSON
230KV
230KV
230 KV
230
KV
WILLOWLAKE
ROUNDVALLEY
SELIGMAN
POWER PLANT
MAJOR SUBSTATION
500 KV 500 KV
500 KV
500
KV
500 KV
CRYSTAL
CASAGRANDE
SILVER KING
SANTA ROSA
TAT MOMOLI
DESERT BASIN
PREACHER CANYON
TS5
TS9
2012
2009
20122010
WINCHESTER
BROWNING
PINAL SOUTH
345kv 345kv
345kv
DESERT ROCK
EASTLOOP
345kv500kv
500kv
345
KV
APS 10 yr PLANS
TEP 10 yr PLANS
SRP 10 yr PLANS
NEW GENERATION
4300 MW
350 MW
1032 MW
1005 MW
970 MW
100 MW
BIOMASS RESOURCE
GEOTHERMAL RESOURCE
PINAL WEST
WECC PHASE 2 PROPOSED 500 kV LINE

1414
Quality of Wind Resources Quality of Wind Resources In ArizonaIn Arizona *Developed by DOE and NREL
• At 50m elevation, Class 4 or higher is typically used for utility scale wind generation (NREL).
• At 80m elevation, Class 3 areas could have higher wind power class because of possible wind shear (NREL)
• Arizona has predominately Class 3 or lower wind resources
Taken Directly from the United States Department of Energy website: http://www.eere.energy.gov/windandhydro/windpoweringamerica/maps_template.asp?stateab=az

1515
Quality of Solar Resources Quality of Solar Resources In ArizonaIn Arizona
• Potentially sensitive environmental lands, major urban areas, water features, and areas with slope >1% were excluded to identify those areas with the greatest potential for development. (NREL)
Taken Directly from NREL website: http://www.nrel.gov/csp/images/1pct_csp_az.jpg

1616
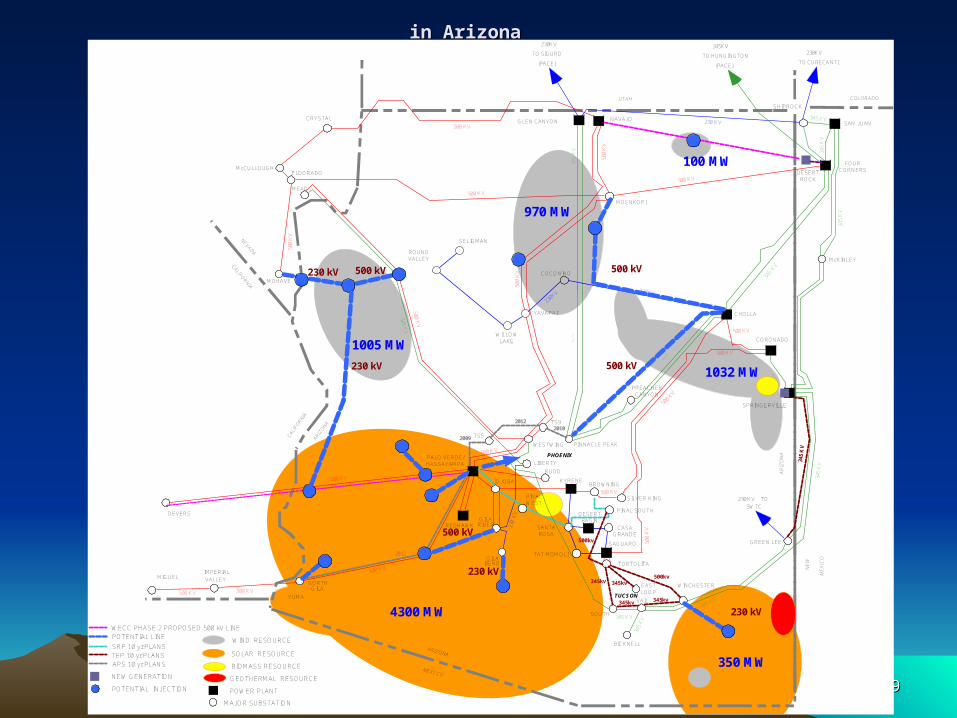
SWAT RTTFSWAT RTTFPart 3 - Part 3 - Transmission SystemTransmission SystemDuring the October 8th and November 16th 2007 meetings, transmission alternatives for bringing the renewable energy resources to load were developed.
Final transmission configuration represents the potential transmission lines that would be necessary if all of the renewable resources were to be developed in Arizona.

1717
Development of Final Development of Final Transmission ConfigurationTransmission Configuration
• In open stakeholder process three engineering groups were formed to brainstorm possible future transmission scenarios in the Arizona
• Each of the three groups independently created a transmission map
• A final transmission configuration was approved in SWAT stakeholder meetings
1818
SWAT RTTFSWAT RTTFPart 3 - Part 3 - Transmission SystemTransmission System
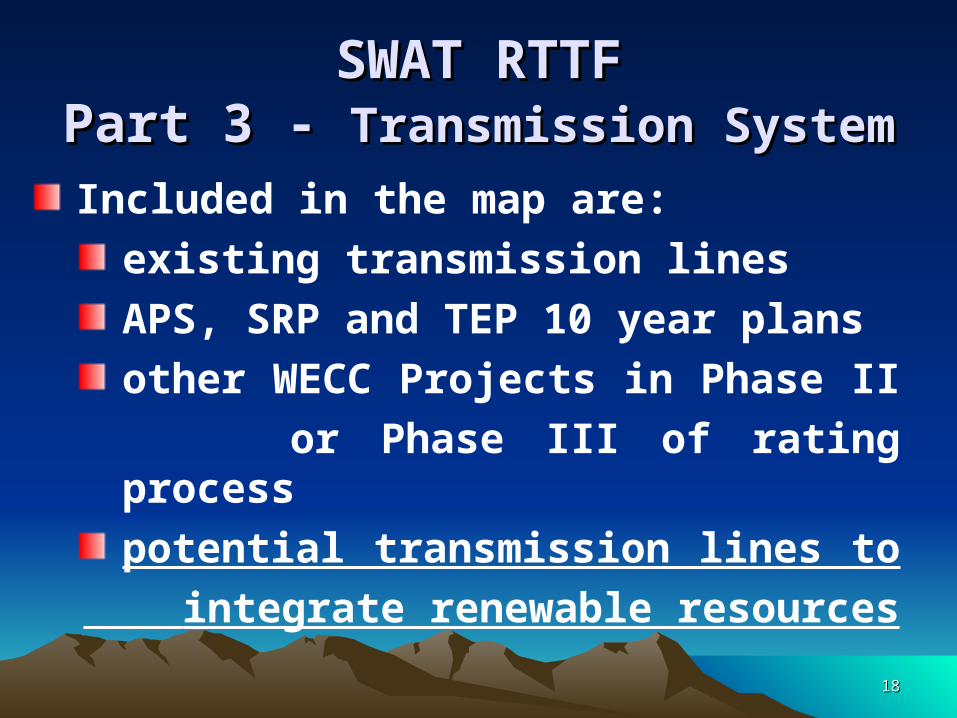
Included in the map are:
existing transmission lines
APS, SRP and TEP 10 year plans
other WECC Projects in Phase II
or Phase III of rating process
potential transmission lines to
integrate renewable resources
1919
Potential Configuration for Transmission to Serve All Available Renewable Resources in Potential Configuration for Transmission to Serve All Available Renewable Resources in
ArizonaArizona
SOLAR RESOURCE
WIND RESOURCE
DEVERS
MIGUELIMPERIALVALLEY
500 KV
NEVADA
CALIFORNIA
500 KV
ELDORADO
MEAD
MOHAVE
500 KV
230KV
TO SIGURD
(PACE)
GLEN CANYON
345
KV
345 KV
CALIFORNIA
ARIZONA
NORTHGILA
YUMA
ARIZONA
MEXI CO
500 KV
345 KV
SOUTH345 KV
345
KV
BICKNELL
SAGUARO
TORTOLITA
VAIL
LIBERTY
PHOENIX
KYRENE
500 KV
500
KV
PINNACLE PEAKWESTWING
500 KV
500 KV
CHOLLA
CORONADO
345 KV
SPRINGERVILLE
345
KV
345
KV
345 K
V
500 K
V
COCONINO
500
KV
500
KV
500 KV
NAVAJO
MOENKOPI
345
KV
345KV
TO HUNGINGTON
(PACE)
345
KV
345 KV
230KV
TO CURECANTI
SHIPROCK
FOUR CORNERS
SAN JUAN
345
KV
McKINLEY
NEW
MEXICO
COLORADOUTAH
ARIZONA
345 KV
McCULLOUGH
REDHAWKGILA
RIVER
GILABEND
JOJOBA
RUDD
YAVAPAI
PALO VERDE/HASSAYAMPA
GREEN LEE
230 KV TOSWTC
TUCSON
230KV
230KV
230 KV
230
KV
WILLOWLAKE
ROUNDVALLEY
SELIGMAN
POWER PLANT
MAJOR SUBSTATION
500 KV 500 KV
500 KV
500
KV
500 KV
CRYSTAL
CASAGRANDE
SILVER KING
SANTA ROSA
TAT MOMOLI
DESERT BASIN
PREACHER CANYON
TS5
TS9
2012
2009
20122010
WINCHESTER
BROWNING
PINAL SOUTH
345kv 345kv
345kv
DESERT ROCK
EASTLOOP
345kv500kv
500kv
345
KV
APS 10 yr PLANSTEP 10 yr PLANSSRP 10 yr PLANS
NEW GENERATION
POTENTIAL INJECTION
POTENTIAL LINE
500 kV
230 kV
500 kV230 kV
230 kV
230 kV
500 kV
500 kV
4300 MW
350 MW
1032 MW
1005 MW
970 MW
100 MW
BIOMASS RESOURCE
GEOTHERMAL RESOURCE
PINAL WEST
WECC PHASE 2 PROPOSED 500 kV LINE

2020
Potential renewable transmission routesPotential renewable transmission routes

2121
Estimated Estimated Construction CostsConstruction Costs
SubstationAdditions
Voltage (kV)
# of Substations Added
500 11
230 3
Totals Cost (Million)
Substations $130
Lines $1,500
Total $1,630Transmission
CircuitsVoltage
(kV) Miles
500 445
230 247

2222
SWAT RTTFSWAT RTTFPhase #2 – Evaluation and Integration of Phase #2 – Evaluation and Integration of
Renewable Resources of Southwest Renewable Resources of Southwest into Transmission Networkinto Transmission Network
• Workshop Meetings held on April 7th and May 19th 2008– Renewable resource projection development– Potential transmission additions are in development
for the entire SWAT area
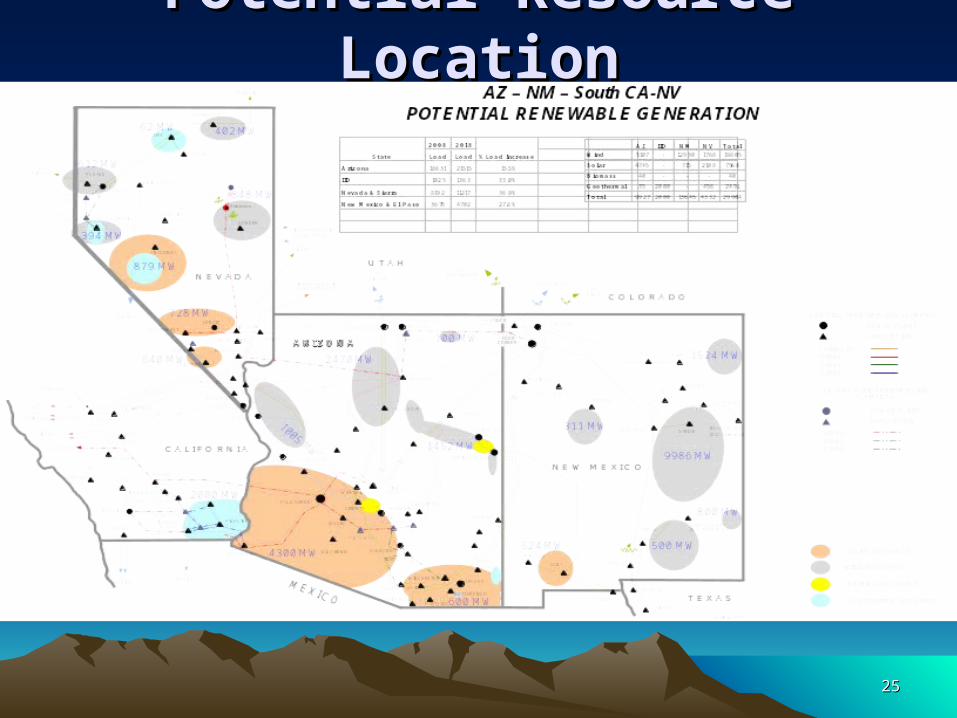
• Renewable Taskforce has been extended to the entire SWAT area and includes Arizona, New Mexico, Nevada and Eastern California
• Power flow studies will be developed based on the transmission alternatives
2323
SouthwestArea
Transmission
SWATSWAT
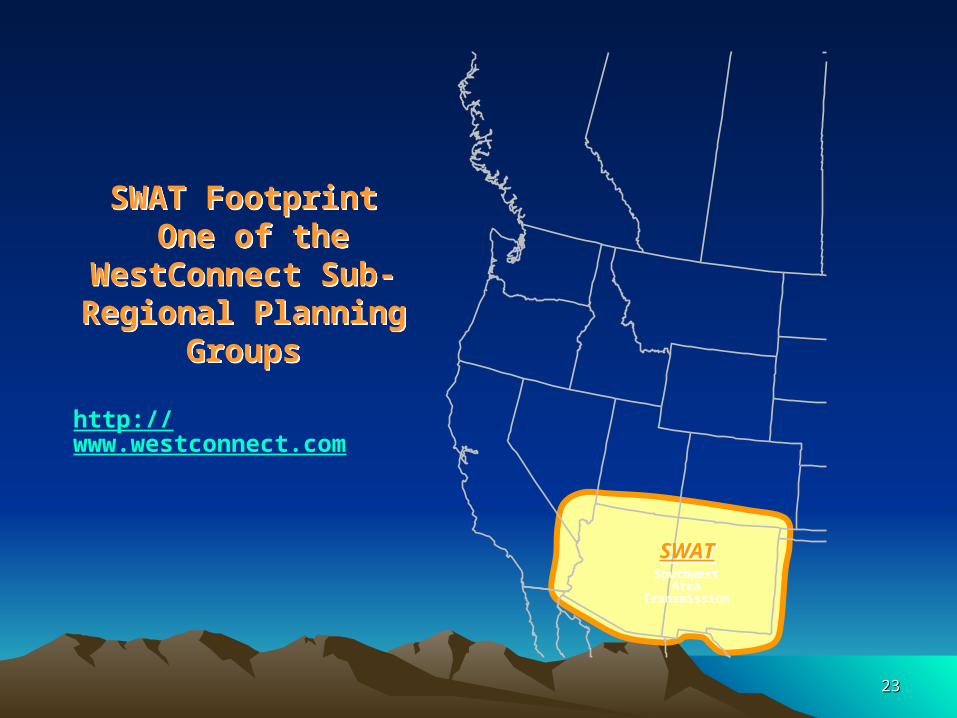
SWAT Footprint One of the WestConnect Sub-Regional Planning
Groups
SWAT Footprint One of the WestConnect Sub-Regional Planning
Groups
http://www.westconnect.com

2424
CCPG
NWPP AreaNWPP Area
WECCWECC(PCC & TEPPC)(PCC & TEPPC)
CAISOPSPAPSPA
Others
LADWP
Col.Grid
SWAT
NTTG
SSPG
West ConnectWest Connect
NTAC
Western Transmission Planning TodayWestern Transmission Planning Today
WGA & WGA & CREPCCREPC
24FERC Transmission Barriers Conference 10/14/08
2525
Potential Resource LocationPotential Resource Location

2626
Arizona Renewable Arizona Renewable Transmission Task Transmission Task
ForceForceBTA ResponseBTA ResponseChairman of SWAT RTTF Chairman of SWAT RTTF
Peter KrzykosPeter KrzykosBTA WorkshopBTA Workshop
May 22-23 2008May 22-23 2008
Related Documents

![Oct 23 12017 - University of Pittsburghkaveh/Lecture-MATH0230-Oct23-2017.pdf · Basic Properties of limit of sequences in {.} anttbn = himFlim{an] {bn} n → a × n→oo × n→a](https://static.cupdf.com/doc/110x72/5f14f47b17a5474f013d9e3e/oct-23-12017-university-of-kavehlecture-math0230-oct23-2017pdf-basic-properties.jpg)