Appendix D: Evidence tables – RQ HH & II - Diagnosis of active TB 1 1 Appendix D: Evidence tables – RQ HH & II - Diagnosis of active TB

Welcome message from author
This document is posted to help you gain knowledge. Please leave a comment to let me know what you think about it! Share it to your friends and learn new things together.
Transcript

Appendix D: Evidence tables – RQ HH & II - Diagnosis of active TB
1
1 Appendix D: Evidence tables – RQ HH & II - Diagnosis of active TB

Appendix D: Evidence tables – RQ HH & II - Diagnosis of active TB
2
Contents
1 Appendix D: Evidence tables – RQ HH & II - Diagnosis of active TB ........................ 1
A.1.1 Radhakrishnan, S., & Subramani, R. (2011) ....................................................... 4
A.1.2 Casado JL, Moreno S et al (2002) ....................................................................... 9
A.1.3 Tedla Z Nyrenda S et al (2010) .......................................................................... 13
A.1.4 Mori MA, Leonardson G et al (1992) ................................................................. 20
A.1.5 Fountain FF, Tolley E et al (2005) ..................................................................... 24
A.1.6 LoBue, Philip A., and Kathleen S. Moser (2003) .............................................. 28
A.1.7 Fernández-Villar, A., Sopeña, B., et al (2003)................................................... 36
A.1.8 Nolan, C. M., Goldberg, S. V (1999) .................................................................. 41
A.1.9 Dickinson, D. S., Bailey, W. C., ......................................................................... 44
A.1.10 Lee, A. M., Mennone, J. Z et al (2002) ............................................................... 48
A.1.11 Gilroy, S. A., Rogers, M. A., .............................................................................. 53
A.1.12 Oni, T., Tsekela, R.,(2012) ................................................................................. 58
A.1.13 Goswami, N. D., Gadkowski, L. B (2012) .......................................................... 62
A.1.14 Smith, B. M., Schwartzman, K., (2011) ............................................................. 66
A.1.15 Anibarro, L., Casas, S.,( 2010) .......................................................................... 71
A.1.16 Li, J., Munsiff, S. S.(2010) ................................................................................. 78
A.1.17 Machado Jr, A., Finkmoore, B (2009) ............................................................... 85
A.1.18 Kwara A, Herold J S et al (2008) ....................................................................... 92
A.1.19 Haley, C. A., Stephan, S. et al (2008) ................................................................ 96
A.1.20 Leung, C. C., Yew, W. W et al (2007) .............................................................. 103
A.1.21 Lobato MN, Reves RR et al (2005) .................................................................. 108
A.1.22 Vinnard C, Gopal A (2013)............................................................................... 115
A.1.23 Martinez-Pino I, Sambeat, MA et al (2013) ..................................................... 118
A.1.24 Pettit AC, Bethel J et al (2013) ........................................................................ 124
A.1.25 DiPerri G, Micciolo R (1993) ............................................................................ 131
A.1.26 Antonucci G, Girardi E et al (1995) ................................................................. 134
A.1.27 Gessner BD, Weiss NS (1998) ........................................................................ 139
A.2.1 Menzies D, Long R et al (2008) ....................................................................... 142
A.2.2 Samandari,T., Agizew,T.B., et al. (2011) ........................................................ 146
A.2.3 Halsey,N.A., Coberly,J.S., (1998) ................................................................... 150
A.2.4 Pape,J.W., Jean,S.S., et al. (1993) ................................................................. 153
A.2.5 Anon (1982) ...................................................................................................... 156
A.2.6 Schechter,M., Zajdenverg,R., et al. (2006) .................................................... 161
A.2.7 Mwinga,A., Hosp,M., et al. (1998)................................................................... 165
A.2.8 Quigley,M.A., Mwinga,A., et al (2001) ............................................................ 165
A.2.9 Gupta,D.K., Kumar,R., Nath,N. (1993) .......................................................... 168
A.2.10 Hawken M.P., Meme H.K., et al. (1997) .......................................................... 171

Appendix D: Evidence tables – RQ HH & II - Diagnosis of active TB
3
A.2.11 Gordin,F., Chaisson,R.E., et al. (2000) .......................................................... 174
A.2.12 Chan,P.C., Yang,C.H., et al. (2012) ................................................................ 178
A.2.13 Leung,C.C., Law,W.S., et al. (2003) ................................................................ 181
A.2.14 Martinson,N.A., Barnes,G.L., et al.(2011) ...................................................... 185
A.2.15 Matteelli,A., Olliaro,P., et al. (1999) ................................................................ 190
A.2.16 Jimenez-Fuentes,M.A., de Souza-Galvao,M.L., et al. (2013) ........................ 193
A.2.17 White,M.C., Tulsky,J.P., et al. (2012) ............................................................. 197
A.2.18 Whalen,C.C., Johnson,J.L., et al.(1997) ........................................................ 201
A.2.19 Swaminathan,S., Menon,P.A., et al. (2012) ................................................... 205
A.2.20 Sterling,T.R., Villarino,M.E., et al. (2011) ....................................................... 209
A.2.21 Spyridis,N.P., Spyridis,P.G., et al. (2007) ...................................................... 215
A.2.22 Byrd,R.B., Horn,B.R., Griggs,G.A..(1997) ..................................................... 219
A.2.23 Ferebee SH., Mount FW., Murray FJ.(1963) ................................................. 222
A.2.24 Debre,R., Perdrizet,S., et al.(1973) ................................................................. 225

Appendix D: Evidence tables – RQ HH & II - Diagnosis of active TB
4
RQ HH: According to their risk factors, which people with either latent TB infection or in close contact with people who have active TB should receive drug treatment to prevent the development of active TB?
Risk factors for benefit or harm from the treatment of latent tuberculosis
A.1.1 Radhakrishnan, S., & Subramani, R. (2011)
Bibliographic reference
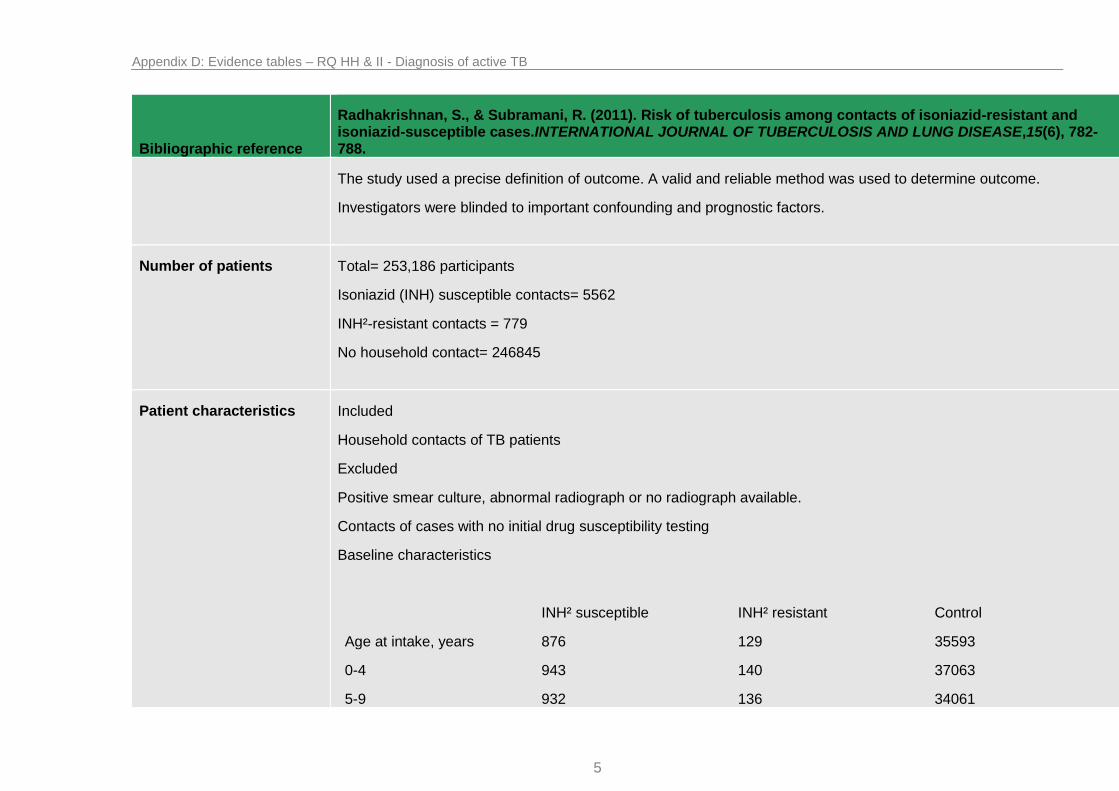
Radhakrishnan, S., & Subramani, R. (2011). Risk of tuberculosis among contacts of isoniazid-resistant and isoniazid-susceptible cases.INTERNATIONAL JOURNAL OF TUBERCULOSIS AND LUNG DISEASE,15(6), 782-788.
Study type Cohort
Study quality Population taken from a double-blind randomised control trial assessing the protective efficacy of BCG vaccination.
Population does not exactly match population of interest as TST¹ negative participants are included; however subgroup analysis is possible.
Baseline: Unclear if cohorts were matched for the amount that received BCG vaccination or placebo in the initial trial; however the primary paper found no difference in incidence of TB between these two populations.
Analysis of variance was undertaken to balance the comparison groups for other potential confounding factors.
Baseline: Cohort was significantly older in persons in households without a TB case. Isoniazid susceptible cohort had the lowest proportion of males. Isoniazid resistant cohort had the highest proportion of infected participants.
Follow up: Planned follow up was 15 years however, in the primary study subjects with an initial induration of > 15 mm who were unlikely to benefit from BCG had follow up reduced to 7.5 years to reduce workload. Analysis was adjusted to allow for differences in length of follow up.
In terms of person-years, follow up was similar in the three series in the first 5 years. An appropriate length of follow up was used.
Appendix D: Evidence tables – RQ HH & II - Diagnosis of active TB
5
Bibliographic reference
Radhakrishnan, S., & Subramani, R. (2011). Risk of tuberculosis among contacts of isoniazid-resistant and isoniazid-susceptible cases.INTERNATIONAL JOURNAL OF TUBERCULOSIS AND LUNG DISEASE,15(6), 782-788.
The study used a precise definition of outcome. A valid and reliable method was used to determine outcome.
Investigators were blinded to important confounding and prognostic factors.
Number of patients Total= 253,186 participants
Isoniazid (INH) susceptible contacts= 5562
INH²-resistant contacts = 779
No household contact= 246845
Patient characteristics Included
Household contacts of TB patients
Excluded
Positive smear culture, abnormal radiograph or no radiograph available.
Contacts of cases with no initial drug susceptibility testing
Baseline characteristics
INH² susceptible INH² resistant Control
Age at intake, years
0-4
5-9
876
943
932
129
140
136
35593
37063
34061

Appendix D: Evidence tables – RQ HH & II - Diagnosis of active TB
6
Bibliographic reference
Radhakrishnan, S., & Subramani, R. (2011). Risk of tuberculosis among contacts of isoniazid-resistant and isoniazid-susceptible cases.INTERNATIONAL JOURNAL OF TUBERCULOSIS AND LUNG DISEASE,15(6), 782-788.
10-14
15-24
25-34
35-44
45-54
≥55
Total
mean
1056
688
462
348
257
5562
19.8
134
113
49
43
35
779
19.0
39696
36583
27888
19808
16153
246845
22.7
Sex
Male
Female
2533 (45.5%)
3029 (54.5%)
383 (49.2%)
396 (50.8%)
122581 (49.7%)
124 264 (50.3%)
Infection status at intake
Not infected
Infected
2444 (43.9%)
3118 (56.1%)
235 (30.2%)
544 (69.8%)
132400 (53.6%)
114445 (46.4%)
Intervention Household contacts of isoniazid susceptible cases
N= 5562
Household contacts of isoniazid resistant cases
N= 779

Appendix D: Evidence tables – RQ HH & II - Diagnosis of active TB
7
Bibliographic reference
Radhakrishnan, S., & Subramani, R. (2011). Risk of tuberculosis among contacts of isoniazid-resistant and isoniazid-susceptible cases.INTERNATIONAL JOURNAL OF TUBERCULOSIS AND LUNG DISEASE,15(6), 782-788.
Comparison Control group of participants without household contact of TB
N= 246845
Length of follow up 15 years
Location India
Outcomes measures and effect size
Incidence of tuberculosis
Number of participants diagnosed with tuberculosis
Subgroup Risk group Population Standardised incidence/100000
Hazard Ratio 95% confidence interval
Infected patients No TB case at home
114445 314 1.0
INH²- susceptible contact
5835 530 1.8 1.4-2.2
INH²- resistant contact
728 436 2.2 1.5-3.3
Not infected female child
46303 1.0

Appendix D: Evidence tables – RQ HH & II - Diagnosis of active TB
8
Bibliographic reference
Radhakrishnan, S., & Subramani, R. (2011). Risk of tuberculosis among contacts of isoniazid-resistant and isoniazid-susceptible cases.INTERNATIONAL JOURNAL OF TUBERCULOSIS AND LUNG DISEASE,15(6), 782-788.
Infected patients Infected female child
8521 8.3 5.6-12.3
Infected male child
9841 12.2 8.4-17.6
Infected female adult
48132 15.8 11.0-22.7
Infected male adult
54514 50.6 34.2-74.8
Source of funding Unclear who provided funding for this project
A trial from the Indian Council of Medical Research
Comments SUMMARY: The baseline prevalence of tuberculosis infection was substantially higher in contacts of INH-resistant than INH-susceptible patients, but the incidence of tuberculosis disease over a 15 year follow up was similar in the two series, and twice as high as in non-contacts.
¹TST- tuberculin skin test
²INH- Isoniazid

Appendix D: Evidence tables – RQ HH & II - Diagnosis of active TB
9
A.1.2 Casado JL, Moreno S et al (2002)
Bibliographic reference
Casado, J. L., Moreno, S., Fortún, J., Antela, A., Quereda, C., Navas, E., ... & Dronda, F. (2002). Risk Factors for Development of Tuberculosis after Isoniazid Chemoprophylaxis in Human Immunodeficiency Virus—Infected Patients.Clinical infectious diseases, 34(3), 386-389.
Study type Cohort
Study outline Population matches the population of interest
Question is relevant; discussing the risk factors for development of active tuberculosis.
Unclear if all patients received the same level of care.
Follow up: median follow up was 43 months (range 14-118 months). Adjustments were attempted to allow for differences. Length of follow up was appropriate.
Patients included were comparable for intervention completion. Patients stopping treatment due to adverse events were excluded from the study. All patients received ≥ 9 months of isoniazid prophylaxis. Unclear if those stopping treatment were systematically different from those who remained in the study.
Definition of outcome was unclear: persistence of predisposing conditions for TB infection was highlighted as the main risk factor with no attempt to break down the data any further.
Unclear if a valid and reliable method was used to determine the outcome.
Number of patients Population: 131
Patient characteristics Included= 131
HIV infected patients under treatment for latent TB with isoniazid chemoprophylaxis.
“Compliant” patients
Received ≥9 months of isoniazid chemoprophylaxis
Follow up lasting ≥1 year after isoniazid chemoprophylaxis, or until death
Positive TST¹

Appendix D: Evidence tables – RQ HH & II - Diagnosis of active TB
10
Bibliographic reference
Casado, J. L., Moreno, S., Fortún, J., Antela, A., Quereda, C., Navas, E., ... & Dronda, F. (2002). Risk Factors for Development of Tuberculosis after Isoniazid Chemoprophylaxis in Human Immunodeficiency Virus—Infected Patients.Clinical infectious diseases, 34(3), 386-389.
Excluded
Receiving HAART³
Baseline characteristics
Mean age: 35 years (range, 21-58 years)
Males/females: 102/29 patients
Median CD4 cell count: 405 cells/ml
Injection drug use: 82%
Homosexuality: 8%
Heterosexual intercourse with HIV infected partner 6%
Unknown:4%
Prior AIDS defining illness- 3%
Drug addiction: 83%
Prior imprisonment: 21%
Close contact with recently diagnosed TB case: 10%
Multiple factors for TB: 21%
Intervention >9 months of isoniazid preventive therapy= 131
Length of follow up Median follow up: 43 months
Location Spain

Appendix D: Evidence tables – RQ HH & II - Diagnosis of active TB
11
Bibliographic reference
Casado, J. L., Moreno, S., Fortún, J., Antela, A., Quereda, C., Navas, E., ... & Dronda, F. (2002). Risk Factors for Development of Tuberculosis after Isoniazid Chemoprophylaxis in Human Immunodeficiency Virus—Infected Patients.Clinical infectious diseases, 34(3), 386-389.
Outcomes measures and effect size
Risk of developing tuberculosis
Multivariate model of risk factors:
Relative hazard (95% CI²) P value
CD4 cell count (per each unit of increase)
0.995 (0.992-1.003) 0.06
Persistence of predisposing factors for TB
3.17 (1.56-17) 0.0002
Unclear which predisposing factors proved the greater risk, or which were included in the multivariate model: Data initially collected included: demographic data, initial CD4 cell count, compliance, toxicity, predisposing factors for TB before and after isoniazid treatment, incidence of and time to development of TB, CD4 cell count at the time of disease and survival.
Source of funding Unclear who provided funding for this project
A trial from the Department of Infectious Diseases, Madrid
Comments SUMMARY: Of all the factors investigated, only the persistence of predisposing conditions for TB infection, such as drug addiction or new prison admissions, was found to increase the risk of active TB. This suggests reinfection as the main cause of TB after isoniazid chemoprophylaxis.
Most patients received isoniazid chemoprophylaxis early in the course of HIV infection and thus the effect of CD4 count drop on the rate of TB could not be estimated.
All patients included were also compliant adherers to medication therefore the effect of non-compliance to treatment also could not be estimated.
Abbreviations:
¹TST- tuberculin skin test
²CI- confidence interval

Appendix D: Evidence tables – RQ HH & II - Diagnosis of active TB
12
Bibliographic reference
Casado, J. L., Moreno, S., Fortún, J., Antela, A., Quereda, C., Navas, E., ... & Dronda, F. (2002). Risk Factors for Development of Tuberculosis after Isoniazid Chemoprophylaxis in Human Immunodeficiency Virus—Infected Patients.Clinical infectious diseases, 34(3), 386-389.
³HAART- Highly active antiretroviral therapy

Appendix D: Evidence tables – RQ HH & II - Diagnosis of active TB
13
A.1.3 Tedla Z Nyrenda S et al (2010)
Bibliographic reference
Tedla, Z., Nyirenda, S., Peeler, C., Agizew, T., Sibanda, T., Motsamai, O., ... & Samandari, T. (2010). Isoniazid-associated hepatitis and antiretroviral drugs during tuberculosis prophylaxis in HIV-infected adults in Botswana. American journal of respiratory and critical care medicine, 182(2), 278-285.
Study type Cohort
Study quality Population does not exactly match population of interest as TST¹ negative participants were likely included in the population.
Intervention matches intervention of interest
Participants received the same isoniazid intervention under the Botswana national guidelines. Unclear if patients received the same care and support aside from this intervention at the different cities and health clinic settings in the study.
Follow up: No follow up apparent beyond the 6 month treatment period. Groups were comparable for treatment completion and those who had completed less than 4 months of isoniazid treatment were excluded from the study.
No attempt was made to examine those who dropped out for any important or systematic differences to the remaining participants.
A precise definition of outcome was used and a valid and reliable method used to determine the outcome.
Number of patients In total= 1,995 participants
Patient characteristics 1,995 HIV infected participants were enrolled at 8 different local health clinics in the cities of Gaborone and Francistown in Botswana.
Included
HIV infected
Aged 18-70 years
Free from cough, fever, clinical AIDS, respiratory illness or lymphadenopathy on examination
Under isoniazid preventive therapy
Excluded

Appendix D: Evidence tables – RQ HH & II - Diagnosis of active TB
14
Bibliographic reference
Tedla, Z., Nyirenda, S., Peeler, C., Agizew, T., Sibanda, T., Motsamai, O., ... & Samandari, T. (2010). Isoniazid-associated hepatitis and antiretroviral drugs during tuberculosis prophylaxis in HIV-infected adults in Botswana. American journal of respiratory and critical care medicine, 182(2), 278-285.
Pregnant
Serum aspartate aminotransferase > 85 international units (IU)
Alanine aminotransferase > 103 IU/L (≥2.5 times upper limit of normal)
Total Bilirubin greater than 39 µmol/L (≥1.5 times upper limit of normal)
Baseline characteristics
Male/Female: 28% / 72%
Median age: 32 years (range 18-70 years)
Underweight (BMI²): 18%
Overweight (BMI²): 17%
Obese (BMI²): 9%
Tuberculin skin test positive: 24%
CD4 count <200: 31%
Undergoing antiretroviral therapy: 26%
Intervention Isoniazid
For body weight ranging 30-49 kg
Isoniazid: 300mg daily, for 6 months
Pyridoxine: 25mg daily, for 6 months
Self-administered

Appendix D: Evidence tables – RQ HH & II - Diagnosis of active TB
15
Bibliographic reference
Tedla, Z., Nyirenda, S., Peeler, C., Agizew, T., Sibanda, T., Motsamai, O., ... & Samandari, T. (2010). Isoniazid-associated hepatitis and antiretroviral drugs during tuberculosis prophylaxis in HIV-infected adults in Botswana. American journal of respiratory and critical care medicine, 182(2), 278-285.
For body weight ranging >50 kg
Isoniazid: 400mg daily, for 6 months
Pyridoxine: 25mg daily, for 6 months
Self-administered
Length of follow up No apparent follow up beyond treatment period
Location Botswana
Outcomes measures and effect size
Risk factors associated with severe isoniazid-associated hepatitis during 6 months of isoniazid preventive therapy
Relative risks:
Fraction of participants with hepatitis Relative risk (95% CI²)
Age
>35 y
≤35 y
9/645
10/1117
1.56 (0.64-3.82)
1.00
Sex
Female
Male
13/1293
6/469
0.79 (0.30-2.06)
1.00
Body mass index
Underweight
Not underweight
2/304
15/1426
0.63 (0.14-2.72)
1.00

Appendix D: Evidence tables – RQ HH & II - Diagnosis of active TB
16
Bibliographic reference
Tedla, Z., Nyirenda, S., Peeler, C., Agizew, T., Sibanda, T., Motsamai, O., ... & Samandari, T. (2010). Isoniazid-associated hepatitis and antiretroviral drugs during tuberculosis prophylaxis in HIV-infected adults in Botswana. American journal of respiratory and critical care medicine, 182(2), 278-285.
CD4 lymphocyte count
CD4 <200 cells/mm³
CD4 ≥200 cells/mm³
10/501
9/1261
2.80 (1.14-6.84)
1.00
Anti-retroviral therapy (ART)
Receipt of ART
No receipt of ART
7/480
12/1282
1.56 (0.62-3.93)
1.00
Efavirenz
Efavirenz based regimens
ART not efavirenz
2/223
5/257
0.46 (0.09-2.35)
1.00
Efavirenz
Efavirenz based regimens
Not ART
2/223
12/1282
0.96 (0.21-4.31)
1.00
Nevirapine
Niverapine therapy
ART not using nevirapine
5/256
2/224
2.19 (0.43-11.2)
1.00
Nevirapine
Niverapine therapy
Not ART
5/256
12/1282
2.09 (0.74-5.87)
1.00
NNRTI³ 7/479 -

Appendix D: Evidence tables – RQ HH & II - Diagnosis of active TB
17
Bibliographic reference
Tedla, Z., Nyirenda, S., Peeler, C., Agizew, T., Sibanda, T., Motsamai, O., ... & Samandari, T. (2010). Isoniazid-associated hepatitis and antiretroviral drugs during tuberculosis prophylaxis in HIV-infected adults in Botswana. American journal of respiratory and critical care medicine, 182(2), 278-285.
NNRTI³
NO NNRTI³
0/1 -
Co-trimoxazole
Co-trimoxazole use
No co-trimoxazole
4//245
12/1517
1.65 (0.55-4.93)
1.00
Alcohol
Drinks alcohol
No alcohol
8/597
11/1165
1.42 (0.57-3.51)
1.00
Alcohol dependence
CAGE ≤ 1
CAGE = 0
8/358
11/1165
2.37 (0.96-5.84)
1.00
Viral Hepatitis Viral Hepatitis as a risk factor for isoniazid hepatotoxicity
Thirteen case subjects and 127 control subjects were tested for HBV and HCV.
Hep B Viral Serological Pattern
Interpretation Case Subjects Control Subjects Total
Hepatitis B core antibody: negative
Hepatitis B surface antibody: negative
Hepatitis B surface
Susceptible 4 51 55

Appendix D: Evidence tables – RQ HH & II - Diagnosis of active TB
18
Bibliographic reference
Tedla, Z., Nyirenda, S., Peeler, C., Agizew, T., Sibanda, T., Motsamai, O., ... & Samandari, T. (2010). Isoniazid-associated hepatitis and antiretroviral drugs during tuberculosis prophylaxis in HIV-infected adults in Botswana. American journal of respiratory and critical care medicine, 182(2), 278-285.
antigen: negative
Hepatitis B core antibody: positive
Hepatitis B surface antibody: positive/negative
Hepatitis B surface antigen: negative
Natural infection that resolved
7 60 67
Hepatitis B core antibody: negative
Hepatitis B surface antibody: positive
Hepatitis B surface antigen: negative
Immune due to immunization
1 7 8
Hepatitis B core antibody: positive
Hepatitis B surface antibody: negative
Hepatitis B surface antigen: positive
Chronic infection 0 8 8
Incomplete serology other 1 1 2
13 127 140
None of the cases of isoniazid hepatitis had chronic viral hepatitis B infection therefore no evidence of an association between the two was found.

Appendix D: Evidence tables – RQ HH & II - Diagnosis of active TB
19
Bibliographic reference
Tedla, Z., Nyirenda, S., Peeler, C., Agizew, T., Sibanda, T., Motsamai, O., ... & Samandari, T. (2010). Isoniazid-associated hepatitis and antiretroviral drugs during tuberculosis prophylaxis in HIV-infected adults in Botswana. American journal of respiratory and critical care medicine, 182(2), 278-285.
Source of funding Unclear who provided funding for this project
One of the named researchers has full time employment under a pharmaceutical company
Comments SUMMARY: Of all risk factors under study, only CD4 cell count <200 cells/mm³ was significantly related to a higher risk of isoniazid associated hepatitis after multivariate analysis. There was however a significant interaction term between this and antiretroviral therapy.
¹TST- tuberculin skin test
²BMI- Body Mass Index
³NNRTI- Nonnucleoside reverse transcriptase inhibiter

Appendix D: Evidence tables – RQ HH & II - Diagnosis of active TB
20
A.1.4 Mori MA, Leonardson G et al (1992)
Bibliographic reference Mori, M. A., Leonardson, G., & Welty, T. K. (1992). The benefits of isoniazid chemoprophylaxis and risk factors for tuberculosis among Oglala Sioux Indians.Archives of internal medicine, 152(3), 547-550.
Study type Case Control
Study quality Population does not exactly match population of interest: Native American people were enrolled; this population has an incidence of TB two to three times that of the surrounding populations. Not all patients in the active tuberculosis group had a documented positive TST¹ test prior to TB diagnosis. 1 had a negative TST¹ and 8 had an unknown infection status.
Outcome matches outcome of interest.
The study does not ask a clearly focused question: It attempts to illicit the benefit of isoniazid preventive therapy in those that are tuberculin reactors however some non-reactors were also included in the analysis thereby confounding the study data. Also since documented TST¹ reactors are more likely to be offered chemoprophylaxis, the control group is likely to overestimate the proportion of latently infected people in the population who receive preventive therapy.
The data on risk factors for developing tuberculosis is more useful but still confounded by the presence of non-TST¹ reactors in the case group.
The cases and controls are taken from comparable populations, however, control patients were found to be more compliant to treatment when compared to tuberculosis cases.
As mentioned, the same exclusion criteria were not used for both cases and controls in regard to previous positive TST¹ result.
Participants and non-participants were not compared
Cases are clearly defined and differentiated from controls. It is established that controls are not cases.
No measures appear to have been taken to prevent knowledge of primary exposure(s) from influencing case ascertainment
Exposure to diabetes may have not been measured in a standard and reliable fashion since patients with high random or fasting blood glucose recordings were listed as being diabetic, however British guidelines require more than just one isolated raised blood glucose level. Chart documentation supplied many of the other diagnoses such as notation of alcohol abuse or admissions related to alcoholism.

Appendix D: Evidence tables – RQ HH & II - Diagnosis of active TB
21
Bibliographic reference Mori, M. A., Leonardson, G., & Welty, T. K. (1992). The benefits of isoniazid chemoprophylaxis and risk factors for tuberculosis among Oglala Sioux Indians.Archives of internal medicine, 152(3), 547-550.
Multivariate analysis allows many of the main potential confounders to be taken into account
Confidence intervals have been provided.
As mentioned the fact that the control group were chosen on the basis of TST¹ reaction means that more of these participants were offered chemoprophylaxis than would have been in the general latently infected population. Therefore results would not be generalizable to this source population in regards to development of active tuberculosis.
Comparisons are made for age, sex, chemoprophylaxis therapy, immunosuppression, alcohol abuse, diabetes, chronic renal failure and pulmonary scarring or nodules on x-ray.
Unclear how long participant’s histories were tracked for
Unclear how this study was funded.
Number of patients In total= 92 participants
Active tuberculosis infected= 46
Tuberculin reactors without active disease= 46
Patient characteristics Included
Case group:
every adult with active tuberculosis
age > 18 years
Control group:
positive tuberculin test recorded in medical records before the median date of diagnosis of tuberculosis in the case group.
Excluded
Case group:
patients who had undergone reactivation of tuberculosis and had received chemotherapy

Appendix D: Evidence tables – RQ HH & II - Diagnosis of active TB
22
Bibliographic reference Mori, M. A., Leonardson, G., & Welty, T. K. (1992). The benefits of isoniazid chemoprophylaxis and risk factors for tuberculosis among Oglala Sioux Indians.Archives of internal medicine, 152(3), 547-550.
Baseline characteristics
Cases n=46 Controls n= 46
Median age, y 54.5 56.5
Sex, %
M
F
65.2
34.8
45.7
54.3
6+ months of isoniazid chemoprophylaxis
1 24
Immunosuppression 3 1
Alcohol abuse 25 15
Diabetes
M
F
16
8
8
5
2
3
Chronic renal Failure 6 0
Pulmonary scarring/nodules, among those with radiograms
20 16
Intervention Those who develop active tuberculosis
Comparison Those who have latent tuberculosis but do not develop active disease
Length of follow up Unclear

Appendix D: Evidence tables – RQ HH & II - Diagnosis of active TB
23
Bibliographic reference Mori, M. A., Leonardson, G., & Welty, T. K. (1992). The benefits of isoniazid chemoprophylaxis and risk factors for tuberculosis among Oglala Sioux Indians.Archives of internal medicine, 152(3), 547-550.
Location USA
Outcomes measures and effect size
Risk factors for active tuberculosis
After multivariate analysis
Cases n=46 Controls n=46 Crude odds ratio
95% confidence interval
Adjusted odds ratio
Adjusted 95% confidence interval
6+ months chemoprophylaxis
1 24 0.02 0-0.15 0.02 0.002-0.16
Alcohol abuse 25 15 2.5 0.97-6.3 3.8 1.15-12.3
Diabetes 16 5 4.4 1.29-15.5 5.2 1.22-22.1
Source of funding Unclear who provided funding for this project
Comments SUMMARY: After multivariate analysis: Diabetes, alcohol abuse and chronic renal failure were risk factors for active tuberculosis development after latent tuberculosis infection.
¹TST- tuberculin skin test

Appendix D: Evidence tables – RQ HH & II - Diagnosis of active TB
24
A.1.5 Fountain FF, Tolley E et al (2005)
Bibliographic reference
Fountain, Francis F., Elizabeth Tolley, Cary R. Chrisman, and Timothy H. Self. "Isoniazid Hepatotoxicity Associated With Treatment of Latent Tuberculosis InfectionA 7-Year Evaluation From a Public Health Tuberculosis Clinic." CHEST Journal 128, no. 1 (2005): 116-123.
Study type Retrospective Cohort
Study outline Population matches the population of interest
Question is relevant; discussing the risk factors for development of isoniazid associated hepatotoxicity.
Patients did not receive the same level of care as participants within the last three years of the study were given 9 months of isoniazid instead of 6 months, due to changes in American Thoracic Society Guidelines. Participants were treated from the same site.
Follow up: testing for hepatotoxicity took place at 1 month, 3 months and 6 months. No further testing took place. Follow up was possibly not appropriate since patients may suffer hepatotoxicity following treatment or within the last 3 months of treatment.
Treatment completion was poor across the board with only 43.13% of patients completing 3 months of therapy and 21.65% of patients completing 6 months of therapy. Attempts to find the systematic differences between those who did or did not complete treatment have been made. Those who completed treatment were more likely to be at least 50 years old. Those who did not complete treatment were associated with having hepatitis or being treated within the period that a longer regimen of isoniazid was recommended (9 months).
Multivariate analysis was used. Unclear if multivariate analysis adjusted for varying compliance.
Definition of outcome was clear
A valid and reliable method was used to determine the outcome.
Number of patients Population: 3,377
Patient characteristics Included= 3,377
Receiving isoniazid chemoprophylaxis for latent tuberculosis
Aged ≥25 years

Appendix D: Evidence tables – RQ HH & II - Diagnosis of active TB
25
Bibliographic reference
Fountain, Francis F., Elizabeth Tolley, Cary R. Chrisman, and Timothy H. Self. "Isoniazid Hepatotoxicity Associated With Treatment of Latent Tuberculosis InfectionA 7-Year Evaluation From a Public Health Tuberculosis Clinic." CHEST Journal 128, no. 1 (2005): 116-123.
Excluded
Pregnancy
3 months postpartum
Baseline AST¹ level more than 3 times the upper limit of normal
History of isoniazid allergy
Baseline characteristics
Characteristics Number of participants %
Year of treatment initiation
1996
1997
1998
1999
2000
2001
2002
2003
16
276
439
484
456
553
622
531
0.47
8.17
13.00
14.33
13.50
16.38
18.42
15.72
Age, yr
25-34
1533
1409
45.40
41.72

Appendix D: Evidence tables – RQ HH & II - Diagnosis of active TB
26
Bibliographic reference
Fountain, Francis F., Elizabeth Tolley, Cary R. Chrisman, and Timothy H. Self. "Isoniazid Hepatotoxicity Associated With Treatment of Latent Tuberculosis InfectionA 7-Year Evaluation From a Public Health Tuberculosis Clinic." CHEST Journal 128, no. 1 (2005): 116-123.
35-49
≥50
435 12.88
Gender
M
F
2075
1302
61.45
38.55
Race
African American
White
Hispanic
Asian
Unknown
2443
403
285
229
17
72.34
11.93
8.44
6.78
0.50
Alcohol Consumption
None
1-7
8-14
15+
2474
665
117
121
73.26
19.69
3.46
3.58
History of liver disease
None
Hepatitis A, B, or C
3220
109
2
95.35
3.23
0.06

Appendix D: Evidence tables – RQ HH & II - Diagnosis of active TB
27
Bibliographic reference
Fountain, Francis F., Elizabeth Tolley, Cary R. Chrisman, and Timothy H. Self. "Isoniazid Hepatotoxicity Associated With Treatment of Latent Tuberculosis InfectionA 7-Year Evaluation From a Public Health Tuberculosis Clinic." CHEST Journal 128, no. 1 (2005): 116-123.
Cirrhosis
Other
49 1.45
Intervention From 1996 to mid-1999
6 months of Isoniazid
For patients ≥60 kg bodyweight: 300 mg, once a day.
For patients <60 kg bodyweight: 5 mg/kg, once a day.
From late 1999-2003
6 months of Isoniazid
For patients ≥60 kg bodyweight: 300 mg, once a day.
For patients <60 kg bodyweight: 5 mg/kg, once a day.
Length of follow up No follow up beyond treatment period, or within the last 3 months of treatment.
Location USA
Outcomes measures and effect size
Risk of developing isoniazid associated hepatitis
Multivariate logistic regression analysis of risk factors associated with elevation of transaminases by greater than five times the upper limit of normal.
N= 2,182 (the number who completed at least one month of treatment)
Odds Ratio (95% confidence Interval) P value
Baseline AST¹ > upper limit of normal 5.398 (2.081-13.999) 0.0005
Age ≥ 50 years 3.699 (1.428-9.584) 0.008

Appendix D: Evidence tables – RQ HH & II - Diagnosis of active TB
28
Bibliographic reference
Fountain, Francis F., Elizabeth Tolley, Cary R. Chrisman, and Timothy H. Self. "Isoniazid Hepatotoxicity Associated With Treatment of Latent Tuberculosis InfectionA 7-Year Evaluation From a Public Health Tuberculosis Clinic." CHEST Journal 128, no. 1 (2005): 116-123.
Unclear if multivariate model included number compliant to treatment or year of treatment initiation. Results were adjusted for age, gender, race, alcohol consumption, history of liver disease and baseline transaminases.
Source of funding Unclear who provided funding for this project
Paper from College of Pharmacy, University of Tennessee
Comments SUMMARY: Isoniazid hepatotoxicity is age related. Results suggest hepatotoxicity is also related to baseline AST¹ greater than the upper limit of normal. Moderate-to-severe hepatotoxicity frequently occurs without symptoms, suggesting the value of more widespread AST¹ monitoring.
Abbreviations:
AST- aspartate aminotransferase
A.1.6 LoBue, Philip A., and Kathleen S. Moser (2003)
Bibliographic reference LoBue, Philip A., and Kathleen S. Moser. "Use of isoniazid for latent tuberculosis infection in a public health clinic." American Journal of Respiratory and Critical Care Medicine 168, no. 4 (2003): 443-447.
Study type Retrospective Cohort
Study outline Population matches the population of interest
Question is relevant; discussing the risk factors for development of isoniazid associated hepatotoxicity and adverse effects.
Patients did not receive the same level of care as rules regarding monitoring were altered during the study due to changes in American Thoracic Society Guidelines. Initially all patients over 35 were monitored with monthly transaminase levels as well as those at higher risk of hepatotoxicity; later this was changed to only those at higher risk. Participants were treated from the same site.
Follow up: follow up did not appear to continue beyond treatment period (6-9 months of isoniazid therapy). This may not

Appendix D: Evidence tables – RQ HH & II - Diagnosis of active TB
29
Bibliographic reference LoBue, Philip A., and Kathleen S. Moser. "Use of isoniazid for latent tuberculosis infection in a public health clinic." American Journal of Respiratory and Critical Care Medicine 168, no. 4 (2003): 443-447.
have been appropriate.
Treatment completion was poor with only 64% of patients completing 6 months of therapy. Attempts to find the systematic differences between those who did or did not complete treatment have been made. Those who completed treatment were more likely to be Hispanic. Those who did not complete treatment were associated homelessness and substance abuse.
Multivariate analysis was used. Unclear if multivariate analysis adjusted for varying compliance.
Definition of outcome was clear. A valid and reliable method was not necessarily used in all patients since those who were not deemed high risk were monitored using a symptoms checklist which would not catch subclinical presentations of hepatotoxicity.
Unclear how cases of latent tuberculosis was diagnosed
The paper does not provide the exact doses and lengths of regimens used
Number of patients Population: 3,788
Patient characteristics Included= 3,788
Included if treated with isoniazid for latent tuberculosis
Baseline characteristics
Characteristics Number of participants %
Gender
M
F
unknown
1552
2229
7
41
58
0.2
Age
0-14
1277
1939
34
51

Appendix D: Evidence tables – RQ HH & II - Diagnosis of active TB
30
Bibliographic reference LoBue, Philip A., and Kathleen S. Moser. "Use of isoniazid for latent tuberculosis infection in a public health clinic." American Journal of Respiratory and Critical Care Medicine 168, no. 4 (2003): 443-447.
15-34
35-49
50-64
65+
426
95
50
11
2.5
1.3
Race/ethnicity
White, Hispanic
White, non-hispanic
Black, non-hispanic
Asian-pacific Islander
Native American
Other
Unknown
3025
170
117
335
4
13
124
80
4.4
3.1
9
0.1
0.3
3.3
Country of birth
United States
Mexico
Phillippines
Vietnam
Other
Unknown
782
2101
178
62
258
407
21
56
4.7
1.6
7
11

Appendix D: Evidence tables – RQ HH & II - Diagnosis of active TB
31
Bibliographic reference LoBue, Philip A., and Kathleen S. Moser. "Use of isoniazid for latent tuberculosis infection in a public health clinic." American Journal of Respiratory and Critical Care Medicine 168, no. 4 (2003): 443-447.
Intervention Treatment followed American Thoracic Society treatment guidelines, specifics beyond this were unclear:
ATS¹ recommends 9 months of isoniazid daily, or 6 months of therapy if deemed more cost-effective. Which was used is unclear.
Length of follow up No follow up beyond treatment period apparent
Location USA
Outcomes measures and effect size
Risk of developing isoniazid associated adverse events
Occurrence of at least one adverse effect that had been reported as attributable to isoniazid, occurred following isoniazid treatment and for which no alternative cause was found.
Multivariate analysis of factors associated with occurrence of at least one adverse effect.
Factor N with at least one adverse effect
Odds Ratio (95% Confidence Interval)
P Value
Gender
M
F
217
453
Reference
1.6 (1.4-2.0)
<0.01
Age
0-14
15-34
35-49
50-64
65+
177
360
102
25
8
Reference
1.3 (1.0-1.6)
1.8 (1.3-2.5)
2.2 (1.3-3.8)
1.5 (0.6-3.2)
0.04
<0.01
<0.01
0.38
Race/ethnicity 530 1.3 (0.9-1.8) 0.19

Appendix D: Evidence tables – RQ HH & II - Diagnosis of active TB
32
Bibliographic reference LoBue, Philip A., and Kathleen S. Moser. "Use of isoniazid for latent tuberculosis infection in a public health clinic." American Journal of Respiratory and Critical Care Medicine 168, no. 4 (2003): 443-447.
White, Hispanic
White, non-hispanic
Black, non-hispanic
Asian-pacific Islander
42
23
57
1.6 (0.9-2.6)
1.2 (0.7-2.2)
Reference
0.07
0.49
Country of birth
United States
Other
138
486
Reference
1.1 (0.8-1.4)
0.58
Excess alcohol
N
Y
670
2
Reference
0.6 (0.1-2.8)
0.52
Intravenous drug use
N
Y
670
2
Reference
1.3 (0.3-7.3)
0.73
Homeless
N
Y
654
18
Reference
2.2 (1.2-4.2)
0.02
Correctional Facility
N
Y
645
27
Reference
2.6 (1.5-4.5)
<0.01

Appendix D: Evidence tables – RQ HH & II - Diagnosis of active TB
33
Bibliographic reference LoBue, Philip A., and Kathleen S. Moser. "Use of isoniazid for latent tuberculosis infection in a public health clinic." American Journal of Respiratory and Critical Care Medicine 168, no. 4 (2003): 443-447.
Unclear if multivariate model included number compliant to treatment or year of treatment initiation. Results were adjusted for those variables that were associated with the outcome significantly (p=<0.05)
Treatment Completion
Multivariate Analysis of Factors Associated with Completion (number completing 6 months of therapy)
Factor N completing Odds Ratio (95% Confidence Interval)
P Value
Gender
M
F
961
1450
Reference
1.2 (1.0-1.4)
0.03
Age
0-14
15-34
35-49
50-64
65+
943
1173
223
54
21
4.1 (2.2-7.8)
2.1 (1.1-3.9)
1.8 (0.9-3.4)
1.9 (0.9- 4.1)
Reference
<0.01
0.02
0.07
0.07
Race/ethnicity
Asian-Pacific Islander
White, non-hispanic
White, hispanic
202
90
1988
49
1.4 (0.9-2.3)
1.5 (0.9-2.5)
1.5 (1.0-2.3)
Reference
0.12
0.10
0.04

Appendix D: Evidence tables – RQ HH & II - Diagnosis of active TB
34
Bibliographic reference LoBue, Philip A., and Kathleen S. Moser. "Use of isoniazid for latent tuberculosis infection in a public health clinic." American Journal of Respiratory and Critical Care Medicine 168, no. 4 (2003): 443-447.
Black, non-hispanic
Country of birth
United States
Other
471
1679
Reference
1.4 (1.1-1.7)
<0.01
Excess alcohol
N
Y
2412
2
Reference
0.1 (0.0-0.6)
<0.01
Intravenous drug use
N
Y
2412
2
Reference
0.5 (0.1-2.9)
0.47
Homeless
N
Y
2403
3
Reference
0.2 (0.1-0.5)
<0.01
Correctional Facility
N
Y
2389
25
Reference
0.6 (0.4-1.1)
0.09
Hepatotoxicity
N
Y
2411
3
Reference
0.4 (0.1-1.8)
0.24

Appendix D: Evidence tables – RQ HH & II - Diagnosis of active TB
35
Bibliographic reference LoBue, Philip A., and Kathleen S. Moser. "Use of isoniazid for latent tuberculosis infection in a public health clinic." American Journal of Respiratory and Critical Care Medicine 168, no. 4 (2003): 443-447.
Any other Adverse Event
N
Y
2027
387
Reference
0.8 (0.7-0.9)
0.03
Source of funding Funding was provided by Centers for Disease Control and Prevention Tuberculosis Elimination Cooperative Agreement
Comments SUMMARY: A higher incidence of adverse effects was associated with increasing age, female sex, homelessness and having spent time in a correctional facility. The occurrence of hepatotoxicity was also associated with self-reported intravenous drug use. Higher completion rates were associated with female sex, younger age groups, white/Hispanic raceand non-USA country of birth. Lower completion rates were associated with self-reported excess alcohol use, homelessness and occurrence of at least one adverse event other than hepatotoxicity.
.

Appendix D: Evidence tables – RQ HH & II - Diagnosis of active TB
36
A.1.7 Fernández-Villar, A., Sopeña, B., et al (2003)
Bibliographic reference Fernández-Villar, A., Sopeña, B., Vázquez, R., Ulloa, F., Fluiters, E., Mosteiro, M., ... & Piñeiro, L. (2003). Isoniazid hepatotoxicity among drug users: the role of hepatitis C. Clinical infectious diseases, 36(3), 293-298.
Study type Retrospective Cohort
Study outline Population matches the population of interest
Question is relevant; discussing the risk factors for development of isoniazid associated hepatotoxicity.
Patients did not receive the same level of care as rules regarding monitoring adherence; some of the participants were enrolled in a methadone maintenance therapy programme where isoniazid was administered alongside. Others had their adherence monitored by means of pill count, urine samples and family supervision. Treatment duration ranged from 10-180 days, average duration of treatment was 154 days.
Follow up: follow up did not appear to continue beyond treatment period (6 months of isoniazid therapy at most). This may not have been appropriate.
Treatment completion was fairly low with 76.9% of patients completing 6 months of therapy. Attempts to find the systematic differences between those who did or did not complete treatment were not made.
Multivariate analysis was used. Unclear if multivariate analysis adjusted for varying compliance.
Definition of outcome was clear. A valid and reliable method was used.
Unclear how cases of latent tuberculosis were diagnosed.
Number of patients Population: 415
Patient characteristics Included= 415 drug users in Spain
Included:
treated with isoniazid for latent tuberculosis
Completed at least 7 days of therapy

Appendix D: Evidence tables – RQ HH & II - Diagnosis of active TB
37
Bibliographic reference Fernández-Villar, A., Sopeña, B., Vázquez, R., Ulloa, F., Fluiters, E., Mosteiro, M., ... & Piñeiro, L. (2003). Isoniazid hepatotoxicity among drug users: the role of hepatitis C. Clinical infectious diseases, 36(3), 293-298.
Exclusion:
HIV positivity
Evidence of active tuberculosis
History of isoniazid associated hepatotoxicity
Previous “correct” treatment of latent tuberculosis or active tuberculosis
Elevated aminotransferases greater 3 times the upper limit of normal.
Baseline characteristics
Average duration of treatment: 154.1 ± 51.4 days (range 10-180 days)
Male: 363 patients (87.5%)
Mean age 31.3 ± 5.5 years (range 17-49 years)
Included in a methadone programme: 313 (75.4%)
Included in a drug free programme: 74 (17.8%)
HCV antibodies detected: 214 (51.6%)
Hepatitis B surface antigen positive 8 (1.9%)
Intervention 6 months of isoniazid therapy
Isoniazid: 300 mg, daily
Length of follow up No follow up beyond treatment period apparent

Appendix D: Evidence tables – RQ HH & II - Diagnosis of active TB
38
Bibliographic reference Fernández-Villar, A., Sopeña, B., Vázquez, R., Ulloa, F., Fluiters, E., Mosteiro, M., ... & Piñeiro, L. (2003). Isoniazid hepatotoxicity among drug users: the role of hepatitis C. Clinical infectious diseases, 36(3), 293-298.
Location Spain
Outcomes measures and effect size
Risk of developing isoniazid associated hepatotoxicity
Symptoms of hepatitis with aminotransferase levels greater than 5 times upper limit of normal. Or aminotransferase levels greater than 5 times the upper limit of normal for two consecutive weeks. Or a unique elevation greater than 250 IU/L.
Univariate analysis of associated factors.
Factor N with hepatotoxicity Odds Ratio (95% Confidence Interval)
P Value
Gender
M
F
19/361
1/54
2.9 (0.3-22)
1
0.23
Age
>35
≤35
3/101
17/314
0.5 (0.1-1.8)
1
0.23
Excessive alcohol consumption
Yes
No
3/73
11/330
4 (1.6-10.2)
1
0.04
Body mass index
≤20
3/26
12/236
2.4 (0.6-9.2)
1
0.17

Appendix D: Evidence tables – RQ HH & II - Diagnosis of active TB
39
Bibliographic reference Fernández-Villar, A., Sopeña, B., Vázquez, R., Ulloa, F., Fluiters, E., Mosteiro, M., ... & Piñeiro, L. (2003). Isoniazid hepatotoxicity among drug users: the role of hepatitis C. Clinical infectious diseases, 36(3), 293-298.
>20
Receipt of methadone
Yes
No
17/313
3/102
1.8 (0.5-6.6)
1
0.22
Anti-HCV antibodies
Yes
No
16/214
4/201
3.9 (1.3-12.1)
1
0.09
Hepatitis B
Yes
No
0/8
20/406
0.98 (0.96-0.99)
1
0.6
Baseline ALT
Abnormal
Normal
12/133
7/275
4.2 (1.6-10.9)
1
<0.01
Multivariate analysis
Unclear if multivariate model included number compliant to treatment figures. Results were adjusted for those variables that were associated with the outcome significantly (p=<0.05)
Independent risk factors for the development of hepatotoxicity.
N with hepatotoxicity Odds Ratio (95% Confidence Interval)
P Value
Excessive alcohol consumption
3/73
11/330
4.2 (1.6-10.8) 0.002

Appendix D: Evidence tables – RQ HH & II - Diagnosis of active TB
40
Bibliographic reference Fernández-Villar, A., Sopeña, B., Vázquez, R., Ulloa, F., Fluiters, E., Mosteiro, M., ... & Piñeiro, L. (2003). Isoniazid hepatotoxicity among drug users: the role of hepatitis C. Clinical infectious diseases, 36(3), 293-298.
Yes
No
Baseline ALT
Abnormal
Normal
12/133
7/275
4.3 (1.6-11.4)
1
0.002
Source of funding Funding was provided by Secretaria Xeral de Investigacion e Desenvolvemento da Xunta de Galicia, Spain
Comments SUMMARY: The only 2 factors independently associated with the development of isoniazid hepatotoxicity were excessive alcohol consumption and a high baseline alanine transferase level. Treatment with isoniazid in drug users appears to be safe and well tolerated, although frequent asymptomatic elevations in transaminase levels were observed.

Appendix D: Evidence tables – RQ HH & II - Diagnosis of active TB
41
A.1.8 Nolan, C. M., Goldberg, S. V (1999)
Bibliographic reference Nolan, C. M., Goldberg, S. V., & Buskin, S. E. (1999). Hepatotoxicity associated with isoniazid preventive therapy: a 7-year survey from a public health tuberculosis clinic. JAMA 281(11), 1014-1018.
Study type Cohort
Study outline Unclear if population matches the population of interest. No general baseline characteristics were given making any population comparisons difficult. All patients receiving isoniazid preventive therapy were included, unclear if this includes high risk non-infected patients. Exclusion criteria not listed.
Question is relevant; discussing the risk factors for development of isoniazid associated hepatotoxicity.
Patients likely received the same standard of care at the same public health clinic. A comparison group received multidrug therapy for active tuberculosis, although this was mostly to compare incidence rates.
Follow up: follow up did not appear to continue beyond treatment period. This may not have been appropriate.
Treatment completion was fairly low with 64% of patients completing 6 months of therapy. Attempts to find the systematic differences between those who did or did not complete treatment were not made. 84% of patients on the multidrug therapy arm completed therapy.
Dose and length of treatment was unclear and may vary.
Multivariate analysis was used. Unclear if multivariate analysis adjusted for varying compliance.
Definition of outcome was clear. However the method of diagnosis was based on the assumption that all hepatotoxic patients would be symptomatic. Non-symptomatic hepatotoxicity would have been missed.
Unclear how cases of latent tuberculosis were diagnosed.
The population is only compared for sex, age and race. This could be insufficient to cover all major confounding factors.
Number of patients Population: 11,141
Patient characteristics Included= 11,141
Included:

Appendix D: Evidence tables – RQ HH & II - Diagnosis of active TB
42
Bibliographic reference Nolan, C. M., Goldberg, S. V., & Buskin, S. E. (1999). Hepatotoxicity associated with isoniazid preventive therapy: a 7-year survey from a public health tuberculosis clinic. JAMA 281(11), 1014-1018.
treated with isoniazid for latent preventive therapy
Baseline characteristics
Not listed
Intervention Isoniazid preventative therapy, unclear duration and dose.
Length of follow up No follow up beyond treatment period apparent
Location USA
Outcomes measures and effect size
Risk of developing isoniazid associated hepatotoxicity
Symptoms of hepatitis with aminotransferase levels greater than 5 times upper limit of normal. Symptoms and signs must resolve after the withdrawal of isoniazid therapy and a decision not to restart the therapy made.
Case rates and multivariate analysis:
Cases of Hepatotoxicity
Rate of hepatotoxicity (cases per 1000 persons starting therapy)
P value Adjusted Odds Ratio (95% confidence interval)
Total Cohort 11 1.0 … …
Sex
M (n=6066)
F (n=5075)
3
8
0.5
1.6
0.07 1.0 (reference)
3.30 (0.87-12.45)
Age
0-14 (n=1468)
15-34 (n=7449)
0
6
4
…
0.8
2.1
0.02 …
(reference)
3.17 (0.94-10.70)

Appendix D: Evidence tables – RQ HH & II - Diagnosis of active TB
43
Bibliographic reference Nolan, C. M., Goldberg, S. V., & Buskin, S. E. (1999). Hepatotoxicity associated with isoniazid preventive therapy: a 7-year survey from a public health tuberculosis clinic. JAMA 281(11), 1014-1018.
35-64 (n=1865)
≥65 (n=359)
1 2.8 3.62 (0.43-30.42)
Race
White (n=1856)
Non-white (n=9285)
Asian (n=5968)
Black (n=1732)
Hispanic (n=1050)
Other (n=535)
4
7
5
2
0
0
2.2
0.8
0.8
1.2
…
…
0.08
…
…
…
…
…
2.60 (0.75-8.95)
1.0 (reference)
…
…
…
…
Source of funding Unclear source of funding
Comments SUMMARY: The rate of hepatotoxicity in persons receiving preventive therapy increased with increasing age and there were trends towards increased rates in women and in those of white race. The rate of isoniazid hepatotoxicity during clinically monitored preventive therapy was lower than has been reported previously. Clinicians should have greater confidence in the safety of isoniazid preventive therapy.

Appendix D: Evidence tables – RQ HH & II - Diagnosis of active TB
44
A.1.9 Dickinson, D. S., Bailey, W. C.,
Bibliographic reference Dickinson, D. S., Bailey, W. C., Hirschowitz, B. I., Soong, S. J., Eidus, L., & Hodgkin, M. M. (1981). Risk factors for isoniazid (INH)-induced liver dysfunction.Journal of clinical gastroenterology, 3(3), 271-279.
Study type Cohort
Study outline Population does not exactly match population of interest. Participants included 36 who were PPD¹ negative and therefore potentially not latently infected.
Question is relevant; discussing the risk factors for development of isoniazid associated hepatotoxicity.
Patients likely received the same standard of care as all were treated in the same health clinic. The patients who were persistently PPD¹ negative however received only 3 months of isoniazid whereas the other participants received a year.
Follow up: follow up did not appear to continue beyond treatment period (1 year of isoniazid therapy at most). This may not have been appropriate.
Treatment completion was low: 15 subjects dropped out before completing 8 weeks, 113 completed 2 months, 105 patients completed 3 months, 59 patients completed 5 months and 27 patients completed one year of therapy. Attempts to find the systematic differences between those who did or did not complete treatment were not made.
Prognostic factors for hepatotoxicity included pre-existing liver dysfunction, acetylation phenotype, significant alcohol intake, age, concomitant drug therapy, sex and race. Hepatitis serology was also examined but no results reported. Definition of significant alcohol intake unclear.
No baseline characteristics provided
Multivariate analysis was used. Unclear if multivariate analysis adjusted for varying compliance or length of treatment.
Definition of outcome was clear. A valid and reliable method was used however the definition differs from many used in other studies.
Unclear how cases of latent tuberculosis were diagnosed.
Number of patients Population: 113

Appendix D: Evidence tables – RQ HH & II - Diagnosis of active TB
45
Bibliographic reference Dickinson, D. S., Bailey, W. C., Hirschowitz, B. I., Soong, S. J., Eidus, L., & Hodgkin, M. M. (1981). Risk factors for isoniazid (INH)-induced liver dysfunction.Journal of clinical gastroenterology, 3(3), 271-279.
Patient characteristics Included= 113
Included:
Candidates for isoniazid therapy according to Center for Disease Control, U.S. Public Health Service recommendations
Baseline characteristics:
Not provided
Intervention 1 year of isoniazid therapy
Isoniazid: 300 mg, daily
Or 5 mg/kilogram bodyweight for children
Or
3 months of Isoniazid therapy for persistent PPD¹ negative patients
Isoniazid: 300 mg, daily
Or 5 mg/kilogram bodyweight for children
Length of follow up No follow up beyond treatment period apparent
Location USA
Outcomes measures and effect size
Risk of developing isoniazid associated hepatotoxicity
Symptoms of hepatitis with aspartate aminotransferase levels greater than 4 times mean baseline value on at least one occasion. Or significantly elevated more than 2 standard deviations above mean pretreatment control for this population.
Multivariate analysis
Unclear if multivariate model included number compliant to treatment figures. Results were adjusted for those variables

Appendix D: Evidence tables – RQ HH & II - Diagnosis of active TB
46
Bibliographic reference Dickinson, D. S., Bailey, W. C., Hirschowitz, B. I., Soong, S. J., Eidus, L., & Hodgkin, M. M. (1981). Risk factors for isoniazid (INH)-induced liver dysfunction.Journal of clinical gastroenterology, 3(3), 271-279.
that were associated with the outcome significantly (p=<0.05)
No. Patients with Normal Baseline Lab
No. Developed Significant Liver Dysfunction
P value
Total No. of patients 101 19
Acetylation phenotype
Rapid
Slow
47
53
6
13
Not significant
Age, y
<35
≥35
54
47
6
13
0.034
Sex
F
M
65
36
11
8
Not significant
Race
Black
White
Oriental
68
31
2
11
8
0
Not significant
Source of funding Funding was provided by University of Alabama Division of Gastroenterology and the Jefferson County Department of public health

Appendix D: Evidence tables – RQ HH & II - Diagnosis of active TB
47
Bibliographic reference Dickinson, D. S., Bailey, W. C., Hirschowitz, B. I., Soong, S. J., Eidus, L., & Hodgkin, M. M. (1981). Risk factors for isoniazid (INH)-induced liver dysfunction.Journal of clinical gastroenterology, 3(3), 271-279.
Comments SUMMARY: Only age was found to be significantly correlated with liver dysfunction (p=0.034) after adjustment for all other factors.
Abbreviations:
¹PPD purified protein derivative

Appendix D: Evidence tables – RQ HH & II - Diagnosis of active TB
48
A.1.10 Lee, A. M., Mennone, J. Z et al (2002)
Bibliographic reference
Lee A M, Mennone, J Z., Jones, R. C., & Paul, W. S. (2002). Risk factors for hepatotoxicity associated with rifampin and pyrazinamide for the treatment of latent tuberculosis infection: experience from three public health tuberculosis clinics. The International Journal of Tuberculosis and Lung Disease, 6(11), 995-1000.
Study type Retrospective Cohort
Study outline Population matches population of interest.
Question is relevant; discussing the risk factors for development of rifampicin and pyrazinamide associated hepatotoxicity.
Patients did not receive the same standard of care as rifabutin was substituted for rifampicin in HIV positive patients on protease inhibitors or non-nucleoside reverse transcriptase inhibitors. Doses of rifampicin and pyrazinamide initially followed guidelines established for HIV infected patients and those with active tuberculosis but dose of pyrazinamide was subsequently limited based on an expert opinion published in the American Thoracic Society guidelines.
Follow up: follow up did not appear to continue beyond treatment period (2 months therapy maximum). This may not have been appropriate.
Treatment completion was low: 57.4% of participants. Patients with presumed recent TB infection were less likely than others to discontinue therapy for reasons other than development of hepatotoxicity Patients reporting illicit drug use were more likely to discontinue therapy than those who did not and patients of White or Asian ethnicity were more likely to discontinue therapy than Hispanics.
Prognostic factors for hepatotoxicity recorded included age, race, sex, weight, HIV status, reason for starting latent tuberculosis treatment, associated medical conditions, other medications, alcohol use, rifampicin dose, pyrazinamide dose, baseline AST¹ and ALT², peak AST¹, peak ALT², peak alkaline phosphate, peak bilirubin, onset of side effects or hepatotoxicity, presence or absence of symptoms associated with hepatotoxicity, outcome and hospitalization.
Multivariate analysis was used. Unclear if multivariate analysis adjusted for all of the above factors.
Definition of outcome was clear.
Unclear how cases of latent tuberculosis were diagnosed.

Appendix D: Evidence tables – RQ HH & II - Diagnosis of active TB
49
Bibliographic reference
Lee A M, Mennone, J Z., Jones, R. C., & Paul, W. S. (2002). Risk factors for hepatotoxicity associated with rifampin and pyrazinamide for the treatment of latent tuberculosis infection: experience from three public health tuberculosis clinics. The International Journal of Tuberculosis and Lung Disease, 6(11), 995-1000.
Number of patients Population: 148
Patient characteristics Included= 148
Included:
Normal chest radiograph
Indications for latent tuberculosis treatment under the ATS guidelines
Baseline characteristics:
Gender (m/f): 84/64
Age: median: 37 years. range: 18-84 years
Recent infection (recent TST³ conversion or contact with an infectious case): 53 %
Illicit drug use: 28 %
Recent immigration from TB-endemic country: 11 %
HIV infection: 6 %
Intervention 2 months of rifampicin and pyrazinamide
Pyrazinamide: 15-20 mg daily, for 2 months
Rifampicin: unclear dose, for 2 months
Length of follow up No follow up beyond treatment period apparent
Location USA
Outcomes measures and effect size
Risk of developing isoniazid associated hepatotoxicitySymptoms of hepatitis with aminotransferase levels greater than 5 times upper limit of normal (grade 3 or 4)

Appendix D: Evidence tables – RQ HH & II - Diagnosis of active TB
50
Bibliographic reference
Lee A M, Mennone, J Z., Jones, R. C., & Paul, W. S. (2002). Risk factors for hepatotoxicity associated with rifampin and pyrazinamide for the treatment of latent tuberculosis infection: experience from three public health tuberculosis clinics. The International Journal of Tuberculosis and Lung Disease, 6(11), 995-1000.
Multivariate analysis
Unclear if multivariate model included number compliant to treatment figures. Results were adjusted for those variables that were associated with the outcome significantly (p=<0.05)
n Hepatotoxicity case n Bivariate analysis. Risk ratio (95% confidence interval)
Multivariate analysis. Odds ratio (95% confidence interval)
Total patients 148 14
Gender
Female
Male
64
84
10
4
3.3 (1.1-10.0)
reference
4.1 (1.2-14.3)
reference
Race
Hispanic
Black
White or Asian
48
61
39
8
5
1
6.5 (0.9-49.8)
3.2 (0.4-26.3)
reference
Age, y
≥35
<35
90
58
8
6
0.9 (0.3-2.4)
reference
Alcohol use
Any
None
59
89
5
9
0.8 (0.3-2.4)
reference
1
13
0.2 (0.0-1.2)
reference

Appendix D: Evidence tables – RQ HH & II - Diagnosis of active TB
51
Bibliographic reference
Lee A M, Mennone, J Z., Jones, R. C., & Paul, W. S. (2002). Risk factors for hepatotoxicity associated with rifampin and pyrazinamide for the treatment of latent tuberculosis infection: experience from three public health tuberculosis clinics. The International Journal of Tuberculosis and Lung Disease, 6(11), 995-1000.
Illicit drug use
Any
None
48
100
1
13
0.2 (0.0-1.2)
reference
Pyrazinamide dose (mg/kg/day)
>20
≤20
78
70
6
8
0.7 (0.3-1.8)
reference
Presumed recent infection
Yes
No
79 (53.4)
69 (46.6)
13 (16.5)
1 (1.4)
11.4 (1.5- 84.6)
reference
14.4 (1.8-115.3)
reference
Source of funding Unclear source of funding
Comments SUMMARY: Hepatotoxicity occurred in a high proportion of patients prescribed pyrazinamide and was more common among females and those with recent infection. Caution is warranted in using rifampicin and pyrazinamide in populations where its safety has not been tested.
Abbreviations:
¹PPD purified protein derivative
²AST- aspartate aminotransferase
³ALT- alanine aminotransferase

Appendix D: Evidence tables – RQ HH & II - Diagnosis of active TB
52

Appendix D: Evidence tables – RQ HH & II - Diagnosis of active TB
53
A.1.11 Gilroy, S. A., Rogers, M. A.,
Bibliographic reference Gilroy, S. A., Rogers, M. A., & Blair, D. C. (2000). Treatment of latent tuberculosis infection in patients aged≥ 35 years. Clinical infectious diseases,31(3), 826-829.
Study type Retrospective Cohort
Study outline Population matches population of interest. High risk groups were identified for treatment.
Question is relevant; discussing the risk factors for not completing or adhering to therapy for latent tuberculosis.
Patients received the same standard of care at the same health department.
Follow up: follow up did not appear to continue beyond treatment period (6 months therapy maximum). This may not have been appropriate.
Treatment completion was low: 76% of participants. Reasons for completion failure were recorded and characteristics compared between the groups. Comparisons were also made between those that accepted treatment and those that were lost to follow up for isoniazid preventive therapy. Differences were found in the mean age, sex, ethnicity, alcohol usage and medications taken between these groups.
Prognostic factors for hepatotoxicity recorded included age, race sex, alcohol use, regular medication and baseline ALT levels
Multivariate analysis was used
Definition of risk factors was clear but unlikely to be valid or reliable since this was a retrospective study taken from patients charts. Alcohol use was defined as consuming >3 alcoholic beverages daily which is not a standardised measurement and susceptible to recall bias.
Definition of treatment completion was unclear. A valid and reliable method of measurement was not used as patients were assumed to be compliant if they kept monthly appointments at the clinic.
Number of patients Population: 335
Patient characteristics Included= 335

Appendix D: Evidence tables – RQ HH & II - Diagnosis of active TB
54
Bibliographic reference Gilroy, S. A., Rogers, M. A., & Blair, D. C. (2000). Treatment of latent tuberculosis infection in patients aged≥ 35 years. Clinical infectious diseases,31(3), 826-829.
Included:
Aged ≥35 years
Documented reaction to PPD¹ of >10 mm induration
Baseline characteristics:
If isoniazid was discontinued due to symptoms or isoniazid associated hepatotoxicity, patient was offered rifampicin therapy or chose to refuse treatment.
Completed isoniazid n=253
Completed isoniazid and rifampicin n=26
Did not complete therapy n=56
P value
Gender
Male
Female
140
113
12
14
31
25
0.665
Ethnicity
White
Black
Other
108
81
64
17
6
3
31
18
7
0.062
Alcohol
Male and used alcohol
Male and did not use
Female and used alcohol
Female and did not use
37
103
9
104
3
9
1
13
19
12
4
21
0.001
0.390

Appendix D: Evidence tables – RQ HH & II - Diagnosis of active TB
55
Bibliographic reference Gilroy, S. A., Rogers, M. A., & Blair, D. C. (2000). Treatment of latent tuberculosis infection in patients aged≥ 35 years. Clinical infectious diseases,31(3), 826-829.
Medication
Male no medications
Male 1 medication
Male ≥ 2 medications
Female no medications
Female 1 medication
Female ≥ 2 medications
85
25
29
56
32
25
7
3
2
3
5
6
19
10
2
4
5
12
0.205
0.005
ALT level
Normal
Abnormal
223
30
6
20
21
33
<0.001
Intervention 6 months of isoniazid
Isoniazid: 300 mg daily, for 6 months
Pyridoxine: 50 mg daily, for 6 months
Length of follow up No follow up beyond treatment period apparent
Location USA
Outcomes measures and effect size
Risk of non-completion of therapy.
Completion of 6 months of therapy
Univariate analysis
Completed isoniazid n=253
Completed isoniazid and rifampicin n=26
Did not complete therapy n=56
P value

Appendix D: Evidence tables – RQ HH & II - Diagnosis of active TB
56
Bibliographic reference Gilroy, S. A., Rogers, M. A., & Blair, D. C. (2000). Treatment of latent tuberculosis infection in patients aged≥ 35 years. Clinical infectious diseases,31(3), 826-829.
Gender
Male
Female
140
113
12
14
31
25
0.665
Ethnicity
White
Black
Other
108
81
64
17
6
3
31
18
7
0.062
Alcohol
Male and used alcohol
Male and did not use
Female and used alcohol
Female and did not use
37
103
9
104
3
9
1
13
19
12
4
21
0.001
0.390
Medication
Male no medications
Male 1 medication
Male ≥ 2 medications
Female no medications
Female 1 medication
Female ≥ 2 medications
85
25
29
56
32
25
7
3
2
3
5
6
19
10
2
4
5
12
0.205
0.005

Appendix D: Evidence tables – RQ HH & II - Diagnosis of active TB
57
Bibliographic reference Gilroy, S. A., Rogers, M. A., & Blair, D. C. (2000). Treatment of latent tuberculosis infection in patients aged≥ 35 years. Clinical infectious diseases,31(3), 826-829.
ALT level
Normal
Abnormal
223
30
6
20
21
33
<0.001
Multivariate analysis
Only ALT level at baseline was statistically significant for non-completion after adjustment for the other variables.
Source of funding Unclear source of funding
Comments SUMMARY: Only ALT level at baseline was statistically significant for non-completion after adjustment for the other variables.
Abbreviations:
¹PPD purified protein derivative

Appendix D: Evidence tables – RQ HH & II - Diagnosis of active TB
58
A.1.12 Oni, T., Tsekela, R.,(2012)
Bibliographic reference
Oni, T., Tsekela, R., Kwaza, B., Manjezi, L., Bangani, N., Wilkinson, K. A., ... & Wilkinson, R. J. (2012). A Recent HIV Diagnosis Is Associated with Non-Completion of Isoniazid Preventive Therapy in an HIV-Infected Cohort in Cape Town. PloS one, 7(12), e52489.
Study type Cohort
Study outline Population matches population of interest. Participants were taken from a HIV infected cohort.
Question is relevant; discussing the risk factors for not completing or adhering to therapy for latent tuberculosis.
Patients received the same standard of care at the same health department.
Follow up: follow up did not appear to continue beyond treatment period (9 months maximum)
Treatment completion was low: 69% of participants. Reasons for completion failure were not recorded. Comparisons were not made between those that accepted treatment and those who refused to be enrolled. No baseline characteristics were recorded other than those stated below.
Risk factors for completion of therapy included: age, gender, employment status, alcohol consumption, smoking status, past TB history, recent TB contact, type of accommodation lived in, CD4 count, marital status, history of TB, BCG scar, time in Khayelitsha and date of HIV diagnosis.
Multivariate analysis was used however the significant factor of smoking was not included in the multivariate analysis model as the alcohol variable provided a better fit of the model instead. It is unclear why all significant factors could not have been included.
Definition of risk factors was clear but unlikely to be valid or reliable since alcohol use and smoking was self-reported, as were other important factors.
Definition of treatment completion was clear. A valid and reliable method of measurement was not used as patients were assumed to be compliant if they kept monthly appointments at the clinic and self-reported adherence.
Number of patients Population: 164
Patient characteristics Included= 164

Appendix D: Evidence tables – RQ HH & II - Diagnosis of active TB
59
Bibliographic reference
Oni, T., Tsekela, R., Kwaza, B., Manjezi, L., Bangani, N., Wilkinson, K. A., ... & Wilkinson, R. J. (2012). A Recent HIV Diagnosis Is Associated with Non-Completion of Isoniazid Preventive Therapy in an HIV-Infected Cohort in Cape Town. PloS one, 7(12), e52489.
Included:
Asymptomatic
TST¹ ≥5 mm induration
Enrolled from HIV Wellness Clinic, patients not suitable for antiretroviral therapy.
Baseline characteristics:
If isoniazid was discontinued due to symptoms or isoniazid associated hepatotoxicity, patient was offered rifampicin therapy or chose to refuse treatment.
Completed isoniazid n=113
Did not complete therapy n=51
Univariable analysis OR (95% CI)
Gender (female) 96 39 2.34 (0.97-5.64)
Marital Status (married) 33 10 0.93 (0.40-2.14)
Smoker (yes) 11 11 3.59 (1.41-9.18)
Alcohol (yes) 16 19 4.66 (2.03-10.69)
TB contact (no, yes, don’t know)
78, 30, 5 41, 10, 0 0.54 (0.23-1.26)
Previous TB (yes) 15 6 0.94 (0.32-2.79)
BCG scar (yes) 62 23 0.92 (0.44-1.94)
Self-reported BCG (no, yes, don’t know)
19, 80, 14 11, 33, 7 1.13 (0.58-2.22)
Employed (yes) 41 17 0.85 (0.39-1.84)

Appendix D: Evidence tables – RQ HH & II - Diagnosis of active TB
60
Bibliographic reference
Oni, T., Tsekela, R., Kwaza, B., Manjezi, L., Bangani, N., Wilkinson, K. A., ... & Wilkinson, R. J. (2012). A Recent HIV Diagnosis Is Associated with Non-Completion of Isoniazid Preventive Therapy in an HIV-Infected Cohort in Cape Town. PloS one, 7(12), e52489.
Accommodation (shack, house)
66, 47 21, 21 1.46 (0.69-3.06)
Time in Khayelitsha (<1 year, ≥ 1 year)
6, 107 5, 37 0.39 (0.11-1.36)
Age (years median) 32.7 29.8 0.99 (0.94-1.04)
BMI, median 27.2 24.2 0.96 (0.90-1.02)
Education (highest grade achieved median)
11 11 1.07 (0.90-1.29)
Persons/bedroom, median
2.33 2 0.91 (0.68-1.20)
CD4 count, median 360 363 1.00 (1.00-1.00)
Years since HIV diagnosis, median
1.15 0.15 0.82 (0.67-0.99)
Intervention 6 months of isoniazid
Dose unclear (followed South African national guidelines)
Length of follow up No follow up beyond treatment period apparent
Location South Africa
Outcomes measures and effect size
Risk of non-completion of therapy.
Completion of 6 months of therapy
Univariate analysis

Appendix D: Evidence tables – RQ HH & II - Diagnosis of active TB
61
Bibliographic reference
Oni, T., Tsekela, R., Kwaza, B., Manjezi, L., Bangani, N., Wilkinson, K. A., ... & Wilkinson, R. J. (2012). A Recent HIV Diagnosis Is Associated with Non-Completion of Isoniazid Preventive Therapy in an HIV-Infected Cohort in Cape Town. PloS one, 7(12), e52489.
See baseline characteristics
Multivariate analysis
The final logistic regression model included alcohol and time since HIV diagnosis variables only.
Time since HIV diagnosis: There was a 19% decrease in odds of non-completion with every year after HIV-diagnosis (OR 0.81; 95% CI² 0.68-0.98; p=0.03). Non-completers were most likely to default therapy if initiated within 6 months of HIV diagnosis when compared to those initiated after at least 6 months after diagnosis of HIV.
Alcohol drinkers: There was a four-fold increase in in odds of non-completion in drinkers compared to non-drinkers (OR 4.05; 95% CI² 1.89-9.06; p=0.001)
There is univariate association between alcohol and smoking (p<0.001) and so the authors argue that both should be considered in the interpretation of these results. However smoking was not included in the multivariate model.
Source of funding Funding by the Wellcome Trust, MRC and the European Union.
Comments SUMMARY: Patients with a recent HIV diagnosis, in addition to self reported drinkers and smokers were higher risk of non-completion of isoniazid preventive therapy. The period of time since HIV diagnosis should therefore be taken into account when initiating therapy. Results suggest that smokers and alcohol drinkers should also be identified and targeted for adherence interventions.
Abbreviations:
¹TST- tuberculin skin test
²CI- confidence interval

Appendix D: Evidence tables – RQ HH & II - Diagnosis of active TB
62
A.1.13 Goswami, N. D., Gadkowski, L. B (2012)
Bibliographic reference
Goswami, N. D., Gadkowski, L. B., Piedrahita, C., Bissette, D., Ahearn, M. A., Blain, M. L., ... & Stout, J. E. (2012). Predictors of latent tuberculosis treatment initiation and completion at a US public health clinic: a prospective cohort study. BMC public health, 12(1), 468.
Study type Cohort
Study outline Population matches population of interest.
Question is relevant; discussing the risk factors for initiating or completing therapy for latent tuberculosis.
Patients received the same standard of care at the same health department.
Follow up: follow up did not appear to continue beyond treatment period (12 months maximum)
Treatment initiation was low: 26% of participants. Treatment completion amongst those that initiated was also low: 53% of participants. Reasons for completion failure were recorded. Comparisons were made between those that accepted treatment and those who refused to be enrolled as well as completers and non-completers. Baseline characteristics were recorded.
Risk factors for initiation/completion of therapy included: Length of time at current residence, planned future time at current residence, education level, co-habitance with any family members, pervious daily pill for at least 6 months, regular primary care, easy access to health departments, plan to tell family/friends about positive skin test, belief in getting sick from TB without medicine, fear of adverse effects from medicine, belief in medicine efficacy, belief in cure for TB, fear of phlebotomy, race ethnicity, gender, age, born in the United States, region of birth, reason for skin testing, mean distance from health department, neighbourhood poverty level, alcohol use, smoking, crack cocaine use, diabetes, ESRD, Gastrectomy, heroin use, homelessness, IV drug use, immunosuppressed, prior incarceration, long term care facility, evidence of old TB on radiography, history of organ or bone marrow transplantation, underweight, HIV.
Multivariate analysis was used.
Definition of risk factors was clear but unlikely to be valid or reliable since all risk factors were self-reported at baseline.
Definition of treatment completion was clear. A valid and reliable method of measurement was not used as patients were assumed to be compliant if they picked up the required amount of medication.

Appendix D: Evidence tables – RQ HH & II - Diagnosis of active TB
63
Bibliographic reference
Goswami, N. D., Gadkowski, L. B., Piedrahita, C., Bissette, D., Ahearn, M. A., Blain, M. L., ... & Stout, J. E. (2012). Predictors of latent tuberculosis treatment initiation and completion at a US public health clinic: a prospective cohort study. BMC public health, 12(1), 468.
Unclear if the type of preventive therapy used was included in multivariate analysis. Some patients were taking 4 months of rifampicin, some were taking 9 months of isoniazid. Completion rate of isoniazid participants was 52%, completion rate in those treated with rifampicin was 61% (p=0.3). At least six months of isoniazid was completed by 63% of participants.
Number of patients Population: 496
Patient characteristics Included= 496 completed questionnaires, 26% of which initiated therapy.
Included:
Age: >17 years
Meet CDC¹ guidelines for latent tuberculosis infection therapy
Baseline characteristics:
Of the 496 participants: 65% were predominantly foreign born, 87% were racial/ethnic minorities, mean age was 39.1± 12.3 years. Of those who were foreign born, 19% were from Africa and 20% from Latin America. 26% of participants initiated latent tuberculosis therapy, 70 % of these completed therapy. 61% of persons included in the study were referred after a tuberculin skin test (TST) was performed as part of employment screening and 19% received a TST as part of a contact investigation. 32% were former or current smokers, 9 % were drug users, 14% had a history of incarceration and 11% had a history of homelessness.
Intervention 9 months of isoniazid
Dose unclear (followed CDC¹ guidelines)
CDC guidance states a minimum of 270 mg of isoniazid daily for 9 months.
OR
4 months of rifampicin
Dose unclear (followed CDC¹ guidelines)

Appendix D: Evidence tables – RQ HH & II - Diagnosis of active TB
64
Bibliographic reference
Goswami, N. D., Gadkowski, L. B., Piedrahita, C., Bissette, D., Ahearn, M. A., Blain, M. L., ... & Stout, J. E. (2012). Predictors of latent tuberculosis treatment initiation and completion at a US public health clinic: a prospective cohort study. BMC public health, 12(1), 468.
CDC guidance states a minimum of 120 mg of rifampicin daily for 4 months.
Length of follow up No follow up beyond treatment period apparent
Location USA
Outcomes measures and effect size
Risk of non-completion of therapy, risk of non-initiation of therapy.
Completion of 9 months of therapy of isoniazid, completion of 4 months of therapy of rifampicin.
Multivariate analysis
Backward elimination was used to arrive at a final log binomial model consisting of independent variables significantly associated with completion of latent tuberculosis therapy at p<0.10 by univariate analysis as well as any significant confounders.
Outcome Factor Relative Risk 95% Confidence Intervals
Treatment initiation Close contact to a TB case 2.5 1.8-3.6
Non-employment reason for screening
1.6 1.0-2.5
Lower educational level 1.3 1.1-1.6
Having a regular physician 1.4 1.0-2.0
Fear of getting sick with TB without medicine
1.7 1.2-2.6
Prior incarceration 1.7 1.1-2.8
Treatment completion Plan to tell friends or family about latent tuberculosis diagnosis.
2.0 1.0-3.9

Appendix D: Evidence tables – RQ HH & II - Diagnosis of active TB
65
Bibliographic reference
Goswami, N. D., Gadkowski, L. B., Piedrahita, C., Bissette, D., Ahearn, M. A., Blain, M. L., ... & Stout, J. E. (2012). Predictors of latent tuberculosis treatment initiation and completion at a US public health clinic: a prospective cohort study. BMC public health, 12(1), 468.
Source of funding Unclear source of funding. Authors deny competing interests.
Comments SUMMARY: Investment in social support and access to regular primary care may lead to increased latent tuberculosis therapy adherence in high-risk populations. After multivariate analysis factors independently associated with initiation of therapy included close contact with a TB case, non-employment reason for screening, lower educational level, having a regular physician, fear of getting sick with tuberculosis, and prior incarceration. After multivariate analysis factors independently associated with completion of therapy included planning to tell friends and family about their latent tuberculosis infection.
Abbreviations:
¹CDC- Centre for Communicable Disease Control

Appendix D: Evidence tables – RQ HH & II - Diagnosis of active TB
66
A.1.14 Smith, B. M., Schwartzman, K., (2011)
Bibliographic reference Smith, B. M., Schwartzman, K., Bartlett, G., & Menzies, D. (2011). Adverse events associated with treatment of latent tuberculosis in the general population. Canadian Medical Association Journal, 183(3), E173-E179.
Study type Retrospective Cohort
Study outline Population may match population of interest. Participants were taken from an administrative healthcare database in Quebec. A historical cohort of all resident’s therapy for latent tuberculosis between 1998 and 2003 was created. They took patients receiving the treatment for latent for tuberculosis as having had latent tuberculosis when this may not have been the case. This is an indirect definition of latent tuberculosis.
Question is relevant; discussing the risk factors for hospitalisation for latent tuberculosis therapy-associated adverse events.
Patients received three different kinds of care: isoniazid therapy, rifampicin therapy and no treatment. These were matched for different variables at baseline.
Treatment completion was low: 54.1% of participants in the isoniazid group and 56.2% of participants in the rifampicin group. Rates of completion were similar between both groups. Comparisons were not made between those that accepted treatment and those who refused to be enrolled.
Risk factors for hospitalization: a cohort received latent tuberculosis treatment split by rifampicin and isoniazid, this was further stratified by age, previous hospital admission and comorbidities.
Multivariate analysis was used: Conditional logistic regression was used for comparisons between patients with latent tuberculosis and matched untreated cohorts. Variables included in the analysis were previous hospital admission, Charlson comorbidity score and cancer, diabetes, HIV infection, liver, renal and vascular disease.
Definition of risk factors was clear but unlikely to be reliable since this was a retrospective study and data was retrieved from administrative health data.
Definition of an adverse event outcome was clear but also reliant upon retrospective data. The study looked for five conditions possibility attributable to the treatment of latent tuberculosis however these could have causes other than the latent tuberculosis therapy. If the person was admitted to hospital for identical adverse events 6 months prior to treatment for latent tuberculosis, the event was not attributed to latent tuberculosis therapy. This system is clearly open to error however therefore the method is not reliable.

Appendix D: Evidence tables – RQ HH & II - Diagnosis of active TB
67
Bibliographic reference Smith, B. M., Schwartzman, K., Bartlett, G., & Menzies, D. (2011). Adverse events associated with treatment of latent tuberculosis in the general population. Canadian Medical Association Journal, 183(3), E173-E179.
Unclear if participants received the same level of care apart from intervention studied, data was taken from the same provincial area but practice may vary between clinics.
Attempts were made at baseline to balance the comparison groups for potential confounding factors by matching patients with controls and by multivariate statistical analysis.
Neither participants nor clinicians were blinded to intervention allocation.
Follow up: All groups were for a similar amount of time: from 6 months before to 12 months after initiation of therapy.
Number of patients Population: 9145
Patient characteristics Included= 9145
Included:
Registered as beneficiaries of RAMQ health insurance (insurer for over 99% of permanent residents)
Dispensed at least 30 days of treatment for latent tuberculosis infection between January and December of 2003
Taking isoniazid alone, rifampicin alone or sequential use of isoniazid and rifampicin
Excluded:
Patients dispensed rifampicin with an alternate indication
Those dosed rifampicin and pyrazinamide simultaneously
Baseline characteristics:
Characteristics Total receiving treatment n= 9,145 (%)
Isoniazid n= 8,686 (%)
Rifampicin n=459 (%) Untreated cohort n=18,290 (%)
Age, y
≤ 35
4523 (49.5)
2533 (27.7)
4356 (50.1)
2408 (27.7)
167 (36.4)
125 (27.2)
9046 (49.5)
5066 (27.7)

Appendix D: Evidence tables – RQ HH & II - Diagnosis of active TB
68
Bibliographic reference Smith, B. M., Schwartzman, K., Bartlett, G., & Menzies, D. (2011). Adverse events associated with treatment of latent tuberculosis in the general population. Canadian Medical Association Journal, 183(3), E173-E179.
36-50
51-65
>65
1232 (13.5)
857 (9.4)
1,159 (13.3)
763 (8.9)
73 (15.9)
94 (20.5)
2464 (13.5)
1714 (9.4)
Sex, female 5000 (54.7) 4784 (55.1) 216 (47.1) 10000 (54.7)
Residence, urban 6216 (68.0) 5913 (68.1) 295 (64.3) 12 432 (68.0)
≥ 1 hospital admissions in the previous 6 months
946 (10.3) 866 (10.0) 80 (17.4) 730 (4.0)
Comorbid illness
Liver disease
Kidney disease
Diabetes
HIV infection or AIDS
Malignancy
Peptic ulcer disease
Chronic pulmonary disease
54 (0.6)
171 (1.9)
229 (2.5)
50 (0.6)
287 (3.1)
53 (0.6)
786 (8.6)
45 (0.5)
156 (1.8)
211 (2.4)
48 (0.6)
267 (3.1)
46 (0.5)
744 (8.7)
9 (2.0)
15 (3.3)
18 (3.9)
2 (0.4)
20 (4.4)
7 (1.5)
42 (9.2)
17 (0.1)
24 (0.1)
280 (1.5)
8 (0.0)
221 (1.2)
39 (0.2)
712 (3.9)
Intervention 6 months of isoniazid
Dose unclear, daily (presumed to follow national guidelines for Canada)
OR
4 months of rifampicin

Appendix D: Evidence tables – RQ HH & II - Diagnosis of active TB
69
Bibliographic reference Smith, B. M., Schwartzman, K., Bartlett, G., & Menzies, D. (2011). Adverse events associated with treatment of latent tuberculosis in the general population. Canadian Medical Association Journal, 183(3), E173-E179.
Dose unclear, daily (presumed to follow national guidelines for Canada)
Comparison Control Group
No treatment
Length of follow up Observation period from 6 months prior to treatment to 12 months following treatment initiation
Location Quebec, Canada
Outcomes measures and effect size
Results of multivariate analysis:
Independent variables associated with subsequent hepatic events following treatment for latent tuberculosis infection include:
Hospital admission
Any physician visits for liver disease
High Charlson comorbidity score during the 6 months before treatment initiation
Age stratified adjusted odds ratios of hepatic events requiring hospital admission that were followed by premature cessation of isoniazid therapy:
Age group, y Odds ratio adjusted for sex and prior liver disease (95% CI¹)
Odds ratio adjusted for sex and Charlson score (95% CI¹)
≤ 35 1.00 (reference) 1.00 (reference)
36-50 2.7 (0.5-16.0) 1.3 (0.2-10.0)
51-65 5.7 (1.0-33.7) 6.7 (1.2-39.2)

Appendix D: Evidence tables – RQ HH & II - Diagnosis of active TB
70
Bibliographic reference Smith, B. M., Schwartzman, K., Bartlett, G., & Menzies, D. (2011). Adverse events associated with treatment of latent tuberculosis in the general population. Canadian Medical Association Journal, 183(3), E173-E179.
>65 34.2 (7.6-153.8) 34.5 (7.0-170.2)
Source of funding Funding from the Canadian Institutes of Health Research and the Fonds de la recherché en santé du Quebec
Comments SUMMARY: The risk of hospital admission due to adverse events is substantially increased in people over age 65.These estimates could be useful for a re-analysis of the risks and benefits of therapy for latent tuberculosis infection in the elderly, which could influence recommendations for therapy in this group. In the absence of such an analysis, this data suggests that the risks of therapy for latent tuberculosis are considerable amongst the elderly and should be considered very carefully before therapy is given. Hospital admission, any physician visits for liver disease or a higher Charlson comorbidity score during the six months before treatment initiation were associated with subsequent hepatic events in multivariate analysis.
Abbreviations:
¹CI- confidence interval

Appendix D: Evidence tables – RQ HH & II - Diagnosis of active TB
71
A.1.15 Anibarro, L., Casas, S.,( 2010)
Bibliographic reference
Anibarro, L., Casas, S., Paz-Esquete, J., Gonzalez, L., Pena, A., Guerra, M. R., ... & Santin, M. (2010). Treatment completion in latent tuberculosis infection at specialist tuberculosis units in Spain. The International Journal of Tuberculosis and Lung Disease, 14(6), 701-707.
Study type Retrospective Cohort
Study outline Population matches population of interest. Participants were taken from a healthcare database in Spain. A historical cohort of treatment completion and adherence for latent tuberculosis treatment was recorded in two different tertiary care sites. HIV infected patients were not included.
Question is relevant; discussing the risk factors for non-completion of latent tuberculosis therapy.
Patients received various different kinds of care: isoniazid therapy between 5-6 months; rifampicin therapy for 4 months; isoniazid and rifampicin for 3 months; isoniazid, rifampicin and pyrazinamide with or without ethambutol for 2 months followed by 2 months of isoniazid and rifampicin. Shorter regimens were grouped together in multivariate analysis despite obvious differences in side effect profile and length.
Treatment completion was adequate: 79.2% of participants in the short regimens group and 81.0% of participants in the isoniazid group completed therapy satisfactorily. Rates of completion were similar between both groups. Comparisons were not made between those that accepted treatment and those who refused to be enrolled.
Risk factors for treatment completion analysed included: age; sex; hospital site; health care worker; contact with a tuberculosis case; immigrant; episode of treatment; treatment duration; adverse events in the first month and social risk factors including illegal drug abuse, alcohol abuse, unemployment, or residence in a correctional facility).
Multivariate analysis was used: logistic regression analysis was used to adjust for variables with a significance of p<0.10
Definition of risk factors was clear but unlikely to be reliable since this was a retrospective study and data was retrieved from administrative health data.
Definition of treatment completion outcome was clear but also reliant upon retrospective data. Due to differences in the methods of evaluating adherence on the different hospital sites treatment completion was chosen as an endpoint instead.
Participants did not receive the same level of care apart from intervention studied as different participants were taking different drugs in various combinations with different durations. Patients on one hospital site also received urine tests at every visit which may have improved adherence as patients knew they would be tested.
Attempts were made at baseline to balance the comparison groups for potential confounding factors by multivariate

Appendix D: Evidence tables – RQ HH & II - Diagnosis of active TB
72
Bibliographic reference
Anibarro, L., Casas, S., Paz-Esquete, J., Gonzalez, L., Pena, A., Guerra, M. R., ... & Santin, M. (2010). Treatment completion in latent tuberculosis infection at specialist tuberculosis units in Spain. The International Journal of Tuberculosis and Lung Disease, 14(6), 701-707.
statistical analysis.
Neither participants nor clinicians were blinded to intervention allocation.
Follow up did not continue beyond treatment period
Number of patients Population: 599
Patient characteristics Included= 599
Included:
“Adults”
On preventive therapy for latent tuberculosis between January 2004 and march 2007
TST¹ positive
Excluded:
HIV infection
Those told to stop therapy due to medical advice
Baseline characteristics:
Total n (%) CHPo Hospital 1 n (%)
HUBell Hospital 2 n (%)
P value
Number 599 390 209
Age, years, median [IQR²]
36 [28.0-50.2] 34.5 [26.9-49.8] 40.2 [30.5-50.7] 0.009
Male gender 310 (51.8) 206 (52.8) 104 (49.8) 0.48
Country of origin 508 (84.8) 361 (92.6) 147 (70.3) <0.001

Appendix D: Evidence tables – RQ HH & II - Diagnosis of active TB
73
Bibliographic reference
Anibarro, L., Casas, S., Paz-Esquete, J., Gonzalez, L., Pena, A., Guerra, M. R., ... & Santin, M. (2010). Treatment completion in latent tuberculosis infection at specialist tuberculosis units in Spain. The International Journal of Tuberculosis and Lung Disease, 14(6), 701-707.
Spain
Foreign
91 (15.2) 29 (7.4) 62 (29.7)
Recent immigrant 68 (11.4) 24 (6.2) 44 (21.1) <0.001
Health care worker 40 (6.7) 34 (8.7) 6 (2.9) 0.006
Unemployed 14 (2.3) 5 (1.3) 9 (4.3) 0.03
Alcohol abuse 26 (4.3) 20 (5.1) 6 (2.9) 0.30
Residence in a correctional facility
4 (0.7) 3 (0.8) 1 (0.5) 0.68
Drug abuse 19 (3.2) 16 (4.1) 3 (1.4) 0.09
Presence of social risk factors
54 (9.0) 45 (11.5) 9 (4.3) 0.003
Main characteristics and outcome of 599 courses of preventive treatment
Total n (%) CHPo hospital 1 (%) HUBell hospital 2 n (%)
P value
Number 599 390 209
Indication for preventive treatment
Contact with TB case
Screening in high risk population
496 (82.8)
103 (17.2)
289 (74.1)
101 (25.9)
207 (99.0)
2 (1.0)
<0.001
Treatment regimen 466 (77.8) 284 (72.8) 182 (87.1) <0.001

Appendix D: Evidence tables – RQ HH & II - Diagnosis of active TB
74
Bibliographic reference
Anibarro, L., Casas, S., Paz-Esquete, J., Gonzalez, L., Pena, A., Guerra, M. R., ... & Santin, M. (2010). Treatment completion in latent tuberculosis infection at specialist tuberculosis units in Spain. The International Journal of Tuberculosis and Lung Disease, 14(6), 701-707.
6 months isoniazid
9 months isoniazid
4 months rifampicin
otherª
80 (13.4)
32 (5.3)
21 (3.5)
60 (15.4)
25 (6.4)
21 (5.4)
20 (9.6)
7 (3.3)
0
Adverse events in the first month
150 (25.0) 106 (27.2) 44 (21.1) 0.1
Treatment outcome
Completed
Not completed
484 (80.8)
115 (19.2)
310 (79.5)
80 (20.5)
174 (83.3)
35 (16.7)
0.29
ª17 cases treated with 2 months of isoniazid rifampicin and pyrazinamide with or without ethambutol, 4 cases treated with 3 months of isoniazid and rifampicin
Intervention 6 months of isoniazid
Dose unclear, (presumed to follow national guidelines for Spain)
OR
9 months of isoniazid
Dose unclear, (presumed to follow national guidelines for Spain)
OR
4 months of rifampicin
Dose unclear, (presumed to follow national guidelines for Spain)
OR

Appendix D: Evidence tables – RQ HH & II - Diagnosis of active TB
75
Bibliographic reference
Anibarro, L., Casas, S., Paz-Esquete, J., Gonzalez, L., Pena, A., Guerra, M. R., ... & Santin, M. (2010). Treatment completion in latent tuberculosis infection at specialist tuberculosis units in Spain. The International Journal of Tuberculosis and Lung Disease, 14(6), 701-707.
3 months of isoniazid and rifampicin
Dose unclear, (presumed to follow national guidelines for Spain)
OR
Isoniazid, rifampicin and pryrazinamide for 2 months followed by isoniazid and rifampicin for 2 months
Dose unclear, (presumed to follow national guidelines for Spain)
Length of follow up Follow up did not extend beyond treatment completion
Location Spain
Outcomes measures and effect size
Results of multivariate analysis:
logistic regression analysis was used to adjust for variables with a significance of p<0.10
Factors analysed n Treatment completion n
Adjusted odds ratio (95% CI²)
P value
Age, years
<36
≥36
292
307
219
263
0.33 (0.30-0.76)
1
0.001
Sex
Male
Female
310
289
235
249
0.58 (0.37-0.92)
1
0.02
Hospital
CHPo
390
209
310
174

Appendix D: Evidence tables – RQ HH & II - Diagnosis of active TB
76
Bibliographic reference
Anibarro, L., Casas, S., Paz-Esquete, J., Gonzalez, L., Pena, A., Guerra, M. R., ... & Santin, M. (2010). Treatment completion in latent tuberculosis infection at specialist tuberculosis units in Spain. The International Journal of Tuberculosis and Lung Disease, 14(6), 701-707.
HUBell
Health care worker
No
Yes
559
40
449
35
Contact with a tuberculosis case
Yes
No
496
103
400
84
Immigrant (<5 years of residence)
Yes
No
68
531
36
448
0.21 (0.12-0.37)
1
<0.001
Episode of treatment
Initial regimen
Alternative regimen
562
37
459
29
Treatment regimen
Short regimen
6-9 months isoniazid
53
546
42
442
Adverse events in the first month
449
150
353
131
0.59 (0.34-1.10)
1
0.07

Appendix D: Evidence tables – RQ HH & II - Diagnosis of active TB
77
Bibliographic reference
Anibarro, L., Casas, S., Paz-Esquete, J., Gonzalez, L., Pena, A., Guerra, M. R., ... & Santin, M. (2010). Treatment completion in latent tuberculosis infection at specialist tuberculosis units in Spain. The International Journal of Tuberculosis and Lung Disease, 14(6), 701-707.
No
Yes
Social risk factors
Yes
No
54
545
30
454
0.21 (0.11-0.39)
1
<0.001
Source of funding Funding from the Spanish Network for the Research in Infectious Diseases
Comments SUMMARY: Overall, completion rates of latent tuberculosis treatment in specialist TB units are good. Nevertheless, counselling should be strengthened and new strategies to enhance adherence should be sought for recent immigrants and for people in unfavourable social situations. People less than 35 years of age are also at an increased risk of defaulting treatment.
Abbreviations:
¹Tuberculin Skin Test
²CI- confidence interval

Appendix D: Evidence tables – RQ HH & II - Diagnosis of active TB
78
A.1.16 Li, J., Munsiff, S. S.(2010)
Bibliographic reference Li, J., Munsiff, S. S., Tarantino, T., & Dorsinville, M. (2010). Adherence to treatment of latent tuberculosis infection in a clinical population in New York City. International Journal of Infectious Diseases, 14(4), e292-e297.
Study type Retrospective Cohort
Study outline Population matches population of interest. Participants were taken from two healthcare databases in New York City. A historical cohort of treatment completion for latent tuberculosis treatment was recorded. Some subgroups such as the homeless and drug users were not examined in this analysis.
Question is relevant; discussing the risk factors for non-adherence of latent tuberculosis therapy.
Patients received different kinds of care: isoniazid therapy for 6-9 months (daily or twice weekly) or rifampicin based therapy for 4 months (daily). Data was split between those who took rifamycin and those who took isoniazid. There was no attempt to adjust for the differing types of dosing schedules in the isoniazid group, or for the patients taking rifabutin or rifampicin in the rifamycin group.
Treatment completion was low: 45.2% of participants completed therapy satisfactorily. Comparisons were not made between those that accepted treatment and those who refused to be enrolled as this was data taken from a healthcare database.
Data collected for the study included: age, sex, race and ethnicity, country of birth, length of time in the USA, borough of residence, date of first visit to a TB clinic, date treatment for latent tuberculosis started, regimen, length of latent TB treatment, and risk of TB disease.
Multivariate analysis was performed using log-binomial regression. Multivariate analysis appears not to have been adjusted for gender, a major confounding factor.
Definition of risk factors was clear but unlikely to be reliable since this was a retrospective study and data was retrieved from administrative health data.
Definition of treatment completion outcome was clear but also reliant upon retrospective data. Different methods of evaluating adherence was used depending on the age and regimen of the participant: patients aged >18 years were considered to have completed treatment if they took 6-9 months of isoniazid daily or twice weekly within a 9-12 month period; or > 4 months of daily rifamycin doses within 6 months. Patients younger than 18 years were considered to have completed treatment if they had taken 9 or more months of daily or twice weekly isoniazid therapy within a 12 month

Appendix D: Evidence tables – RQ HH & II - Diagnosis of active TB
79
Bibliographic reference Li, J., Munsiff, S. S., Tarantino, T., & Dorsinville, M. (2010). Adherence to treatment of latent tuberculosis infection in a clinical population in New York City. International Journal of Infectious Diseases, 14(4), e292-e297.
period, or 6 or more months of daily rifamycin therapy within 9 months. Outcome measure was not reliable as there was no guarantee that patients were taking their medication despite regular attendance at clinic to pick up their monthly supply of medications.
Follow up did not continue beyond treatment period
Number of patients Population: 15,035
Patient characteristics
Included= 15 035
Inclusion criteria:
All patients prescribed either isoniazid or rifamycin (rifampicin or rifabutin) for the treatment of latent tuberculosis
Within any of 10 New York City Health Department Chest Clinics between January 2002 and August 2004
Screened and referred by non-health providers for evaluation of positive TST¹
Those screened at clinics who were eligible for and started treatment for latent tuberculosis.
Excluded:
Contacts of patients with multi-drug resistant forms of tuberculosis
Not treated with an isoniazid or rifamycin containing regimen
Baseline characteristics:
Characteristic Isoniazid n % Rifampicin n % Total n %

Appendix D: Evidence tables – RQ HH & II - Diagnosis of active TB
80
Bibliographic reference Li, J., Munsiff, S. S., Tarantino, T., & Dorsinville, M. (2010). Adherence to treatment of latent tuberculosis infection in a clinical population in New York City. International Journal of Infectious Diseases, 14(4), e292-e297.
Total 14030 44.1 1005 60.0 15,035 45.4
Age, years
<18
18-24
25-34
≥35
3928
2539
3078
4485
40.3
39.9
41.6
51.5
191
146
226
442
52.4
61.6
59.3
63.1
4119
2685
3304
4927
40.9
41.1
42.8
52.5
Sex
Male
Female
6879
7151
44.4
43.8
436
569
61.0
59.2
7315
7720
45.4
45.0
Race/ethnicity
Asian
Non-Hispanic black
Non-hispanic white
Hispanic
Other/unknown
2245
4810
997
4728
1250
48.8
44.1
38.6
44.2
39.5
162
302
69
385
87
67.9
58.3
65.2
58.7
52.9
2407
5112
1066
5113
1337
50.1
44.9
40.3
45.3
40.4
Country of birth
Non-US-born
11821
2076
133
44.3
44.5
27.8
862
139
4
60.4
56.8
75.0
12683
2215
137
45.2
45.3
29.2

Appendix D: Evidence tables – RQ HH & II - Diagnosis of active TB
81
Bibliographic reference Li, J., Munsiff, S. S., Tarantino, T., & Dorsinville, M. (2010). Adherence to treatment of latent tuberculosis infection in a clinical population in New York City. International Journal of Infectious Diseases, 14(4), e292-e297.
HIV serostatus
Positive
Negative
Unknown
94
3057
10879
55.3
56.1
40.6
1
328
676
0.0
61.3
59.5
95
3385
11555
54.7
56.6
41.7
US-born
Unknown
Risk group
Contact
Medical Risk
Population Risk
Low risk
2344
1790
8984
912
55.7
51.4
40.6
34.7
388
116
451
50
67.8
67.2
52.8
48.0
2732
1906
9435
962
57.4
52.4
41.1
35.3
Ever on Directly observed preventive therapy
Yes
No
217
13813
70.5
43.7
14
991
85.7
59.6
231
14804
71.4
44.7
Intervention For adults:
6-9 months of isoniazid
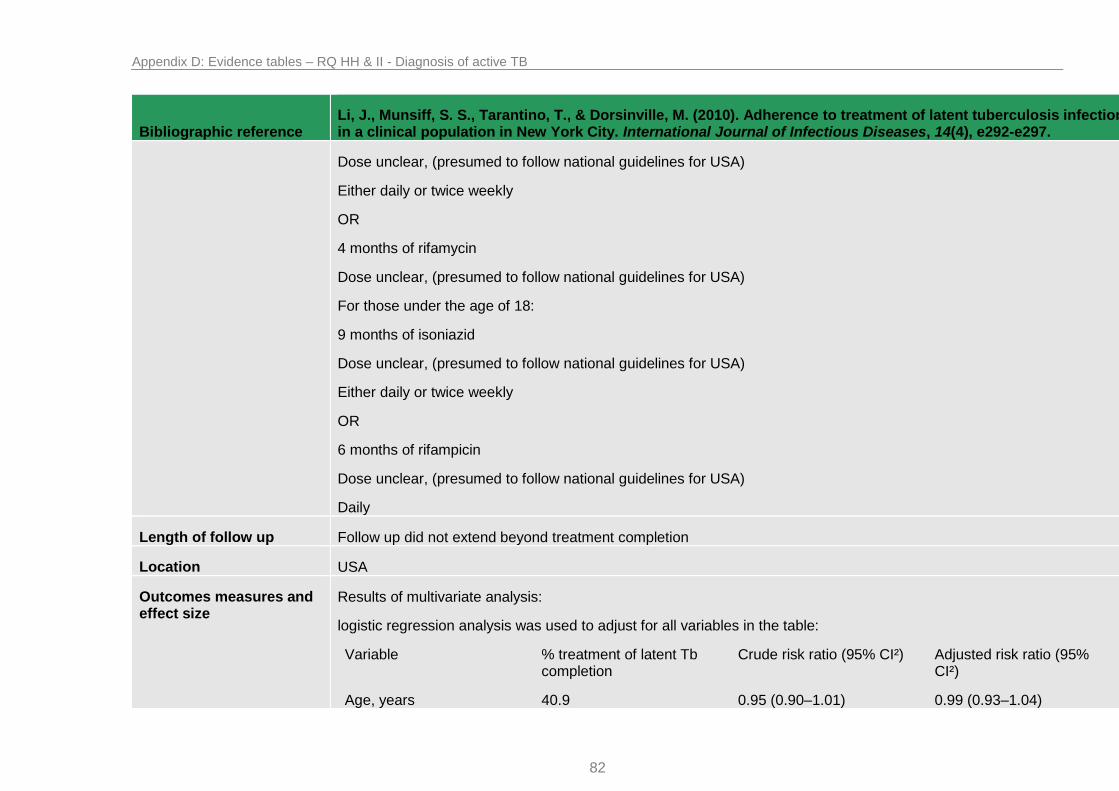
Appendix D: Evidence tables – RQ HH & II - Diagnosis of active TB
82
Bibliographic reference Li, J., Munsiff, S. S., Tarantino, T., & Dorsinville, M. (2010). Adherence to treatment of latent tuberculosis infection in a clinical population in New York City. International Journal of Infectious Diseases, 14(4), e292-e297.
Dose unclear, (presumed to follow national guidelines for USA)
Either daily or twice weekly
OR
4 months of rifamycin
Dose unclear, (presumed to follow national guidelines for USA)
For those under the age of 18:
9 months of isoniazid
Dose unclear, (presumed to follow national guidelines for USA)
Either daily or twice weekly
OR
6 months of rifampicin
Dose unclear, (presumed to follow national guidelines for USA)
Daily
Length of follow up Follow up did not extend beyond treatment completion
Location USA
Outcomes measures and effect size
Results of multivariate analysis:
logistic regression analysis was used to adjust for all variables in the table:
Variable % treatment of latent Tb completion
Crude risk ratio (95% CI²) Adjusted risk ratio (95% CI²)
Age, years 40.9 0.95 (0.90–1.01) 0.99 (0.93–1.04)

Appendix D: Evidence tables – RQ HH & II - Diagnosis of active TB
83
Bibliographic reference Li, J., Munsiff, S. S., Tarantino, T., & Dorsinville, M. (2010). Adherence to treatment of latent tuberculosis infection in a clinical population in New York City. International Journal of Infectious Diseases, 14(4), e292-e297.
<18
18-24
25-35
≥35
41.1
42.8
52.5
0.96 (0.90–1.02)
Referent
1.23 (1.17–1.29)
0.97 (0.92–1.03)
Referent
1.16 (1.11–1.22)
Race/ethnicity
Asian
Non-Hispanic black
Non-Hispanic white
Hispanic
Other/unknown
50.1
44.9
40.3
45.3
40.4
1.24 (1.14–1.35)
1.11 (1.03–1.21)
Referent
1.12 (1.04–1.22)
1.00 (0.91–1.10)
1.20 (1.10–1.30)
1.11 (1.02–1.19)
Referent
1.10 (1.02–1.19)
1.01 (0.92–1.11)
Country of birth
Non-US-born
US-born
45.3
45.2
1.00 (0.95–1.05)
Referent
1.08 (1.03–1.13)
Referent
Risk group
Contact
Medical risk
Population risk
Low risk
57.4
52.4
41.1
35.3
1.62 (1.48–1.78)
1.48 (1.35–1.63)
1.16 (1.07–1.27)
Referent
1.51 (1.38–1.66)
1.45 (1.32–1.60)
1.16 (1.07–1.27)
Referent
Ever on directly observed preventive therapy
71.4 1.60 (1.47–1.74) 1.26 (1.18–1.34)

Appendix D: Evidence tables – RQ HH & II - Diagnosis of active TB
84
Bibliographic reference Li, J., Munsiff, S. S., Tarantino, T., & Dorsinville, M. (2010). Adherence to treatment of latent tuberculosis infection in a clinical population in New York City. International Journal of Infectious Diseases, 14(4), e292-e297.
Yes
No
44.7 Referent Referent
Treatment regimen
Isoniazid alone
Rifamycin alone
44.1
60.0
Referent
1.36 (1.29–1.44)
Referent
1.20 (1.14–1.26)
Source of funding Unclear source of funding
Comments SUMMARY: Shorter regimen and directly observed preventive therapy increase completion rates for latent tuberculosis. Though efforts to improve treatment of latent tuberculosis need to address all groups, greater focus is needed for persons who are contacts and HIV-infected, as they have a higher risk of developing tuberculosis. After multivariate analysis participants who were ≥35 years or older, Asian, non-hispanic black, Hispanic, non-US-born, contacts, at increased medical or population risk of TB, ever on directly observed preventive therapy or a regimen of rifamycin alone were significantly more likely to complete treatment of latent tuberculosis. The strongest factor was being a contact to a TB patient (adjusted relative risk was 1.5 (95% CI² 1.4–1.7)
Abbreviations:
¹Tuberculin Skin Test
²CI- confidence interval

Appendix D: Evidence tables – RQ HH & II - Diagnosis of active TB
85
A.1.17 Machado Jr, A., Finkmoore, B (2009)
Bibliographic reference
Machado Jr, A., Finkmoore, B., Emodi, K., Takenami, I., Barbosa, T., Tavares, M., ... & Riley, L. W. (2009). Risk factors for failure to complete a course of latent tuberculosis infection treatment in Salvador, Brazil. The International journal of tuberculosis and lung Disease, 13(6), 719-725.
Study type Cohort
Study outline Population matches population of interest. Participants were taken a sample of household contacts of pulmonary tuberculosis in Brazil. Data on HIV status, however, was not sought.
Question is relevant; discussing the risk factors for non-completion of latent tuberculosis therapy.
Patients received the same standard of care at the same public chest disease hospital: isoniazid therapy for 6 months.
Treatment completion was low: 53.5% of participants who initiated latent tuberculosis therapy completed treatment satisfactorily. Comparisons were not made between those that accepted treatment and those who refused to be enrolled.
Risk factors for treatment completion analysed included: age, gender, ethnicity, presence of BCG scar, current employment status, family income, distance from hospital, number of buses required to commute, relationship to index case, time of exposure to index case, number of 30 day isoniazid refills received.
Multivariate analysis was used: poisson regression and logistic regression analysis was used to adjust for confounding variables.
Definition of risk factors was clear but unlikely to be reliable since number of buses required to commute was discovered by asking the transportation agency rather than the patients themselves who may have another means of transport. Data was gathered by questionnaire.
Definition of treatment completion outcome was clear but may be unreliable since the patient was judged to be adherent on the basis of attending monthly appointments and picking up pills; it is uncertain if patients were actually taking the pills.
Follow up did not continue beyond treatment period (6 months)
Number of patients Population: 101
Patient characteristics Included:
Household contacts of hospitalized index pulmonary TB cases
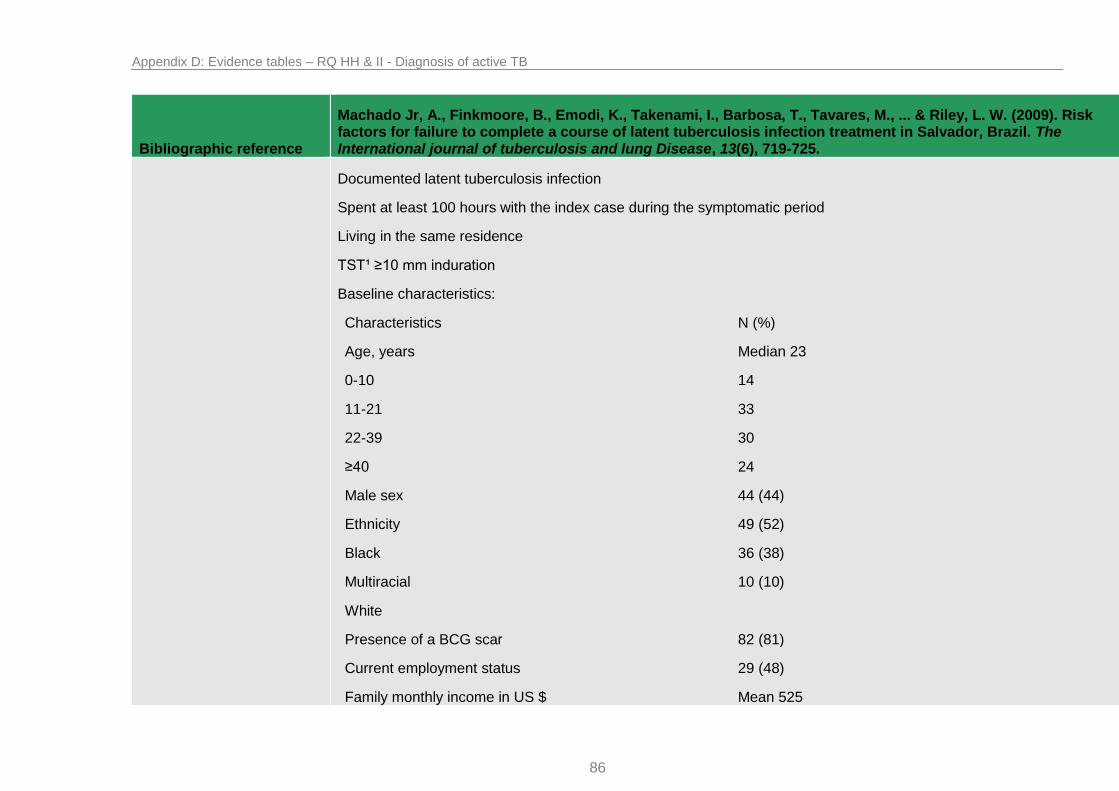
Appendix D: Evidence tables – RQ HH & II - Diagnosis of active TB
86
Bibliographic reference
Machado Jr, A., Finkmoore, B., Emodi, K., Takenami, I., Barbosa, T., Tavares, M., ... & Riley, L. W. (2009). Risk factors for failure to complete a course of latent tuberculosis infection treatment in Salvador, Brazil. The International journal of tuberculosis and lung Disease, 13(6), 719-725.
Documented latent tuberculosis infection
Spent at least 100 hours with the index case during the symptomatic period
Living in the same residence
TST¹ ≥10 mm induration
Baseline characteristics:
Characteristics N (%)
Age, years
0-10
11-21
22-39
≥40
Median 23
14
33
30
24
Male sex 44 (44)
Ethnicity
Black
Multiracial
White
49 (52)
36 (38)
10 (10)
Presence of a BCG scar 82 (81)
Current employment status 29 (48)
Family monthly income in US $ Mean 525

Appendix D: Evidence tables – RQ HH & II - Diagnosis of active TB
87
Bibliographic reference
Machado Jr, A., Finkmoore, B., Emodi, K., Takenami, I., Barbosa, T., Tavares, M., ... & Riley, L. W. (2009). Risk factors for failure to complete a course of latent tuberculosis infection treatment in Salvador, Brazil. The International journal of tuberculosis and lung Disease, 13(6), 719-725.
210-420
630-840
Did not say
35 (34.7)
39 (38.6)
27 (26.7)
Distance from hospital, km
≤5
5.1-10
>10
28 (29)
29 (31)
38 (40)
Number of buses required to commute
1
2
35 (35)
61 (64)
Relationship to index case
Spouse/child/parent
Aunt/uncle/cousin/neighbour/grandparent/sibling
42 (42)
59 (58)
Time of exposure to index case
≥2.7 months
33 (33)
Number of 30 day isoniazid refills received
1
2
3
29 (29.7)
10 (9.9)
3 (3.0)
5 (5.0)

Appendix D: Evidence tables – RQ HH & II - Diagnosis of active TB
88
Bibliographic reference
Machado Jr, A., Finkmoore, B., Emodi, K., Takenami, I., Barbosa, T., Tavares, M., ... & Riley, L. W. (2009). Risk factors for failure to complete a course of latent tuberculosis infection treatment in Salvador, Brazil. The International journal of tuberculosis and lung Disease, 13(6), 719-725.
4
5
6
0
54 (53.5)
Intervention 6 months of isoniazid
Dose unclear, daily (presumed to follow national guidelines for Brazil)
Length of follow up Follow up did not extend beyond treatment completion (6 months)
Location Brazil
Outcomes measures and effect size
Results of multivariate analysis:
logistic regression and poisson regression analysis was used to adjust for variables.
Treatment completion defined as having picked up all 6 refills of isoniazid at monthly appointments, those who did not complete treatment were defined as those who missed at least one but not all of their appointments.
Treatment non-completion n= 47
Treatment complete n=54
Relative risk (95% CI²)
P value
Age, years
0-10
11-21
22-39
≥ 40
Median 23
7
15
13
12
Median 24
7
18
17
12
0.0
0.91 (0.5-1.7)
0.87 (0.4-1.7)
1 (0.5-1.9)
0.77
0.67
1.0
Male sex 19 25 0.88 (0.57-1.35) 0.56
Relationship to index 22 20 1.24 (0.8-1.9) 0.32

Appendix D: Evidence tables – RQ HH & II - Diagnosis of active TB
89
Bibliographic reference
Machado Jr, A., Finkmoore, B., Emodi, K., Takenami, I., Barbosa, T., Tavares, M., ... & Riley, L. W. (2009). Risk factors for failure to complete a course of latent tuberculosis infection treatment in Salvador, Brazil. The International journal of tuberculosis and lung Disease, 13(6), 719-725.
case
Spouse/child/parent
Aunt/uncle/cousin/neighbour/grandparent/sibling
Report of adverse effects
5 4 2.69 (1.3-5.8) 0.01
Monthly family income, US $
210-420
630-840
Did not say
12
21
14
23
18
13
0.64 (0.4-1.1)
0.0
0.11
Distance to health centre
0-5
5.1-10
>10
15
18
8
13
11
30
0.0
1.16 (0.7-1.8)
0.39 (0.2-0.8)
0.52
0.01
Number of buses required to commute
1
2
10 (24)
32 (76)
25 (46)
29 (54)
0.0
1.84 (1.0-3.3)
0.04
Risk factors for immediate loss to follow up defined as enrolled study participants who did not return for any follow up

Appendix D: Evidence tables – RQ HH & II - Diagnosis of active TB
90
Bibliographic reference
Machado Jr, A., Finkmoore, B., Emodi, K., Takenami, I., Barbosa, T., Tavares, M., ... & Riley, L. W. (2009). Risk factors for failure to complete a course of latent tuberculosis infection treatment in Salvador, Brazil. The International journal of tuberculosis and lung Disease, 13(6), 719-725.
visits or receive any medication
Treatment non-completion n= 29
Treatment complete n=54
Relative risk (95% CI²)
P value
Age, years
0-10
11-21
22-39
≥ 40
Median: 23
6
8
6
9
Median: 24
7
18
17
12
1.0
0.52 (0.1-2.0)
0.23 (0.1-1.7)
0.85 (0.2-3.5)
0.35
0.23
0.88
Male sex 11 25 0.71 (0.3-1.8) 0.46
Relationship to index case
Spouse/child/parent
Aunt/uncle/cousin/neighbour/grandparent/sibling
13
16
20
34
1.38 (0.4-5.0)
1.0
0.49
Monthly family income, US $
210-420
630-840
Did not say
5
19
5
23
18
13
0.21 (0.02-1.9)
1.0
0.17
Report of adverse effects
n/a 4

Appendix D: Evidence tables – RQ HH & II - Diagnosis of active TB
91
Bibliographic reference
Machado Jr, A., Finkmoore, B., Emodi, K., Takenami, I., Barbosa, T., Tavares, M., ... & Riley, L. W. (2009). Risk factors for failure to complete a course of latent tuberculosis infection treatment in Salvador, Brazil. The International journal of tuberculosis and lung Disease, 13(6), 719-725.
Distance to health centre
0-5
5.1-10
>10
8
13
4
13
11
30
1.0
1.92 (0.2-22.2)
0.22 (0.2-3.0)
0.60
0.25
Number of buses required to commute
1
2
1
24
25
29
1.0
20.69 (2.1-208.4)
0.01
Source of funding Funding from the NIH Fogarty International Centre
Comments SUMMARY: Nearly 50% of household contacts at high risk for developing tuberculosis completed a 6 month course of isoniazid latent tuberculosis therapy. Completion of treatment was most effected by medication intolerance and commuting difficulties for follow up visits.
Abbreviations:
¹Tuberculin Skin Test
²CI- confidence interval

Appendix D: Evidence tables – RQ HH & II - Diagnosis of active TB
92
A.1.18 Kwara A, Herold J S et al (2008)
Bibliographic reference
Kwara, A., Herold, J. S., Machan, J. T., & Carter, E. J. (2008). Factors associated with failure to complete isoniazid
treatment for latent tuberculosis infection in Rhode Island. CHEST Journal, 133(4), 862-868.
Study type Retrospective Cohort
Study outline Population matches population of interest. Participants were taken from a cohort of patients that began treatment for latent tuberculosis infection in Rhode Island, USA.
Question is relevant; discussing the risk factors for non-completion of latent tuberculosis therapy.
Patients did not necessarily receive the same standard of care due to increased clinical monitoring and blood tests in certain age groups of patients in accordance to guidelines.
Treatment completion was low: 61.7% of participants who initiated latent tuberculosis therapy completed treatment satisfactorily. Comparisons were not made between those that accepted treatment and those who refused to initiate therapy.
Risk factors for treatment completion analysed included: demographics, TB risk factors, birth country, duration of residence in the United States, reason for discontinuation of therapy and the nature of adverse events experienced.
Multivariate analysis was used: logistic regression analysis was used to adjust for confounding variables.
Definition of risk factors was mostly clear however the definition of “medical risk factor,” wasn’t. Data is unlikely to be reliable since it was obtained by looking retrospectively at medical records.
Definition of treatment completion outcome was clear but may be unreliable since the patient was judged to be adherent on the basis of attending monthly appointments and picking up pills; it is uncertain if patients were actually taking the pills. Data was also retrospective.
Follow up did not continue beyond treatment period (9 months)
Number of patients Population: 672
Patient characteristics Included:
Patients initiating isoniazid therapy for treatment of latent tuberculosis
RISE TB clinic between January 2003 and December 2003

Appendix D: Evidence tables – RQ HH & II - Diagnosis of active TB
93
Bibliographic reference
Kwara, A., Herold, J. S., Machan, J. T., & Carter, E. J. (2008). Factors associated with failure to complete isoniazid
treatment for latent tuberculosis infection in Rhode Island. CHEST Journal, 133(4), 862-868.
Positive tuberculin skin test
Excluded
Asymptomatic
No chest radiographic findings
Baseline characteristics:
Of the 845 patients eligible to be candidates: 82.9% were foreign born, 17.1% were born in the United states, 54.8% were Hispanic, 19.7% were black or African American, 8.2% were white, 6.5% were Asian or Pacific Islanders and 1.5% were other. More baseline characteristics of the 672 patients included in the study can be found in the outcome measures and effects size section.
Intervention 9 months of isoniazid
Dose unclear, daily (presumed to follow national guidelines for Brazil)
Monitoring of patients:
Age yr Follow up and frequency of routine AST check
<20
20-34
35-60
61-80
>80
Clinical monitoring only every 2 months
AST at baseline and 2 months; clinical monitoring every 2 months
AST at baseline, months 1 and 2, clinical monitoring at month 1 and then every 2 months.
AST at baseline and months 1 through 5 with clinical monitoring, then clinical monitoring every 2 months
AST at baseline and monthly with clinical monitoring for the entire course
Length of follow up Follow up did not extend beyond treatment completion (9 months)
Location Rhode Island, USA

Appendix D: Evidence tables – RQ HH & II - Diagnosis of active TB
94
Bibliographic reference
Kwara, A., Herold, J. S., Machan, J. T., & Carter, E. J. (2008). Factors associated with failure to complete isoniazid
treatment for latent tuberculosis infection in Rhode Island. CHEST Journal, 133(4), 862-868.
Outcomes measures and effect size
Results of multivariate analysis:
Multiple logistic regression analysis was used to adjust for variables.
Treatment completion defined as having picked up all 9 months of isoniazid pills. Those who did not constituted the treatment non-completion group.
Multivariate analysis included age, gender, race, insurance, birthplace, duration in United States, pregnant, postpartum, illicit drug use, any alcohol, medical risk factors, HIV, TST¹ size of induration, history of BCG, known contact, chest radiograph, any reported side effects, skin rash, abnormal AST² level.
Variables OR 95% Confidence Interval P value
Age, yr
>50
<20
20-34
35-50
Reference
2.3
1.5
1.3
0.8-6.5
0.6-1.5
0.5-3.3
0.075
0.874
0.559
Medical Insurance
Yes
No
Reference
1.7
1.1-2.7 0.023
Reported side effect
No
Yes
Reference
3.6
2.2-6.2 <0.0001
Postpartum
No
Reference
3.4
0.9-12.6 0.064

Appendix D: Evidence tables – RQ HH & II - Diagnosis of active TB
95
Bibliographic reference
Kwara, A., Herold, J. S., Machan, J. T., & Carter, E. J. (2008). Factors associated with failure to complete isoniazid
treatment for latent tuberculosis infection in Rhode Island. CHEST Journal, 133(4), 862-868.
Yes
Source of funding Unclear source of funding
Comments SUMMARY: At multivariate analysis lack of medical insurance coverage and the occurrence of treatment side effects were the only factors that were simultaneously associated with the non-completion of INH therapy when all effects were eligible for inclusion in the model.
Abbreviations:
¹Tuberculin Skin Test
²Aspartate aminotransferase

Appendix D: Evidence tables – RQ HH & II - Diagnosis of active TB
96
A.1.19 Haley, C. A., Stephan, S. et al (2008)
Bibliographic reference
Haley, C. A., Stephan, S., Vossel, L. F., Sherfy, E. A., Laserson, K. F., & Kainer, M. A. (2008). Successful use of rifampicin for Hispanic foreign-born patients with latent tuberculosis infection. The international journal of tuberculosis and lung disease, 12(2), 160-167.
Study type Retrospective Cohort
Study outline Population matches population of interest. Participants were taken from a cohort of patients that began treatment for latent tuberculosis infection in Tennessee, USA. However the sample included a large proportion of patients that were Hispanic or foreign born taking 4 months of rifampicin therapy, this may effect generalization to other populations on different therapy.
Question is relevant; discussing the risk factors for non-completion of latent tuberculosis therapy and of adverse events.
Patients generally received the same standard of care in various Tennessee Department of Health clinics. Rifampicin was given with directly observed therapy in 4 cases (0.5%).
Treatment completion was adequate: 76% of participants who initiated latent tuberculosis therapy completed treatment satisfactorily. Comparisons were not made between those that accepted treatment and those who refused to initiate therapy.
Risk factors for treatment completion analysed included: demographic, social and clinical characteristics, prior treatment of latent tuberculosis, daily rifampicin dose, number of bottles and dates dispensed, symptoms during treatment, laboratory values and, if applicable, reason for non-completion.
Multivariate analysis was used: logistic regression analysis was performed using a manual forward stepwise method.
Definition of risk factors was clear however data is unlikely to be reliable since it was obtained by looking retrospectively at medical records.
Definition of treatment completion outcome was clear but may be unreliable since the patient was judged to be adherent on the basis of attending monthly appointments and picking up pills; it is uncertain if patients were actually taking the pills. Data was also retrospective.
Follow up did not continue beyond treatment period (4 months)
Number of patients Population: 749
Patient characteristics Included:

Appendix D: Evidence tables – RQ HH & II - Diagnosis of active TB
97
Bibliographic reference
Haley, C. A., Stephan, S., Vossel, L. F., Sherfy, E. A., Laserson, K. F., & Kainer, M. A. (2008). Successful use of rifampicin for Hispanic foreign-born patients with latent tuberculosis infection. The international journal of tuberculosis and lung disease, 12(2), 160-167.
Patients initiating rifampicin therapy for treatment of latent tuberculosis
Treated between February 2000 and February 2004
Excluded
Aged <18 years
More than one antituberculosis drug at baseline
Prior completion of latent tuberculosis treatment
Elevated aminotransferase levels≥3 times the upper limit of normal at baseline
Explicitly stated that they had never taken any rifampicin
Refused treatment within 2 days for reasons other than adverse events
Baseline characteristics:
Patient characteristic N (%) or median (range) Patient characteristics N (%) or median (range)
Median age, years 30 (18-84) Diabetes 14 (1.9)
Male 531 (70.9) End stage renal disease 1 (<1)
Ethnicity
White
Black
Asian
Hispanic
623 (83.2)
94 (12.6)
32 (4.3)
534 (71.3)
598 (79.8)
Head and neck cancer 1 (<1)

Appendix D: Evidence tables – RQ HH & II - Diagnosis of active TB
98
Bibliographic reference
Haley, C. A., Stephan, S., Vossel, L. F., Sherfy, E. A., Laserson, K. F., & Kainer, M. A. (2008). Successful use of rifampicin for Hispanic foreign-born patients with latent tuberculosis infection. The international journal of tuberculosis and lung disease, 12(2), 160-167.
Foreign-born
Country of origin (n=597)
Mexico
Guatemala
Honduras
El Salvador
Somalia
India
Sudan
Puerto Rico
Vietnam
37 other countries
373 (62.4)
102 (17.1)
14 (2.3)
10 (1.7)
9 (1.5)
8 (1.3)
7 (1.2)
7 (1.2)
6 (1.0)
63 (10.6)
Weight loss of >10% body weight
6 (<1)
Median length of US residence, months (n=594)
Recent immigrant within 5 years (n=594
41.2 (0.2-432.0)
385 (64.8)
HIV status (n=737)
HIV-infected
HIV-negative
Refused test
Status unknown
1 (<1)
347 (47.1)
303 (41.1)
86 (11.7)
Primary language other than English
599 (80.0) TST¹ result, mm induration (n=744)
15 (0-60)
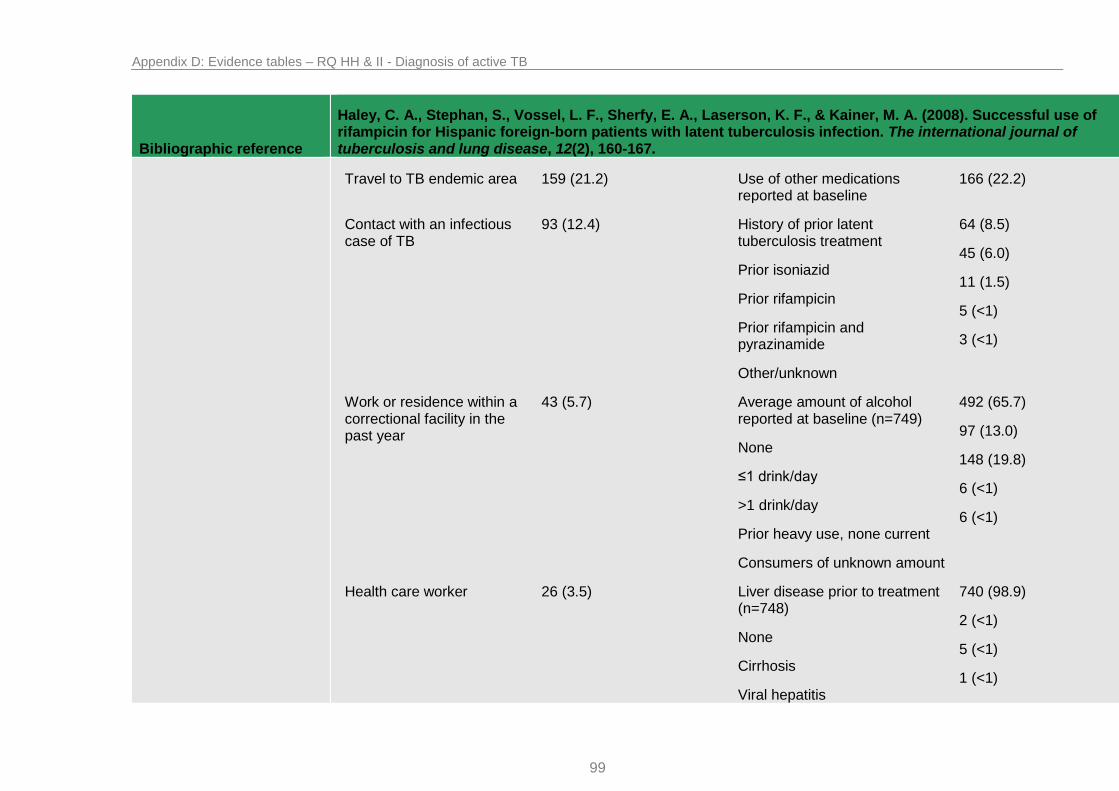
Appendix D: Evidence tables – RQ HH & II - Diagnosis of active TB
99
Bibliographic reference
Haley, C. A., Stephan, S., Vossel, L. F., Sherfy, E. A., Laserson, K. F., & Kainer, M. A. (2008). Successful use of rifampicin for Hispanic foreign-born patients with latent tuberculosis infection. The international journal of tuberculosis and lung disease, 12(2), 160-167.
Travel to TB endemic area 159 (21.2) Use of other medications reported at baseline
166 (22.2)
Contact with an infectious case of TB
93 (12.4) History of prior latent tuberculosis treatment
Prior isoniazid
Prior rifampicin
Prior rifampicin and pyrazinamide
Other/unknown
64 (8.5)
45 (6.0)
11 (1.5)
5 (<1)
3 (<1)
Work or residence within a correctional facility in the past year
43 (5.7) Average amount of alcohol reported at baseline (n=749)
None
≤1 drink/day
>1 drink/day
Prior heavy use, none current
Consumers of unknown amount
492 (65.7)
97 (13.0)
148 (19.8)
6 (<1)
6 (<1)
Health care worker 26 (3.5) Liver disease prior to treatment (n=748)
None
Cirrhosis
Viral hepatitis
740 (98.9)
2 (<1)
5 (<1)
1 (<1)

Appendix D: Evidence tables – RQ HH & II - Diagnosis of active TB
100
Bibliographic reference
Haley, C. A., Stephan, S., Vossel, L. F., Sherfy, E. A., Laserson, K. F., & Kainer, M. A. (2008). Successful use of rifampicin for Hispanic foreign-born patients with latent tuberculosis infection. The international journal of tuberculosis and lung disease, 12(2), 160-167.
Unknown
Homeless in past year 6 (<1) Baseline category for aminotransferase values (n=725)
Both AST and ALT <80 U/L
AST <80, ALT 80-119
AST 80-119, ALT <80
Both AST and ALT 80-119
699 (96.4)
20 (2.8)
4 (<1)
2 (<1)
Work or residence in shelter in past year
9 (1.2)
Work or residence in other high-risk congregate setting in past year
19 (2.5)
Past or present injection drug use (n=584)
5 (<1)
Intervention 4 months of rifampicin
Rifampicin: 10 mg/kg, daily
Length of follow up Follow up did not extend beyond treatment completion (4 months)
Location Tennessee, USA
Outcomes measures and effect size
Results of multivariate analysis:
Treatment completion defined as having picked up all 4 months of rifampicin pills and a provider determination that treatment is complete. Below analysis shows risk factors for failure to complete rifampicin therapy among Hispanic and

Appendix D: Evidence tables – RQ HH & II - Diagnosis of active TB
101
Bibliographic reference
Haley, C. A., Stephan, S., Vossel, L. F., Sherfy, E. A., Laserson, K. F., & Kainer, M. A. (2008). Successful use of rifampicin for Hispanic foreign-born patients with latent tuberculosis infection. The international journal of tuberculosis and lung disease, 12(2), 160-167.
non-hispanic subjects
Multivariate analysis included variables that were clinically relevant or had P value ≤ 0.2.
Risk factors Adjusted odds ratio (95% Confidence interval)
P value
Hispanic subjects (n=534)
Contact with an infectious TB case
Alcohol use reported at baseline
Other medications reported at baseline
Work or residence in a correctional facility in past year
3.7 (1.8-7.4)
1.7 (1.1-2.8)
2.2 (1.3-3.8)
2.2 (0.8-5.7)
<0.001
0.02
0.01
0.1
Non-Hispanic subjects (n=215)
Black race
Age
Foreign birth
2.6 (1.5-4.7)
0.97 (0.94-0.99)
0.5 (0.2-0.9)
0.001
0.03
0.02
“Symptoms during treatment” was defined by the occurrence of any new symptom not present at baseline regardless of severity or relationship to rifampicin therapy.
Multivariate analysis included variables that were clinically relevant or had P value ≤ 0.2. Female sex and non-Hispanic ethnicity were independently associated with new symptoms during rifampicin therapy.
Source of funding Unclear source of funding
Comments SUMMARY: With high completion rates and minimal side effects, 4 months of rifampicin is a favourable treatment for latent tuberculosis in Hispanic and other foreign born populations. After multivariate analysis contact with a TB case and

Appendix D: Evidence tables – RQ HH & II - Diagnosis of active TB
102
Bibliographic reference
Haley, C. A., Stephan, S., Vossel, L. F., Sherfy, E. A., Laserson, K. F., & Kainer, M. A. (2008). Successful use of rifampicin for Hispanic foreign-born patients with latent tuberculosis infection. The international journal of tuberculosis and lung disease, 12(2), 160-167.
use of other medications or alcohol at baseline were significantly associated with non-completion among Hispanics. Among non-Hispanics, black race and younger age were independently associated with failure to complete 4 months of rifampicin. Female sex and non-Hispanic ethnicity were independently associated with new symptoms during rifampicin therapy.
Abbreviations:
¹Tuberculin Skin Test

Appendix D: Evidence tables – RQ HH & II - Diagnosis of active TB
103
A.1.20 Leung, C. C., Yew, W. W et al (2007)
Bibliographic reference Leung, C. C., Yew, W. W., Law, W. S., Tam, C. M., Leung, M., Chung, Y. W., ... & Fu, F. (2007). Smoking and tuberculosis among silicotic patients.European Respiratory Journal, 29(4), 745-750.
Study type Cohort
Study outline Population mostly matches population of interest. Participants were taken from a cohort of male high risk silicotic patients in Hong Kong. The sample included those who had an induration less than 10 mm however tuberculin status was later adjusted for in multivariate analysis. The population is also highly specific which may effect generalization to other populations in different countries with different underlying conditions or risk factors.
Question is relevant; discussing the risk factor of smoking for the development of active tuberculosis.
Patients did not receive the same standard of care for latent TB as some were treated and others were not. Information on the number treated and on which treatment regimen is provided. Patients were also seen in differing clinics with potential for variance in standard of care. Adjustments for treatment of latent tuberculosis were attempted in multivariate analysis.
A total of 435 male silicotic patients were recruited and data was available for all. It is possible that in prospective cohort analysis cases may have been missed although regular follow up of the cohort and screening of notification registry was put in place to minimise this risk.
Follow up: unclear how regular follow up appointments were in the Pneumoconiosis Clinic or other chest clinics during the 7 year study period.
Data analysed for risk of developing tuberculosis included: date of tuberculin testing; age; ethnicity; smoking history; alcohol use; BCG vaccination scar; coexisting medical conditions; occupation; duration of dust exposure; and disease indicies according to the International Labour Organisation classification (profusion/size/shape/ of lung nodules, progressive massive fibrosis).
Multivariate analysis was used: logistic regression analysis was performed and Cox proportional hazards analysis.
Definition of risk factors was clear although data was recorded by questionnaire which is vulnerable to recall bias.
Definition of development of active tuberculosis was clear and a valid and reliable method was used to record outcome.
Number of patients Population: 435
Patient characteristics Included:

Appendix D: Evidence tables – RQ HH & II - Diagnosis of active TB
104
Bibliographic reference Leung, C. C., Yew, W. W., Law, W. S., Tam, C. M., Leung, M., Chung, Y. W., ... & Fu, F. (2007). Smoking and tuberculosis among silicotic patients.European Respiratory Journal, 29(4), 745-750.
All patients with silicosis
Excluded
Females (due to small numbers)
Previous history of tuberculin skin testing
Previous history of treatment for latent tuberculosis
Baseline characteristics:
Variable Tuberculin reaction <10 mm Tuberculin reaction ≥10 mm Overall
Subjects n 118 317 435
Age years 58.4 ± 9.9 57.2 ± 9.9 57.6 ± 9.9
Smoking status
Never-smoked
Ex-smoker
Current smoker
16.1
44.9
39.0
9.1
36.9
53.9
11.0
39.1
49.9
Current cigarette day 3.9 ± 8.3 4.6 ± 6.8 4.4 ± 7.3
Cigarette pack-years 24.0 ± 20.1 22.7 ± 21.5 23.1 ± 21.1
Regular alcohol use 5.1 13.6 11.3
BCG scar 1.7 3.8 3.2
BMI 23.1 ± 3.4 23.8 ± 3.3 23.6 ± 3.3
With other comorbidities 40.7 40.1 40.2

Appendix D: Evidence tables – RQ HH & II - Diagnosis of active TB
105
Bibliographic reference Leung, C. C., Yew, W. W., Law, W. S., Tam, C. M., Leung, M., Chung, Y. W., ... & Fu, F. (2007). Smoking and tuberculosis among silicotic patients.European Respiratory Journal, 29(4), 745-750.
Principle job
Underground driller
Surface driller
Fine silica
Other jobs
36.4
31.4
5.1
27.1
46.4
32.2
3.2
18.3
43.7
32.0
3.7
20.7
Exposure to dust years 24.2 ± 9.4 24.2 ± 8.3 24.2 ± 8.6
Profusion of nodules
Category 1
Category 2
Category 3
66.9
27.1
5.9
65.9
32.2
1.9
66.2
30.8
3.0
Size of nodules mm
<1.5
1.5-3
3-10
28.0
61.0
11.0
32.2
57.4
10.4
31.0
58.4
10.6
Regular shape of nodules 81.4 82.3 82.1
Progressive massive fibrosis
18.6 17.7 17.9
Intervention For those identified as having latent tuberculosis n=317, only 101 (31.9%) accepted treatment for latent tuberculosis: 61 were administered 6 months of daily isoniazid and 40 were administered 2 months of daily rifampicin and pyrazinamide.
Length of follow up The mean duration of follow up from the day of enrolment to development of TB, death or the end of the study was 1,908 ± 847 days.
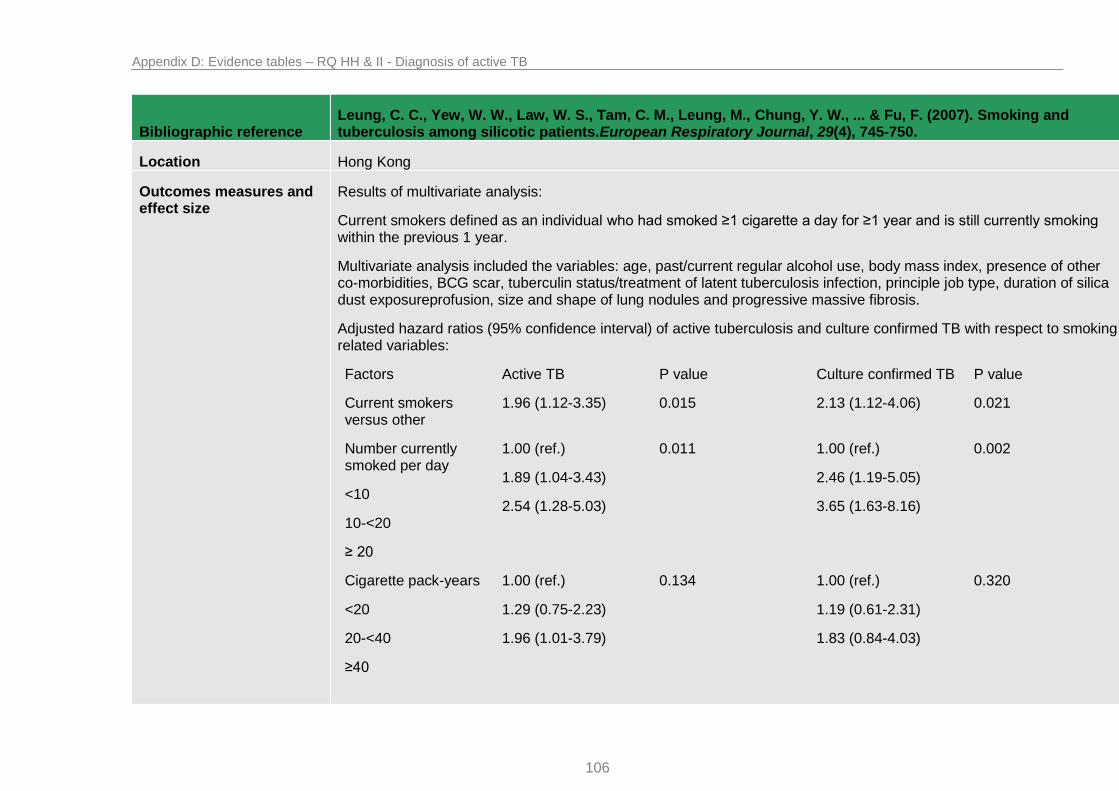
Appendix D: Evidence tables – RQ HH & II - Diagnosis of active TB
106
Bibliographic reference Leung, C. C., Yew, W. W., Law, W. S., Tam, C. M., Leung, M., Chung, Y. W., ... & Fu, F. (2007). Smoking and tuberculosis among silicotic patients.European Respiratory Journal, 29(4), 745-750.
Location Hong Kong
Outcomes measures and effect size
Results of multivariate analysis:
Current smokers defined as an individual who had smoked ≥1 cigarette a day for ≥1 year and is still currently smoking within the previous 1 year.
Multivariate analysis included the variables: age, past/current regular alcohol use, body mass index, presence of other co-morbidities, BCG scar, tuberculin status/treatment of latent tuberculosis infection, principle job type, duration of silica dust exposureprofusion, size and shape of lung nodules and progressive massive fibrosis.
Adjusted hazard ratios (95% confidence interval) of active tuberculosis and culture confirmed TB with respect to smoking related variables:
Factors Active TB P value Culture confirmed TB P value
Current smokers versus other
1.96 (1.12-3.35) 0.015 2.13 (1.12-4.06) 0.021
Number currently smoked per day
<10
10-<20
≥ 20
1.00 (ref.)
1.89 (1.04-3.43)
2.54 (1.28-5.03)
0.011 1.00 (ref.)
2.46 (1.19-5.05)
3.65 (1.63-8.16)
0.002
Cigarette pack-years
<20
20-<40
≥40
1.00 (ref.)
1.29 (0.75-2.23)
1.96 (1.01-3.79)
0.134 1.00 (ref.)
1.19 (0.61-2.31)
1.83 (0.84-4.03)
0.320

Appendix D: Evidence tables – RQ HH & II - Diagnosis of active TB
107
Bibliographic reference Leung, C. C., Yew, W. W., Law, W. S., Tam, C. M., Leung, M., Chung, Y. W., ... & Fu, F. (2007). Smoking and tuberculosis among silicotic patients.European Respiratory Journal, 29(4), 745-750.
Source of funding Unclear source of funding
Comments SUMMARY: On Cox proportional hazard analysis, current smokers have a significantly higher risk of TB than other silicotic patients (adjusted hazard ratio (95% confidence interval): 1.96 (1.14-3.35) after controlling for age, alcohol use, tuberculin status, treatment for latent TB infection and other relevant background/disease factors. A significant dose-response relationship was also observed with daily number of cigarettes currently smoked. Snoking cessation may reduce 32.4% (95% confidence interval: 6.5-54.0) of the risk. Smoking increases the risk of both tuberculosis infection and subsequent development of disease among male silicotic patients.

Appendix D: Evidence tables – RQ HH & II - Diagnosis of active TB
108
A.1.21 Lobato MN, Reves RR et al (2005)
Bibliographic reference
Lobato, M. N., Reves, R. R., Jasmer, R. M., Grabau, J. C., Bock, N. N., & Shang, N. (2005). Adverse events and treatment completion for latent tuberculosis in jail inmates and homeless persons. CHEST Journal, 127(4), 1296-1303.
Study type Cohort
Study outline Population matches population of interest. Participants included two high risk groups for tuberculosis: homeless people and jail populations.
Question is relevant; discussing the risk factors for non-completion and adverse events during treatment of latent tuberculosis therapy, specifically the regimen of rifampicin and pyrazinamide for 2 months.
Patients mostly received the same standard of care as treatment was given via directly observed therapy in both groups with the exception that the homeless population were required to self-administer over weekends. One group was also treated in a jail setting where the care may have been different. During the study, due to the death of one of the participants from hepatotoxicity, the rate of laboratory testing was increased to every 2 weeks. AST¹ testing and ALT² testing was available for 97% and 56% of participants respectively. These factors may have led to missed cases of hepatotoxicity in some treated patients.
Treatment completion was low but similar between groups: 43.6% of homeless participants and 47.5% of incarcerated participants who initiated latent tuberculosis therapy completed treatment satisfactorily. Comparisons were not made between those that accepted treatment and those who refused to initiate therapy.
Risk factors for treatment completion and adverse events analysed included: demographics, risk factors for exposure to TB, symptoms of TB, and pertinent medical history including liver disease and current medications. Participants were offered HIV testing if not documented.
Multivariate analysis was used: logistic regression analysis was performed using a backward stepwise selection procedure.
Definition of risk factors was clear and the methods used to record the risk were generally reliable and valid although users of alcohol and intravenous drug use is likely to be under reported.
Definition of treatment completion outcome was clear and mostly reliable and valid since treatment was directly observed. The ranges used for definition of hepatotoxicity (≥2.5 times the upper limit of normal) was slightly smaller than those used by other studies (≥3 times the upper limit of normal) which may lead to an overestimation of effect.

Appendix D: Evidence tables – RQ HH & II - Diagnosis of active TB
109
Bibliographic reference
Lobato, M. N., Reves, R. R., Jasmer, R. M., Grabau, J. C., Bock, N. N., & Shang, N. (2005). Adverse events and treatment completion for latent tuberculosis in jail inmates and homeless persons. CHEST Journal, 127(4), 1296-1303.
There were clear differences in homeless and jail populations at baseline.
Follow up did not continue beyond treatment period (3 months maximum). 34 inmates were transferred to another facility while receiving treatment and lost to follow up.
Number of patients Population: 1,246
Patient characteristics Included:
Patients receiving pyrazinamide and rifampicin in jail and homeless populations
Excluded
Prefer treatment with another regimen
Age <17 years
Active tuberculosis
Previous treatment for TB or latent TB
Intolerance of treatment medication
Pregnancy or attempting to become pregnant
Serum concentration of AST¹ or ALT² greater than 5 times upper limit of normal at baseline.
Baseline characteristics:
Characteristics Jail inmates (n=844) (%) Homeless (n=367) (%) P value
Mean age, y 33.3 37.1 0.04
Male gender 758 (89.9) 334 (91.0) 0.59
Race/ethnicity 507 (60.1) 69 (18.8) <0.001

Appendix D: Evidence tables – RQ HH & II - Diagnosis of active TB
110
Bibliographic reference
Lobato, M. N., Reves, R. R., Jasmer, R. M., Grabau, J. C., Bock, N. N., & Shang, N. (2005). Adverse events and treatment completion for latent tuberculosis in jail inmates and homeless persons. CHEST Journal, 127(4), 1296-1303.
Black, non–Hispanic
Hispanic
Other
271 (32.1)
66 (7.8)
220 (59.9)
78 (21.3)
<0.001
US born 535 (63.4) 150 (40.9) <0.001
Drug use
Injection
Non–injection
44 (5.2)
473 (56.0)
17 (4.6)
69 (18.8)
0.78
<0.001
Excess alcohol use 225 (26.7) 101 (27.5) 0.81
Unemployed past 24 months
163 (19.3) 112 (30.5) <0.001
Homeless in past 12 months
90 (10.7) 366 (99.7) <0.001
Prior jail incarceration 628 (74.4) 121 (33.0) <0.001
HIV serostatus
Positive
Negative
Not tested
Unknown
12 (1.4)
474 (56.1)
157 (18.6)
201 (32.8)
5 (1.4)
210 (57.2)
83 (22.6)
69 (18.8)
0.85
0.78
0.13
0.06
0.20
Prior positive tuberculin skin test result
280 (33.2) 136 (37.1) 0.20

Appendix D: Evidence tables – RQ HH & II - Diagnosis of active TB
111
Bibliographic reference
Lobato, M. N., Reves, R. R., Jasmer, R. M., Grabau, J. C., Bock, N. N., & Shang, N. (2005). Adverse events and treatment completion for latent tuberculosis in jail inmates and homeless persons. CHEST Journal, 127(4), 1296-1303.
Intervention 2 months of rifampicin and pyrazinamide
Rifampicin: 600 mg, daily
Pyrazinamide: 15 to 20 mg/kg, daily (maximum, 2g)
Treatment given via directly observed therapy, homeless population took medication self–administered on weekends.
Length of follow up Follow up did not extend beyond treatment completion (3 months maximum)
Location USA
Outcomes measures and effect size
Results of multivariate analysis:
Treatment completion defined as 60 doses administered within 3 months.
Variables Therapy not completed No./Total patients
Crude odds ratio Adjusted odds ratio (95% confidence interval (CI))
P value
Age, y NA 1.00 1.00 (0.99–1.01) 0.59
Female sex 88/119 0.38 0.35 (0.23–0.54) <0.001
US born 342/685 1.45 1.19 (0.82–1.72) 0.37
Black, non–Hispanic 287/576 1.32 0.92 (0.65–1.30) 0.63
Hispanic 291/491 0.68 0.59 (0.46–0.75) <0.001
Homeless 262/456 0.78 1.00 (0.77–1.31) 0.98
Unemployed 162/275 1.31 1.43 (1.07–1.90) 0.02
Prior positive tuberculin skin test
232/416 0.89 0.90 (0.70–1.15) 0.40
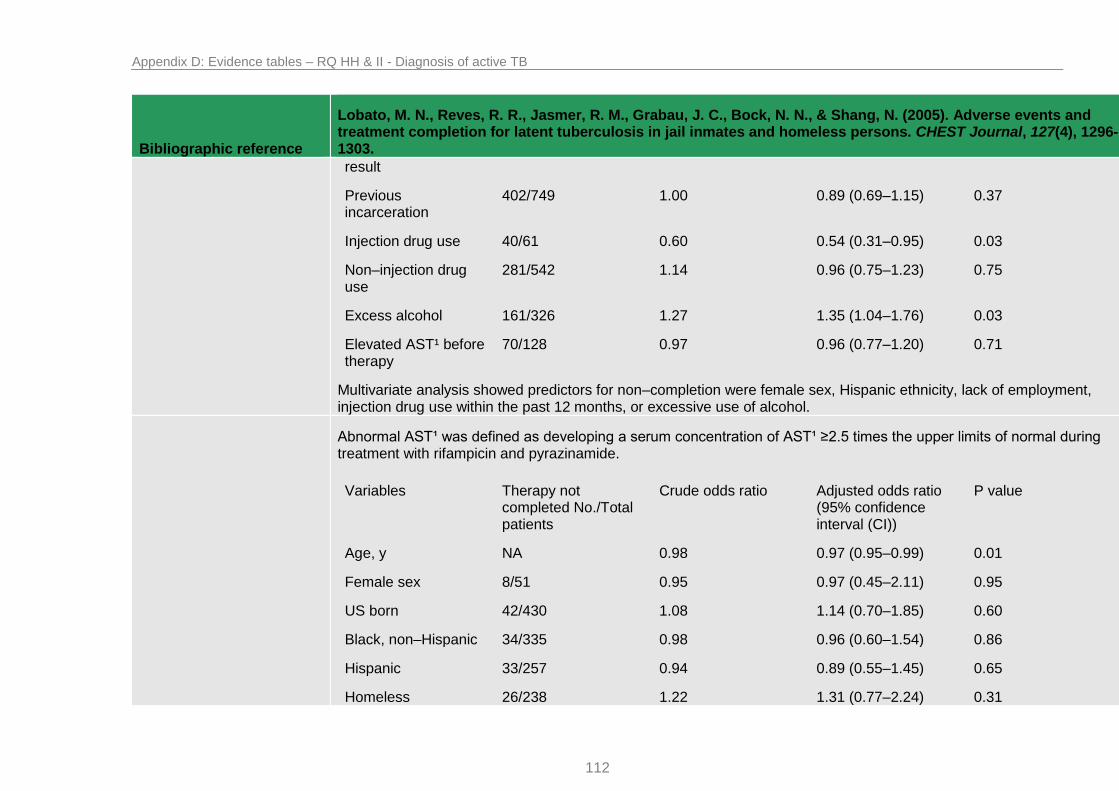
Appendix D: Evidence tables – RQ HH & II - Diagnosis of active TB
112
Bibliographic reference
Lobato, M. N., Reves, R. R., Jasmer, R. M., Grabau, J. C., Bock, N. N., & Shang, N. (2005). Adverse events and treatment completion for latent tuberculosis in jail inmates and homeless persons. CHEST Journal, 127(4), 1296-1303.
result
Previous incarceration
402/749 1.00 0.89 (0.69–1.15) 0.37
Injection drug use 40/61 0.60 0.54 (0.31–0.95) 0.03
Non–injection drug use
281/542 1.14 0.96 (0.75–1.23) 0.75
Excess alcohol 161/326 1.27 1.35 (1.04–1.76) 0.03
Elevated AST¹ before therapy
70/128 0.97 0.96 (0.77–1.20) 0.71
Multivariate analysis showed predictors for non–completion were female sex, Hispanic ethnicity, lack of employment, injection drug use within the past 12 months, or excessive use of alcohol.
Abnormal AST¹ was defined as developing a serum concentration of AST¹ ≥2.5 times the upper limits of normal during treatment with rifampicin and pyrazinamide.
Variables Therapy not completed No./Total patients
Crude odds ratio Adjusted odds ratio (95% confidence interval (CI))
P value
Age, y NA 0.98 0.97 (0.95–0.99) 0.01
Female sex 8/51 0.95 0.97 (0.45–2.11) 0.95
US born 42/430 1.08 1.14 (0.70–1.85) 0.60
Black, non–Hispanic 34/335 0.98 0.96 (0.60–1.54) 0.86
Hispanic 33/257 0.94 0.89 (0.55–1.45) 0.65
Homeless 26/238 1.22 1.31 (0.77–2.24) 0.31

Appendix D: Evidence tables – RQ HH & II - Diagnosis of active TB
113
Bibliographic reference
Lobato, M. N., Reves, R. R., Jasmer, R. M., Grabau, J. C., Bock, N. N., & Shang, N. (2005). Adverse events and treatment completion for latent tuberculosis in jail inmates and homeless persons. CHEST Journal, 127(4), 1296-1303.
Multivariate analysis found increasing age, an abnormal baseline AST¹ level, and unemployment within the past 24 months were independent risk factors for hepatotoxicity in this population of incarcerated and homeless individuals when treated with rifampicin and pyrazinamide.
Unemployed 12/156 0.60 0.51 (0.27–0.97) 0.04
Prior positive tuberculin skin test result
30/231 0.83 0.93 (0.57–1.52) 0.78
Previous incarceration
50/467 0.90 1.29 (0.78–2.15) 0.32
Injection drug use 2/30 2.09 2.57 (0.58–11.30) 0.21
Non–injection drug use
30/333 1.32 1.18 (0.73–1.90) 0.50
Excess alcohol 28/219 0.64 0.71 (0.43–1.17) 0.18
Elevated AST¹ before therapy
17/1169 0.71 0.72 (0.54–0.95) 0.02
Source of funding Unclear source of funding
Comments SUMMARY: This study detected the first treatment–associated fatality with the rifampicin and pyrazinamide regimen, prompting surveillance that detected unacceptable levels of hepatotoxicity and retraction of recommendations for its routine use. Completion rates for latent tuberculosis treatment using a short–course regimen exceeds historical rates using isoniazid. Efforts to identify an effective short–course treatment regimen for latent tuberculosis should be given high priority. Multivariate analysis showed predictors for non–completion were female sex, Hispanic ethnicity, lack of employment, injection drug use within the past 12 months, or excessive use of alcohol. Multivariate analysis found increasing age, an abnormal baseline AST¹ level, and unemployment within the past 24 months were independent risk factors for hepatotoxicity in this population of incarcerated and homeless individuals when treated with rifampicin and pyrazinamide.

Appendix D: Evidence tables – RQ HH & II - Diagnosis of active TB
114
Bibliographic reference
Lobato, M. N., Reves, R. R., Jasmer, R. M., Grabau, J. C., Bock, N. N., & Shang, N. (2005). Adverse events and treatment completion for latent tuberculosis in jail inmates and homeless persons. CHEST Journal, 127(4), 1296-1303.
Abbreviations:
¹AST- aspartate aminotransferase
²ALT- alanine aminotransferase

Appendix D: Evidence tables – RQ HH & II - Diagnosis of active TB
115
A.1.22 Vinnard C, Gopal A (2013)
Bibliographic reference Vinnard, C., Gopal, A., Linkin, D. R., & Maslow, J. (2013). Isoniazid Toxicity among an Older Veteran Population: A Retrospective Cohort Study.Tuberculosis research and treatment, 2013.
Study type Retrospective Cohort
Study outline Population matches population of interest. Participants were a high risk group for isoniazid toxicity: the older veteran population.
Question is relevant; discussing the risk factors stopping treatment due to adverse events during treatment of latent tuberculosis therapy, specifically during isoniazid therapy within 6 months of initiation.
Patients appear to have received a great variety of different standards of care. Variability included testing for comorbidities, number of isoniazid tablets provided per prescription and frequency of follow up visits. The proportion of patients in the cohort without testing for important comorbidities was not determined. Women were under-represented in this study.
Treatment completion was low: 46% of veterans who initiated latent tuberculosis therapy completed treatment satisfactorily. Comparisons were not made between those that accepted treatment and those who refused to initiate therapy. Data was not available for why 46% of patients discontinued treatment.
Risk factors for treatment completion and adverse events gathered included: demographic and comorbidity data, including HIV infection, hepatitis C infection, past or current alcohol abuse, past or current intravenous drug use, baseline aminotransferase levels and peak levels during treatment. Uncertain how many of these variables were included in analysis.
Cox regression analysis was performed however it is uncertain which variables were included in the analysis and whether certain significant variables were left out.
Definition of risk factors was clear however data was gathered by retrospectively examining clinical charts which is unlikely to be reliable.
Definition of treatment completion outcome was unclear and may be unreliable since data was gathered retrospectively. Also ALT¹ levels were available for only 84% of the participants at baseline and 71% of the participants during therapy which meant diagnosis of hepatotoxicity was reliant upon the clinician reporting this is both unclear and unreliable.
Baseline characteristics were not provided for all patients.
Follow up did not continue beyond treatment period (6 months maximum).

Appendix D: Evidence tables – RQ HH & II - Diagnosis of active TB
116
Bibliographic reference Vinnard, C., Gopal, A., Linkin, D. R., & Maslow, J. (2013). Isoniazid Toxicity among an Older Veteran Population: A Retrospective Cohort Study.Tuberculosis research and treatment, 2013.
Number of patients Population: 219
Patient characteristics Included:
Patients receiving isoniazid alone for therapy of latent tuberculosis
Single medical centre in Philadelphia
Baseline characteristics:
Not reported for all participants (for those who completed treatment and those who discontinued due to isoniazid hepatotoxicity see the outcomes measures and effect size section.
Intervention Isoniazid alone
Length of treatment and dose not recorded
Type of care given varied with no data provided
Length of follow up Follow up did not extend beyond treatment completion (6 months maximum)
Location USA
Outcomes measures and effect size
Results of proportional hazards model:
The relationship between hepatitis C infection and isoniazid discontinuation due to suspected hepatotoxicity remained significant even after adjusting for age and alcohol use (HR 3.03, 95% confidence interval 1.08–8.52). Age was not associated with treatment discontinuation due to suspected toxicity (HR 1.03, 95% confidence interval 0.99–1.07).
Source of funding Funding provided in part by CDC Prevention Epicentres Programme
Comments SUMMARY: The relationship between hepatitis C infection and isoniazid discontinuation due to suspected hepatotoxicity remained significant even after adjusting for age and alcohol use (HR 3.03, 95% confidence interval 1.08–8.52). Age was not associated with treatment discontinuation due to suspected toxicity (HR 1.03, 95% confidence interval 0.99–1.07).

Appendix D: Evidence tables – RQ HH & II - Diagnosis of active TB
117
Bibliographic reference Vinnard, C., Gopal, A., Linkin, D. R., & Maslow, J. (2013). Isoniazid Toxicity among an Older Veteran Population: A Retrospective Cohort Study.Tuberculosis research and treatment, 2013.
Abbreviations:
¹ALT- alanine aminotransferase

Appendix D: Evidence tables – RQ HH & II - Diagnosis of active TB
118
A.1.23 Martinez-Pino I, Sambeat, MA et al (2013)
Bibliographic reference
Martínez-Pino, I., Sambeat, M. A., Lacalle-Remigio, J. R., Domingo, P., & VACH Cohort Study Group. (2013). Incidence of tuberculosis in HIV-infected patients in Spain: the impact of treatment for LTBI. The International Journal of Tuberculosis and Lung Disease, 17(12), 1545-1551.
Study type Cohort
Study outline Population matches population of interest. Participants included HIV infected patients in 20 hospitals from the different regions in Spain. Data was drawn prospectively from an electronic case record shared between hospitals. As tuberculosis incidence was also estimated data included various patients who were not infected with latent tuberculosis, but this was separable from our population of interest.
Question is relevant; discussing the risk factors for progression of latent tuberculosis to active tuberculosis.
It is unclear if patients received the same standard of care since participants were spread over 20 different hospitals. All treated individuals received isoniazid 300mg, daily for 9 months.
Treatment completion was low but similar between groups: 144 out of 270 receiving isoniazid completed therapy. Comparisons in baseline characteristics were not made between those that accepted treatment and those who refused to initiate therapy. Comparisons were made between those who had no information available on TST¹ results and those who did.
Risk factors for development of active tuberculosis gathered included: age, gender, known date of HIV diagnosis, known start date of HAART², HAART² at TST¹, HAART² at TB diagnosis, ethnicity, education, socio-economic strata, previous incarceration, anti-HCV antibodies, HbsAg, CD4 cell count at enrolment, CD4 <200 cells/µl at enrolment, HIV viral load at enrolment, nadir CD4 cell count.
Multivariate analysis was done using Cox’s proportional hazards models. Unclear why CD4 count at registration<200 vs. ≥200 cells/µl was not included in final multivariate analysis when it was significant at the univariate level.
Definition of risk factors was clear and the methods used to record the risk were generally reliable and valid although taken from a central electronic database.
Definition of diagnosis of active and latent tuberculosis was well defined with a valid and reliable method used. However there was a large proportion of the population for whom
There were clear differences in populations at baseline between those who had no TB, prevalent TB and incident TB. Information on TST¹ was not available for 4848 patients. Compared with patients with available TST¹ results, these

Appendix D: Evidence tables – RQ HH & II - Diagnosis of active TB
119
Bibliographic reference
Martínez-Pino, I., Sambeat, M. A., Lacalle-Remigio, J. R., Domingo, P., & VACH Cohort Study Group. (2013). Incidence of tuberculosis in HIV-infected patients in Spain: the impact of treatment for LTBI. The International Journal of Tuberculosis and Lung Disease, 17(12), 1545-1551.
patients were more likely to have had no education or only primary education (61.8% vs 49.1%), to be of lower socio-economic status (50.5% vs 40.2%) and to have a CD4 cell count of <200 cells/µl at enrolment (18.4% vs 14.3%, P=<0.001). No information on treatment adherence was provided either for those who received isoniazid or those who received HAART² therapy.
Follow up continued for a maximum of 5 years. Length of follow up was adjusted for in hazard ratios.
Number of patients Population: 7902 (428 participants were TST¹ positive)
Patient characteristics Included:
Participants entering the VACH Cohort after 1 January 2004
Patients without a history of TB at enrolment in the cohort who did not develop TB during follow up
Patients who developed TB during follow up after enrolment (incident cases)
Patients with a history of TB before enrolment in the cohort (prevalent cases).
Excluded
Patients with a history of tuberculosis before TST¹ and those with missing TB diagnosis dates were excluded from the analysis.
Baseline characteristics:
No TB (n=7220) n (%)
Prevalent TB (n=514) n (%)
Incident TB (n=168) n (%)
Total (n=7977)
n (%)
P value
Age, years, median 37.4 [31.1–43.2]
39.8 [36.0–44.2] 37.0 [32.5–42.4] 37.7 [31.6–43.3] <0.001
Male sex 5404 (74.8) 422 (82.1) 122 (72.6) 6007 (75.3) 0.001
Known date of HIV diagnosis
5732 (79.4) 412 (80.2) 154 (91.7) 6368 (79.8) –

Appendix D: Evidence tables – RQ HH & II - Diagnosis of active TB
120
Bibliographic reference
Martínez-Pino, I., Sambeat, M. A., Lacalle-Remigio, J. R., Domingo, P., & VACH Cohort Study Group. (2013). Incidence of tuberculosis in HIV-infected patients in Spain: the impact of treatment for LTBI. The International Journal of Tuberculosis and Lung Disease, 17(12), 1545-1551.
Known start date of HAART²
4710 (65.2) 402 (78.2) 138 (82.1) 5319 (66.7) –
HAART² at TST¹ 592 (39.3) 3 (30.0) 12 (31.6) 644 (40.2) NS
HAART² at TB diagnosis
0 60 (57.7) 57 (54.3) 127 (57.2) NS
Ethnicity
White
Black
Hispanic
Other
3859 (81.9)
310 (6.6)
289 (6.1)
251 (5.3)
270 (81.8)
22 (6.7)
8 (2.4)
30 (9.1)
103 (77.4)
16 (12.0)
5 (3.8)
9 (6.8)
4286 (81.9)
349 (6.7)
305 (5.8)
293 (5.6)
0.001
Education
Illiterate
No formal education
Primary
Secondary
University
74 (1.7)
267 (6.2)
2135 (49.8)
1205 (28.1)
610 (14.2)
13 (4.3)
27 (8.9)
204 (67.3)
53 (17.5)
6 (2.0)
5 (4.1)
11 (8.9)
75 (61.0)
28 (22.8)
4 (3.3)
94 (2.0)
309 (6.5)
2452 (51.3)
1303 (27.3)
620 (13.0)
<0.001
Socio-economic strata
Low
Medium
1949 (45.5)
2141 (50.0)
190 (4.4)
220 (71.7)
85 (27.7)
2 (0.7)
83 (66.9)
41 (33.1)
0
2287 (47.9)
2291 (48.0)
193 (4.0)
<0.001
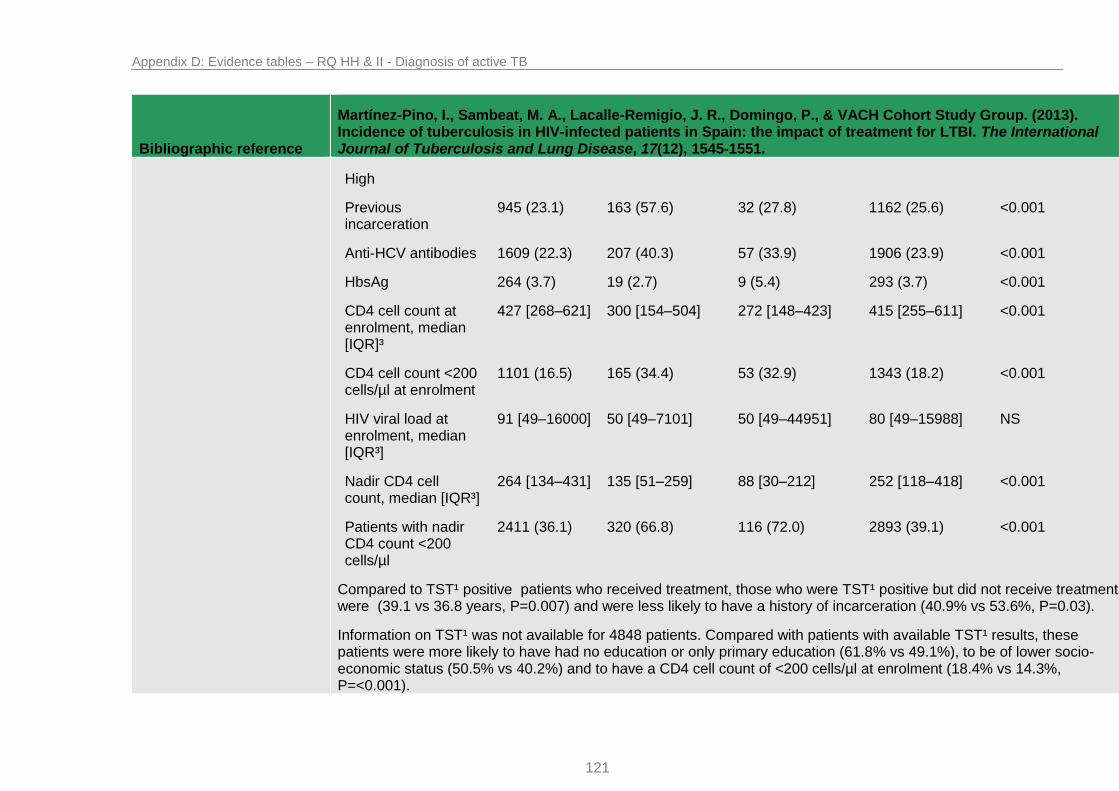
Appendix D: Evidence tables – RQ HH & II - Diagnosis of active TB
121
Bibliographic reference
Martínez-Pino, I., Sambeat, M. A., Lacalle-Remigio, J. R., Domingo, P., & VACH Cohort Study Group. (2013). Incidence of tuberculosis in HIV-infected patients in Spain: the impact of treatment for LTBI. The International Journal of Tuberculosis and Lung Disease, 17(12), 1545-1551.
High
Previous incarceration
945 (23.1) 163 (57.6) 32 (27.8) 1162 (25.6) <0.001
Anti-HCV antibodies 1609 (22.3) 207 (40.3) 57 (33.9) 1906 (23.9) <0.001
HbsAg 264 (3.7) 19 (2.7) 9 (5.4) 293 (3.7) <0.001
CD4 cell count at enrolment, median [IQR]³
427 [268–621] 300 [154–504] 272 [148–423] 415 [255–611] <0.001
CD4 cell count <200 cells/µl at enrolment
1101 (16.5) 165 (34.4) 53 (32.9) 1343 (18.2) <0.001
HIV viral load at enrolment, median [IQR³]
91 [49–16000] 50 [49–7101] 50 [49–44951] 80 [49–15988] NS
Nadir CD4 cell count, median [IQR³]
264 [134–431] 135 [51–259] 88 [30–212] 252 [118–418] <0.001
Patients with nadir CD4 count <200 cells/µl
2411 (36.1) 320 (66.8) 116 (72.0) 2893 (39.1) <0.001
Compared to TST¹ positive patients who received treatment, those who were TST¹ positive but did not receive treatment were (39.1 vs 36.8 years, P=0.007) and were less likely to have a history of incarceration (40.9% vs 53.6%, P=0.03).
Information on TST¹ was not available for 4848 patients. Compared with patients with available TST¹ results, these patients were more likely to have had no education or only primary education (61.8% vs 49.1%), to be of lower socio-economic status (50.5% vs 40.2%) and to have a CD4 cell count of <200 cells/µl at enrolment (18.4% vs 14.3%, P=<0.001).

Appendix D: Evidence tables – RQ HH & II - Diagnosis of active TB
122
Bibliographic reference
Martínez-Pino, I., Sambeat, M. A., Lacalle-Remigio, J. R., Domingo, P., & VACH Cohort Study Group. (2013). Incidence of tuberculosis in HIV-infected patients in Spain: the impact of treatment for LTBI. The International Journal of Tuberculosis and Lung Disease, 17(12), 1545-1551.
Intervention Those who received treatment for latent tuberculosis = 229
Isoniazid: 300mg daily, for 9 months
Length of follow up Follow up varied between participants but was adjusted for in analysis (10 889 person-years in total)
Location USA
Outcomes measures and effect size
Results of multivariate analysis:
Active TB was defined as microbiological confirmation of bacilli using culture or polymerase chain reaction. Below results are for patients treated for latent tuberculosis, n= 229.
Univariate analysis Odds ratio (95% confidence interval)
P value Multivariate analysis Hazard ratio (95% confidence interval)
P value
Age <35 vs. ≥35 years
4.6 (1.2–18.1) 0.031 6.1 (1.1–33.7) 0.037
Male sex 0.5 (0.1–1.9) NS 0.6 (0.1–3.1) NS
Ethnicity
White
Black
Reference
6.0 (1.4–26.0)
–
0.018
Reference
2.0 (0.4–10.7)
NS
CD4 at registration <200 vs. ≥200 cells/µl
5.4 (1.3–22.5) 0.021 – –
Nadir CD4 <200 vs. ≥200 cells/µl
4.1 (1.1–15) 0.032 5.6 (1.3–23.7) 0.018
Variables that reached statistical significance at univariate level were included in multivariate analysis except for CD4 count at registration.
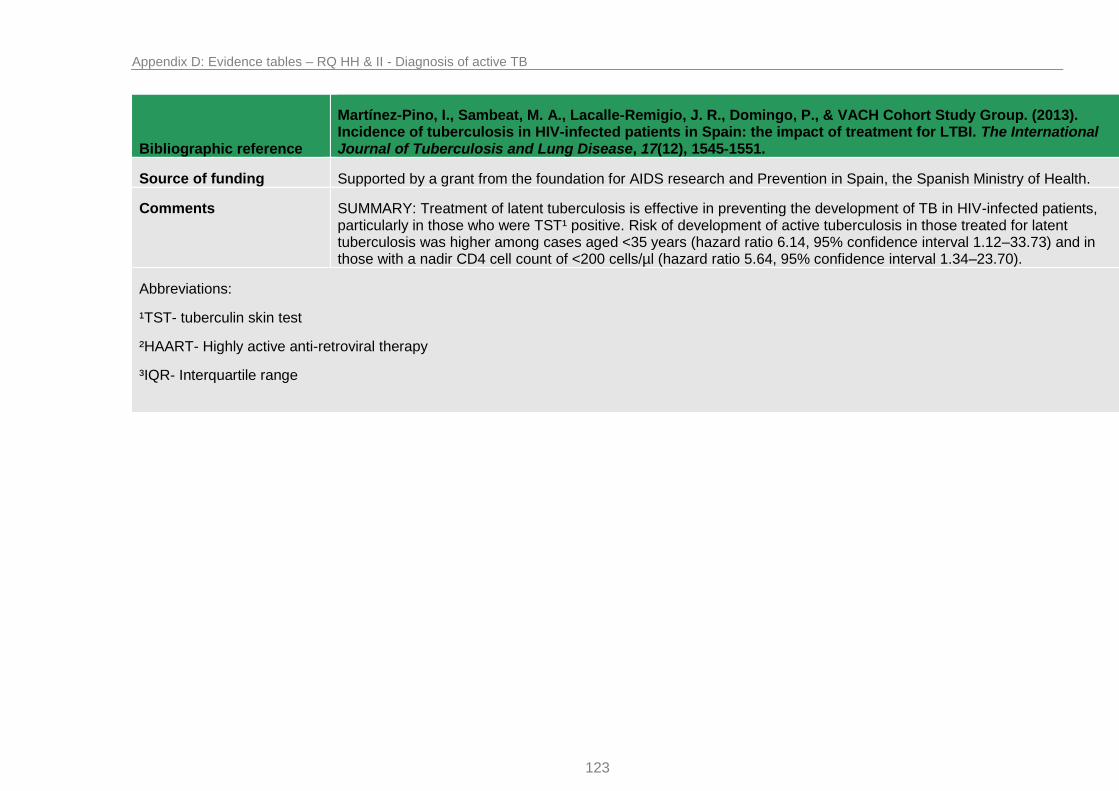
Appendix D: Evidence tables – RQ HH & II - Diagnosis of active TB
123
Bibliographic reference
Martínez-Pino, I., Sambeat, M. A., Lacalle-Remigio, J. R., Domingo, P., & VACH Cohort Study Group. (2013). Incidence of tuberculosis in HIV-infected patients in Spain: the impact of treatment for LTBI. The International Journal of Tuberculosis and Lung Disease, 17(12), 1545-1551.
Source of funding Supported by a grant from the foundation for AIDS research and Prevention in Spain, the Spanish Ministry of Health.
Comments SUMMARY: Treatment of latent tuberculosis is effective in preventing the development of TB in HIV-infected patients, particularly in those who were TST¹ positive. Risk of development of active tuberculosis in those treated for latent tuberculosis was higher among cases aged <35 years (hazard ratio 6.14, 95% confidence interval 1.12–33.73) and in those with a nadir CD4 cell count of <200 cells/µl (hazard ratio 5.64, 95% confidence interval 1.34–23.70).
Abbreviations:
¹TST- tuberculin skin test
²HAART- Highly active anti-retroviral therapy
³IQR- Interquartile range

Appendix D: Evidence tables – RQ HH & II - Diagnosis of active TB
124
A.1.24 Pettit AC, Bethel J et al (2013)
Bibliographic reference
Pettit, A. C., Bethel, J., Hirsch-Moverman, Y., Colson, P. W., & Sterling, T. R. (2013). Female sex and discontinuation of isoniazid due to adverse effects during the treatment of latent tuberculosis. Journal of Infection, 67(5), 424-432.
Study type Cohort
Study outline Population matches population of interest. Participants were patients receiving isoniazid therapy for the treatment of latent tuberculosis as diagnosed by tuberculin skin test. Data was drawn prospectively from interviews with the patients and then later by reviewing the medical charts of the patients to check for outcomes.
Question is relevant; discussing which factors make a person more at risk of stopping isoniazid therapy due to adverse events.
Patients did not necessarily receive the same standard of care. The study was spread across 12 different sites in the USA and Canada, some patients received 9 months of isoniazid others received 6 months. Uncertain how patients were monitored or whether directly observed therapy was used in some cases and not others. Study site was adjusted for in multivariate analysis. There was little information provided on how adherence was recorded (e.g. pill count, urine sampling).
Treatment completion was low: 47.2% of participants completed therapy. Comparisons in baseline characteristics were not made between those that accepted treatment and those who refused to initiate therapy.
Risk factors for treatment completion and adverse events gathered included: demographics, socioeconomic status, cultural background, immigration status, health history, alcohol and substance abuse. The exit interview obtained information on treatment experiences including adverse events.
Multivariate analysis was performed using forward stepwise regression. Adjusted relative risk was adjusted for study site, sex and current alcohol use. No other significant factors appear to have been adjusted for.
Definition of risk factors was clear and the methods used to record the risk were generally reliable and valid although taken from in-person interviews which may have been subject to recall bias especially the factors of alcohol and substance use.
Definition of diagnosis of a failure of treatment due to adverse events was well defined however reasons for treatment default were taken second hand from medical charts which may not have been reliable. Although data was gathered on the adverse events experienced by patients, this study provided no information of which specific adverse event led to discontinuation of isoniazid therapy.

Appendix D: Evidence tables – RQ HH & II - Diagnosis of active TB
125
Bibliographic reference
Pettit, A. C., Bethel, J., Hirsch-Moverman, Y., Colson, P. W., & Sterling, T. R. (2013). Female sex and discontinuation of isoniazid due to adverse effects during the treatment of latent tuberculosis. Journal of Infection, 67(5), 424-432.
Follow up did not appear to continue beyond length of treatment (maximum 12 months). 15% of participants were lost to follow up.
Number of patients Population: 1323
Patient characteristics Included:
March 2007–September 2008
Adults initiating isoniazid for the treatment of latent tuberculosis
≥18 years of age
Positive TST¹
Accepted self-administered isoniazid as treatment
Excluded
Incarcerated at the time treatment was offered
Received directly observed therapy of latent tuberculosis
Previously treated for latent tuberculosis or active tuberculosis
Initiated a regimen other than isoniazid for latent tuberculosis
Participated in other latent tuberculosis treatment studies
Baseline characteristics:
Characteristic
Total n= 1306
Isoniazid completed n=617
(%)
Isoniazid discontinued due to adverse effects
n=196 (%)
P value Isoniazid discontinued for other reasons n=493 (%)
P value

Appendix D: Evidence tables – RQ HH & II - Diagnosis of active TB
126
Bibliographic reference
Pettit, A. C., Bethel, J., Hirsch-Moverman, Y., Colson, P. W., & Sterling, T. R. (2013). Female sex and discontinuation of isoniazid due to adverse effects during the treatment of latent tuberculosis. Journal of Infection, 67(5), 424-432.
Age in years– median (IQR²)
35 (28–46) 38 (27–49) 0.09 33 (25–45) 0.04
Female sex 308 (49.9) 126 (64.3) <0.001 272 (55.2) 0.09
Race/ethnicity
White, non-hispanic
Black, non-hispanic
Asian
Hispanic
Other/unknown
57 (9.2)
142 (23.0)
215 (34.8)
162 (26.3)
41 (6.6)
36 (18.4)
28 (14.3)
68 (34.7
38 (19.4)
26 (13.3)
<0.001
45 (9.3)
151 (31.1)
99 (20.4)
162 (33.3)
36 (7.3)
<0.001
US born 139 (22.5) 54 (27.5) 0.15 153 (31.0) 0.002
High school or equivalent education
435 (70.5) 152 (77.5) 0.05 337 (68.4) 0.47
Currently homeless 10 (1.6) 2 (1.0) 0.54 28 (5.7) <0.001
Employed 318 (51.5) 112 (57.1) 0.17 247 (50.1) 0.67
Healthcare worker 39 (6.3) 16 (8.2) 0.37 33 (6.7) 0.81
Household income <$20,000
235 (51.5) 112 (57.1) 0.17 247 (50.1) 0.67
Jail >30 days in last 2 years
9 (1.5) 3 (1.5) 0.94 29 (5.9) <0.001

Appendix D: Evidence tables – RQ HH & II - Diagnosis of active TB
127
Bibliographic reference
Pettit, A. C., Bethel, J., Hirsch-Moverman, Y., Colson, P. W., & Sterling, T. R. (2013). Female sex and discontinuation of isoniazid due to adverse effects during the treatment of latent tuberculosis. Journal of Infection, 67(5), 424-432.
No health insurance
217 (35.5) 76 (39.4) 0.32 228 (47.0) <0.001
Current daily prescription medication
208 (33.8) 75 (38.3) 0.25 148 (30.2) 0.22
Psychiatric hospitalization or prescription medication
46 (7.5) 21 (10.7) 0.16 45 (9.2) 0.38
HIV infection 17 (2.8) 2 (1.0) 0.16 12 (2.5) 0.85
Alcohol use
Any ever
Any current
Problematic ever
Problematic current
Past 30 days– median (IQR²)
378 (61.3)
186 (30.1)
20 (3.2)
8 (1.3)
0 (0–2)
126 (64.3)
74 (37.8)
6 (3.1)
3 (1.5)
1 (0–4)
0.45
0.04
0.90
0.80
0.03
335 (67.9)
177 (35.9)
34 (6.9)
14 (2.8)
1 (0–3)
0.02
0.05
0.007
0.08
0.16
Substance use
Any ever
Any current
Problematic ever
Problematic current
102 (16.5)
19 (3.1)
22 (3.6)
14 (2.3)
32 (16.3)
12 (6.1)
10 (5.1)
7 (3.6)
0.74
0.05
0.33
0.32
134 (27.2)
53 (10.7)
65 (13.2)
41 (8.3)
<0.001
<0.001
<0.001
<0.001

Appendix D: Evidence tables – RQ HH & II - Diagnosis of active TB
128
Bibliographic reference
Pettit, A. C., Bethel, J., Hirsch-Moverman, Y., Colson, P. W., & Sterling, T. R. (2013). Female sex and discontinuation of isoniazid due to adverse effects during the treatment of latent tuberculosis. Journal of Infection, 67(5), 424-432.
Intervention Participants initiated an isoniazid course:
Isoniazid: daily, for 9 months (96.4% of treatment completers)
OR
Isoniazid: daily, for 6 months (3.6% of treatment completers)
52 participants switched to a rifampicin-based regime due to adverse effects on isoniazid.
Length of follow up Follow up did not extend beyond treatment period
Location USA and Canada
Outcomes measures and effect size
Results of multivariate analysis:
A participant was determined to have discontinued treatment due to adverse effects if the reason for stopping noted in the medical chart was due to adverse effects. Below is the relative risk of isoniazid discontinuation due to toxicity:
Characteristic n=813 Unadjusted relative risk
P value Adjusted relative risk P value
Age (in years) 1.01 (0.99–1.03) 0.40
Female sex 1.57 (1.22–2.02) <0.001 1.67 (1.32–2.10) <0.001
White, non-Hispanic race
1.74 (1.14–2.64) 0.01
US born 1.22 (1.06–1.41) 0.005
High school education or equivalent
1.33 (1.02–1.73) 0.03
Currently homeless 0.69 (0.17–2.77) 0.60

Appendix D: Evidence tables – RQ HH & II - Diagnosis of active TB
129
Bibliographic reference
Pettit, A. C., Bethel, J., Hirsch-Moverman, Y., Colson, P. W., & Sterling, T. R. (2013). Female sex and discontinuation of isoniazid due to adverse effects during the treatment of latent tuberculosis. Journal of Infection, 67(5), 424-432.
Employed 1.19 (1.00–1.42) 0.06
Healthcare worker 1.23 (1.02–1.47) 0.03
Household income <$20,000
0.80 (0.64–1.01) 0.06
Jail >30 days in the last 2 years
1.04 (0.32–3.40) 0.95
No health insurance 1.14 (0.78–1.65) 0.51
Current daily prescription medications
1.16 (0.87–1.54) 0.31
Psychiatric hospitalisation or prescription medication
1.33 (0.96–1.82) 0.08
HIV infection 0.43 (0.13–1.46) 0.17
Current alcohol use 1.29 (1.00–1.66) 0.05 1.41 (1.13–1.77) 0.003
Current substance use
1.65 (0.93–2.90) 0.08
Adjusted relative risk is adjusted for study site, sex and current alcohol use. No other significant factors appear to have been adjusted for.
Source of funding Supported by the Tuberculosis Epidemiologic Studies Consortium and the Centers for Disease Control and Prevention.
Comments SUMMARY: In multivariate analysis, female sex (risk rate 1.67, 95% Confidence interval 1.32–2.10, p<0.001) and current alcohol use (risk rate 1.41, 95% confidence interval 1.13–1.77, p=0.003) were independently associated with isoniazid

Appendix D: Evidence tables – RQ HH & II - Diagnosis of active TB
130
Bibliographic reference
Pettit, A. C., Bethel, J., Hirsch-Moverman, Y., Colson, P. W., & Sterling, T. R. (2013). Female sex and discontinuation of isoniazid due to adverse effects during the treatment of latent tuberculosis. Journal of Infection, 67(5), 424-432.
discontinuation due to adverse effects.
Abbreviations:
¹TST- tuberculin skin test
²IQR- Interquartile range

Appendix D: Evidence tables – RQ HH & II - Diagnosis of active TB
131
A.1.25 DiPerri G, Micciolo R (1993)
Bibliographic reference
Di Perri, G., Micciolo, R., Vento, S., Cruciani, M., Marocco, S., Carlotto, A., ... & Concia, E. (1993). Risk of reactivation of tuberculosis in the course of human immunodeficiency virus infection. The European journal of medicine, 2(5), 264-268.
Study type Cohort
Study outline Population matches population of interest. Participants were individuals infected with HIV and diagnosed by tuberculin skin test to have latent tuberculosis. The participants were seen at the same site in Verona, Italy. There was no indication that any of these participants were treated for latent infection of TB. 40 out of the 44 participants were IV drug users.
Question is relevant; discussing which factors make a person more at risk of developing active tuberculosis following infection with HIV and latent infection of tuberculosis. However this paper seemed to focus upon immunological evaluation of patients with HIV rather than specific people groups.
Participants received the same standard of care in regard to monitoring however immunological evaluation was performed at baseline and subsequently at 3-6 month intervals, leaving some uncertainty about consistency of monitoring tests. No other treatment appears to have been given however 10 patients were enrolled in a methadone maintenance programme during the study.
Comparisons in baseline characteristics were not made between those that were enrolled in the study and those who refused.
Risk factors for reactivation of tuberculosis gathered included: Total lymphocyte count, CD4 lymphocyte count and serum β-2 microglobulin levels.
Multivariate analysis was performed using the Cox model. However the study has failed to adjust for external risk factors that may be relevant such as malnutrition, alcoholism, homelessness and drug dependence.
Definition of risk factors was clear and the methods used to record the risk were valid and reliable.
Definition of diagnosis of active and latent tuberculosis was clear and methods used for diagnosis were valid and reliable.
Follow up was for 2 years. The study lost no subjects to follow up.
The population studied was small: 44 participants were included for analysis.
Number of patients Population: 44

Appendix D: Evidence tables – RQ HH & II - Diagnosis of active TB
132
Bibliographic reference
Di Perri, G., Micciolo, R., Vento, S., Cruciani, M., Marocco, S., Carlotto, A., ... & Concia, E. (1993). Risk of reactivation of tuberculosis in the course of human immunodeficiency virus infection. The European journal of medicine, 2(5), 264-268.
Patient characteristics Included:
PPD¹ positive
HIV infected
Excluded
Previous clinical episodes of tuberculosis
BCG vaccination
Clinical or instrumental evidence of active tuberculosis
Baseline characteristics:
Population consisted of: 37 males and 7 females; 40 IV drug abusers and 4 homosexuals; aged 19–46 years (mean 26); No signs of developing AIDS–related major pathologies; Oral candidiasis present in 5 subjects; seborrhoeic dermatitis present in 7 subjects; minor neurological abnormalities were recorded in 3 individuals; 10 subjects enrolled in a methadone maintenance programme and 40 drug abusers.
Intervention No treatment administered for latent tuberculosis infection.
Length of follow up Follow up was 2 years
Location Italy
Outcomes measures and effect size
Results of multivariate analysis:
A participant was determined to have developed active tuberculosis if microbiologically confirmed.
Variable Estimation Standard error Z P
Univariate analysis
Total lymphocytes -0.01507 0.000651 2.31 0.02
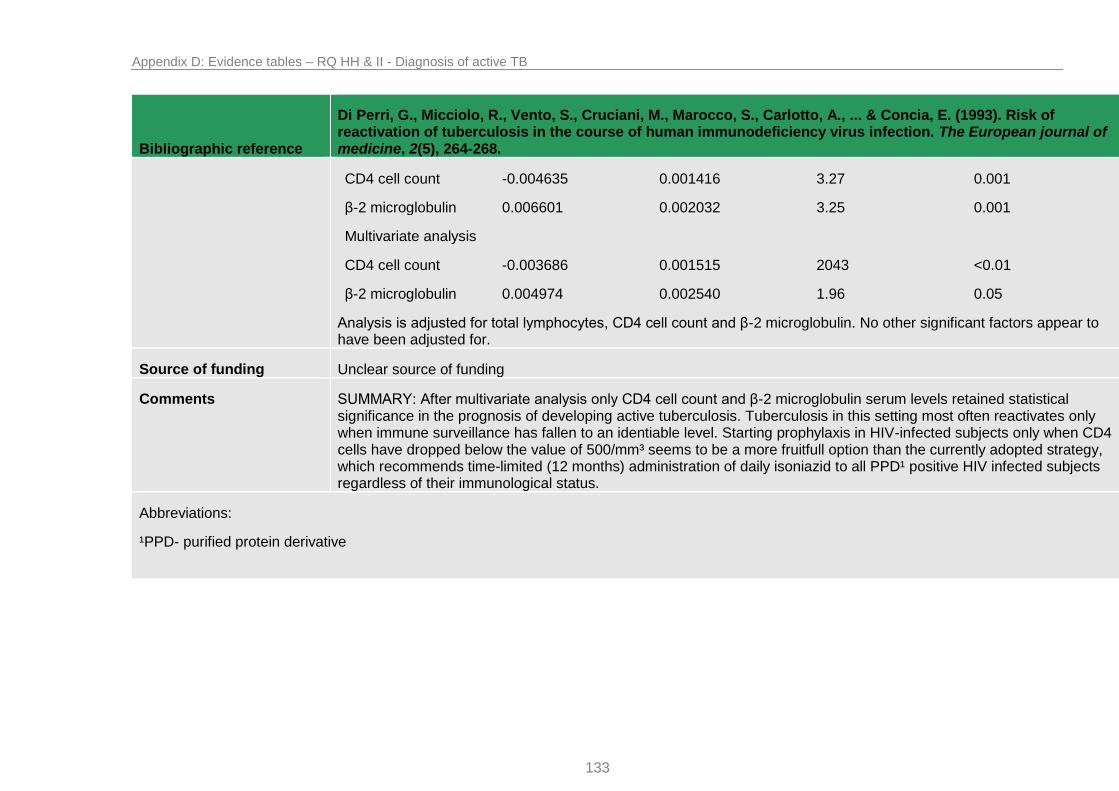
Appendix D: Evidence tables – RQ HH & II - Diagnosis of active TB
133
Bibliographic reference
Di Perri, G., Micciolo, R., Vento, S., Cruciani, M., Marocco, S., Carlotto, A., ... & Concia, E. (1993). Risk of reactivation of tuberculosis in the course of human immunodeficiency virus infection. The European journal of medicine, 2(5), 264-268.
CD4 cell count -0.004635 0.001416 3.27 0.001
β-2 microglobulin 0.006601 0.002032 3.25 0.001
Multivariate analysis
CD4 cell count -0.003686 0.001515 2043 <0.01
β-2 microglobulin 0.004974 0.002540 1.96 0.05
Analysis is adjusted for total lymphocytes, CD4 cell count and β-2 microglobulin. No other significant factors appear to have been adjusted for.
Source of funding Unclear source of funding
Comments SUMMARY: After multivariate analysis only CD4 cell count and β-2 microglobulin serum levels retained statistical significance in the prognosis of developing active tuberculosis. Tuberculosis in this setting most often reactivates only when immune surveillance has fallen to an identiable level. Starting prophylaxis in HIV-infected subjects only when CD4 cells have dropped below the value of 500/mm³ seems to be a more fruitfull option than the currently adopted strategy, which recommends time-limited (12 months) administration of daily isoniazid to all PPD¹ positive HIV infected subjects regardless of their immunological status.
Abbreviations:
¹PPD- purified protein derivative

Appendix D: Evidence tables – RQ HH & II - Diagnosis of active TB
134
A.1.26 Antonucci G, Girardi E et al (1995)
Bibliographic reference Antonucci, G., Girardi, E., Raviglione, M. C., Ippolito, G., Almi, P., Angarano, G., ... & Viale, P. (1995). Risk Factors for Tuberculosis in HIV-lnfected Persons: A Prospective Cohort Study. Jama, 274(2), 143-148.
Study type Cohort
Study outline Population does not exactly match population of interest. Participants were individuals infected with HIV and included those who were not tuberculin skin test positive or who were found to be anergic, however data for those with latent tuberculosis was separable. The participants were seen over 23 hospitals in Italy. None of these participants were treated for latent infection of TB in the past 18 months.
Question is relevant; discussing which factors make a person more at risk of developing active tuberculosis following infection with HIV; this was separable for latent tuberculosis infected participants. This paper took into account both immunological evaluation of patients with HIV and clinical and demographic features of participants.
The same standard of care in regard to monitoring was performed. Unclear if there were any further differences in care across the 23 hospital sites. During the study 104 subjects started preventive therapy for tuberculosis however this was only completed for 23 participants.
Baseline characteristics were recorded. Comparisons in baseline characteristics were not made between those that were enrolled in the study and those who refused.
Risk factors for development of active tuberculosis gathered included: age, sex, country of birth, place of residence, HIV transmission category, history of active tuberculosis, HIV clinical status and time of beginning preventive therapy for tuberculosis or antiretroviral therapy for HIV (if applicable), Medical history, physical examination, and CD4 count.
Multivariate analysis was performed using the Cox proportional hazards model. All variables significantly associated with the development of tuberculosis in the univariate analysis were adjusted for.
Definition of risk factors was clear and the methods used to record the risk were valid and reliable.
Definition of diagnosis of active and latent tuberculosis was clear and methods used for diagnosis were valid and reliable.
Follow up differed between participants over the study period (mean follow up 91 weeks). The study lost 27.4% of patients to follow up. Subjects who were unavailable for follow up had a significantly higher CD4 lymphocyte count than those who completed the study which could potentially lead to an overestimation of the risk of tuberculosis.
Number of patients Population: 2695 (197 tuberculin skin test positive)

Appendix D: Evidence tables – RQ HH & II - Diagnosis of active TB
135
Bibliographic reference Antonucci, G., Girardi, E., Raviglione, M. C., Ippolito, G., Almi, P., Angarano, G., ... & Viale, P. (1995). Risk Factors for Tuberculosis in HIV-lnfected Persons: A Prospective Cohort Study. Jama, 274(2), 143-148.
Patient characteristics Included:
≥18 years of age
HIV infected
October 1, 1990–April 30, 1991
Excluded
Episode of active tuberculosis in the previous 18 months
Started a course of antituberculosis drugs in the previous 18 months
Had completed a full course of isoniazid preventive therapy in the previous 18 months
Died, lost to follow up or developed tuberculosis within the first 4 weeks of study
Baseline characteristics:
Subjects with feature, No. (%)
No. with tuberculosis Incidence per 100 person-years (95% Confidence interval)
Crude rate ratio (95% Confidence interval)
Age, y
18–24
25–29
30–34
≥35
308 (11.4)
1133 (42.1)
747 (27.7)
507 (18.8)
9
33
25
16
2.01 (0.91–3.80)
2.08 (1.38–2.86)
2.46 (1.59–3.63)
2.51 (1.43–4.07)
1.00
1.04 (0.48–2.48)
1.23 (0.55–2.99)
1.25 (0.52–3.21)
Sex
Female
723 (26.8)
1972 (73.2)
21
62
1.98 (1.22–3.02)
2.36 (1.81–3.03)
1.00
1.20 (0.72–2.07)

Appendix D: Evidence tables – RQ HH & II - Diagnosis of active TB
136
Bibliographic reference Antonucci, G., Girardi, E., Raviglione, M. C., Ippolito, G., Almi, P., Angarano, G., ... & Viale, P. (1995). Risk Factors for Tuberculosis in HIV-lnfected Persons: A Prospective Cohort Study. Jama, 274(2), 143-148.
Male
HIV transmission category
Injecting drug users
Heterosexual contacts
Homosexual/bisexual
Other/undefined
1953 (72.5)
366 (13.6)
267 (9.9)
109 (4.0)
64
10
7
2
2.42 (1.87–3.10)
1.81 (0.87–3.33)
1.96 (0.79–4.04)
1.47 (0.18–5.31)
1.00
0.75 (0.34–1.46)
0.81 (0.31–1.76)
0.61 (0.07–2.28)
Place of residence in Italy
North
Center
South
1103 (41.0)
1098 (40.7)
494 (18.3)
34
30
19
2.25 (1.56–3.14)
2.01 (1.36–2.87)
2.79 (1.68–4.36)
1.00
0.89 (0.53–1.50)
1.24 (0.67–2.24)
History of Tuberculosis
No
Yes
2663 (98.8)
32 (1.2)
79
4
2.16 (1.71–2.70)
11.34 (3.09–29.03)
1.00
5.29 (1.41–14.09)
Antiretroviral therapy
No
Yes
1475 (54.7)
1220 (45.3)
37
46
1.90 (1.35–2.65)
2.61 (1.91–3.48)
1.00
1.36 (0.86–2.15)
CDC clinical class
II–III
1570 (58.2)
608 (22.6)
33
27
1.36 (0.94–1.92)
3.45 (2.27–5.01)
1.00
2.56 (1.12–6.04)

Appendix D: Evidence tables – RQ HH & II - Diagnosis of active TB
137
Bibliographic reference Antonucci, G., Girardi, E., Raviglione, M. C., Ippolito, G., Almi, P., Angarano, G., ... & Viale, P. (1995). Risk Factors for Tuberculosis in HIV-lnfected Persons: A Prospective Cohort Study. Jama, 274(2), 143-148.
IV non–AIDS
AIDS
517 (19.2) 23 4.71 (3.55–6.13) 6.73 (3.48–14.23)
CD4 lymphocytes, x 109/L
>0.35
0.20–0.35
<0.20
1025 (38.0)
634 (23.6)
1036 (38.4)
11
17
55
0.70 (0.35–1.25)
1.79 (1.04–2.87)
4.71 (3.55–6.13)
1.00
2.56 (1.13–6.04)
6.73 (3.48–14.23)
Delayed-type hypersensitivity skin test status
Tuberculin-negative nonanergic
Anergic
Tuberculin-positive
849 (31.5)
1649 (61.2)
197 (7.3)
6
62
15
0.45 (0.16–0.97)
3.00 (2.30–3.85)
5.42 (3.04–8.95)
1.00
6.66 (2.92–18.99)
12.00 (4.46–38.22)
Intervention During study period 104 subjects started preventive therapy for tuberculosis (34 were tuberculin-positive and 70 were anergic at baseline); only 29 subjects completed a 6–month course of preventive therapy.
Otherwise unclear which drug regimen was prescribed.
Length of follow up Follow up differed between participants over the study period (mean follow up 91 weeks).
Location Italy
Outcomes measures and effect size
Results of multivariate analysis:
Below is the incidence of tuberculosis by baseline tuberculin skin test status and CD4 lymphocyte count (only separable data for latent tuberculosis)

Appendix D: Evidence tables – RQ HH & II - Diagnosis of active TB
138
Bibliographic reference Antonucci, G., Girardi, E., Raviglione, M. C., Ippolito, G., Almi, P., Angarano, G., ... & Viale, P. (1995). Risk Factors for Tuberculosis in HIV-lnfected Persons: A Prospective Cohort Study. Jama, 274(2), 143-148.
No. with tuberculosis/Total Incidence per 100 person-years (95% Confidence interval)
Hazard ratio (95% Confidence interval)
Tuberculin-positive
CD4 >0.35 x 10⁹/L 4/109 2.59 (0.70–6.62) 5.49 (1.32–27.09)
CD4 0.20–0.35 x 10⁹/L 5/56 6.54 (2.12–15.25) 14.78 (3.49–62.63)
CD4 <0.20 x 10⁹/L 6/32 13.33 (4.89–29.01) 31.18 (7.62–127.50)
Hazard ratio adjusted for tuberculin skin test status, CD4 lymphocyte count, history of tuberculosis, Centers for Disease Control clinical class, and the interaction term between tuberculin skin test status and CD4 lymphocyte count.
Source of funding Supported by Ministero della Sanita-Progetto AIDS grants.
Comments SUMMARY: Risk of tuberculosis can be more precisely quantified by jointly considering skin test reactivity and CD4 lymphocyte count. Incidence of active tuberculosis increased with decreasing levels of CD4 lymphocytes in the three groups of subjects with different skin test responsiveness; (including those who were tuberculin skin test positive at baseline).
Abbreviations:

Appendix D: Evidence tables – RQ HH & II - Diagnosis of active TB
139
A.1.27 Gessner BD, Weiss NS (1998)
Bibliographic reference Gessner, B. D., Weiss, N. S., & Nolan, C. M. (1998). Risk factors for pediatric tuberculosis infection and disease after household exposure to adult index cases in Alaska. The Journal of pediatrics, 132(3), 509-513.
Study type Cohort
Study outline Population does not exactly match population of interest. Participants were children with or without tuberculosis infection who were household contacts of an adult infected with tuberculosis, however data was separable for those children with latent infections.
Question is mostly relevant; discussing which factors make a child higher risk of developing active tuberculosis after latent infection but also what factors make a child of higher risk of latent infection in the first place, data was separable for the former question of interest.
It was stated that once diagnosed infected children were treated however it is unclear under what regimen they were treated for latent tuberculosis and whether all received the same standard of care. Unclear if the 30 villages in the area performed the same level of monitoring or care for the children and the infected adults.
Few baseline characteristics are reported
Risk factors for development of active tuberculosis gathered included: child’s age, race, gender, adult’s age and gender, number of children per household and exposure of the child to a parent with active disease. For the adult: level of sputum smear and culture positivity, presence of cavity chest lesion on x-ray, the location of the chest lesion (lobe), the presence of cough and a history of tuberculosis infection or active disease, and the season for which treatment began for the adult.
Multivariate analysis was performed using backwards multiple regression models.
Definition of risk factors was clear however the methods used to observe risk factors are unlikely to be reliable as data was recorded retrospectively.
Definition of diagnosis of active and latent tuberculosis was not stated in full and the methods used to observe risk factors are unlikely to be reliable as data was recorded retrospectively.
Observation period was for 7 years between 1987 and 1994. Unclear if length of observation was the same for all children (or if adjustments were made).
Number of patients Population: 282
Patient characteristics Included:

Appendix D: Evidence tables – RQ HH & II - Diagnosis of active TB
140
Bibliographic reference Gessner, B. D., Weiss, N. S., & Nolan, C. M. (1998). Risk factors for pediatric tuberculosis infection and disease after household exposure to adult index cases in Alaska. The Journal of pediatrics, 132(3), 509-513.
Medical records from 1987–1994
Adult aged 15 years or older with sputum positive for mycobacterium tuberculosis living in a house with at least one person younger than 15 years.
Excluded
Adults without pulmonary tuberculosis
No positive sputum culture in adults with tuberculosis
Child aged ≥15 years
No contact form available
No tuberculin skin test recorded in child
Positive result prior to the study documented
Baseline characteristics:
25% of children younger than 15 years living in a house with an adult who had sputum positive for M. tuberculosis became infected. The age of infected children ranged from 1 month to 14 years (median 7.2 years). Resided in 30 villages located in 15 of the 27 census areas in the state. Tuberculin skin test reaction size varied from 0 (3 children) to 38mm (median, 15).
Intervention It was stated that once diagnosed infected children were treated however it is unclear under what regimen they were treated for latent tuberculosis and whether all received the same standard of care.
Length of follow up Observation period was for 7 years between 1987 and 1994. Unclear if length of observation was the same for all children (or if adjustments were made).
Location Alaska
Outcomes measures and effect size
Results of multivariate analysis:
Below is the risk factors for progression to active disease among infected childhood contacts of adults with active

Appendix D: Evidence tables – RQ HH & II - Diagnosis of active TB
141
Bibliographic reference Gessner, B. D., Weiss, N. S., & Nolan, C. M. (1998). Risk factors for pediatric tuberculosis infection and disease after household exposure to adult index cases in Alaska. The Journal of pediatrics, 132(3), 509-513.
pulmonary tuberculosis in Alaska, 1987–1994. Active and latent disease is diagnosed according to the American Thoracic Society standards of 1990.
Potential risk factor Number with disease/number with risk factor (%)
Relative risk from univariate analysis (95% confidence interval)
Odds ratio from multivariate analysis (adjusted 95% confidence interval)
Left upper lobe lesion in adult
20/34 (59) 3.1 (1.5–6.4) 12 (2.2–65)
Alaska native child 25/55 (45) 3.6 (1.0–13.7) 8.9 (1.1–73)
Adult is parent of child 17/35 (49) 1.8 (0.9–3.3) 8.3 (1.6–44)
Age of child Continuous Continuous 1.5 (1.1–2.0)
3 or 4+ culture positive adults
22/46 (48) 2.3 (1.0–5.3) –
3 or 4+ smear positive adults
19/36 (53) 2.2 (1.1–4.3) –
Male adult 14/45 (31) 0.6 (0.4–1.1) –
Variables examining risk factors for infection and for active disease significant at the 90% confidence level after initial regression analysis were entered into the final regression models.
Source of funding Unclear source of funding
Comments SUMMARY: Among the 71 children in whom infection developed, Alaska Natives and younger children were more likely to progress to active tuberculosis, as were children exposed to a parent who had active tuberculosis and children exposed to any adult who had a left upper lobe chest lesion.
Abbreviations:

Appendix D: Evidence tables – RQ HH & II - Diagnosis of active TB
142
A.2 RQ II: For people with latent TB infection, is a drug treatment regimen effective in preventing the development of active TB in comparison with placebo? If so, which regimen is the most effective in preventing the development of active TB?
A.2.1 Menzies D, Long R et al (2008)
Bibliographic reference
Menzies D, Long R, Trajman A, Dion MJ, Yang J, Al Jahdali H, Memish Z, Khan K, Gardam M, Hoeppner V, Benedetti A, Schwartzman K.2008 Nov 18;149(10):689-97. Adverse events with 4 months of rifampin therapy or 9 months of isoniazid therapy for latent tuberculosis infection: a randomized trial.

Appendix D: Evidence tables – RQ HH & II - Diagnosis of active TB
143
Study type RCT
Study quality Population matches population of interest
Intervention matches intervention of interest
An appropriate method of randomisation and allocation concealment was used. Randomisation and allocation was controlled by a computer programme.
Groups were comparable at the baseline
Unclear if comparison groups received the same care apart from intervention studied since treatment was received at multiple sites in different countries.
Blinding: This study was an open-label study, neither the clinicians nor patients were blinded:
A blinded independent panel reviewed all possible adverse events in an attempt to eliminate bias in attribution or grading of adverse events
Hepatic changes were diagnosed on the basis of laboratory results and were graded using a standardized classification.
There was statistical difference in the number of participants that did not complete treatment within each group. Unclear if there were systematic differences between groups in terms of those for whom no outcome data was available. Groups were comparable for number for which no outcome data was available.
Follow up beyond treatment period is not specified.
Investigator blinding: once 75% of the planned total sample size had been randomly assigned, a planned interim analysis was performed revealing to the blinded data and safety monitoring board that the frequency of serious adverse events was significantly lower in one trial group. Once unblinded the board recommended discontinuation of enrolment earlier than planned.
The study used a precise definition of outcome and a valid and reliable method was used to determine the outcome.
Number of patients Randomised= 847
9 months of isoniazid: 427 patients
4 months of rifampicin: 420 patients
Outcome data for serious adverse events available for = 847
4 months of rifampicin group: 418 patients
9 months of isoniazid: 421 patients
Outcome data for completion of therapy was available for:
4 months of rifampicin group: 420 patients
9 months of isoniazid: 427 patients
Patient characteristics Patients taken from sites in Canada, Brazil and Saudi Arabia
Inclusion:
Aged 18 or older,
Documented tuberculin skin test (PPD) meeting criteria for a positive result.

Appendix D: Evidence tables – RQ HH & II - Diagnosis of active TB
144
Exclusion:
Contacts of rifampin or isoniazid resistant cases,
Allergic to either medication
Taking concomitant medications that could have significant potential drug interactions.
Baseline characteristics:
Characteristic 4 Months rifampicin (n=420), n (%) 9 Months isoniazid (n=427), n (%)
Age
18-34 y
≥35 y
229 (55)
191 (45)
242 (57)
185 (43)
Sex
Male
Female
218 (52)
201 (48)
228 (53)
199 (47)
TST size
5-9 mm
10-14 mm
≥15mm
23 (6)
150 (36)
247 (59)
20 (5)
132 (31)
275 (64)
History of BCG vaccination
Yes
No
Unknown
224 (54)
101 (24)
95 (33)
199 (47)
121 (28)
107 (25)
Intervention 9- month regimen of daily isoniazid
Dose: 5 mg/kg, up to 300 mg/d
All patients seen on an outpatient basis.
Comparison 4- month regimen of daily rifampicin
Dose: 10mg/kg, up to 600 mg/d
All patients seen on an outpatient basis.
Length of follow up Could continue until a month after treatment regimen finishes
Location Tuberculosis clinics located in university hospitals in Canada, Brazil and Saudi Arabia.
Outcomes measures and effect size
Adverse events: (Primary outcome: Grade 3/4 adverse events)
Number to experience hepatotoxicity, defined as liver aminotransferase levels that increased to 3/5 to 10 times the upper limit of normal in the presence of compatible symptoms (grade 3) or ≥10 time the upper limit of normal (grade 4): n(%)

Appendix D: Evidence tables – RQ HH & II - Diagnosis of active TB
145
4- month rifampicin group = 3 of 420 (0.7)
9- month isoniazid group = 16 of 427 (3.8)
Risk difference (95% CI) = -3 (-5 to -1)
i.e. statistically significant
Number to experience rash (grade 1 or 2): n%
Number to experience rash: n (%)
4- month rifampin group = 9 of 420 (2.1)
9- month isoniazid group = 5 of 427 (1.2)
Risk difference (95% CI) = 1 (-1 to 3) i.e. not statistically significant.
Gastro intestinal intolerance
4- month rifampin group = 1 of 420 (0.2)
9- month isoniazid group = 2 of 427 (0.5)
Adherence:
Number to complete therapy, defined as taking more than 80% of doses within a maximum of 150 days for 4 months of rifampicin or 301 days for 9 months of isoniazid. n (%)
4- month rifampicin group = 328 of 420 (78)
9- month isoniazid group = 255 of 427 (60)
Risk difference (95% CI) = 18 (12 to 24)
i.e. statistically significant.
Source of funding The Canadian Institute of Health Research
Comments

Appendix D: Evidence tables – RQ HH & II - Diagnosis of active TB
146
A.2.2 Samandari,T., Agizew,T.B., et al. (2011)
Bibliographic reference Samandari,T., Agizew,T.B., et al. 6-month versus 36-month isoniazid preventive treatment for tuberculosis in adults with HIV infection in Botswana: a randomised, double-blind, placebo-controlled trial. Lancet, 2011 377 (9777) 1588-98.
Study type RCT
Study quality
Population does not exactly match the population of interest:
Tuberculin skin test negative patients were also enrolled however subgroup data is available.
Intervention matches the intervention of interest.
Appropriate method of randomisation included: computer generated randomisation list. Allocation concealed.
Double blind: clinicians and patients blinded; data and safety monitoring board, statistician and drug packaging company were unblinded. Investigators were blind to participant’s exposure. Unclear if investigators were blinded for other confounding factors.
Groups were comparable at baseline
Unclear if groups were comparable for treatment completion. Groups had a similar availability of outcome data.
Follow up: no follow up beyond treatment period (3 years)
A precise definition of outcome was used and a valid and reliable method employed to determine outcome.
Number of patients Randomized 1,995.
receiving 6 months Isoniazid- 989
receiving 36 months of Isoniazid- 1,006
Patient characteristics Inclusion
Age ≥18 years
HIV infection
Attendance of one of eight government clinics in Botswana
Exclusion
Symptoms of: Cough, weight loss, night sweats
Other acute illness
Previous isoniazid preventive therapy
TB treatment within the past 3 years
Neutrophil count of fewer than 1.0 x 10⁹ cells per L
Abnormal chest radiograph without antecedent tuberculosis or pneumonia.
Baseline characteristics
6 months isoniazid n (%) 36 months isoniazid. N (%)

Appendix D: Evidence tables – RQ HH & II - Diagnosis of active TB
147
Bibliographic reference Samandari,T., Agizew,T.B., et al. 6-month versus 36-month isoniazid preventive treatment for tuberculosis in adults with HIV infection in Botswana: a randomised, double-blind, placebo-controlled trial. Lancet, 2011 377 (9777) 1588-98.
Women/men 721/268 (73/27) 715/291 (72/28)
History of tuberculosis 31 (3) 43 (4)
BCG scar present 773 (78) 787 (78)
Tuberculin skin test
<5mm (negative)
≥5mm (positive)
729 (74)
216 (22)
722 (72)
252 (25)
Antiretroviral therapy
Before enrolment
By month 36
19 (2)
463 (47)
32 (3)
483 (48)
Intervention For individuals weighing 30-49 kg:
300mg per day for 6 months
Supplementation with 25 mg vitamin B6 for full treatment period
For individuals weighing ≥ 50kg
400mg per day for 6 months (this was later changed to 300mg)¹
Supplementation with 25mg vitamin B6 for full treatment period
Following the initial 6 months of open label isoniazid, these patients were switched to a placebo for the remaining 30 months period.
Comparison For individuals weighing 30-49 kg:
300mg per day for 36 months
Supplementation with 25 mg vitamin B6
For individuals weighing ≥ 50kg
400mg per day for 36 months (this was later changed to 300mg)¹
Supplementation with 25mg vitamin B6
Length of follow up No follow up beyond treatment period (3 years)
Location Government HIV care clinics in Botswana
Outcomes measures and effect size
Incidence of active tuberculosis
Defined as clinical presentation consistent with tuberculosis and response to anti-tuberculosis therapy.
Incident disease was categorised as:

Appendix D: Evidence tables – RQ HH & II - Diagnosis of active TB
148
Bibliographic reference Samandari,T., Agizew,T.B., et al. 6-month versus 36-month isoniazid preventive treatment for tuberculosis in adults with HIV infection in Botswana: a randomised, double-blind, placebo-controlled trial. Lancet, 2011 377 (9777) 1588-98.
“definite” if one or more cultures were positive for tuberculosis and speciated as M. tuberculosis or if two or more sputum smears were positive for acid-fast bacilli.
“probable” if one sputum smear or one biopsy specimen was positive for acid fast bacilli.
“possible” if smears or cultures were negative or not done.
In tuberculin skin test positive patients:
Number of definite, probable and possible tuberculosis cases: (rate per 100 person years)
6 month Isoniazid group: 13 (2.22)
36 month isoniazid group: 4 (0.57)
Hazard ratio (95% CI): 0.26 (0.09-0.80)
Number of definite and probable tuberculosis cases: (rate)
6 month Isoniazid group: 12 of 216 (2.05)
36 month isoniazid group: 4 of 252 (0.57)
Hazard ratio (95% CI): 0.28 (0.09-0.87)
In those who actually started the second masked phase of the trial (n=1655):
Number of definite and probable tuberculosis cases: (rate)
6 month Isoniazid group: 10 (2.30)
36 month isoniazid group: 1 (0.19)
Hazard ratio (95% CI): 0.09 (0.01-0.67)
Mortality
Number of deaths: (rate per 100 person years)
6 month isoniazid group: 13 of 216 (2.22)
36 month isoniazid group: 5 of 252 (0.71)
Hazard ratio (95% CI): 0.32 (0.11-0.90)
In those who actually started the masked phase of the trial (n=1655)
Number of deaths: (rate)
6 month isoniazid group: 9 (2.07)
36 month isoniazid group: 3 (0.58)
Hazard ratio (95% CI): 0.28 (0.08-1.03)
Hepatitis
No subgroup data available for rates of hepatitis in patients that were TST positive.

Appendix D: Evidence tables – RQ HH & II - Diagnosis of active TB
149
Bibliographic reference Samandari,T., Agizew,T.B., et al. 6-month versus 36-month isoniazid preventive treatment for tuberculosis in adults with HIV infection in Botswana: a randomised, double-blind, placebo-controlled trial. Lancet, 2011 377 (9777) 1588-98.
Source of funding US Centers for Disease Control and Prevention and US Agency for International Development
Comments This publication provided data specifically for TST positive patients (with regards to the incidence of mortality and active tuberculosis however data was not split into subgroups for the incidence of hepatitis. Should indirect evidence be required this paper could provide a good source of additional data.
¹ All patients in both treatment arms ultimately received 300mg daily doses as a result of changes in national guidelines at the time of trial.
Abbreviations: TST- tuberculin skin test

Appendix D: Evidence tables – RQ HH & II - Diagnosis of active TB
150
A.2.3 Halsey,N.A., Coberly,J.S., (1998)
Bibliographic reference Halsey,N.A., Coberly,J.S., et al. Randomised trial of isoniazid versus rifampicin and pyrazinamide for prevention of tuberculosis in HIV-1 infection Lancet 1998 351 (9105) 786-92.
Study type RCT
Study quality This was a prospective, randomised, unblinded trial
Randomisation: this was performed by the project coordinator using sealed sequentially numbered envelopes.
Allocation: Sealed envelopes were possibly opaque but uncertain. Project coordinator organised the method; however, there was no certainty over whether this person had any other influence. Otherwise it is likely that allocation was adequately blinded.
Blinding: trial was “unmasked” and neither patients nor physicians were blinded; investigators were kept blind to participant’s exposure to the intervention.
Attrition: loss to follow up was similar in both treatment arms as were the amount for which no outcome data was available.
There was no significant difference between participants lost to follow up between the two arms of study.
Comparison groups were similar at baseline with respect to all important characteristics, except that more in the rifampicin and pyrazinamide group had “ever drunk alcohol.”
Comparison groups received the same care apart from the intervention studied. Follow up was also similar between the two groups.
Length of follow up was appropriate.
A valid and reliable method was used to determine primary outcome.
Intervention matches the intervention of interest:
Population matches the population of interest:
Number of patients Randomised: 750 patients,
370 received Isoniazid and pyridoxine
380 received rifampicin and pyrazinamide
Patient characteristics Inclusion
Aged 16-77 years
HIV-1 seropositive
Positive PPD skin test of at least 5mm
Normal chest radiograph
No evidence of extrapulmonary TB
Aspartate aminotransferase of less than 3 times upper normal limit
Total bilirubin of less than 43 µmoles/L
Serum creatinine of less than 221 µmoles/L

Appendix D: Evidence tables – RQ HH & II - Diagnosis of active TB
151
Bibliographic reference Halsey,N.A., Coberly,J.S., et al. Randomised trial of isoniazid versus rifampicin and pyrazinamide for prevention of tuberculosis in HIV-1 infection Lancet 1998 351 (9105) 786-92.
Platelet count of more than 100000/µL
White blood cell count of more than 4000/mL
Weight over 25kg
Informed consent
Exclusion
Pregnancy
Negative PPD test.
Baseline characteristics
Characteristics Isoniazid group (n=370) Rifampicin and pyrazinamide (n=380)
P-value
Mean age 31 31 0.99
Male 108 129 0.18
Ever smoked 67 83 0.23
Ever drunk alcohol 9 26 0.005
Mean PPD size (mm) 11.7 11.7 0.75
Mean entry CD4/CD8 0.57 0.56 0.73
Intervention Isoniazid group:
For patients under 50kg:
600mg isoniazid and 25mg pyridoxine, twice weekly for 6 months
For patients over 50kg:
800mg Isoniazid and 25mg pyridoxine, twice weekly for 6 months
Participants were given two doses each week: the first given under direct supervision and the second to be taken at home three days later unsupervised.
Comparison Rifampicin and Pyrazinamide group:
For patients under 40kg weight:
450 mg rifampicin and 1500mg pyrazinamide, twice weekly for 2 months
For patients over 40kg:
450mg rifampicin and 2000mg pyrazinamide, twice weekly for 2 months
Participants were given two doses each week: the first given under direct supervision and the second to be taken at home three days later unsupervised.
Length of follow up Participants were followed up for up to 4 years.

Appendix D: Evidence tables – RQ HH & II - Diagnosis of active TB
152
Bibliographic reference Halsey,N.A., Coberly,J.S., et al. Randomised trial of isoniazid versus rifampicin and pyrazinamide for prevention of tuberculosis in HIV-1 infection Lancet 1998 351 (9105) 786-92.
median follow up was 2.5 years.
Location Haiti
Outcomes measures and effect size
Incidence of active tuberculosis
At 36 months:
Hazard ratio for participants on rifampicin and pyrazinamide compared to those on isoniazid was 1.3 (95% CI 0.68-2.70).
Annualised risk of developing TB= 1.8% for RIF/PYR and 1.7% for the isoniazid group.
Cumulative risks 5.4% and 5.1% respectively (RR 1.1, p=0.90)
At 10 months
The cumulative risk of tuberculosis was higher among those on RIF/PYR compared with those on ISO/PYR (3.7% vs 1.0%, Risk ratio 3.7, p=0.03)
Isoniazid group (n=370) Rifampicin and pyrazinamide group (n=380)
Total (n=750)
P
Culture confirmed 5 10 15
Sputum smear positive 2 5 7
Clinically compatible with response to TB
7 4 11
total 14 (3.8%) 19 (5.0%) 33 0.21
Source of funding Contract from the Division of Tuberculosis Elimination Branch of the Centers for Disease Control and Prevention
Comments
Abbreviations: PPD- Purified protein derivative (also known as the Mantoux test or TST test)

Appendix D: Evidence tables – RQ HH & II - Diagnosis of active TB
153
A.2.4 Pape,J.W., Jean,S.S., et al. (1993)
Bibliographic reference Pape,J.W., Jean,S.S., et al. Effect of isoniazid prophylaxis on incidence of active tuberculosis and progression of HIV infection. Lancet 1993 342 (8866) 268-72.
Study type RCT
Study quality Randomisation: appropriate method of computerised randomisation was used and there was adequate concealment of allocation.
Comparison: there were more PPD positive patients in the isoniazid group, which for the purposes of our study meant that there was more patients in total in the isoniazid group (38) than the no antituberculosis chemotherapy group (25). Otherwise patients were comparable at baseline.
Follow up in person–years was greater for the isoniazid group.
Blinding: neither the participants nor the clinicians were blinded; investigators were kept blind to the exposure of participants though it was unclear if they were kept blind to other important confounding factors
Loss to follow up: the groups were comparable in terms of numbers of those lost to follow up and for whom no outcome data was available
Length of follow up: appropriate
Outcome: There was a precise and definite definition and investigation of outcome.
Intervention matches the intervention of interest:
Population matches the population of interest:
Intention-to-treat principle was applied
Number of patients Number of PPD positive patients randomised- 63,
No antituberculosis chemotherapy group: 25
isoniazid group: 38
Patient characteristics Inclusion
Symptom free, newly diagnosed HIV-infected individuals
Aged 18-65 years
Exclusion
History of tuberculosis
Abnormal Chest radiograph
Abnormal Liver Function tests
Baseline Characteristics
Characteristics No antituberculosis chemotherapy Isoniazid group (n=58)

Appendix D: Evidence tables – RQ HH & II - Diagnosis of active TB
154
Bibliographic reference Pape,J.W., Jean,S.S., et al. Effect of isoniazid prophylaxis on incidence of active tuberculosis and progression of HIV infection. Lancet 1993 342 (8866) 268-72.
group (n=60)
Mean (SD) age 30.6 (7.6) 31.1 (6.6)
M/F 11/49 16/42
Months of follow up 33.5 39.1
PPD positive (%) 25 (42%) 38 (66%)
Intervention 12 months of
daily isoniazid (300mg)
vitamin B6 (50mg)
Self-administered
Comparison No antituberculosis chemotherapy group
12 months of daily vitamin B6 (50mg)
Length of follow up Mean months of follow up (range)
No antituberculosis chemotherapy group= 33.5 months (5.0-60.2)
Isoniazid group= 39.1 (3.0-60.7)
Location Haiti- Institute National de Laboratoire et de Recherches in Port-au-Prince
Outcomes measures and effect size
Incidence of active tuberculosis
PPD positive B6 Alone Isoniazid + B6
N 25 38
No (%) of TB cases 6 (24) 2 (5)
Follow up time (person years) 61 118
Incidence (per 100 person-years) 5.7 3.2
RR for tuberculosis (95% CI) 1.8 (0.4-9.2) 1
Mortality
PPD positive B6 Alone Isoniazid + B6
No (%) of deaths 7 (28) 3 (8)
Follow up time (person years) 61 118
RR for death (95% CI) 3.6 (1.0–12.4) 1
Source of funding US Public Health Service

Appendix D: Evidence tables – RQ HH & II - Diagnosis of active TB
155
Bibliographic reference Pape,J.W., Jean,S.S., et al. Effect of isoniazid prophylaxis on incidence of active tuberculosis and progression of HIV infection. Lancet 1993 342 (8866) 268-72.
Comments Enrolment began in 1986.
Enrolment was closed when isoniazid prophylaxis for PPD-positive HIV-infected patients was recommended in 1989. An interim analysis was done in January, 1990, and all subjects in the B6 group were offered isoniazid plus B6 for 12 months; 21 of 60 accepted. Intention-to-treat principle was applied.
Abbreviations:PPD- purified protein derivative

Appendix D: Evidence tables – RQ HH & II - Diagnosis of active TB
156
A.2.5 Anon (1982)
Bibliographic reference
Anon. Bulletin of the World Health Organization 1982 60 (4) 555-64. Efficacy of various durations of isoniazid preventive therapy for tuberculosis: five years of follow-up in the IUAT trial. International Union Against Tuberculosis Committee on Prophylaxis
Study type Randomised Controlled Trial
Study quality Population: Participants match the population of interest: patients were required to have fibrotic lesions of probable tuberculosis origin that had been stable during the year prior to entry. As well as a positive PPD skin test.
Intervention matches intervention of interest:
Randomisation: An appropriate method of randomisation was used with patients assigned random ID numbers and a matching supply of pills.
Allocation: Allocation concealment was applied
Comparison Groups: All groups were comparable at baseline although the study merely stated the treatment arms were similar and did not provide a table.
Populations were taken from 115 dispensaries in seven European countries: Czechoslovakia, Finland, Germany, Hungary, Poland, Romania and Yugoslavia; Comparison groups may not have received the same care apart from the intervention.
Blinding: Both participants and clinicians were kept blind to treatment allocation.
Follow up: Completion rates were inversely proportional to duration of treatment under study. Therefore loss to follow up was greater in the longer duration treatment arms. Follow up was of an appropriate duration
Outcome: There was a precise definition and a valid reliable method used to determine the outcome. Investigators were kept blind to participant’s exposure to intervention.
Number of patients 27,830 participants in total remained in the trial after exclusion.
12 weeks of isoniazid: 6956 (25%)
24 weeks of isoniazid: 6965 (25%)
52 weeks of isoniazid: 6919 (24.9%)
12 weeks of placebo: 2350 (8.4%)
24 weeks of placebo: 2338 (8.4%)
52 weeks of placebo: 2302 (8.3%)
Patient characteristics Inclusion
Fibrotic Lesions:
Well- delineated radiographic lesions
Of probably tuberculosis origin
Stable during the year prior to entry.

Appendix D: Evidence tables – RQ HH & II - Diagnosis of active TB
157
Bibliographic reference
Anon. Bulletin of the World Health Organization 1982 60 (4) 555-64. Efficacy of various durations of isoniazid preventive therapy for tuberculosis: five years of follow-up in the IUAT trial. International Union Against Tuberculosis Committee on Prophylaxis
Greater than 5mm induration of Mantoux test (PPD positive)
Persons 20-64 years of age (and “a few” who did not fit this category)
Exclusion
Less than 6mm induration to Mantoux test
Radiographic lesions limited to solitary calcifications or thickening of apical or diaphragmatic pleura
Previous treatment with antituberculosis drugs
Previous record of positive bacteriological findings
Baseline Characteristics
Age:
Median age: 50 years.
Population skewed towards older age groups (38% between 55 and 65 years of age)
Sex:
53% Male
47% female
Median Induration size to tuberculin:
15mm (range 6-90mm)
Intervention 300mg of Isoniazid, Daily for:
12 weeks
24 weeks
52 weeks
Comparison Placebo, Daily for
12 weeks
24 weeks
52 weeks
Length of follow up 5 years
Location Populations were taken from 115 dispensaries in seven European countries: Czechoslovakia, Finland, Germany, Hungary, Poland, Romania and Yugoslavia.

Appendix D: Evidence tables – RQ HH & II - Diagnosis of active TB
158
Bibliographic reference
Anon. Bulletin of the World Health Organization 1982 60 (4) 555-64. Efficacy of various durations of isoniazid preventive therapy for tuberculosis: five years of follow-up in the IUAT trial. International Union Against Tuberculosis Committee on Prophylaxis
Outcomes measures and effect size
Tuberculosis incidence:
Case rates of tuberculosis:
For all participants
For Patients who completed treatment AND complied with 80% of daily doses.
Tuberculosis was considered to be confirmed only if tubercle bacilli were grown in culture.
Regimen n of participants Cumulative n of cases
5 year incidence (per 1000)
Risk Differenceª (95% CI¹)
Relative riskª (95% CI¹)
Placebo 6990 97 14.3 0 1.00
12 weeks Isoniazid
6956 76 11.3 -0.003 (-0.005- 0.000)
0.79 (0.58-1.06)
24 weeks Isoniazid
6965 34 5.0 -0.009 (-0.010- -0.007)
0.35 (0.24-0.52)
52 weeks Isoniazid
6919 24 3.6 -0.01 (-0.012- -0.009)
0.25 (0.16-0.39)
Regimen n of participants Cumulative n of cases
5 year incidence (per 1000)
Percentage reduction
Relative risk
Placebo 5616 83 15.0 0 13.6
12 weeks Isoniazid
6039 61 10.4 31 9.4
24 weeks Isoniazid
5437 25 4.7 69 4.3
52 weeks Isoniazid
4543 5 1.1 93 1.0
Adherence
Compliance defined as 80% of pills taken daily
Completion defined as patients continuing to participate in the trial.
Percentage weeks completed (complied to therapy)
Duration Product 12 24 36 52

Appendix D: Evidence tables – RQ HH & II - Diagnosis of active TB
159
Bibliographic reference
Anon. Bulletin of the World Health Organization 1982 60 (4) 555-64. Efficacy of various durations of isoniazid preventive therapy for tuberculosis: five years of follow-up in the IUAT trial. International Union Against Tuberculosis Committee on Prophylaxis
12 weeks Isoniazid 95 (87)
Placebo 97 (91)
24 weeks Isoniazid 94 (84) 93 (78)
Placebo 96 (87) 95 (82)
52 weeks Isoniazid 93 (84) 91 (79) 89 (73) 88 (68)
Placebo 95 (87) 93 (79) 91 (74) 90 (69)
Risk of Hepatitis
Risk of hepatitis by quarter (per 1000 persons)
Risk by quarter Placebo Isoniazid Excess
Placebo isoniazid excess placebo isoniazid excess
Weeks P I I-P P I I-P risk reduction, (cases prevented per 1000)
1-12
13-24
25-36
37-52
0.7
0.5
0.0
0.0
3.2
1.6
0.8
0.8
2.5
1.0
0.8
0.8
0.7
1.2
1.2
1.2
3.2
4.8
5.6
6.4
2.5
3.6
4.4
5.2
2.7
1.6
0.8
standard
Benefit to risk ratio by regimen and year
Year of follow- up Regimen Cumulative No. of tuberculosis cases prevented
Cumulative no. of hepatitis cases incurred
Benefit to risk ratio
First 12 weeks
24 weeks
52 weeks
2.6
3.9
3.6
2.5
3.6
5.2
1.0
1.1
0.7
Second 12 weeks
24 weeks
52 weeks
2.9
5.5
5.3
2.5
3.6
5.2
1.2
1.5
1.0
Third 12 weeks 3.6 2.5 1.4

Appendix D: Evidence tables – RQ HH & II - Diagnosis of active TB
160
Bibliographic reference
Anon. Bulletin of the World Health Organization 1982 60 (4) 555-64. Efficacy of various durations of isoniazid preventive therapy for tuberculosis: five years of follow-up in the IUAT trial. International Union Against Tuberculosis Committee on Prophylaxis
24 weeks
52 weeks
7.6
8.0
3.6
5.2
2.1
1.5
Fourth 12 weeks
24 weeks
52 weeks
3.9
8.8
9.3
2.5
3.6
5.2
1.6
2.4
1.8
fifth 12 weeks
24 weeks
52 weeks
3.0
9.3
10.7
2.5
3.6
5.2
1.2
2.6
2.1
Definition of Hepatitis was unclear.
Source of funding Scientific Committee on Prophylaxis of the International Union Against Tuberculosis “conception and support of the trial”
Comments ªData calculated by technical analyst.
¹CI- Confidence interval

Appendix D: Evidence tables – RQ HH & II - Diagnosis of active TB
161
A.2.6 Schechter,M., Zajdenverg,R., et al. (2006)
Bibliographic reference
Schechter,M., Zajdenverg,R., et al. American Journal of Respiratory & Critical Care Medicine 2006 173 (8) 922-26.Weekly rifapentine/isoniazid or daily rifampin/pyrazinamide for latent tuberculosis in household contacts
Study type RCT
Study quality Population matches population of interest
Intervention matches intervention of interest
Randomisation: Participants were block randomised by households, methods described.
Allocation: Allocation was concealed.
Blinding: neither the participants nor the clinicians were blinded.
Comparison:
The groups were comparable at baseline
Groups did not receive exactly the same care apart from the intervention, participants in the pyrazinamide/rifampicin group had to take their medication daily and mostly unsupervised. Patients in the rifapentine/Isoniazid group were directly observed for every dose given.
The pyrazinamide/rifampicin group were seen once more in follow up.
Attrition: Groups were similar in regard to length of follow up and loss to follow up. Attrition was similar between the two arms of study.
Unclear definition of outcome in regard to diagnosis of tuberculosis
Unclear if investigators were kept blind to treatment arms or confounding factors (unlikely)
Number of patients N= 399
Rifampicin and pyrazinamide= 193
Rifapentine and isoniazid= 206
Data available after treatment completion and follow up
Rifampicin and pyrazinamide= 193
Rifapentine and isoniazid= 206
Loss to follow up
Rifampicin and pyrazinamide= 5
Rifapentine and isoniazid= 3
Patient characteristics Inclusion criteria
Household contacts of patients with newly diagnosed pulmonary TB at public clinics in Rio de Janeiro who slept 2 nights or more per week in the same dwelling as the index case
¹TST positive- induration ≥ 5 mm

Appendix D: Evidence tables – RQ HH & II - Diagnosis of active TB
162
Bibliographic reference
Schechter,M., Zajdenverg,R., et al. American Journal of Respiratory & Critical Care Medicine 2006 173 (8) 922-26.Weekly rifapentine/isoniazid or daily rifampin/pyrazinamide for latent tuberculosis in household contacts
No TB symptoms
Chest radiograph without evidence of active TB
Exclusion criteria
Evidence of liver or renal dysfunction
Evidence of anaemia
Received TB drugs for more than 1 month
Baseline characteristics
Variable Rifapentine and isoniazid group Rifampicin and pyrazinamide
N of subjects 206 193
Mean age (y) 37.7 37.0
Sex m/f (%) 37/63 44/56
HIV (%) 0.5 0
BCG vaccination (%) 65 66
Smoker (%) 22 25
Alcohol (%) 34.5 38
Injection drug use (%) 0 0.5
Ever in prison (%) 0 0
Intervention Rifapentine and isoniazid
rifapentine 900 mg once weekly for 12 weeks
isoniazid 900 mg once weekly for 12 weeks
Directly observed in the clinic
Comparison Rifampicin and pyrazinamide
For weight < 50 kg
rifampicin 450 mg once daily for 8 weeks
pyrazinamide 750 mg once daily for 8 weeks
For weight ≥ 50 kg
rifampicin 600 mg once daily for 8 weeks
pyrazinamide 1500 mg once daily for 8 weeks
One dose directly observed, the rest self administered

Appendix D: Evidence tables – RQ HH & II - Diagnosis of active TB
163
Bibliographic reference
Schechter,M., Zajdenverg,R., et al. American Journal of Respiratory & Critical Care Medicine 2006 173 (8) 922-26.Weekly rifapentine/isoniazid or daily rifampin/pyrazinamide for latent tuberculosis in household contacts
Length of follow up Follow up for at least 2 years.
Location Rio de Janeiro, Brazil
Outcomes measures and effect size
Incidence of tuberculosis
TB evaluated with chest xray and sputum examination for smear and culture. Confirmed by reviewing medical records.
Rifapentine and isoniazid group:
3 cases in 564 person years of follow up (0.5/100 person-years)
Rifampicin and pyrazinamide group:
1 case in 522 person- years of follow up (0.2/100 person-years)
Relative risk, 2.8; 95% CI, 0.3-26.8; p=0.66
i.e. non significant
Mortality
Number of cases of death during follow up
Rifapentine and isoniazid group= 1 of 206
Rifampicin and pyrazinamide group= 3 of 193
Incidence of hepatotoxicity
Hepatotoxicity: Grade 3 defined as aspartate aminotransferase or alanine aminotransferase 5-10 times upper limit of normal. Grade 4 defined as aspartate aminotransferase or alanine aminotransferase > 10 times upper limit of normal.
Number of cases of grade 3 hepatotoxicity during follow up
Rifapentine and isoniazid group= 2 of 206
Rifampicin and pyrazinamide group= 14 of 193
Number of cases of grade 4 hepatotoxicity during follow up
Rifapentine and isoniazid group= 0 of 206
Rifampicin and pyrazinamide group= 11 of 193
Number of cases of grade 3 or 4 hepatotoxicity during follow up
Rifapentine and isoniazid group= 2 of 206
Rifampicin and pyrazinamide group= 20 of 193
Source of funding Supported by National Institutes of Health grants, and TW 05574, and Conselho Nacionde Desenvolvimento Cientifico e Tecnologico

Appendix D: Evidence tables – RQ HH & II - Diagnosis of active TB
164
Bibliographic reference
Schechter,M., Zajdenverg,R., et al. American Journal of Respiratory & Critical Care Medicine 2006 173 (8) 922-26.Weekly rifapentine/isoniazid or daily rifampin/pyrazinamide for latent tuberculosis in household contacts
Comments Trial was prematurely terminated because of unexpectedly high rates of hepatotoxicity in the rifampicin and pyrazinamide arm.
Abbreviations:
¹TST- Tuberculin Skin Test

Appendix D: Evidence tables – RQ HH & II - Diagnosis of active TB
165
A.2.7 Mwinga,A., Hosp,M., et al. (1998)
A.2.8 Quigley,M.A., Mwinga,A., et al (2001)
Bibliographic reference
Mwinga,A., Hosp,M., et al.
AIDS. 1998 12 (18) 2447-57.Twice weekly tuberculosis preventive therapy in HIV infection in Zambia
Quigley,M.A., Mwinga,A., et al.AIDS. 2001 15 (2) 215-22.Long-term effect of preventive therapy for tuberculosis in a cohort of HIV-infected Zambian adults.
Study type RCT
Study quality Population does not exactly match population of interest:
Patients without a positive TST¹ were included in the study (subgroup data available)
Intervention matches the intervention of interest
Randomisation: an appropriate method was used; computerised block randomisation.
Allocation was most likely adequately concealed providing sealed enveloped were opaque (unclear)
Baseline characteristics were similar with respect to all characteristics, any differences reported were non-significant.
Comparison groups received the same care apart from the interventions studied.
Blinding: Participants and clinicians were kept blind to treatment allocation. Investigators were blind to treatment groups however blinding to other confounding factors was unclear.
The groups were comparable for treatment completion in each group. However the amount for which no outcome data was available was greater in the rifampicin and pyrazinamide treatment arm.
The study uses a precise definition of outcome, however a valid and reliable method was not always used to determine the outcome: for example the diagnosis of TB may be made on the basis of a positive response to TB treatment following the failure of antibiotic treatment. This is unlikely to be highly specific.
Number of patients Subgroup (TST¹ ≥ 5 mm) = 161
Placebo group = 60
Isoniazid group = 52
Rifampicin and Pyrazinamide group = 49
From the total number enrolled in the study (n= 1080)
The following did not complete treatment:
Placebo group = 10
Isoniazid group = 8
Rifampicin and Pyrazinamide group = 9
The following had no outcome data available:

Appendix D: Evidence tables – RQ HH & II - Diagnosis of active TB
166
Bibliographic reference
Mwinga,A., Hosp,M., et al.
AIDS. 1998 12 (18) 2447-57.Twice weekly tuberculosis preventive therapy in HIV infection in Zambia
Quigley,M.A., Mwinga,A., et al.AIDS. 2001 15 (2) 215-22.Long-term effect of preventive therapy for tuberculosis in a cohort of HIV-infected Zambian adults.
Placebo group = 38
Isoniazid group = 34
Rifampicin and Pyrazinamide group = 55
Patient characteristics Inclusion
HIV positive
Over 15 years old
Excluded
Previous history of treatment for TB
Abnormal liver function tests
Evidence of TB (pulmonary or extra-pulmonary)
Pregnant
Unable to attend study clinic
Baseline characteristics
Placebo no. (%) Isoniazid no. (%) Rifampicin and Pyrazinamide no. (%)
Sex m/f 194/156 194/158 208/143
Age mean (SD) 30 (8.0) 30 (7.9) 31 (8.6)
Tuberculin skin test ≥ 5 mm 60 (27) 52 (23) 49 (22)
Visible BCG scar 281 (81) 278 (80) 268 (77)
Lymphocyte count (x109/l) <2
100 (36) 116 (39) 120 (42)
Intervention Patients = 101
3 months of rifampicin 600 mg, twice a week
And 3 months of pyrazinamide 3500 mg, twice a week =49
Or
6 months of isoniazid 900 mg twice a week = 52
All regimens self-administered

Appendix D: Evidence tables – RQ HH & II - Diagnosis of active TB
167
Bibliographic reference
Mwinga,A., Hosp,M., et al.
AIDS. 1998 12 (18) 2447-57.Twice weekly tuberculosis preventive therapy in HIV infection in Zambia
Quigley,M.A., Mwinga,A., et al.AIDS. 2001 15 (2) 215-22.Long-term effect of preventive therapy for tuberculosis in a cohort of HIV-infected Zambian adults.
Comparison Patients = 60
3 months of twice weekly placebo to match the rifampicin group or 6 months of a twice weekly placebo to match the isoniazid group = 60
Length of follow up Median follow up 1.8 years, maximum follow up 7 years.
Location Zambia
Outcomes measures and effect size
Incidence of TB
number of cases; total person years (rate per 100 person-years)
Placebo group: 9 of 98 (9.18)
Isoniazid group: 2 of 88 (2.27)
Rifampicin and pyrazinamide: 2 of 74 (2.70)
Mortality: cases; total person years (rate per 100 person-years)
Placebo group: 4 of 114 (3.51)
Isoniazid group: 7 of 93 (7.53)
Rifampicin and pyrazinamide: 9 of 78 (11.54)
Source of funding Supported by the World Health Organisation and the UK Department for International Development with additional support from the Beit Memorial Trust.
Comments
Abbreviations: ¹TST: Tuberculin Skin Test
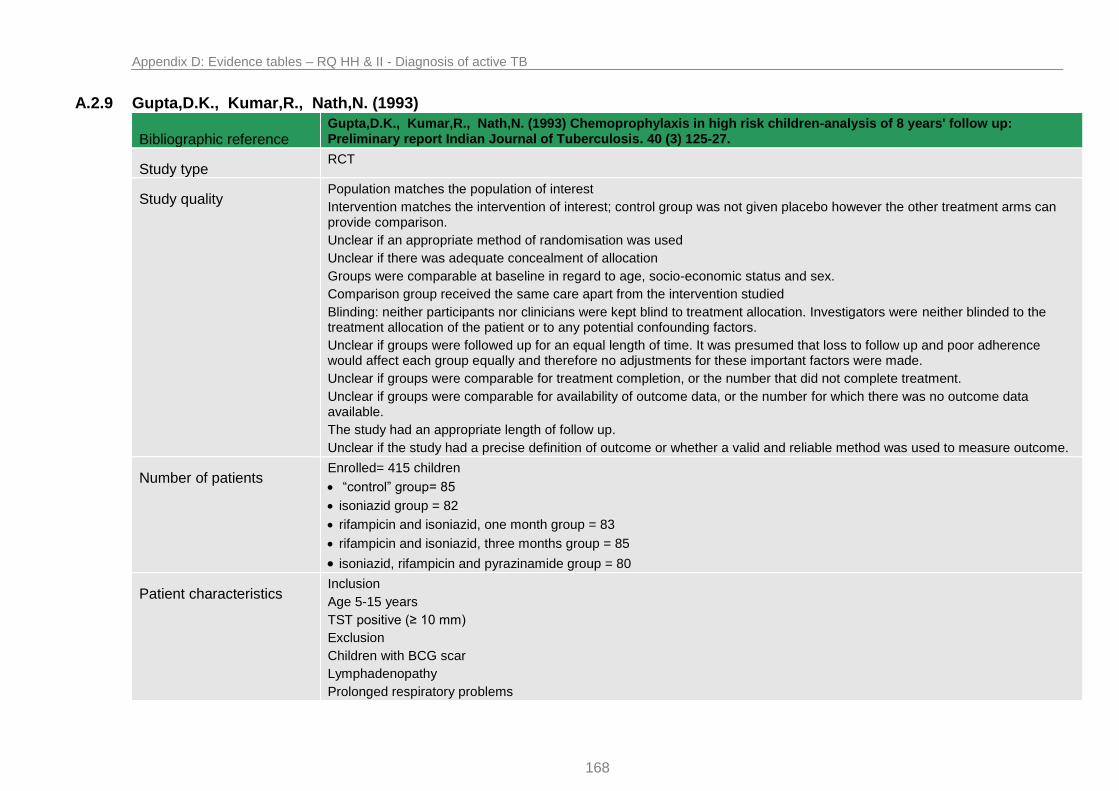
Appendix D: Evidence tables – RQ HH & II - Diagnosis of active TB
168
A.2.9 Gupta,D.K., Kumar,R., Nath,N. (1993)
Bibliographic reference Gupta,D.K., Kumar,R., Nath,N. (1993) Chemoprophylaxis in high risk children-analysis of 8 years' follow up: Preliminary report Indian Journal of Tuberculosis. 40 (3) 125-27.
Study type RCT
Study quality Population matches the population of interest
Intervention matches the intervention of interest; control group was not given placebo however the other treatment arms can provide comparison.
Unclear if an appropriate method of randomisation was used
Unclear if there was adequate concealment of allocation
Groups were comparable at baseline in regard to age, socio-economic status and sex.
Comparison group received the same care apart from the intervention studied
Blinding: neither participants nor clinicians were kept blind to treatment allocation. Investigators were neither blinded to the treatment allocation of the patient or to any potential confounding factors.
Unclear if groups were followed up for an equal length of time. It was presumed that loss to follow up and poor adherence would affect each group equally and therefore no adjustments for these important factors were made.
Unclear if groups were comparable for treatment completion, or the number that did not complete treatment.
Unclear if groups were comparable for availability of outcome data, or the number for which there was no outcome data available.
The study had an appropriate length of follow up.
Unclear if the study had a precise definition of outcome or whether a valid and reliable method was used to measure outcome.
Number of patients Enrolled= 415 children
“control” group= 85
isoniazid group = 82
rifampicin and isoniazid, one month group = 83
rifampicin and isoniazid, three months group = 85
isoniazid, rifampicin and pyrazinamide group = 80
Patient characteristics Inclusion
Age 5-15 years
TST positive (≥ 10 mm)
Exclusion
Children with BCG scar
Lymphadenopathy
Prolonged respiratory problems

Appendix D: Evidence tables – RQ HH & II - Diagnosis of active TB
169
Bibliographic reference Gupta,D.K., Kumar,R., Nath,N. (1993) Chemoprophylaxis in high risk children-analysis of 8 years' follow up: Preliminary report Indian Journal of Tuberculosis. 40 (3) 125-27.
Baseline characteristics
No treatment group
Isoniazid group Isoniazid and rifampicin group, 1 month
Isoniazid group and rifampicin group, 3 months
Isoniazid, rifampicin and pyrazinamide group
Sex m/f 46/39 42/40 42/41 43/42 42/38
Age 5-10 42 40 41 42 40
Age 11-15 43 42 42 43 40
Intervention Isoniazid = 82
Daily 15 mg/kg bodyweight to a maximum of 300 mg daily, for 3 months
Rifampicin and isoniazid = 83
Daily isoniazid 15 mg/kg bodyweight to a maximum of 300 mg daily, for 1 month
Daily rifampicin 10 mg/kg bodyweight, for 1 month
Rifampicin and isoniazid = 85
Daily isoniazid 15 mg/kg bodyweight to a maximum of 300 mg daily, for 3 months
Daily rifampicin 10 mg/kg bodyweight, for 3 months
Rifampicin, pyrazinamide and isoniazid = 80
Daily isoniazid 15 mg/kg bodyweight to a maximum of 300 mg daily, for 1 month
Daily rifampicin 10 mg/kg bodyweight, for 1 month
Daily pyrazinamide 30 mg/kg bodyweight for 1 month
Comparison “Control” group= 85
not given any treatment
Length of follow up 8 years follow up
Location India
Outcomes measures and effect size
Incidence of active TB (cases)
Group receiving no treatment= 17 of 85
Group receiving isoniazid alone= 10 of 82
Group receiving isoniazid and rifampicin for 1 month = 9 of 83

Appendix D: Evidence tables – RQ HH & II - Diagnosis of active TB
170
Bibliographic reference Gupta,D.K., Kumar,R., Nath,N. (1993) Chemoprophylaxis in high risk children-analysis of 8 years' follow up: Preliminary report Indian Journal of Tuberculosis. 40 (3) 125-27.
Group receiving isoniazid and rifampicin for 3 months = 4 of 85
Group receiving isoniazid, pyrazinamide and rifampicin for 1 month = 0 of 80
Source of funding Unclear
Comments This paper was a preliminary report, unable to find full paper if one exists.

Appendix D: Evidence tables – RQ HH & II - Diagnosis of active TB
171
A.2.10 Hawken M.P., Meme H.K., et al. (1997)
Bibliographic reference Hawken,M.P., Meme,H.K., et al. 1997. Isoniazid preventive therapy for tuberculosis in HIV-1-infected adults: results of a randomized controlled trial. AIDS. 11 (7) 875-82.
Study type RCT
Study quality Population matches population of interest
TST negative patients were included in the study however subgroup analysis was possible
Intervention matches intervention of interest
Randomisation: an appropriate method of randomisation was used; computerised block randomisation. Allocation was adequately concealed.
Groups were not comparable at baseline; there were differences in sex, generalized lymphadenopathy and history of herpes zoster infection. All other characteristics were similar.
Groups were recruited at three different clinical sites where care may have differed.
Blinding: participants and clinicians were kept blind to treatment allocation. Investigators were blind to treatment allocation although it is unclear if they were blinded to other confounding factors.
Follow up was analysed to adjust for differences between lengths of follow up between patients.
Unclear how many participants did not complete treatment in each treatment group
Unclear how many participants there were in each group for which no outcome data was available
The study had an appropriate length of follow up
There was a precise definition of outcome and a valid and reliable method was used to determine the outcome.
Number of patients Randomized = 684 participants
Isoniazid group = 342
Placebo group = 342
Subgroup (TST¹ positive)
Isoniazid group = 67
Placebo group = 69
Patient characteristics Inclusion
HIV-1 positive
Age 14-65 years
Resident in Nairobi
Exclusion
Past history of TB

Appendix D: Evidence tables – RQ HH & II - Diagnosis of active TB
172
Suspicion of current TB (symptomatic)
Adenopathy greater than 2cm in diameter
Abnormal liver enzymes
Life-threatening intercurrent illness
Pregnant
Baseline Characteristics
Isoniazid (n= 342) Placebo (n= 342)
Mean age (years) 31.1 31.1
Female 217 196
Study Clinic
Group 1
Group 2
Group 3
78
159
114
77
149
116
BCG scar visible 256 248
Generalised lymphadenopathy 40 26
Herpes zoster 103 80
TST¹ positive (≥ 5 mm) 67 69
Total lymphocyte count (x109/l) 5.5 (2.7-10.8) 5.5 (2.6-17.4)
Intervention Isoniazid group = 342 participants
300 mg daily, for 6 months
Self-administered
Comparison Placebo group = 342 participants
Placebo, for 6 months
Self-administered
Length of follow up Median length of follow up: (range)
isoniazid group: 1.83 (0-3.41)
placebo group:1.82 (0-3.37)
Location Nairobi, Kenya
Outcomes measures and effect size
Incidence of active tuberculosis:
In TST¹ positive subgroup, given per 100 person years of observation (95 % confidence interval)

Appendix D: Evidence tables – RQ HH & II - Diagnosis of active TB
173
Isoniazid Group: 5.59 (2.25-11.51)
Placebo group: 8.03 (3.85-14.77)
Adjusted risk ratio was 0.60 (95% CI, 0.23-1.60)
i.e. not significant
Mortality
In TST¹ positive subgroup, given as adjusted mortality risk ratio for Isoniazid versus placebo (95 % confidence interval)
Risk ratio was 0.33 (95% CI, 0.09-1.23)
i.e. not significant
Source of funding The British Medical Research Council and the Overseas Development Administration
Comments
¹TST- tuberculin Skin Test

Appendix D: Evidence tables – RQ HH & II - Diagnosis of active TB
174
A.2.11 Gordin,F., Chaisson,R.E., et al. (2000)
Bibliographic reference
Gordin,F., Chaisson,R.E., et al. (2000). Rifampin and pyrazinamide vs isoniazid for prevention of tuberculosis in HIV-infected persons: an international randomized trial. Terry Beirn Community Programs for Clinical Research on AIDS, the Adult AIDS Clinical Trials Group, the Pan American Health. JAMA 283 (11) 1445-50.
Study type RCT
Study qualty Population matches the population of interest
A “historic” positive PPD¹ test was also included
Intervention matches the intervention of interest
Unclear if an appropriate method of randomization was used
Unclear if adequate concealment of allocation took place
Groups were comparable at baseline
Comparison groups did not always receive the same care apart from the intervention under study. Length of drug regimen could vary depending on whether the patient was perceived to take their drug continuously or not. Patients were taken from different sites in different countries however analysis was stratified by geography.
Blinding: Neither patients nor participants were blinded to treatment allocation. Investigators were not blinded to allocation and any possible confounding factors.
Follow up: groups were followed up for a similar length of time and analysis was adjusted to allow for any differences.
Significantly more patients in the isoniazid group completed treatment than in the rifampicin and pyrazinamide group
Outcome data was available for all patients taking part, including those that did not complete therapy.
The study had an appropriate length of follow up; loss to follow up was similar in both treatment groups.
A precise definition of outcome was stated and a valid and reliable method was used to determine the outcome.
Treatment was usually self-administered
Number of patients 1583 patients randomized
Rifampicin and pyrazinamide group = 791
Isoniazid group = 792
Patient characteristics Included
Aged 13 years or older
Diagnosed with HIV infection
PPD¹ positive (≥ 5 mm)
Haemoglobin > 80 g/L
Neutrophil count > 0.75 x 10⁹/L
Platelet count > 50 x 109/L
Total bilirubin of 42.7 µmol/L or less

Appendix D: Evidence tables – RQ HH & II - Diagnosis of active TB
175
Bibliographic reference
Gordin,F., Chaisson,R.E., et al. (2000). Rifampin and pyrazinamide vs isoniazid for prevention of tuberculosis in HIV-infected persons: an international randomized trial. Terry Beirn Community Programs for Clinical Research on AIDS, the Adult AIDS Clinical Trials Group, the Pan American Health. JAMA 283 (11) 1445-50.
Aspartate aminotransferase and alkaline phosphatase levels < 5 times normal
Excluded
Clinical or radiological evidence of active TB
Current treatment with fluroquinolones or other active agents against TB
History of more than 2 months of continuous treatment against TB
Intolerance to medications
Acute hepatitis or peripheral neuropathy
Pregnancy
Baseline characteristics
Rifampicin and pyrazinamide Isoniazid
Women (%) 29.2 27.8
Mean age, y 36.9 37.7
History of injection drug use 33.2 37.6
Median cell count CD4 (x 109/L) 454 427
PPD induration
5-9 mm
≥ 10 mm
Historical positive
11.8
45.0
43.2
10.7
46.0
43.3
Intervention Rifampicin and pyrazinamide group
Bodyweight < 50 kg
Rifampicin: 450 mg, daily for 2 months
Pyrazinamide: 20 mg/kg, daily for 2 months
Bodyweight ≥ 50 kg
Rifampicin 600 mg, daily for 2 months
Pyrazinamide: 20 mg/kg, daily for 2 months
Patients who did not receive the drugs continuously were encouraged to complete a 60 day course.
Treatment was usually self-administered
Comparison Isoniazid group
Isoniazid 300 mg, daily for 12 months
Pyridoxine hydrochloride 50 mg, daily for 12 months

Appendix D: Evidence tables – RQ HH & II - Diagnosis of active TB
176
Bibliographic reference
Gordin,F., Chaisson,R.E., et al. (2000). Rifampin and pyrazinamide vs isoniazid for prevention of tuberculosis in HIV-infected persons: an international randomized trial. Terry Beirn Community Programs for Clinical Research on AIDS, the Adult AIDS Clinical Trials Group, the Pan American Health. JAMA 283 (11) 1445-50.
Treatment was usually self-administered
Length of follow up Rifampicin and pyrazinamide group: mean duration 37.2 months, maximum 5 years
Isoniazid group: mean duration 36.8 months, maximum 5 years
Location United States, Mexico, Haiti, Brazil, Zambia
Outcomes measures and effect size
Incidence of tuberculosis
Confirmed tuberculosis defined as a positive M tuberculosis culture from any source. Probable: Clinical evidence based diagnosis.
Rifampicin and pyrazinamide (cases)
Rate per 100 person-years
Isoniazid (cases)
Rate per 100 person-years
Unadjusted RR (95% CI²)
P value Adjusted RR (95% CI²)
P value
TB confirmed
19 0.8 26 1.1 0.72 (0.40-1.31)
0.28 0.67 (0.36-1.24)
0.20
TB confirmed or probable
28 1.2 29 1.2 0.96 (0.57-1.61)
0.87 0.95 (0.56-1.61)
0.83
Mortality
Incidence of death
Rifampicin and pyrazinamide (cases)
Rate per 100 person-years
Isoniazid (cases)
Rate per 100 person-years
Unadjusted RR (95% CI²)
P value Adjusted RR (95% CI²)
P value
Death 139 5.7 159 6.5 0.87 (0.69-1.09)
0.23 0.87 (0.69-1.11)
0.27
Adverse events
Adverse events were considered reportable if they were classified as at least grade 4 (potentially life threatening) or above on a scale of 1–5 (with grade 5 denoting death) and not considered due to progression of HIV disease, or if they led to discontinuation of the study drug regardless of severity level.
Adverse Event Rifampicin and Pyrazinamide (n=791) (%)
Isoniazid (n=792) (%) P value
≥1 adverse event 12.3 10.5 0.27

Appendix D: Evidence tables – RQ HH & II - Diagnosis of active TB
177
Bibliographic reference
Gordin,F., Chaisson,R.E., et al. (2000). Rifampin and pyrazinamide vs isoniazid for prevention of tuberculosis in HIV-infected persons: an international randomized trial. Terry Beirn Community Programs for Clinical Research on AIDS, the Adult AIDS Clinical Trials Group, the Pan American Health. JAMA 283 (11) 1445-50.
≥1 adverse event grade 4 or higher
5.6 7.3 0.18
Study drug permanently discontinued
9.5 6.1 0.01
Abnormal liver function tests 1.4 3.3 0.02
Hepatitis 0.8 0.4 0.34
Peripheral neuropathy 0.1 0.5 0.37
Skin rash 1.4 0.6 0.14
Neutropenia 0.8 0.4 0.34
Nausea and/or vomiting 1.9 0.1 <0.001
Narcotic withdrawal 1.5 0.0 <0.001
Source of funding National Institute of Allergy and Infectious Diseases and Centers for Disease Control and Prevention
Comments
¹PPD- Purified Protein Derivative
²CI- Confidence Interval

Appendix D: Evidence tables – RQ HH & II - Diagnosis of active TB
178
A.2.12 Chan,P.C., Yang,C.H., et al. (2012)
Bibliographic reference
Chan,P.C., Yang,C.H., et al. Latent tuberculosis infection treatment for prison inmates: a randomised controlled trial
International Journal of Tuberculosis & Lung Disease. 2012 16 (5) 633-38.
Study type RCT
Study quality Population matches population of interest
Intervention matches intervention of interest
Randomisation: an appropriate method of randomisation was used, computerised randomisation sequence used.
Allocation: Unclear if there was concealment of allocation
Groups were comparable at baseline
Groups received the same care apart from the intervention studied
Blinding: Neither participants nor clinicians were kept blind to treatment allocation. Investigators were not kept blind to participant’s treatment allocation or other confounding factors.
Follow up: all groups were followed up for an equal length of time, loss to follow up was similar. Data was available for all participants enrolled. The length of follow up was appropriate for the outcome under study (adverse events).
Outcome: the study used a precise definition of outcome and a valid and reliable method was used to determine outcome.
Number of patients 373 participants
Rifampicin group = 190
Insoniazid group= 183
Patient characteristics Inclusion
TST¹ positive (≥ 10 mm)
IGRA² positive
Prison population, Taiwan
Exclusion
Active TB
Concomitant medications likely to cause potential drug interactions
Elevated glutamic pyruvic transaminase levels ≥ 3 times normal values
Bilirubin levels ≥ 2 times the upper limit of normal
Platelet count < 150 k/mm³ at baseline
Prison term < 6 months

Appendix D: Evidence tables – RQ HH & II - Diagnosis of active TB
179
Bibliographic reference
Chan,P.C., Yang,C.H., et al. Latent tuberculosis infection treatment for prison inmates: a randomised controlled trial
International Journal of Tuberculosis & Lung Disease. 2012 16 (5) 633-38.
Baseline characteristics
Rifampicin n= 190 Isoniazid, n= 183
Age, years
18-24
25-34
35-44
45-64
≥65
4
42
73
64
7
10
47
59
60
7
Prison term, years
<13
≥ 13
107
83
114
69
TST¹ size, mm
10-14
15-19
≥20
60
98
32
55
102
26
Chronic hepatitis infection
HBsAg positive
Anti-HCV positive
28
42
24
38
Taking other medications 35 40
Diabetes mellitus 4 7
Medical problems other than diabetes 39 44
Intervention Rifampicin group= 190 participants
Rifampicin: 10 mg/kg (up to 600 mg/d), for 4 months
Treatment administered via directly observed therapy (DOT)
Comparison Isoniazid group = 183 participants
Isoniazid: 5 mg/kg (up to 300 mg/d), for 6 months
Treatment administered via directly observed therapy (DOT)

Appendix D: Evidence tables – RQ HH & II - Diagnosis of active TB
180
Bibliographic reference
Chan,P.C., Yang,C.H., et al. Latent tuberculosis infection treatment for prison inmates: a randomised controlled trial
International Journal of Tuberculosis & Lung Disease. 2012 16 (5) 633-38.
Length of follow up 1 month following treatment
Location Prison near Taipei, Taiwan
Outcomes measures and effect size
Incidence of adverse events
Primary outcome defined here as any adverse event that led to permanent discontinuation of treatment, as per pre specified criteria. Secondary outcome defined as any cause that led to permanent discontinuation of treatment.
Odds ratio was adjusted for the effects of HBsAg, anti-HCV, age ≥ 35 years and prison term > 2 years using logistic regression models.
Outcome Rifampicin group
n (%)
Isoniazid group
N (%)
P value Unadjusted odds ratio (CI³ 95%)
Adjusted odds ratio (CI³ 95%)
Primary outcome 4 (2) 22 (12) < 0.001 0.16 (0.05-0.47) 0.15 (0.05- 0.46)
Secondary outcome
27 (14) 41 (22) 0.041 0.57 (0.34-0.98) 0.56 (0.32-0.97)
Source of funding Taiwan CDC Grant DOH97-DC-1502
Comments
¹TST- tuberculin skin test
²IGRA- Interferon gamma release assays
³CI- Confidence interval
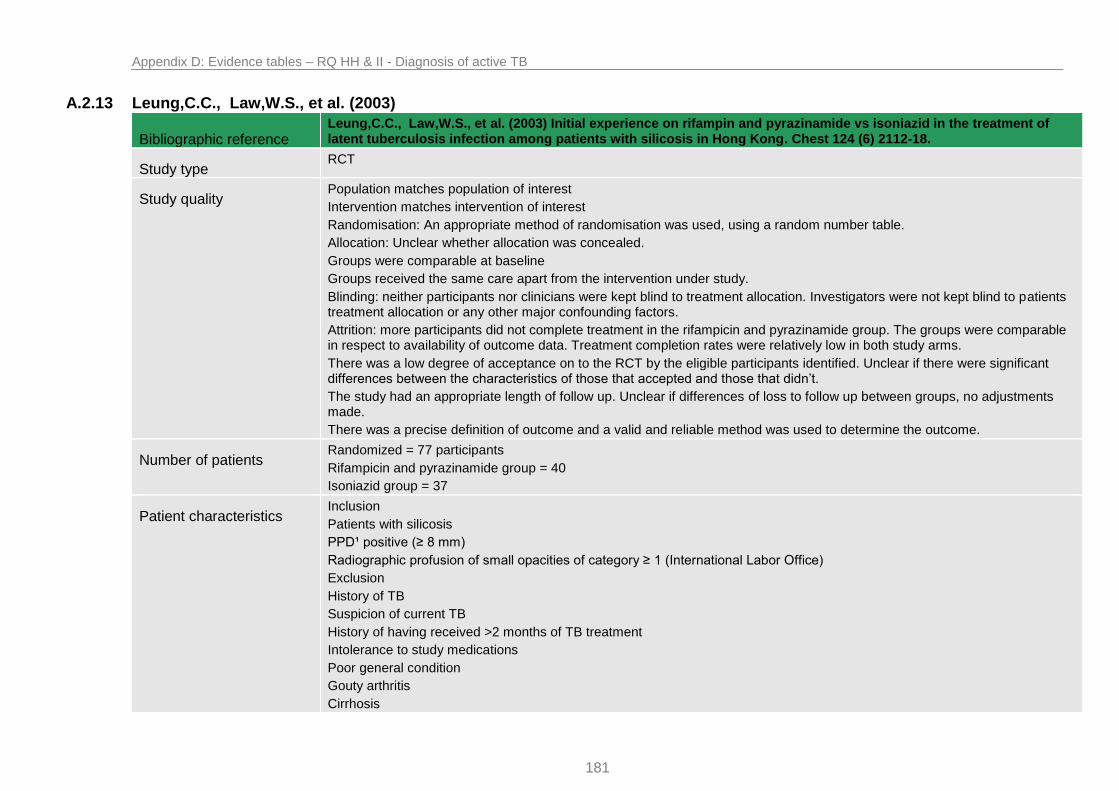
Appendix D: Evidence tables – RQ HH & II - Diagnosis of active TB
181
A.2.13 Leung,C.C., Law,W.S., et al. (2003)
Bibliographic reference Leung,C.C., Law,W.S., et al. (2003) Initial experience on rifampin and pyrazinamide vs isoniazid in the treatment of latent tuberculosis infection among patients with silicosis in Hong Kong. Chest 124 (6) 2112-18.
Study type RCT
Study quality Population matches population of interest
Intervention matches intervention of interest
Randomisation: An appropriate method of randomisation was used, using a random number table.
Allocation: Unclear whether allocation was concealed.
Groups were comparable at baseline
Groups received the same care apart from the intervention under study.
Blinding: neither participants nor clinicians were kept blind to treatment allocation. Investigators were not kept blind to patients treatment allocation or any other major confounding factors.
Attrition: more participants did not complete treatment in the rifampicin and pyrazinamide group. The groups were comparable in respect to availability of outcome data. Treatment completion rates were relatively low in both study arms.
There was a low degree of acceptance on to the RCT by the eligible participants identified. Unclear if there were significant differences between the characteristics of those that accepted and those that didn’t.
The study had an appropriate length of follow up. Unclear if differences of loss to follow up between groups, no adjustments made.
There was a precise definition of outcome and a valid and reliable method was used to determine the outcome.
Number of patients Randomized = 77 participants
Rifampicin and pyrazinamide group = 40
Isoniazid group = 37
Patient characteristics Inclusion
Patients with silicosis
PPD¹ positive (≥ 8 mm)
Radiographic profusion of small opacities of category ≥ 1 (International Labor Office)
Exclusion
History of TB
Suspicion of current TB
History of having received >2 months of TB treatment
Intolerance to study medications
Poor general condition
Gouty arthritis
Cirrhosis

Appendix D: Evidence tables – RQ HH & II - Diagnosis of active TB
182
Bibliographic reference Leung,C.C., Law,W.S., et al. (2003) Initial experience on rifampin and pyrazinamide vs isoniazid in the treatment of latent tuberculosis infection among patients with silicosis in Hong Kong. Chest 124 (6) 2112-18.
Symptomatic hepatitis
Liver dysfunction ALT² levels > 1.5 times upper limit of normal
Baseline characteristics
Rifampicin and pyrazinamide
N = 40
Isoniazid
N = 36
Age, y 61.6 57.6 0.06
Male 100 % 97 % 0.46
Progressive massive fibrosis 27.5 % 19.4 % 0.41
History of BCG vaccine 5.0 % 13.9 % 0.25
Tuberculin test, mm 16.7 15.4 0.14
Habitual alcohol drinker 17.5 % 11.1 % 0.52
HBsAg carrier 12.5 % 27.8 % 0.15
Significant comorbidity 5.0 % 19.4 % 0.08
Other medications 12.5 % 30.6 % 0.09
Intervention Rifampicin and pyrazinamide group:
For those weighing < 50 kg
Rifampicin: 450 mg daily, for 2 months
Pyrazinamide: 1000 mg daily, for 2 months
For those weighing ≥ 50 kg
Rifampicin: 600 mg daily, for 2 months
Pyrazinamide: 1500 mg daily, for 2 months
Treatment as an outpatient, first dose in clinic
Comparison Isoniazid group:
Isoniazid: 300 mg daily, for 6 months
Treatment as an outpatient, first dose in clinic
Length of follow up Up to 10 years

Appendix D: Evidence tables – RQ HH & II - Diagnosis of active TB
183
Bibliographic reference Leung,C.C., Law,W.S., et al. (2003) Initial experience on rifampin and pyrazinamide vs isoniazid in the treatment of latent tuberculosis infection among patients with silicosis in Hong Kong. Chest 124 (6) 2112-18.
Location Hong Kong, China
Outcomes measures and effect size
Significant hepatitis: defined by peak ALT² levels > 5 x the upper limit of normal.
rifampicin and pyrazinamide group: 14 of 40 participants
isoniazid group: 1 of 36 participants
p value = 0.00
i.e. significant difference
Skin rash:
rifampicin and pyrazinamide group: 4 of 40 participants
isoniazid group: 2 of 36 participants
p value = 0.67
i.e. not significant difference
Itchiness:
rifampicin and pyrazinamide group: 13 of 40 participants
isoniazid group: 6 of 36 participants
p value = 0.18
i.e. not significant difference
GI upset
rifampicin and pyrazinamide group: 8 of 40 participants
isoniazid group: 6 of 36 participants
p value = 0.78
i.e. not significant difference
Joint Pain
rifampicin and pyrazinamide group: 0 of 40 participants
isoniazid group: 1 of 36 participants
p value = 0.47
i.e. not significant difference
Treatment completion:
rifampicin and pyrazinamide group: 55 % of participants
isoniazid group: 63.9 % of participants

Appendix D: Evidence tables – RQ HH & II - Diagnosis of active TB
184
Bibliographic reference Leung,C.C., Law,W.S., et al. (2003) Initial experience on rifampin and pyrazinamide vs isoniazid in the treatment of latent tuberculosis infection among patients with silicosis in Hong Kong. Chest 124 (6) 2112-18.
p value = 0.43
i.e. not significant difference
Adherence: defined as the percentage of actually received among the expected number of administered doses:
rifampicin and pyrazinamide group: 72 % of participants
isoniazid group: 72.9 % of participants
p value = 0.92
i.e. not significant difference
Source of funding Unclear
Comments Data reporting was not very clear regarding outcome of hepatitis. Results were reported in percentages and only for one of the definitions (ALT² levels > 5 x upper limit of normal). The other definition of significant hepatitis was raised ALT levels with symptoms of hepatitis, data was only provided for the rifampicin and pyrazinamide group in regard to this definition. I used the definition from which a head to head comparison could be achieved.
All other adverse effects data was presented as percentages from which I calculated the actual number of cases.
¹PPD- purified protein positive
²ALT- alanine transaminase

Appendix D: Evidence tables – RQ HH & II - Diagnosis of active TB
185
A.2.14 Martinson,N.A., Barnes,G.L., et al.(2011)
Bibliographic reference Martinson,N.A., Barnes,G.L., et al. (2011) New regimens to prevent tuberculosis in adults with HIV infection. New England Journal of Medicine. 365 (1) 11-20.
Study type RCT
Study quality The population matches the population of interest
The intervention matches the intervention of interest
Randomization: An appropriate method of computerised randomization was used. Allocation was adequately concealed.
Groups were comparable at baseline.
Comparison groups did not receive the same care apart from intervention under study. Treatment in the rifampicin and isoniazid group and the rifapentine and isoniazid group were directly observed in clinic. Treatment in the 6 month isoniazid group and continuous isoniazid group was self-administered. Scheduled visits occurred once weekly for the rifapentine and isoniazid group, twice weekly for the rifampicin and isoniazid group and every 2 weeks for the first 6 months of the isoniazid alone groups followed by every 6 months for the continuous isoniazid group.
Blinding: neither participants nor clinicians were kept blind to treatment allocation. Investigators were not blinded to either treatment allocation or any confounding factors.
Follow up: was an appropriate length and all groups were followed up for an equal length of time and analysis was adjusted to allow for differences.
The groups were comparable for treatment completion and with respect to the availability of outcome data.
A precise definition of outcome was used and a valid and reliable method of determining the outcome was used.
The continuous isoniazid group had half as many participants as the other groups.
Number of patients 1150 randomized
rifapentine and isoniazid group = 329
rifampicin and isoniazid group = 329
isoniazid for 6 months = 328
continuous isoniazid = 164
Patient characteristics Included
HIV infected
TST¹ positive (≥ 5 mm)
Age 18 or older
Excluded
Pregnant or breast feeding
Active tuberculosis

Appendix D: Evidence tables – RQ HH & II - Diagnosis of active TB
186
Bibliographic reference Martinson,N.A., Barnes,G.L., et al. (2011) New regimens to prevent tuberculosis in adults with HIV infection. New England Journal of Medicine. 365 (1) 11-20.
Ever received treatment for TB > 2 months
Receiving antiretroviral therapy
CD4 cell count < 200 per mm³
Baseline characteristics
Rifapentine with isoniazid, 12 weeks n= 328
Rifampicin with isoniazid twice weekly, 12 weeks n= 329
Isoniazid daily for ≤ 6 years
n= 164
Isoniazid daily for 6 months n = 327
Female (%) 277 267 139 273
Age yr, median 30.3 30.5 30.2 30.4
TST¹ induration, (mm), median
14.5 15.0 15.0 15.0
CD4 count, cells/mm³, median
471 498 476 490
Viral load- log10copies/ml, median
4.3 4.0 4.2 4.2
Intervention Rifapentine and isoniazid group
rifapentine: 900 mg weekly, for 12 weeks
isoniazid: 900 mg weekly, for 12 weeks
pyridoxine: 25 mg weekly, for 12 weeks
Treatment was directly observed
Rifampicin and isoniazid group
rifampicin: 600 mg twice weekly, for 12 weeks
isoniazid: 900 mg, twice weekly, for 12 weeks
pyridoxine: 25 mg twice weekly, for 12 weeks
Treatment was directly observed
Isoniazid, continuous group
isoniazid: 300 mg daily for the duration of the study (≤6 years)
pyridoxine: 25 mg daily, for the duration of the study
Treatment was self-administered

Appendix D: Evidence tables – RQ HH & II - Diagnosis of active TB
187
Bibliographic reference Martinson,N.A., Barnes,G.L., et al. (2011) New regimens to prevent tuberculosis in adults with HIV infection. New England Journal of Medicine. 365 (1) 11-20.
Comparison Isoniazid, 6 month group
isoniazid: 300mg daily, for 6 months
pyridoxine: 25 mg daily, for 6 months
Treatment was self-administered
Length of follow up Minimum of 3 years, 6 years maximum
Location Soweto, South Africa
Outcomes measures and effect size
Incidence of tuberculosis
Defined as clinical presentation consistent with tuberculosis and response to anti-tuberculosis therapy.
Incident disease was categorised as:
“confirmed” if one or more cultures were positive for tuberculosis and clinical signs and symptoms.
“probable” if one sputum smear or one biopsy specimen was positive for acid fast bacilli and clinical signs and symptoms.
“possible” clinical signs and symptoms with response to TB treatment.
All cases:
rifapentine and isoniazid group = 24 of 328
rifampicin and isoniazid group = 24 of 329
continuous isoniazid = 8 of 164
isoniazid for 6 months = 22 of 327
Culture confirmed cases
rifapentine and isoniazid group = 21 of 328
rifampicin and isoniazid group = 18 of 329
continuous isoniazid = 5 of 164
isoniazid for 6 months = 18 of 327
Incidence rate of all cases per 100 person-years
rifapentine and isoniazid group = 1.4
rifampicin and isoniazid group = 1.3
continuous isoniazid = 1.4
isoniazid for 6 months = 1.9

Appendix D: Evidence tables – RQ HH & II - Diagnosis of active TB
188
Bibliographic reference Martinson,N.A., Barnes,G.L., et al. (2011) New regimens to prevent tuberculosis in adults with HIV infection. New England Journal of Medicine. 365 (1) 11-20.
Crude incidence-rate ration (95% CI)
rifapentine and isoniazid group = 1.05 (0.56-1.97), p value = 0.87
i.e. not significant
rifampicin and isoniazid group = 1.02 (0.55- 1.91), p value = 0.94
i.e. not significant
continuous isoniazid = 0.74 (0.29-1.73), p value = 0.48
i.e. not significant
isoniazid for 6 months = reference 1.0
Mortality
Number of deaths (cases)
rifapentine and isoniazid group = 17 of 328
rifampicin and isoniazid group = 16 of 329
continuous isoniazid = 8 of 164
isoniazid for 6 months = 25 of 327
Incidence rate per 100 person-year
rifapentine and isoniazid group = 1.4
rifampicin and isoniazid group = 1.3
continuous isoniazid = 1.4
isoniazid for 6 months = 2.1
Crude incidence-rate ratio (95% CI)
rifapentine and isoniazid group = 0.66 (0.33-1.26), p value 0.18
i.e. not significant
rifampicin and isoniazid group = 0.59 (0.30-1.16), p value 0.10
i.e. not significant
continuous isoniazid = 0.66 (0.26-1.50), p value 0.31
i.e. not significant
isoniazid for 6 months = reference 1.0

Appendix D: Evidence tables – RQ HH & II - Diagnosis of active TB
189
Bibliographic reference Martinson,N.A., Barnes,G.L., et al. (2011) New regimens to prevent tuberculosis in adults with HIV infection. New England Journal of Medicine. 365 (1) 11-20.
Adverse events
Defined as Grade 3 or 4 according to the Division of AIDS, toxicity table.
Grade 3 toxic effect
rifapentine and isoniazid group = 17 of 328
rifampicin and isoniazid group = 15 of 329
continuous isoniazid = 35 of 164
isoniazid for 6 months = 17 of 327
Grade 4 toxic effect
rifapentine and isoniazid group = 4 of 328
rifampicin and isoniazid group = 9 of 329
continuous isoniazid = 18 of 164
isoniazid for 6 months = 14 of 327
Hepatoxicity
rifapentine and isoniazid group = 1.5 %
rifampicin and isoniazid group = 2.4 %
continuous isoniazid = 28.0 %
P value <0.001
i.e.significant
isoniazid for 6 months = 5.5 %
Source of funding National Institue of Allergy and Infectious Diseases, National Institues of Health Fogarty International Center, US Agency for International Development
Dr Martinson reports receiving lecture fees from Alere, no other potential conflict of interest.
Comments
¹TST- tuberculin Skin Test

Appendix D: Evidence tables – RQ HH & II - Diagnosis of active TB
190
A.2.15 Matteelli,A., Olliaro,P., et al. (1999)
Bibliographic reference
Matteelli,A., Olliaro,P., et al. (1999). Tolerability of twice-weekly rifabutin-isoniazid combinations versus daily isoniazid for latent tuberculosis in HIV-infected subjects: a pilot study. International Journal of Tuberculosis & Lung Disease. 3 (11) 1043-46.
Study type RCT
Study quality Intervention matches intervention of interest
Population matches population of interest
Randomisation: Unclear if an appropriate method of randomisation was used. Unclear if there was adequate concealment of allocation.
Unclear if groups were comparable at baseline in regard to ALT values
Groups received the same care apart from the intervention studied.
Blinding: neither participants nor clinicians were blinded to the treatment allocations. Investigators were not blinded to treatment allocation or confounding factors
Follow up: Groups were not followed up for the same length of time, length of follow up was appropriate.
Unclear if groups were comparable with regard to systematic differences to those that did not complete treatment. Outcome data was available for all participants.
There was not a precise definition of outcome for adverse events however adherence was defined. Unclear if a valid and reliable method was used to determine the outcome.
This study was terminated early by its pharmaceutical sponsor prior to reaching the planned number of eligible subjects.
Number of patients Randomized 44 participants
rifabutin 300 mg and isoniazid = 16
rifabutin 600 mg and isoniazid = 14
Isoniazid 300 mg alone = 14
Patient characteristics Inclusion
HIV infected
Age 18 or older
PPD skin test positive (≥5 mm)
Exclusion
Pregnant
Suspected active tuberculosis
CD4 cell count < 200/mm³
Haemoglobin < 9 g/dl
Platelets < 75000/mm³

Appendix D: Evidence tables – RQ HH & II - Diagnosis of active TB
191
Bibliographic reference
Matteelli,A., Olliaro,P., et al. (1999). Tolerability of twice-weekly rifabutin-isoniazid combinations versus daily isoniazid for latent tuberculosis in HIV-infected subjects: a pilot study. International Journal of Tuberculosis & Lung Disease. 3 (11) 1043-46.
Neutrophil counts <1000/mm³
Serum creatinine > 1.5 g/dl
Aspartate aminotransferase (AST) or alanine aminotransferase (ALT) > 5 times the upper normal value
Baseline characteristics
Mean age = 31.5 years in the rifabutin groups and 34 years in the isoniazid alone group
Mean weight ranged from 70.8 in group C to 72.1 in group A
CD cell counts averaged 500/mm³ in each group
ALT values at baseline were abnormal in 50%, 29% and 43% of the subjects in the three groups respectively.
Intervention Rifabutin 300 mg and isoniazid
rifabutin 300 mg twice weekly, for 3 months
isoniazid 750 mg twice weekly, for 3 months
Rifabutin 600 mg and isoniazid
rifabutin 600 mg twice weekly, for 3 months
isoniazid 750 mg twice weekly, for 3 months
Comparison Isoniazid alone
isoniazid 300 mg twice weekly, for 6 months
Length of follow up Average follow up length (mean)
Rifabutin 300 mg and isoniazid = 18 months
Rifabutin 600 mg and isoniazid = 19 months
Isoniazid alone = 17 months
Location Italy
Outcomes measures and effect size
Treatment completion
≥ 80 % of the prescribed drug total amount taken
Rifabutin 300 mg and isoniazid = 13 of 16
Rifabutin 600 mg and isoniazid = 13 of 14
Isoniazid alone = 10 of 14

Appendix D: Evidence tables – RQ HH & II - Diagnosis of active TB
192
Bibliographic reference
Matteelli,A., Olliaro,P., et al. (1999). Tolerability of twice-weekly rifabutin-isoniazid combinations versus daily isoniazid for latent tuberculosis in HIV-infected subjects: a pilot study. International Journal of Tuberculosis & Lung Disease. 3 (11) 1043-46.
Source of funding Farmitalia-Carlo Erba (Pharmacia-Upjohn)
Comments
PPD¹- Purified protein derivative

Appendix D: Evidence tables – RQ HH & II - Diagnosis of active TB
193
A.2.16 Jimenez-Fuentes,M.A., de Souza-Galvao,M.L., et al. (2013)
Bibliographic reference
Jimenez-Fuentes,M.A., de Souza-Galvao,M.L., et al. (2013) Rifampicin plus isoniazid for the prevention of tuberculosis in an immigrant population.International Journal of Tuberculosis & Lung Disease
17 (3) 326-32.
Study type RCT
Study quality Population matches population of interest.
Intervention matches intervention of interest
Randomisation: an appropriate method of randomisation was used and allocation was adequately concealed.
Groups were not comparable at baseline in regard to sex and illegal immigrant distribution
Groups received same care apart from the intervention studied
Blinding: neither participants nor clinicians were kept blind to treatment allocation. Investigators were not kept blind to allocation or confounding factors.
Follow up: all groups were followed up for an equal length of time. Loss to follow up was significant, only 64.4 % of population available for evaluation at 5 years. Length of follow up was appropriate. Groups were not comparable for treatment completion; almost twice as many patients in the isoniazid group did not complete treatment.
Outcome data was available for all randomised participants
A precise definition of outcome was available for adherence study and hepatotoxicity there was no real definition of outcome for TB outcome. Unclear if valid and reliable methods were used to determine onset of active TB.
Number of patients 590 participants randomized
6 months of isoniazid = 294
3 months of rifampicin and isoniazid = 296
Patient characteristics Inclusion
TST¹ positive (>5 mm in contacts, > 15 mm in other cases)
Immigrants from countries with a TB incidence of > 40 cases per 100000
Less than 5 years in Catalunya
Aged 12-40 years
Exclusion
No evidence of active TB (on chest Xray)
History of TB
Known TST¹ positivity
Pregnancy or lactation
Hepatopathy

Appendix D: Evidence tables – RQ HH & II - Diagnosis of active TB
194
Bibliographic reference
Jimenez-Fuentes,M.A., de Souza-Galvao,M.L., et al. (2013) Rifampicin plus isoniazid for the prevention of tuberculosis in an immigrant population.International Journal of Tuberculosis & Lung Disease
17 (3) 326-32.
HIV
Baseline characteristics
6H² n = 294 3RH³ n = 296 Total n = 590 P value
Age, years, “average” 26.5 25.7 26.1 0.06
Sex m/f 180/114 220/76 400/190 0.006
Geographic origin
Eastern Europe
South and Central America
Africa
Asia
15
150
57
72
16
138
84
58
31
288
141
130
0.06
Administrative status
legal immigration
illegal immigration
141
153
106
190
247
343
0.001
Smoking 68 92 160 0.06
Alcohol >40 g/day 15 21 36 0.16
Illegal drug use 18 20 38 0.3
Intervention 3 months of rifampicin and isoniazid = 296 participants
Isoniazid: 5 mg/kg/day, for 3 months
Rifampicin: 10 mg/kg/day (maximum 600 mg/day)
Treatment was self-administered in a daily oral dose.
Comparison 6 months of isoniazid = 294 participants
Isoniazid: 5 mg/kg/day, for 6 months
Treatment was self-administered in a daily oral dose.
Length of follow up 5 years
Location Barcelona, Spain
Outcomes measures and effect size
Adherence
Defined as taking 80 % of the prescribed dose (confirmed by urine testing)

Appendix D: Evidence tables – RQ HH & II - Diagnosis of active TB
195
Bibliographic reference
Jimenez-Fuentes,M.A., de Souza-Galvao,M.L., et al. (2013) Rifampicin plus isoniazid for the prevention of tuberculosis in an immigrant population.International Journal of Tuberculosis & Lung Disease
17 (3) 326-32.
6 months of isoniazid = 154 of 294
3 months of rifampicin and isoniazid = 213 of 296
Data was calculated using percentages stated in the study.
Incidence of active tuberculosis:
Assessed on the basis of a telephone interview, or checking case records for diagnosis of tuberculosis:
Amongst treatment adherent patients:
6 months of isoniazid = 0 of 213
3 months of rifampicin and isoniazid = 0 of 154
Amongst treatment non-adherent patients:
6 months of isoniazid = 1 of 83
3 months of rifampicin and isoniazid = 1 of 140
Hepatotoxicity
Slight defined as liver enzymes < 3 times the normal level
Moderate defined as 3-5 times the normal level
Severe defined as > 5 times the normal level
6 months of isoniazid = 27 of 294 cases
slight = 17
moderate = 9
severe = 1
3 months of rifampicin and isoniazid = 20 of 296
slight = 16
moderate = 4
severe = 0
P value
slight = 0.8
moderate = 0.1
severe = 0.3
i.e. not significant

Appendix D: Evidence tables – RQ HH & II - Diagnosis of active TB
196
Bibliographic reference
Jimenez-Fuentes,M.A., de Souza-Galvao,M.L., et al. (2013) Rifampicin plus isoniazid for the prevention of tuberculosis in an immigrant population.International Journal of Tuberculosis & Lung Disease
17 (3) 326-32.
Gastrointestinal
Nausea or vomiting without hepatotoxicity
6 months of isoniazid = 24 of 294
3 months of rifampicin and isoniazid = 23 of 296
P value = 0.8
i.e. not significant
Cutaneous toxicity
Rash, pruritis, photosensitivity
6 months of isoniazid = 5 of 294
3 months of rifampicin and isoniazid = 8 of 296
P value = 0.4
i.e. not significant
Headache
6 months of isoniazid = 8 of 294
3 months of rifampicin and isoniazid = 5 of 296
P value = 0.4
i.e. not significant
Source of funding Grant from Spanish Society of Pneumology and Thoracic Surgery
Comments
¹TST- tuberculin skin test
²6H – isoniazid 6 months
³3RH – 3 months of rifampicin and isoniazid

Appendix D: Evidence tables – RQ HH & II - Diagnosis of active TB
197
A.2.17 White,M.C., Tulsky,J.P., et al. (2012)
Bibliographic reference White,M.C., Tulsky,J.P., et al. (2012). Isoniazid vs. rifampin for latent tuberculosis infection in jail inmates: toxicity and adherence. Journal of Correctional Health Care, 18 (2) 131-42.
Study type RCT
Study quality Population matches population of interest
Intervention matches intervention of interest
Randomisation: unclear if an appropriate method of randomization was used, unclear if treatment group allocation was concealed.
Groups were comparable at baseline
Groups received the same care apart from intervention studied
Blinding: Neither participants nor clinicians were kept blind to treatment allocation. Investigators were not blinded to either treatment allocation or other confounding factors.
Follow up: unclear if groups were followed up following treatment course. Groups were comparable for treatment completion and availability of outcome data. Number that did not complete regimen was high in both groups.
The study used a precise definition of outcome and a valid and reliable method.
Number of patients Randomized = 362
Isoniazid group = 184
Rifampicin group = 180
Patient characteristics Inclusion
Inmates in San Francisco City and County Jail
Diagnosed with LTBI
Exclusion
History of drug intolerance
Pregnancy or breast feeding
Aminotransferases > 3 times upper limit of normal
Bilirubin > 2 times upper limit of normal
Platelets < 150 k/mm³
Taking protease inhibitors or nonnucleoside reverse transcriptase inhibiters
Not English or Spanish speaking
Not in routine level of jail security
Known transfer or immenent deportation
Baseline characteristics

Appendix D: Evidence tables – RQ HH & II - Diagnosis of active TB
198
Bibliographic reference White,M.C., Tulsky,J.P., et al. (2012). Isoniazid vs. rifampin for latent tuberculosis infection in jail inmates: toxicity and adherence. Journal of Correctional Health Care, 18 (2) 131-42.
INH² RIF³ P value
Gender m/f 173/11 166/14 0.5
Age
<35
≥35
138
46
120
60
0.08
Drug Alcohol Problem
Yes
no
100
84
86
94
0.21
On INH² before
Yes
No
23
161
28
152
0.40
Health status
Poor
Fair
Good
Very good
excellent
15
45
63
38
23
17
52
54
37
20
0.83
Intervention Rifampicin group = 180
Rifampicin: 600 mg daily, for 4 months
Treatment was given by directly observed therapy both in jail and in the community.
Comparison Isoniazid group = 184
Isoniazid: 900 mg twice weekly, for 9 months
Treatment was given by directly observed therapy both in jail and in the community.
Length of follow up 3 months following treatment
Location San Francisco City and County Jail, USA
Outcomes measures and effect size
Elevated LFTs
From any baseline to aminotransferases > 3 times upper limit of normal

Appendix D: Evidence tables – RQ HH & II - Diagnosis of active TB
199
Bibliographic reference White,M.C., Tulsky,J.P., et al. (2012). Isoniazid vs. rifampin for latent tuberculosis infection in jail inmates: toxicity and adherence. Journal of Correctional Health Care, 18 (2) 131-42.
Isoniazid group = 21 of 184
Rifampicin group = 8 of 180
2 weeks % (N tested)
4 weeks % (N tested)
8 weeks % (N tested)
12 weeks % (N tested)
16 weeks % (N tested)
32 weeks % (N tested)
INH in jail - 1 (107) 1 (82) 3 (73) 4 (50) 9 (22)
INH in community
- 5 (20) 5 (20) 0 (19) 0 (25) 4 (27)
RIF in jail 1 (131) 0 (82) 0 (60) 3 (40) 0 (33) -
RIF in community
0 (14) 0 (22) 0 (23) 0 (26) 0 (25) -
Gastrointestinal symptoms
Isoniazid group = 19 of 184
Rifampicin group = 16 of 180
Rash/pruritis
Isoniazid group = 12 of184
Rifampicin group = 16 of 180
Central nervous system (unclear definition)
Isoniazid group = 20 of 184
Rifampicin group = 6 of 180
Allergy (rash, shortness of breath, oxygen saturations)
Isoniazid group = 0 of 184
Rifampicin group = 1 of 180
Source of funding Award from National Institue of Allergy and Infectious Diseases
Comments
¹TST- tuberculin skin test
²INH- isoniazid
³RIF- rifampicin

Appendix D: Evidence tables – RQ HH & II - Diagnosis of active TB
200

Appendix D: Evidence tables – RQ HH & II - Diagnosis of active TB
201
A.2.18 Whalen,C.C., Johnson,J.L., et al.(1997)
Bibliographic reference
Whalen,C.C., Johnson,J.L., et al. (1997). A trial of three regimens to prevent tuberculosis in Ugandan adults infected with the human immunodeficiency virus. Uganda-Case Western Reserve University Research Collaboration. New England Journal of Medicine, 337 (12) 801-08.
Study type RCT
Study quality Population matches population of interest
Intervention matches intervention of interest
Randomisation: an appropriate system of randomisation was used using a sequential list of random numbers. Allocation was most likely adequately concealed although sealed envelopes were not explicitly stated as opaque.
Groups were comparable at baseline
Groups received the same care apart from intervention under study
Blinding: neither participants nor clinicians were blinded to treatment allocation. Investigators were blinded to treatment allocation for the most part although blinding was made difficult by the discolouration of bodily fluids in the rifampicin treatment groups.
Follow up: all groups were followed up for an adequate length of time and analysis was adjusted to allow for any differences between groups.
Groups were comparable for treatment completion and availability of outcome data.
The study used a precise definition of outcome and a valid and reliable method was used to determine the outcome
Number of patients 2736 individuals randomized
Placebo group = 464
Isoniazid group = 536
Isoniazid and rifampicin group = 556
Isoniazid, rifampicin and pyrazinamide = 462
Patient characteristics Included
Aged 18 or above
HIV type 1
PPD¹ positive ≥ 5 mm (although anergy cohort was run alongside)
Karnofsky performance score of > 50
Exclusion
Active tuberculosis
Previous treatment for TB
Antiretroviral drugs use

Appendix D: Evidence tables – RQ HH & II - Diagnosis of active TB
202
White cell count < 3000 per mm³
Haemoglobin level < 80 g/L
Aspartate aminotransferase level > 90 U per litre
Serum creatinine level over 1.8 mg per decilitre
Positive pregnancy test
Residence more than 20 miles from a project clinic
Advanced HIV disease
Major underlying medical illness
Baseline characteristics
Placebo n=464 Isoniazid n=536 Isoniazid-rifampicin n=556
Isoniazid-rifampicin-pyrazinamide n=462
Male (%) 31 31 29 34
Mean age yr 30 29 29 29
Karnofsky performance score
91 91 91 91
Person years of observation
616 645 680 577
PPD skin test mm 14 14 13 14
Completion of trial (%) 89 88 86 80
Intervention Isoniazid group = 536
isoniazid: 300 mg daily, for 6 months
Isoniazid and rifampicin group = 556
isoniazid: 300 mg daily, for 3 months
rifampicin: 600 mg daily, for 3 months
Isoniazid, rifampicin and pyrazinamide = 462
isoniazid: 300 mg daily, for 3 months
rifampicin: 600 mg daily, for 3 months
pyrazinamide: 2000 mg daily, for 3 months
All treatments were self-administered

Appendix D: Evidence tables – RQ HH & II - Diagnosis of active TB
203
Comparison Placebo= 464
ascorbic acid: 250 mg daily, for 6 months
Length of follow up 2 years
Location Uganda
Outcomes measures and effect size
Definite or probable tuberculosis
Culture-confirmed case = definite
Clinical illness consistent with TB: radiography consistent with pulmonary TB, smear positive for acid fast bacilli, response to anti tuberculosis therapy.= probable
No of cases Rate (cases per 100 person-years)
Crude RR² (95% CI)
P value Adjusted RR²
Placebo 21 3.41 1.0 1.0
Isoniazid 7 1.08 0.33 (0.14-0.77) 0.01 0.32 (0.14-0.76)
Isoniazid, rifampicin
9 1.32 0.40 (0.18- 0.86) 0.02 0.41 (0.19-0.89)
Isoniazid, rifampicin, pyrazinamide
10 1.73 0.51 (0.24-1.08) 0.08 0.43 (0.20-0.92)
Adjusted for age, sex, white cell count, haemoglobin level, karnofsky score, body mass index, history of HIV related infection and presence of chronic diarrhoea.
Mortality
Number of deaths
Deaths Rate RR² (95% CI³) P value
Placebo 64 10.2 1.0
Isoniazid 58 8.9 0.9 (0.6-1.2) 0.44
Isoniazid, rifampicin
57 8.3 0.8 (0.5-1.2) 0.25
Isoniazid, rifampicin,
58 9.8 0.96 (0.7-1.4) 0.83

Appendix D: Evidence tables – RQ HH & II - Diagnosis of active TB
204
pyrazinamide
Adverse events
Incidence of reported adverse events and the number for which it was the cause of discontinuation of therapy
Cumulative incidence of reported adverse events (%)
Mild reaction Moderate reaction Severe reaction Discontinuation of therapy
Placebo 23 (5.0) 23 (5.0) 0 0 1 (0.2)
Isoniazid 60 (11.2) 56 (10.4) 4 (0.7) 0 3 (0.6)
Isoniazid, rifampicin
54 (9.7) 48 (8.6) 6 (1.1) 0 13 (2.3)
Isoniazid, rifampicin, pyrazinamide
114 (24.7) 101 (21.9) 12 (2.6) 1 (0.2) 26 (5.6)
Source of funding Grant from Fogarty International Center at the National Institues of Health
Comments
¹PPD- purified protein derivative
²RR- risk ratio
³CI- confidence interval

Appendix D: Evidence tables – RQ HH & II - Diagnosis of active TB
205
A.2.19 Swaminathan,S., Menon,P.A., et al. (2012)
Bibliographic reference
Swaminathan,S., Menon,P.A., et al. (2012) Efficacy of a six-month versus a 36-month regimen for prevention of tuberculosis in HIV-infected persons in India: a randomized clinical trial. PLoS ONE [Electronic Resource] 7 (12) e47400.
Study type RCT
Study quality Population does not match population of interest, however subgroup analysis is possible for patients > 5 mm TST³ positive.
Intervention matches intervention of interest
An appropriate method of computerised block randomisation was used. Allocation was concealed in sequentially numbered opaque envelopes.
Groups were comparable at baseline. Groups received the same care apart from the intervention studied.
Blinding: neither participants nor clinicians were kept blind to treatment allocation. Investigators were blinded to treatment allocation however unclear if blinded to all confounding factors.
All groups were followed up for an equal amount of time, groups were comparable for numbers who did not complete treatment and for whom there was no outcome data. Unclear if there were systematic differences between groups for these participants. An appropriate length of follow up was used.
Intention to treat analysis was used
A precise definition of outcome was used and a valid and reliable method used to determine the outcome.
Number of patients Randomised = 712
Ethambutol and isoniazid = 357
36 months, isoniazid = 355
Patient characteristics Inclusion
HIV infected
Age > 18 years
Normal chest radiograph
Haemoglobin ≥ 70 g/L
Granulocyte count ≥1.1 x 10⁹/L
Platelet count ≥100 x 109/L
Serum alanine amino transferase ≤2.5 times upper limit of normal
Serum creatinine concentration < 1.1 mg%
Random plasma sugar < 140 mg%
Exclusion
Past or current evidence of TB disease

Appendix D: Evidence tables – RQ HH & II - Diagnosis of active TB
206
Bibliographic reference
Swaminathan,S., Menon,P.A., et al. (2012) Efficacy of a six-month versus a 36-month regimen for prevention of tuberculosis in HIV-infected persons in India: a randomized clinical trial. PLoS ONE [Electronic Resource] 7 (12) e47400.
Baseline characteristics
6 months of ethambutol and isoniazid n=344
36 months of isoniazid n=339
Age (mean±SD¹), years 29.9±7 30.2±7
Weight (mean±SD¹) kgs 51±10 50±10
Females n (%) 218 (63) 212 (63)
Age distribution
<25 years
25-40 years
>40 years
N
106
208
30
%
30
61
9
N
97
216
26
%
29
64
7
TST Induration (mean), mm 7.6 7.2
CD4 count, median, cells/mm³ 326 324
Intervention Isoniazid and ethambutol
isoniazid: 300 mg daily, for 6 months
ethambutol: 800 mg daily, for 6 months
pyridoxine:10 mg daily, for 6 months
co-trimoxazole DS: one tablet daily for 6 months if CD4 count <250 cells/mm³
Self administration
Comparison Isoniazid alone
isoniazid: 300 mg daily, for 36 months
pyridoxine:10 mg daily, for 6 months
co-trimoxazole DS: one tablet daily for 6 months if CD4 count <250 cells/mm³
Self administration
Length of follow up None beyond treatment period
Location India
Outcomes measures and Incidence of TB

Appendix D: Evidence tables – RQ HH & II - Diagnosis of active TB
207
Bibliographic reference
Swaminathan,S., Menon,P.A., et al. (2012) Efficacy of a six-month versus a 36-month regimen for prevention of tuberculosis in HIV-infected persons in India: a randomized clinical trial. PLoS ONE [Electronic Resource] 7 (12) e47400.
effect size Definite: positive mycobacterial culture
Probable: clinical, radiographic, histopathological or biochemical features based on review by blinded panel.
Primary analysis was a modified intent to treat analysis
6 months, isoniazid and ethambutol n=141
36 months isoniazid, n=132
TB incidence/100 personyears (95% CI²)
3.18 (1.38-4.97) 1.81 (0.69-3.04)
Adjusted incidence rate ratio (95% CI²) 1.48 (0.55, 3.96) reference
TB incidence/100 personyears (95% CI²) per protocol analysis
2.80 (1.06-4.70) 1.84 (0.37-3.32)
Adjusted incidence rate ratio (95% CI²), per protocol analysis
1.57 (0.50, 4.9) reference
Mortality
Incidence per 100 person years
Primary analysis was a modified intent to treat analysis
6 months, isoniazid and ethambutol n=141
36 months isoniazid, n=132
Mortality/100 personyears (95% CI²) 2.91 (1.19-4.63) 2.53 (1.21-3.85)
Adjusted incidence rate ratio (95% CI²) 1.51 (0.56, 4.02) reference
Mortality/100 personyears (95% CI²) per protocol analysis
3.08 (1.26-4.89) 2.15 (0.56-3.74)
Adjusted incidence rate ratio (95% CI²), per protocol analysis
1.43 (0.53, 3.8) reference
Source of funding World Health Organisation, United States Agency for International Development
Comments
¹SD- standard deviation
²CI- confidence interval
³TST- tuberculin skin test

Appendix D: Evidence tables – RQ HH & II - Diagnosis of active TB
208

Appendix D: Evidence tables – RQ HH & II - Diagnosis of active TB
209
A.2.20 Sterling,T.R., Villarino,M.E., et al. (2011)
Bibliographic reference
Sterling,T.R., Villarino,M.E., et al.(2011). Three months of rifapentine and isoniazid for latent tuberculosis infection
New England Journal of Medicine 365 (23) 2155-66.
Study type RCT
Study quality Unclear if population matches population of interest, some uncertainty around whether TST¹ negative participants were included in the analysis. No subgroup data available.
Intervention matches intervention of interest
An appropriate method of randomisation was used, randomising treatment by household (cluster). Unclear whether treatment allocation was adequately concealed
Groups were not comparable at baseline in regard to numbers of participants who were homeless or native American.
Groups did not receive the same standard of care aside from intervention studied. Combination therapy was given directly observed, isoniazid was self-administered.
Blinding: neither participants nor clinicians were blinded to treatment allocation. Investigators were not blinded to treatment allocation or other confounding factors.
Follow up: groups were followed up for an equal length of time. Unclear how many participants did not complete treatment within each group. Groups were comparable for number for which there is no outcome data available. Length of follow up was appropriate.
Intention to treat principle was followed
A precise definition of outcome was used. Valid and reliable method was used to determine outcome.
Number of patients 7731 participants
Isoniazid only= 3745
Isoniazid and rifapentine= 3986
Patient characteristics Inclusion
Aged ≥12 years of age
Close contact of a patient with culture confirmed TB
Positive TST¹
HIV infection with positive TST¹ result
Fibrotic changes on chest radiography with TST positive test
Criteria expanded to also include:
Children between the ages of 2 to 4 years with positive TST and close contact
Exclusion
Confirmed or expected tuberculosis

Appendix D: Evidence tables – RQ HH & II - Diagnosis of active TB
210
Bibliographic reference
Sterling,T.R., Villarino,M.E., et al.(2011). Three months of rifapentine and isoniazid for latent tuberculosis infection
New England Journal of Medicine 365 (23) 2155-66.
Resistance to isoniazid
Received treatment with rifamycin or isoniazid within the past 2 years
Previous treatment for tuberculosis
Serum aspartate aminotransferase > 5 times the upper limit of normal
Pregnancy or lactation
HIV therapy within 90 days after enrolment
Weight of less than 10 kg
Baseline characteristics
Isoniazid only n=3745 Combination therapy n=3986
Indication for treatment
Close contact with a patient with tuberculosis
Recent conversion to a positive TST
HIV infection
Fibrosis on chest radiograph
2609
972
74
90
2857
953
87
89
Age- yr
Median
Interquartile range
35
25-46
36
25-47
Male sex 2004 2210
HIV infection 100 105
Race or ethnicity
White
Black
Asian
Native American
Multiracial
2160
947
490
33
115
2296
978
494
84
134
Risk factors
History of incarceration
Unemployed
History of alcohol use
History of injection drug use
175
390
1888
136
220
221
424
1929
149
293

Appendix D: Evidence tables – RQ HH & II - Diagnosis of active TB
211
Bibliographic reference
Sterling,T.R., Villarino,M.E., et al.(2011). Three months of rifapentine and isoniazid for latent tuberculosis infection
New England Journal of Medicine 365 (23) 2155-66.
Homelessness
Current smoker
1034 1112
Liver disease
Hepatitis C
Hepatitis B
97
60
99
42
Intervention Rifapentine and isoniazid
rifapentine: 900 mg once weekly, for 3 months
incremental adjustment for subjects weighing ≤50 kg
isoniazid 15-25 mg per kg of body weight rounded up to nearest 50 mg (maximum 900 mg)
once weekly, for 3 months
Doses given under directly observed therapy.
Comparison Isoniazid alone
isoniazid: 5 to 15 mg per kilogram, rounded up to the nearest 50 mg, maximum dose 300 mg
daily, for 9 months
Self administered
Length of follow up 33 months
Location United States, Canada, Brazil, Spain

Appendix D: Evidence tables – RQ HH & II - Diagnosis of active TB
212
Bibliographic reference
Sterling,T.R., Villarino,M.E., et al.(2011). Three months of rifapentine and isoniazid for latent tuberculosis infection
New England Journal of Medicine 365 (23) 2155-66.
Outcomes measures and effect size
Incidence of Tuberculosis
Incidence of TB and Event rates
No. of subjects No. with tuberculosis
No. per patient year
Cumulative rate
Difference in cumulative rate
Upper limit of 95% CI for difference
Modified Intention to treat analysis
Isoniazid only 3745 15 0.16 0.43 -0.24 0.01
Combination therapy
3986 7 0.07 0.19
Per protocol analysis
Isoniazid only 2585 8 0.11 0.32 -0.19 0.06
Combination therapy
3273 4 0.05 0.13
Permanent drug discontinuation
Number who discontinued treatment:
For any reason
Isoniazid alone group = 1160 of 3745 (who received at least one dose of study drug)
Rifapentine and isoniazid group = 713 of 3986
P-value = <0.001
Because of an adverse event
Isoniazid alone group = 139 of 3745
Rifapentine and isoniazid group = 196 of 3986
P-value = 0.009
Mortality
Number of deaths
Isoniazid alone group = 39 of 3745
Rifapentine and isoniazid group = 31 of 3986

Appendix D: Evidence tables – RQ HH & II - Diagnosis of active TB
213
Bibliographic reference
Sterling,T.R., Villarino,M.E., et al.(2011). Three months of rifapentine and isoniazid for latent tuberculosis infection
New England Journal of Medicine 365 (23) 2155-66.
P-value = 0.22
Hepatotoxicity
Unclear definition
Isoniazid alone group = 103 of 3759
Rifapentine and isoniazid group = 18 of 4040
P-value = <0.001
Rash
Unclear definition
Isoniazid alone group = 21 of 3759
Rifapentine and isoniazid group = 31 of 4040
P-value = 0.26
Hypersensitivity
Possible hypersensitivity
Isoniazid alone group = 17 of 3759
Rifapentine and isoniazid group = 152 of 4040
P-value = <0.001
Severity of adverse event
Grade1 or 2
Isoniazid alone group = 341 of 3759
Rifapentine and isoniazid group = 310 of 4040
P-value = 0.03
Grade 3
Isoniazid alone group = 202 of 3759
Rifapentine and isoniazid group = 193 of 4040
P-value = 0.24

Appendix D: Evidence tables – RQ HH & II - Diagnosis of active TB
214
Bibliographic reference
Sterling,T.R., Villarino,M.E., et al.(2011). Three months of rifapentine and isoniazid for latent tuberculosis infection
New England Journal of Medicine 365 (23) 2155-66.
Grade 4
Isoniazid alone group = 42 of 3759
Rifapentine and isoniazid group = 36 of 4040
P-value = 0.32
Source of funding Centers for Disease Control and Prevention
Comments Dr Sterling reports receiving research grant funding from Bristol-Myers Squibb and Pfizer for HIV observational studies, Dr Hamilton, being employed by Family Health International; Dr Weiner, receiving research grant funding from Sanofi-Aventis; Dr Hordburgh, receiving payments from Otuska America Pharmaceutical for scientific reviews of study protocols.
¹TST- tuberculin Skin Test

Appendix D: Evidence tables – RQ HH & II - Diagnosis of active TB
215
A.2.21 Spyridis,N.P., Spyridis,P.G., et al. (2007)
Bibliographic reference
Spyridis,N.P., Spyridis,P.G., et al. (2007) The effectiveness of a 9-month regimen of isoniazid alone versus 3- and 4-month regimens of isoniazid plus rifampin for treatment of latent tuberculosis infection in children: results of an 11-year randomized study. Clinical Infectious Diseases, 45 (6) 715-22.
Study type RCT
Study quality Population matches population of interest
Intervention matches intervention of interest
Unclear if an appropriate method of randomisation was used
Unclear if there was adequate concealment of allocation
Groups were not comparable at baseline since randomisation occurred in two periods and the population examined was different during the second period with an increased number of immigrants.
The comparison groups received the same care apart from the intervention studied
Blinding: neither participants nor clinicians were kept blind to treatment allocation. Investigators reviewing radiographs were kept blind to patient’s treatment allocation and other confounding factors.
Follow up: varied in length between treatment groups: patients in study group A and B were followed up for longer than those in groups C and D. Groups were not comparable for treatment completion: participants in the isoniazid alone group had a lower rate of completion. Length of follow up was appropriate.
Unclear if groups were comparable for the availability of outcome data.
Definition of outcome was unclear, for example parents were instructions regarding the recognition of symptoms that may suggest drug related adverse events.
A valid and reliable method to determine outcomes was not used, for example parents were responsible for performing urine tests to record adherence and blood tests to detect liver toxicity were not performed routinely.
Study was performed in two periods with separate randomisation meaning that some comparisons were indirect between study groups.
Number of patients Randomised= 926
isoniazid, 9 months= 232
isoniazid and rifampicin, 4 months, period 1= 238
isoniazid and rifampicin, 4 months, period 2= 236
isoniazid and rifampicin, 3 months = 220
Patient characteristics Inclusion
Children aged < 15 years
Asymptomatic with positive TST¹ results
Normal chest radiograph findings, or inactive fibrotic or calcified parenchymal and/or lymph node lesions

Appendix D: Evidence tables – RQ HH & II - Diagnosis of active TB
216
Bibliographic reference
Spyridis,N.P., Spyridis,P.G., et al. (2007) The effectiveness of a 9-month regimen of isoniazid alone versus 3- and 4-month regimens of isoniazid plus rifampin for treatment of latent tuberculosis infection in children: results of an 11-year randomized study. Clinical Infectious Diseases, 45 (6) 715-22.
Exclusion
History of positive BCG vaccination
Known immunodeficiency or other chronic conditions that may influence TST¹ result
Baseline characteristics
Period 1 Period 2
isoniazid, 9 months. N=232
Isoniazid and rifampicin, 4 months. N=238
P value Isoniazid and rifampicin, 4 months. N= 236
Isoniazid and rifampicin, 3 months. N = 220
P value
Male sex 120 114 0.39 136 106 0.043
Age mean years ±SD²
9.1± 3.7 9.2±3.3 8.4 ± 3.4 7.9 ± 3.6
Greek nationality
142 149 0.751 90 87 0.839
Immigrant 90 89 0.991 146 133 0.902
Intervention isoniazid and rifampicin, 4 months, period 1= 238
Isoniazid: 10 mg/kg daily, maximum 300 mg, for 4 months
Rifampicin: 600 mg daily, for 4 months
isoniazid and rifampicin, 4 months, period 2= 236
Isoniazid: 10 mg/kg daily, maximum 300 mg, for 4 months
Rifampicin: 600 mg daily, for 4 months
isoniazid and rifampicin, 3 months = 220
Isoniazid: 10 mg/kg daily, maximum 300 mg, for 3 months
Rifampicin: 600 mg daily, for 3 months
Doses were given by parents at home
Comparison isoniazid, 9 months= 232
Isoniazid: 10 mg/kg daily, maximum 300 mg, for 9 months

Appendix D: Evidence tables – RQ HH & II - Diagnosis of active TB
217
Bibliographic reference
Spyridis,N.P., Spyridis,P.G., et al. (2007) The effectiveness of a 9-month regimen of isoniazid alone versus 3- and 4-month regimens of isoniazid plus rifampin for treatment of latent tuberculosis infection in children: results of an 11-year randomized study. Clinical Infectious Diseases, 45 (6) 715-22.
Doses were given by parents at home
Length of follow up isoniazid, 9 months= 7-11 years
isoniazid and rifampicin, 4 months, period 1= 7-11 years
isoniazid and rifampicin, 4 months, period 2= 3-7 years
isoniazid and rifampicin, 3 months = 3-7 years
Participants were followed up for at least 3 years
Location Athens, Greece
Outcomes measures and effect size
Tuberculosis incidence
New radiographic findings indicating “possible active disease.”
No cases of clinical TB were documented at the end of therapy and during follow up in any of the study groups.
Period 1 Period 2
Fibrosis or calcification
isoniazid, 9 months. N=232
Isoniazid and rifampicin, 4 months. N=238
P value Isoniazid and rifampicin, 4 months. N= 236
Isoniazid and rifampicin, 3 months. N = 220
P value
Lung parenchyma
12 10 NS 8 7 NS
Lymph nodes 63 62 NS 75 73 NS
Lung parenchyma and lymph nodes
42 55 NS 68 60 NS
Normal 115 111 NS 85 80 NS
Adherence
Excellent if patients sent positive urine strips and followed appointments without delay
Moderate if patients had to be reminded with telephone contact by the study nurse to send urine strips or to return for follow up visits
Poor if no medication was detected in > two urine strips in the 9 month isoniazid group and ≥1 times in the 3-4 month treatment

Appendix D: Evidence tables – RQ HH & II - Diagnosis of active TB
218
Bibliographic reference
Spyridis,N.P., Spyridis,P.G., et al. (2007) The effectiveness of a 9-month regimen of isoniazid alone versus 3- and 4-month regimens of isoniazid plus rifampin for treatment of latent tuberculosis infection in children: results of an 11-year randomized study. Clinical Infectious Diseases, 45 (6) 715-22.
protocols or if patients did not return for follow up visits, despite having received reminder phone calls, or if they were lost to follow up.
Period 1 Period 2
Adherence to treatment
isoniazid, 9 months. N=232
Isoniazid and rifampicin, 4 months. N=238
P value Isoniazid and rifampicin, 4 months. N= 236
Isoniazid and rifampicin, 3 months. N = 220
P value
Compliance
Excellent
Moderate
Poor
152
48
32
185
35
18
0.11 203
18
15
197
12
11
0.533
Refusal to take medication
21 3 0.005 5 2 NS
Nausea/epigastric pain
13 7 NS 2 2 NS
Discontinuation by family physician
5 18 0.005 9 5 NS
Poor understanding of instruction
9 7 NS 2 3 NS
Source of funding Second Department of Pediatrics of Athens University
Comments
TST¹- tuberculin skin test

Appendix D: Evidence tables – RQ HH & II - Diagnosis of active TB
219
A.2.22 Byrd,R.B., Horn,B.R., Griggs,G.A..(1997)
Bibliographic reference Byrd,R.B., Horn,B.R., Griggs,G.A..(1977). Isoniazid chemoprophylaxis. Association with detection and incidence of liver toxicity. Archives of Internal Medicine. 137 (9) 1130-33.
Study type RCT
Study quality Population matches population of interest
Intervention matches intervention of interest
Randomisation: An appropriate method of randomisation was used; random number table with allocation concealment.
Groups were comparable at baseline
Comparison groups received the same care apart from the intervention studied
Blinding: participants and clinicians were blinded to treatment allocation. Investigators were blinded to allocation but unclear if blinded to other confounding factors.
Follow up: Unclear if groups were followed up beyond the 3 month treatment period. Unclear if groups were followed up for an equal amount of time; the placebo group were crossed over to treatment group following 3 months and were followed up for a further 3 months. Unclear if follow up length was adequate.
The study used a precise definition of outcome and a valid and reliable method was used to determine outcome.
As mentioned, this trial incorporated a cross over element to the placebo group. The crossed over participants went on to add to the data collected on the treatment arm of the study but it is unclear to what extent this effected the data as results are reported in percentages and numbers cannot be separated.
Number of patients Randomised = 120
Isoniazid group= 60
Placebo group= 60
Patient characteristics Inclusion
Aged > 17 years
Latent TB criteria as advocated by the American Thoracic Society of 1974
Exclusion
Evidence of clinical liver disease
Baseline SGOT¹ test of greater than 20 IU
Presence of co-existing non tuberculosis disease likely to result in death within a short period of time
Individuals who believed they would be transferred to other areas within six months
Baseline characteristics
Isoniazid group= 60 Placebo group= 60
Age
<30
19
23
22
25

Appendix D: Evidence tables – RQ HH & II - Diagnosis of active TB
220
Bibliographic reference Byrd,R.B., Horn,B.R., Griggs,G.A..(1977). Isoniazid chemoprophylaxis. Association with detection and incidence of liver toxicity. Archives of Internal Medicine. 137 (9) 1130-33.
30-39
>40
18 13
Sex
Male
Female
44
16
44
16
Race
White
Black
Other
Unknown
46
11
1
2
38
12
3
7
Alcohol taken
None or 1 oz a day
>1 oz a day
43
17
40
20
Intervention Isoniazid
Isoniazid: 300mg daily, for 9 months
Results taken from first 3 months of treatment
Comparison Placebo
Placebo tablet: daily, for 3 months
Results taken from first 3 months of treatment, then an additional three months follow up in the treatment group.
Length of follow up Results taken from 3 months into the trial
Location USA
Outcomes measures and effect size
Hepatotoxicity
Defined by a raised SGOT¹
Percent abnormal
Month of therapy Isoniazid Placebo P value
1 5.0 3.3 NS
2 14.0 3.4 <0.05
3 14.0 1.7 <0.025

Appendix D: Evidence tables – RQ HH & II - Diagnosis of active TB
221
Bibliographic reference Byrd,R.B., Horn,B.R., Griggs,G.A..(1977). Isoniazid chemoprophylaxis. Association with detection and incidence of liver toxicity. Archives of Internal Medicine. 137 (9) 1130-33.
Clinical symptoms of hepatotoxicity
Number of participants (percentage) during non cross over portion of trial.
Isoniazid Placebo
Muscle aching 18 (30.0) 17 (28.3)
Joint aching 14 (23.3) 11 (18.3)
Flu-like symptoms 8 (13.3) 10 (16.7)
Fever 10 (16.7) 4 (6.7)
Chills 9 (15.0) 5 (8.3)
Skin rash 7 (11.7) 6 (10.0)
Clay colored stools 6 (10.0) 3 (5.0)
Dark urine 6 (10.0) 0 (0.0)
Anorexia 5 (8.3) 5 (8.3)
Nausea 2 (3.3) 1 (1.7)
Yellow cast to sclera 1 (1.7) 1 (1.7)
Source of funding Unclear
Comments
SGOT¹- better known as serum aspartate aminotransferase

Appendix D: Evidence tables – RQ HH & II - Diagnosis of active TB
222
A.2.23 Ferebee SH., Mount FW., Murray FJ.(1963)
Bibliographic reference
Ferebee,S.H., Mount,F.W., Murray,F.J.(1963) A controlled trial of isoniazid prophylaxis in mental institutions.
American Review of Respiratory Disease. 88 161-75.
Study type RCT
Study quality Intervention matches intervention of interest
Population does not match population of interest. TST¹ negative patients were included however subgroup analysis was possible
Unclear if appropriate method of randomisation was used. Unclear if treatment allocation was concealed.
Groups were not comparable at baseline in terms of mortality, weight and abnormal x-rays prior to enrolment.
Groups received the same care apart from the intervention under study
Blinding: both participants and clinicians were blinded to treatment allocation. Investigators were blinded to treatment allocation unclear if blinded to confounding factors.
Follow up: groups were followed up for an equal length of time. Unclear if groups were comparable for treatment completion, unclear if groups were comparable for availability of outcome data. Follow up doesn’t extend beyond treatment period.
Study used a precise definition of outcome, however unclear how reliable diagnosis of active tuberculosis was; decision was made using a blinded review team looking at the patient history and available chest x-rays.
Number of patients Randomised= 25210
Placebo group= 12,326
Isoniazid group= 12,884
Patient characteristics Inclusion
Patients admitted to psychiatric institutions
Present on the wards before the end of the first month of the programme who took pills at any time during the year
Exclusion
Patients on the wards who did not take any of the medication
Baseline characteristics
Placebo n=12,326 Isoniazid n=12,884
number percent number percent
Sex
Male
Female
5704
6613
46.4
53.6
6276
6599
48.8
51.2
Race
White
10,916
11,187
88.6
11.4
11,187
1688
86.9
13.1

Appendix D: Evidence tables – RQ HH & II - Diagnosis of active TB
223
Bibliographic reference
Ferebee,S.H., Mount,F.W., Murray,F.J.(1963) A controlled trial of isoniazid prophylaxis in mental institutions.
American Review of Respiratory Disease. 88 161-75.
Black
Present Hospitalisation
< 2 years
2-4 years
5-9 years
10-14 years
>15 years
Not available
1398
1699
2332
1762
5110
25
11.3
13.8
18.9
14.3
41.5
0.2
1766
2049
2602
1744
4686
37
13.7
15.9
20.2
13.5
36.4
0.3
Infection status
Abnormal chest x ray
TST¹ positive
TST¹ negative
Not known
1071
6484
3954
817
8.7
52.6
32.1
6.6
1216
6403
4333
932
9.5
49.7
33.6
7.2
Intervention Isoniazid group
In patients 15 years old or more:
Isoniazid: 300mg daily, for one year
Children, younger than 15 years:
Isoniazid: proportionally smaller doses, unclear exact dosing, for one year
Average daily dose was 4.3 mg/kg of body weight for those receiving 100 mg a day; 5.0 mg/kg for 200 mg a day; 4.6 mg/kg for 300 mg a day.
Comparison Placebo:
Matching pills daily, for one year
Length of follow up None beyond treatment period
Location Psychiatric institutions in Wisconsin, Georgia, Michigan, and Massachusetts
Outcomes measures and effect size
Incidence of TB
Number of cases of active tuberculosis developing during medication year
Placebo group = 6,484 Isoniazid group= 6,403

Appendix D: Evidence tables – RQ HH & II - Diagnosis of active TB
224
Bibliographic reference
Ferebee,S.H., Mount,F.W., Murray,F.J.(1963) A controlled trial of isoniazid prophylaxis in mental institutions.
American Review of Respiratory Disease. 88 161-75.
Cases 7 0
Rate per 1000 1.1 0.0
Number of cases developing after medication year
Length of observation varied among institutes and the total of cases is not separated by time
Placebo group = 6,484 Isoniazid group= 6,403
Cases 17 5
Source of funding National Tuberculosis Association
Comments
¹TST- tuberculin skin test

Appendix D: Evidence tables – RQ HH & II - Diagnosis of active TB
225
A.2.24 Debre,R., Perdrizet,S., et al.(1973)
Bibliographic reference Debre,R., Perdrizet,S., et al. (1973) Isoniazid chemoprophylaxis of latent primary tuberculosis: in five trial centres in France from 1959 to 1969. International Journal of Epidemiology. 2 (2) 153-60.
Study type RCT
Study quality Intervention matches intervention of interest
Population matches population of interest
Randomisation: Method was poor, involving separating participants by date of birth.
Unclear if allocation was concealed
Groups were not comparable at baseline for all major confounding factors, participants in the treatment group were younger.
Comparison groups received the same care apart from the intervention studied. The treatment groups received “at least 5 months” to “over a year” of isoniazid; some variability within this group can be assumed.
Blinding: Neither participants nor clinicians were blinded to treatment group. No placebo was offered to the control group. Investigators were neither blinded to participant’s treatment allocation or to other confounding factors.
Follow up: all groups were followed up for an equal length of time. Unclear if groups were comparable for loss to follow up. Groups were not comparable for number of patients for whom outcome data was not available. Follow up was for an appropriate length of time.
29% of those initially enrolled were later eliminated from the trial because of an altered treatment plan breaking the protocol. This lead to subsequent differences between study groups such as lower socio-economic status, greater contact with other family members with TB and poorer housing conditions in the isoniazid group.
The study used a precise definition of outcome. A valid and reliable method was used to determine outcome based on clinical and radiological findings, however only a small proportion were biologically tested.
Number of patients Participants= 2970
Isoniazid group= 1519
Control group = 1451
Patient characteristics Inclusion
Aged 5 - 24 years
Recent positive TST¹
Exclusion
Clinical or radiological signs of TB
Previous BCG vaccination
Baseline characteristics
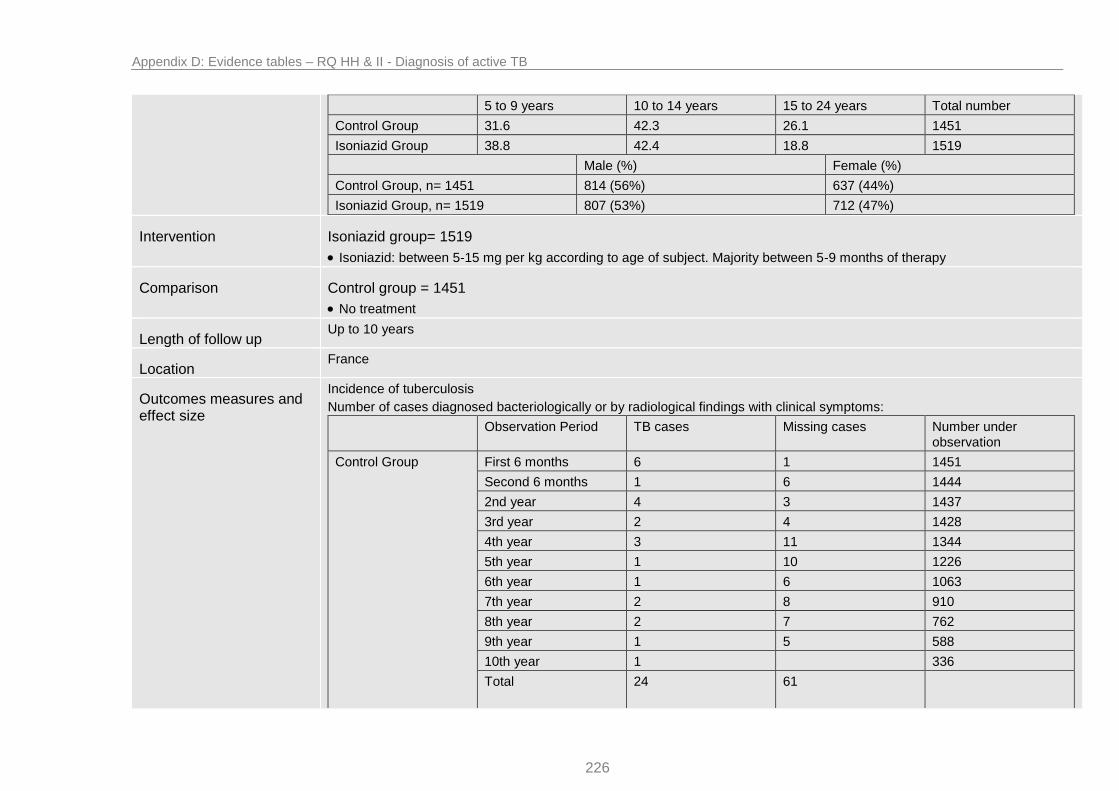
Appendix D: Evidence tables – RQ HH & II - Diagnosis of active TB
226
5 to 9 years 10 to 14 years 15 to 24 years Total number
Control Group 31.6 42.3 26.1 1451
Isoniazid Group 38.8 42.4 18.8 1519
Male (%) Female (%)
Control Group, n= 1451 814 (56%) 637 (44%)
Isoniazid Group, n= 1519 807 (53%) 712 (47%)
Intervention Isoniazid group= 1519
Isoniazid: between 5-15 mg per kg according to age of subject. Majority between 5-9 months of therapy
Comparison Control group = 1451
No treatment
Length of follow up Up to 10 years
Location France
Outcomes measures and effect size
Incidence of tuberculosis
Number of cases diagnosed bacteriologically or by radiological findings with clinical symptoms:
Observation Period TB cases Missing cases Number under observation
Control Group First 6 months 6 1 1451
Second 6 months 1 6 1444
2nd year 4 3 1437
3rd year 2 4 1428
4th year 3 11 1344
5th year 1 10 1226
6th year 1 6 1063
7th year 2 8 910
8th year 2 7 762
9th year 1 5 588
10th year 1 336
Total
24 61

Appendix D: Evidence tables – RQ HH & II - Diagnosis of active TB
227
Isoniazid Group First 6 months 2 1519
Second 6 months 1 2 1517
2nd year 1 6 1514
3rd year 2 6 1506
4th year 2 4 1423
5th year 3 1309
6th year 1 10 1148
7th year 7 964
8th year 7 796
9th year 1 3 582
10th year 332
Total
10 48
“Missing” cases is not a term that is properly explained, it could be that these patients fit the criteria for exclusion.
Mortality
Number of Deaths
Observation Period Deaths Number under observation
Control Group First 6 months 1451
Second 6 months 1444
2nd year 2 1437
3rd year 1 1428
4th year 1344
5th year 1226
6th year 1 1063
7th year 910
8th year 1 762
9th year 1 588
10th year 1 336
Total 7

Appendix D: Evidence tables – RQ HH & II - Diagnosis of active TB
228
Isoniazid Group First 6 months 1519
Second 6 months 1517
2nd year 1 1514
3rd year 2 1506
4th year 1423
5th year 1309
6th year 1 1148
7th year 1 964
8th year 1 796
9th year 582
10th year 1 332
Total
7
Source of funding Supported by I.N.S.E.R.M. and Social Security Department
Comments
¹TST- Tuberculin Skin Test

Appendix D: Evidence tables – RQ HH & II - Diagnosis of active TB
229
Related Documents
![Встраиваемый духовой шкаф · 2019-11-06 · fs rxu ylfh rq z dqg hh ehqhilwv cptdi ipnf dpn fmdpnf [ru] Правила пользования Встраиваемый](https://static.cupdf.com/doc/110x72/5f0c8f027e708231d4360146/-f-2019-11-06-fs-rxu-ylfh-rq-z-dqg.jpg)


![RIVM rapport xxxxxx xxx · 5,90udssruw ˆ ˘˘˘ ghho$ sdj ydq ˘ 9ronvjh]rqgkhlg 7rhnrpvw9hunhqqlqj 3v\fklvfkh rq jh]rqgkhlg˛gh whuplqdqwhqhqg hh iihfwhqydqsuhyhqwlhyh](https://static.cupdf.com/doc/110x72/5ead476dfff06b37c8031f98/rivm-rapport-xxxxxx-xxx-590udssruw-ghho-sdj-ydq-9ronvjhrqgkhlg-7rhnrpvw9hunhqqlqj.jpg)


![Microwave - BSH Hausgerätemedia3.bsh-group.com/Documents/9001344632_E.pdf · FS RXU YLFH RQ Z DQG HH EHQHILWV CPTDI IPNF DPN FMDPNF [mk] Упатство за употреба Микробранова](https://static.cupdf.com/doc/110x72/611df645307d714728017819/microwave-bsh-hausger-fs-rxu-ylfh-rq-z-dqg-hh-ehqhilwv-cptdi-ipnf-dpn-fmdpnf.jpg)


![B C&% % 1 % 8 : G ':&% I G J & D %7L% . 3 · [ $3 hh hh$#hh 1 [hhh hh hh dhhphh #hhm#hhbhh hh&lhh < w) d?. {lhh hh$ @b#-p 3 c 3:;hhh $# #" )j p d] #hhm#hhbhh hh&x %hh | x4 3 hh?hh](https://static.cupdf.com/doc/110x72/5ea61d5cbec94348cc54f9a5/b-c-1-8-g-i-g-j-d-7l-3-3-hh-hhhh-1-hhh-hh-hh.jpg)