DOCUMENT RESUME ED 368 095 EC 302 840 AUTHOR Saccuzzo, Dennis P. And Others TITLE Identifying Underrepresented Disadvantaged Gifted and Talented Children: A Multifaceted Approach. (Volumes 1 and 2.) INSTITUTION San Diego State Univ., Calif. SPONS AGENCY Department of Education, Washington, DC. PUB DATE 94 CONTRACT R206A00569 NOTE 147p.; For individual chapters, see EC 302 841-846. PUB TYPE Reports Research/Technical (143) Info:mation Analyses (070) EDRS PRICE MF01/PC06 Plus Postage. DESCRIPTORS *Ability Identification; Aptitude Tests; Cultural Differences; Culture Fair Tests; *Disadvantaged Youth; Educational Diagnosis; Elementary Secondary Education; Ethnic Groups; *Gifted; *Intelligence Tests; Low Income Groups; Minority Group Children; *Screening Tests; Test Bias IDENTIFIERS *Raven Progressive Matrices; *San Diego Unified School District CA ABSTRACT The primary purpose of this study was to determine if a model for identifying gifted and talented students could be developed which would provide equal access to gifted programs for children of all ethnic and economic backgrounds. The culturally and ethnically diverse San Diego City School District provided a pool of over 35,000 children referred for giftedness whose records were coded and analyzed through this research. Based on these findings, a model designed to increase the proportion of ethnically and economically diverse students referred for assessment and identified as gifted was implemented and evaluated, with the Raven Progressive Matrices used as the criterion measure of intellectual ability. Component research papers by Dennis P. Saccuzzo, Nancy E. Johnson and Tracey L. Guertin cover the following topics: the use of the Raven Matrices in an ethnically diverse gifted population; use of the Wechsler Intelligence Scale for Children Revised (WISC-R) with disadvantaged gifted children; evaluation of risk factors in selecting children for gifted programs; information processing in gifted versus nongifted African-American, Latino, Filipino, and White children; ethnic and gender differences in locus of control in at risk gifted and nongifted children; and understanding gifted underachievers in an ethnically diverse population. Appendices include a teacher nomination form, a student/parent information form, and an independent evaluation review, in which author Margie Kitano finds the new model to have significantly impacted school system practice and increased the number and proportion of underrepresented students referred and identified although failing to fully meet the initial criterion for equal access. (Contains 222 references.) (Author/PB)

Welcome message from author
This document is posted to help you gain knowledge. Please leave a comment to let me know what you think about it! Share it to your friends and learn new things together.
Transcript

DOCUMENT RESUME
ED 368 095 EC 302 840
AUTHOR Saccuzzo, Dennis P. And OthersTITLE Identifying Underrepresented Disadvantaged Gifted and
Talented Children: A Multifaceted Approach. (Volumes1 and 2.)
INSTITUTION San Diego State Univ., Calif.SPONS AGENCY Department of Education, Washington, DC.PUB DATE 94CONTRACT R206A00569NOTE 147p.; For individual chapters, see EC 302
841-846.PUB TYPE Reports Research/Technical (143) Info:mation
Analyses (070)
EDRS PRICE MF01/PC06 Plus Postage.DESCRIPTORS *Ability Identification; Aptitude Tests; Cultural
Differences; Culture Fair Tests; *DisadvantagedYouth; Educational Diagnosis; Elementary SecondaryEducation; Ethnic Groups; *Gifted; *IntelligenceTests; Low Income Groups; Minority Group Children;*Screening Tests; Test Bias
IDENTIFIERS *Raven Progressive Matrices; *San Diego UnifiedSchool District CA
ABSTRACTThe primary purpose of this study was to determine if
a model for identifying gifted and talented students could bedeveloped which would provide equal access to gifted programs forchildren of all ethnic and economic backgrounds. The culturally andethnically diverse San Diego City School District provided a pool ofover 35,000 children referred for giftedness whose records were codedand analyzed through this research. Based on these findings, a modeldesigned to increase the proportion of ethnically and economicallydiverse students referred for assessment and identified as gifted wasimplemented and evaluated, with the Raven Progressive Matrices usedas the criterion measure of intellectual ability. Component researchpapers by Dennis P. Saccuzzo, Nancy E. Johnson and Tracey L. Guertincover the following topics: the use of the Raven Matrices in anethnically diverse gifted population; use of the WechslerIntelligence Scale for Children Revised (WISC-R) with disadvantagedgifted children; evaluation of risk factors in selecting children forgifted programs; information processing in gifted versus nongiftedAfrican-American, Latino, Filipino, and White children; ethnic andgender differences in locus of control in at risk gifted andnongifted children; and understanding gifted underachievers in anethnically diverse population. Appendices include a teachernomination form, a student/parent information form, and anindependent evaluation review, in which author Margie Kitano findsthe new model to have significantly impacted school system practiceand increased the number and proportion of underrepresented studentsreferred and identified although failing to fully meet the initialcriterion for equal access. (Contains 222 references.) (Author/PB)
U.S. DEPARTMENT OF EDUCATIONOffice of Educational Research and improvement
EDUCATIONAL RESOURCES INFORMATIONCENTER (ERIC)
KThis document has been reproduced asreceived from the person or organizationonginating .1
r Minor changes have been made to improvereproduct.on quahty
Points of view or opinions slated in Mrs docu.ment do not necessarily represent Wilda!OERI position or policy
-...IA, 4.
.
'' .;'
.
. ' .. .,. '
.
,
-.. ,

IDENTIFYING UNDERREPRESENTED DISADVANTAGED GIP-1ED AND TALENTED
CHILDREN: A MULTIFACETED APPROACH
(Volume 1 & 2 Set)
Dennis P. Saccuzzo, Nancy E. Johnson, & Tracey L. Guertin
San Diego State University
This research was funded by Grant R206A00569, U.S. Department of Education, Jacob JavitsGifted and Talented Discretionary Grant Program.
The authors express their appreciation to the San Diego Unified City Schools, to Gifted andTalented Education (GATE) Administator David P. Hermanson, and to the following schoolpsychologists: Will Boggess, Marcia Dijiosia, Eva Jarosz, Dimaris Michalek, Lorraine Rouse, Ben Sy,and Daniel Williams.
Correspondence should be addressed to Dennis P. Saccuzzo, joint San Diego St;:te/University of California, San Diego Doctoral Training Program, 6363 Alvarado Court, Suite 103, SanDiego, California 92120-4913 (Telephone: 619-594-2844 / FAX: 619-594-6780 / e-mail:[email protected]).
CD 1994
Do not reproduce in any form without express written permission from the authors.
3
PREFACE
The present two volume set represents some of the major findings of a three year Jacob Javitsgrant (#R206A00569) funded by the U. S. Department of Education entitled: IdentifyingUnderrepresented Disadvantaged Gifted and Talented Children: A Multifaceted Approach. Volume 1presents an overview of the project and includes an invited article for Gifted Child Quarterly by MargieKatino of San Diego State University (see Appendix III toVolume 1). Professor Kitano's article provides
an independent evaluation of the results of the grant.Volume 2 is divided into 6 chapters. These chapters provide the technical basis for the conclusions
reached in Volume 1 and describe in detail the secondary aspectsof the grant.This two volume set represents our best efforts to summarize and disseminate our findings
within the severe time constraints of the termination of our funding asof 12/31/93. While the informationprovided is of considerable relevance to the attainment of equal access togifted and talented programs,it is important to emphasis that we have far more data than it waspossible to present in analyzed formby the deadlines under which we operated. We plan to continue to refine the various manuscripts thatcomprise Volume 2 and to add additdonal manuscripts to augmentand support the findings presented
herein.The authors are indebted to numerous individuals. We would like to thank our technical monitor,
Norma Lindsay, for her strong support. We are also indebted to the San Diego Unified School System,
to gifted and talented program administrator, David Hermanson, and to the School Psychologists whoadministered the thousands of tests that provided the basis for our analyses. We would also like tothank the more than 30 special studies students who enrolled for independent study under ProfessorsJohnson and Saccuzzo. These excellent students aided in the data collection and data input, and inreturn received invaluable hands-on-experience in dealingwith real-world research problems. We wouldalso like to thank Arlysse Kienle fer her role in typing several versions of the various manuscripts, andto Susan McLaughlin for her role in the data collection and study of locus of control. Helen Veinbergsand Chris Bernet also played a significant role in the early stages of the data collection process. Inaddition, numerous San Diego State and University of California, San Diego students participated inprofessional conventions by presenting preliminary findings based on data collected for this grant.
Nancy E. Johnson's predoctoral studies were funded, in part, by funds from this grant. Herdoctoral dissertation is included in its entirety in Volume 2. In addition, this grant funded a year of fulltime postdoctoral study for Dr. Johnson. Dr. Johnson participated in all phases of this work and conducted
the lion's share of the data analyses.Although many people played a critical role in this project, the authors are solely responsible
for its contents. We welcome comments and criticisms, and will do our best to incorporate feedbackinto any final published manuscript. We can only hope that in some small way the present findingscontribute to our understanding of identifying traditionally underrepresented gifted children andachieving equal access in selecting children from all walks of life for gifted programs.
Dennis P. SaccuzzoNancy E. JohnsonTracey L. Guertin
12/17/93
4
Volume 1
Appendix I
Appendix II
Appendix III
Volume 2
Chapter 1
Chapter 2
Chapter 3
Chapter 4
Chapter 5
Chapter 6
TABLE OF CONTENTS
Teacher Nomination Form
Student/Parent Information Form
In Search of an Equal Access Model: Review of
Saccuzzo's "Identifying UnderrepresentedDisadvantaged GATE Children" by Margie K. Kitano
Use of the Raven Progressive Matrices Test in an
Ethnically Diverse Gifted Population
Use of the WISC-R with Disadvantaged Gifted
Children: Current Practice, Limitations, and Ethical
Concerns
Evaluation of Risk Factors in Selecting Children
for Gifted Programs
Part 1 Gifted Children at Risk: Evidence of an Association
between Low Test Scores and Risk Factors
Part 2 Intelligence, Aptitude, and Achievement in Gifted
Children With and Without Language Risk
Information-Processing in Gifted versus NongiftedAfrican-American, LAtino, Filipino, and White Children:
Speeded versus Nonspeeded Paradigms
Ethnic and Gender Differences in Locus of Control
in At Risk Gifted and Nongifted Children
Understanding Gifted Underachievers in an
Ethnically Diverse Population
1
16
18
19
27
29
43
79
81
93
103
119
127
References135
5
IDENTIFYING UNDERREPRESENTED DISADVANTAGED GIFTED AND TALENTED
CHILDREN: A MULTIFACETED APPROACH
(Volume 1)
Dennis P. Saccuzzo, Nancy E. Johnson, az Tracey L. Guertin
San Diego State University
This research was funded by Grant R206A00569, U.S. Departmentof Education, Jacob Javits Gifted and Talented Discretionary GrantProgram.
The authors express their appreciation to the San Diego UnifiedCity Schools, to Gifted and Talented Education (GATE) AdministratorDavid P. Hermanson, and to the following school psychologists: WillBoggess, Marcia Dijiosia, Eva Jarosz, Dimaris Michalek, Lorraine Rouse,Ben Sy, and Daniel Williams.
Correspondence should be addressed to Dennis P. Saccuzzo, JointSan Diego State/University of California, San Diego Doctoral TrainingProgram, 6363 Alvarado Court, Suite 103, San Diego, California 92120-4913 (Telephone: 619-594-2844 / FAX: 619-594-6780 / e-mail:[email protected]).
1994Do not reproduce in any form without express written permission from
the authors.
0

IDENTIFYING UNDERREPRESENTED DISADVANTAGED GIFTED AND TALENTEDCHILDREN: A MULTIFACETED APPROACH
Grant #R206A00569, U.S. Department of Education, Jacob Javits Gifted and TalentedDiscretionary Grant Program
Students from diverse social, cultural, linguistic, and economic backgrounds are consistentlyunder identified for Gifted and Talented Education (GATE) programs in every major city in the nation.More specifically, there are systematic discrepancies between the percentages of ethnic minority studentsin GATE programs and their percentages in their respective school districts. The problem of the underidentification of ethnic minorities in GATE programs is broad and persistent. As Richert (1985, 1987)and Colleagues (Richert, Alvino, & McDonnel, 1982) have repeatedly noted, figures reported by theU.S. Department of Education's Office of Civil Rights reveal that groups such as African-American andLatino/Hispanic are under represented by as much as 70% in gifted programs throughout the nation. Astudy in California found discrepancies between the percentage of ethnic minorities in GATE programsand the percentages in their respective school districts in each of the 193 school districts that wereevaluated over a three year period (Sunset Review Advisory Committee ifi Report, 1986).
Equal access means that children from diverse ethnic and economic groups are evaluated andselected for GATE programs in proportion to their numbers in the district as a whole. The primarypurpose of "Identifying Underrepresented Disadvantaged Gifted and Talented Children: A MultifacetedApproach", a grant supported by the Jacob Javits Gifted and Talented Discretionary Grant Program ofthe U.S. Department of Education, was to determine if a model of selection could be developed thatwould provide equal access to gifted programs for children of all ethnic and economic backgrounds.The San Diego City School District, which is among the most diverse in the country, provided an excellentsite for determining if the lofty goal of equal access could be achieved on a large scale basis. The districthas over 123,000 children, with approximately 29% Latino/Hispanic, 38% Caucasian, 16% African-American, and the remainder in significant numbers across five additional ethnic backgrounds (seeFigure 1).
Figure 1. 1992/1993 district ethnic composition: San Diego Unified School District
2
Z z Z< < < <
uC2 < Eu1'
< 1 <U 42Z
<U
E<z
ETHNICITY
cr)
7
There were a number of limiting factors in the present effort to develop -an equal access modelof selection. First and foremost, IT WAS NECESSARY TO APPLY A CONSISTENT APPROACH TOSELECTION ACROSS ALL ETHNIC BACKGROUNDS. The present project was not simply todetermine if more underrepresented childrm could be identified for GATE programs, given some special
or new procedure applied specifically to that group. It was an attempt to determine if a single standardcould be applied to the entire population and produce an equal access result. Special ethnic normscould not be used, and were unacceptable to all elements of the community. If something special wasbeing done for one group, it had to be applied to all.
A second limiting factor was that THE METHODS OF IDENTIFICATION WOULD BEOBJECTIVE AND RELIABLE. This limitation ruled out subjective rating systems and other approaches
whose results could not be rigorously repeated.
The third limiting factor was that THE SELECTION PROCESS WOULD HAVE TO BEPRACTICAL AND COST EFFECTIVE. Given a school systemof over 123,000 children, as many as5-10,000 children had to be evaluated yearly. A procedure was needed that could successfully accomplishthis evaluation process without the need for a small army of trained professionals, which was notavailable.
A fourth limiting factor was that the gifted program was anACADEMIC PROGRAM, basedon high intellectual ability or high achievement. There were no programs available for other types ofgiftedness, such as exceptional artistic or musical ability.
The final limiting factor was that THE PRESENT STUDY WAS INITIATED WITHIN ASCHOOL DISTRICT THAT ALREADY HAD A LARGE,THRIVING GIFTED PROGRAM DATINGBACK TO THE 1950'S, WITH AN ESTABLISHED SYSTEM OF IDENTIFICATION ALREADY INPLACE AND AN ADMINISTRATIVE UNIT TO IMPLEMENT THIS SYSTEM.
Within these limitations, the present study provided one of the most extensive, if not the most
extensive, study of the efficacy of standard psychometric tests in providing a uniform standard ofidentification for giftedness across ethnic background. When theproposal was first funded in October
of 1990, the traditional identification procedures used by the school system, which relied heavily onstandardized group and individual achievement and intelligence tests, was well underway. The twoprimary measures in use were the Developing Cognitive Abilities Test (DCAT), a group test of verbal,
quantitative, and spatial aptitude, and the Wechsler Intelligence Scale for Children-Revised (WISC-R),
the most widely used individual test of intelligence for children. The process of implementing thepresent project thus began with an evaluation of these two tests and the identification procedures that
were in use. At the same time, the efficacy of the Raven Progressive Matrices Test, a culturally reduced
measure of general intelligence, was evaluated. Prior to reporting on the results of these evaluations,
the model that was ultimately recommended, and the many practical problems that were encountered,it is important to note the secondary goals of the present project.
Secondary goals for the present project were as follows: (1) identify and select greater numbers
and an increased proportion of underrepresenteddisadvantaged children; (2) test the efficacy of a battery
of nontraditional micro-computerized information-processing tasks and determine, if any, the uniqueinformation-processing strengths of underrepresented children; (3) evaluate the efficacy of measures of
locus of control in selecting underrepresentedchildren for gifted programs; and (4) utilize archival data
to test hypotheses about ethnic differences in the pattern of intellectual strengths. In meeting the goals
of the study, the records of more than 35,000 children referred for giftedness were coded and analyzed.
The report will begin with an analysis of the primary objective: To develop an objective, reliable
method of evaluating large numbers of children for giftedness that will result in equal access. Each of
the four secondary goals will be addressed in Volume 2.
3

4
I. The Gs; al of Proportional Representationin a Gifted Prwini.During the early months of the study, we monitored the -lelection method that already had been
in progress. The method in use had evolved over several years, ,% Ad had, in fact, resulted in significantincreases in the percentage of nonwhites being selected for the gifte:!. programs (see Figure 2). As Figure2 shows, the population of nonwhites selected for the gifted progr,rf, had increased substantially, interms of both proportion and numbers.
Figure 2. White and Nonwhite GATE certified students, 1982/83 - 1989/90
7000
5000
4000
3000
Z 2000
1000
01 t
1032 1963 1004 1965 1986 1967 1968 1%9
YEAR
A. Identification Procedures in Use Prior to the Study
Nonwhiteo-- White
The process in use was as follows. Children were nominated for evaluation of giftedness byteachers, principals, parents, or self. In addition, central nominations were made at the GATE office ofchildren who had obtained at least one score in the 8th or 9th Stanine on the California Test of BasicSkills (C1f:3S), a standardized group achievement test that was given to each child in the district atregular intervals. The purpose of central nominations was to increase referrals for potentially qualifiedAfrican-American and Latino/Hispanic children, as these two groups were historicallyunderrepresentedin the nomination process. Next, all nominated children were given the Developing Cognitive AbilitiesTest (DCAT). The DCAT was group administered at the school site. All children who obtained a scoreat the 90th percentile or above on the DCAT were then referred for individual testing by one of seven(later reduced to five) school psychologists. The psychologists had a choice of administering a WechslerIntelligence Scale for Children-Revised (WISC-R), Kaufman Assessment Battery for Children (K-ABC),or Stanford-Binet Intelligence Scale, Fourth Edition. For all but a very small percentage of children, theWISC-R was used.
To qualify for the gifted program based on intellectual achievement, a child had to obtain ascore of 130 or greater (i.e., at least 2 standard deviations above the mean) on the WISC-R. In addition,the selection model took potential risk factors into account. Six risk factors were considered: (1) economicdisadvantage (e.g., poverty); (2) cultural differences (e.g., limited experience with the dominant culture);(3) language (e.g., primary language of parent or student is other than English); (4) environmentaldisadvantage (e.g., high crime area, overcrowding, noise); (5) social/emotional (e.g., separation, divorce,
or death of a parent; adjustment problems); and (6) health ( e.g., asthma, childhood cancer, etc.). Morerecently, the district combined cultural and language risk into a single category.
Risk factors were evaluated by the use of self-report questionnaires (see Appendix I and 11) sent
to teachers and parents. The data were then evaluated by a school psychologist. If it was determinedthat a child had two or more risk factors, and the child had a Full Scale WISC-R IQ score less than 130
but greater than or equal to 120, the child was admitted into the gifted program on the basis of highpotential. The consideration of risk factors was applied equally across ethnic backgrounds, and so wasconsistent with the single standard requirement in the selection process.
9

While the selection model described above had resulted in a steady increase in the proportionof nonwhites selected for the gifted program, careful monitoring within the context of the present studyrevealed that two groups, African-American and Latino/Hispanic, were consistently underidentified.Figure 3 shows the percentage of children selected for the gifted program as a function of ethnicbackground using the risk factor system and the WISC-R as the final criterion measure.
Figure 3. Ethnic composition of those certified gifted by San Diego Unified School Districton the basis of WISC-R scores
100
0 WISC-R QUAUFIED0 DISTRICT %
7
As the figure shows, the WISC-R overselected Caucasians at about 100% greater than theirnumbers and underselected African-Americans and Latino/Hispanics at a rate of 2 to 4 times less thanwould be expected based on their numbers. In Volume 2, we present an in depth analysis of the WISC-R in selecting for giftedness. Our results unequivocally revealed that there is no model for using theWISC-R that can result in an equal access program, short of ethnic norms. Since no such norms exist,our data unequivocally demonstrated that the WISC-R will always result in a biased selection in favorof Caucasian and against African-American and Latino/Hispanic children. Our data revealed that theWISC-R and other highly correlated standardized intelligence tests cannot be used in an unbiased manneras a standard in selecting diverse groups of children for giftedness.
B. Monitoring The System to Obtain Equal Representation in the Evaluation Process.
In monitoring the system in use when the present project was first funded, a major problemwas uncovered: under representation in the nomination process. African-American and Latino/Hispanicchildren, the two underrepresented groups, were not being nominated for evaluations in proportion totheir numbers in the district as a whole. This under nomination of African-American and Latino/Hispanic children represented a major obstacle to the development of an equal access program.
In dealing with each of the obstacles to an equal access program, our approach was to analyzethe situation and get to the root of the problem. We discovered that in the more affluent, predominantlywhite schools, the gifted program was seen as providing superior educational opportunities for children.Consequently, white children were referred by parents, or by teachersoften with pressure from parents,in far greater numbers than would be expected based on the proportion of whites in the district as awhole. To make matters worse, there seemed to be a general lack of interest in the gifted program inmany of the less affluent schools with high concentrations of Latino/Hispanic and African-Americanchildren.
One solution to the under nomination problem would have been to screen all children for thegifted program, such as all third graders. In fact, this is exactly what we proposed. Based on preliminarypositive findings with the Raven Progressive Matrices Test, we proposed that all third grade children begiven the Raven Progressive Matrices Test as an initial estimate of cognitive abilities. This proposal was
. 5 .
ii 0

6
rejected by school administrators on the grounds that it would reintroduce comprehensive intelligencetesting in the school district. Despite assurances of confidentiality, some educators in the system fearedthat test scores would somehow get back to teachers and create nega' e self-fulfilling prophecies inlow IQ-scoring children.
We subsequently turned to a monitoring system, which proved to be quite effective. Eachmonth we gathered and analyzed the data pertaining to the proportion of children tested as a functionof ethnic background. We then created bar graphs that compared the proporfion of children tested totheir proportion in the district for each ethnic background (see Figures 4 and 5).
Figure 4. Percent tested versus percent in the district 3/1/91
so
40
10
Cd
ETHNICITY
Figure 5. Percent tested versus percent in the district 4/10/91
o '4 OF ALL THOSE TESTa)DISTRICT %
Z Z a< < ta
in' V 0-4 E
4
''um
i- ii< <Z cl
ETHNICITY
CdCdCd
Figures 4 and 5 illustrate this approach. For each ethnic background there are two bar graphs. The firstshows the percentage of children from that ethnic background who were nominated and tested forgiftedness. The second shows the actual percentage of children from that ethnic background in thedistrict as a whole. These figures provided clear, graphic data that illustrated that African-Americanand Latino/Hispanic children were underrepresented in the nomination process, and that white childrenwere overrepresented. The monitoring procedure led to an awareness of the problem within the schooldistrict that ultimately led to change.
A major effort was made to increase referrals for qualified African-American and Latino/Hispanic children. Training sessions were held for teachers. The teachers were made aware that thetwo underrepresented groups were not being referred in proportion to what would be expected basedon a model that assumes giftedness is evenly distributed in the population across ethnic backgrounds.They were given instruction in cultural differences and participated in discussions on how to spotpotential giftedness in African-American and Latino/Hispanic children. In addition, a central nominationprocedure was used at the GATE Administrative Office in which all high achieving African-Americanand Latino/Hispanic children, as evidenced by scores above the 50th percentile on standardizedachievement tests, were included in the screening process. Finally, the GATE psychologists took anactive role in soliciting nominations from individual schools. For example, one psychologist reportedgoing to a predominantly African-American school where not a single African-American had beennominated for giftedness testing. The psychologist insisted that the school provide its top 100 African-Americans for evaluation. Of these, 33 scored two standard deviations above the mean on the RavenProgressive Matrices Test!
Figures 6, 7, and 8 illustrate the success of the monitoring in terms of equal access in theevaluation process. The figures show the proportion of Latino/Hispanic, African-American, andCaucasian children evaluated, respectively, for three time periods: 9/89-6/90 (a baseline measure thatrepresents the proportion tested prior to the monitoring process), 9/90-6/91 (the first year of the project),
1 1

and 9/91-6/93. For each bar graph, proportional representation is determined by dividing the proportionof children evaluated for any given time period by their proportion in the district as a whole.
As inspection of Figure 6 indicates, theproportion of Latino/Hispanic childrennominated for evaluation of giftedness increasedsteadily throughout the three periods, from justover 0.6 prior to the monitoring process toapproximately 0.8 by the end of the first year tonearly 1.0 as of this writing. For the first time inthe history of the San Diego Unified GATEprogram, Latino/Hispanic children are beingnominated and evaluated for the gifted programin proportion to their numbers in the district.
Figure 7. Proportionate representation of African-Arnencans evaluated,as opposed to their representation in the population
1.6
1.4
1.2
wz
z <cip z os
0 a 0.6
0.4
0.2
0.09/89-6/93 9/93-6/91 9/91-6/93
TIME PERIOD
Finally, Figure 8 reveals that the proportion ofCaucasians referred and evaluated fell from asithstantial overrepresentation to a slightoverrepresentation at the present time.
Epee 6. Prupuitionate representation of Latinos/Hispanics evaluated,as opposed to their representation in the population
1.6
1.4
r2 1.0
z as0 if,
2"coa
0.6
c. cc
0.4
0.0
9/89-6/93 9/906/91 9/914/93
TBIE PERIOD
Inspection of Figure 7, which illustrates theproportion of African-American childrenreferred and evaluated for each of the threetime periods, shows that there was a steadyincrease in the proportionate representation ofAfrican-Americans.
Figure 8. Proportionate representation of Caucasians evaluated,as opposed to their represrntabon in the population
1.6
2.2ft
1 2
1.4
12
013
0.6
0.4
01 -
0.09/694/90 9/10-6/91 1/914/93
TIME PERIOD
7 .

8
Figure 9 provides a summary of the proportion of children nominated and evaluated for thegifted program for each of the three time periods through 6/93 for six ethnic backgrounds: Latino/Hispanic, African-American, White, Native American, Filipino, and Indochinese. As the figure shows,while there was never a perfect representation, it was possible to ameliorate all major inequities. Fromour data and experience, we draw the following concb..1sion: The attainment of equal representationin the proportion of children nominated and evaluated for giftedness across ethnic background is arealistic and readily attainable goal for any school district.
Figure 9.
Proportionate representation of those evaluated, as opposed to their representation in the clistict
1.6
LATINO/HISPANIC1.6r
1.4 7
1-2 1.2<i.
zr.,:) 11..24
z< IL01-
z<0E- 1.0
pZ 0.8 pZgldi 0.8
Ow 0.6c-g 0.6Oa. OA Ot. 04
cauC.c6
01
<1:Z<
p2
Rw
c-cc
0.00.0
9/894/90 9/90-6/91 9/91-6/93
1.6
1.4
12
1.0
0.8
0.6
DA
02
0.0
1.6
,Z 1.4P2 12z< IA
pz01-
Osct
0.6
Oa. 0.4ZDJc.a 0.2
0.0
9/99-6/93 9/906/91 9/91-6/93
AFRICAN-MERICAN
9/69-6/90 9/916/91 9/91-6/93
1.6- NATIVE AMERICAN
Z 1.4
12
1.o
Pz 0.8
41 0.6
0.4a.z 0.2
0.0
FILIPNO 1.6
Z 1 4
r. 1.2
<<
Pz OS
21-Eil 0.6
it, 0.4
" 020.0
91936193 9/906/91 9191-6/93
C. The Shift to the Raven Progressive Matrices Test
9/89-6/90 9/916/91 9/91-6/93
INDOCHINESE
91894/90 9/96191 9/91-6/9
As previously indicated, our monitoring of the selection process quickly revealed theinappropriateness of the Wechsler Intelligence Scale for Children-Revised (WISC-R) as the standardfor giftedness in the ethnically diverse San Diego City School District (see Figure 3). Using ongoingrecords as well as archival data from approximately 15,000 cases evaluated for giftedness between1985 and the present, we conducted a thorough analysis of the WISC-R. Detailed results of this analysis
appear in Volume 2. In brief, the results revealed that there was no model (e.g., weighted subtests, useof different subtests for different ethnic groups, etc.) of use of the WISC-R that produced equal access.When we provided this information to the GATE psychologists and administrator in early 1991, thedistrict modified its selection policy and added the Raven Progressive Matrices Test as one of thestandardized tests that could be used to certify a child as gifted. This modification represented
13

a change in the original design of our study, which had called for one full year of monitoring to establish
a baseline. Those who were in charge of the San Diego City Schools GATE program decided that since
we knew the procedures presently in progress were doomed to fail in terms of providing equal access,
there was a need for an instant policy change. From a scientific standpoint, a midyear shift in selectionprocedures might reduce the rigor of our ultimate findings. From a practical standpoint, however, it
made no sense to continue using biased procedures.
1. Characteristics of the Raven
The use of the Raven Progressive Matrices (RPM) test was indeed well founded. As Carpenter,Just, and Shell (1990) put it, the Raven provides a measure of "the ability to reason and solve problemsinvolving new information, without relying extensively on an explicit base of declarative knowledgederived from either schooling or previous experience" (p. 404). Theoretically, the Raven provides a
measure of "fluid intelligence", in contrast to "crystallized intelligence", which reflects previously
acquired skills (Cattell, 1963). Despite its relative independence of previous experience and its nonverbalformat, Raven test scores correlate highly with measures of intelleetual achievement (Court & Raven,1982), which suggests that the underlying processes are general rather than specific to this one test.
For years researchers in the United States had pointed to the RPM as among the most promising
of the nontraditional approaches for assessing giftedness in ethnically diverse groups. The RPM provides
a nonverbal measure ofintellectual functioning that minimizes the effects of language and culture (Baska,
1986; James, 1984; Powers & Barkan, 1986; Carpenter et al, 1990). Until recently, however, the RPM
could not be applied on a widescale basis due to the absence of adequate norms.
In 1986 the manual for the RPM was updateel, along with the publication of an impressive set of
norms that included smoothed norms for Americans, a variety of ethnic norms, and international norms
from major world cities (Raven and Colleagues, 1986, 1990). Moreover, as Baska (1986) has ncted, the
RPM not only has been shown to be effective in identifying gifted minority students, it has also correlated
well with success in the Chicago City School System. A variety of research studies have supported the
use of the RPM for children from culturally diverse backgrounds (Karnes, Lee, & May, 1982; Powers,
Barkan, & Jones, 1986; Sidles & MacAvoy, 1987).
There are several forms of the Raven, including a colored form for very young children, theStandard 60 item test, and the advanced test for the very highest levels of abilities in adolescents and
adults. All forms consist of the same type of problem, the incomplete matrix. The child is shown a
design with a distinct pattern that may be based on form, number, size, and a variety of other organizing
principles. A part of the pattern is omitted and the child must select from among six to eight alternatives,
and choose the one that accurately completes the pattern.
According to a detailed theoretical and empirical analysis by Carpenter et al (1990), the Raven
measures a basic ability underlying intelligence as follows: "to decompose problems into manageable
segments and iterate through them, the differential ability to manage the hierarchy of goals and subgoals
generated by this problem decomposition, and the differential ability to form higher level abstractions"
(p. 429).
An extensive body of research reported in the test manual reveals that the RPM is about as
reliable as the WISC-R. Validity studies have revealed that the RPM measuresgeneral intelligence, and
is perhaps the single best measure of Spearman's g factor (Marshalek, Lohman, & Snow, 1983; Snow,
Kyllonen, & Marshalek, 1984).
To digress for a moment, Spearman's g factor (Spearman, 1927) is one of the most robust findings
in the field of testing. Its existence is based on the well known phenomenon that all tests of intelligence
and scholastic aptitude are positively correlated, with a general range from about .60 to .90, and a mean
coefficient of about .75 (see Carr& 1992;Humphreys, 1992; Jensen, 1992). When thematrix of correlations
among diverse but correlated tests of intelligence and aptitude are subjected to a hierarchical factor
analysis, it is almost always found that at least half the variance can be accounted for by a common
factor, which Spearman (1927) called g and interpreted in terms of general mental energy.
149
10
Because the RPM measures g, it correlates with other measures of general intelligence including
language abilities and reading, even though the RPM itself contains no language or reading problems.
Moreover, because it does not involve reading, language, or other aspects of acquired, or crystallized
intelligence, the Raven is a far better measure of pure potential than tests such as the WISC-R, whose
scores depend heavily on acquired knowledge.
In Volume 2 we present a number of important findings pertaining to the Raven that furthersupport its validity. For now, just one example will be given. From our database we evaluated the
records of more than 2,000 children who had been given both a Raven and a WISC-R. Scores on the
Raven and WISC-R were then correlated with scores on the California Test of Basic Skills (Cli3S), a
Standardized Test of Achievement in Language, Reading, and Math. For both African-American and
White children, the Raven was a better predictor of language achievement than the WISC-R Verbal,
Performance, or Full Scale IQs. Such results are probably due to the Raven's ability to evaluate potential
independently of past learning.
2. Initial Shift to the Raven
By about March or April of 1991, the Raven was added to the evaluation tools for every GATE
psychologist. Initially, the psychologists took a cautious approach. They tended to use the Raven for
nominated nonwhite students only after the student failed to met the cut-off on the WISC-R.
Approximately 50% of the nonwhite children who had failed to qualify based on a WISC-R qualified
with the Raven.
3. The Adoption of the Raven as the Primary Certification Tool.
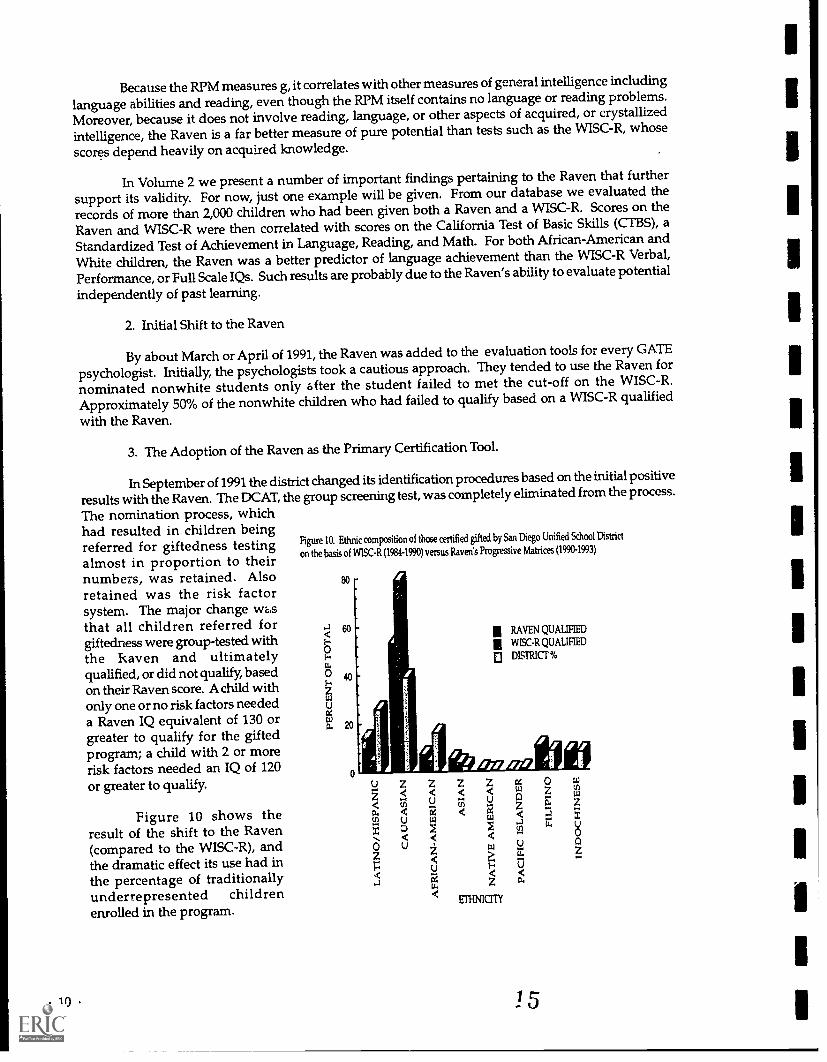
In September of 1991 the district changed its identification procedures based on the initial positive
results with the Raven. The DCAT, the group screening test, was completely eliminated from the process.
The nomination process, whichhad resulted in children beingreferred for giftedness testing Rpm 10. Ethnic composition of those certified gifted by San Diego Unified School District
almost in proportion to theirnumbers, was retained. Also 80
retained was the risk factorsystem. The major change wasthat all children referred for
<giftedness were group-tested with r.
0the Raven and ultimately 1-U,
qualified, or did not qualify, based 0 40
on their Raven score. A child with zonly one or no risk factors needed uaa Raven IQ equivalent of 130 or w
a. 20 1
greater to qualify for the giftedprogram; a child with 2 or more `z
irisk factors needed an IQ of 120
o
or greater to qualify. y Z Z z z c oaLa Er,
< t7; s. Z
Figure 10 shows the < '±'g) U ta
gj.3 U
result of the shift to the Raven X 4(compared to the WISC-R), and 6 u
< 1 <u
00
z z la zu uthe dramatic effect its use had in P<
the percentage of traditionally ti.
underrepresented children <
enrolled in the program.EfINCITY
on the basis of W1SC-R (1984-1990) versus Raven's Progressive Matrices (1990-1993)
III RAVEN QUALTIED
WISC-R QUALIFIED
fl DISTRICT %
OaL
15
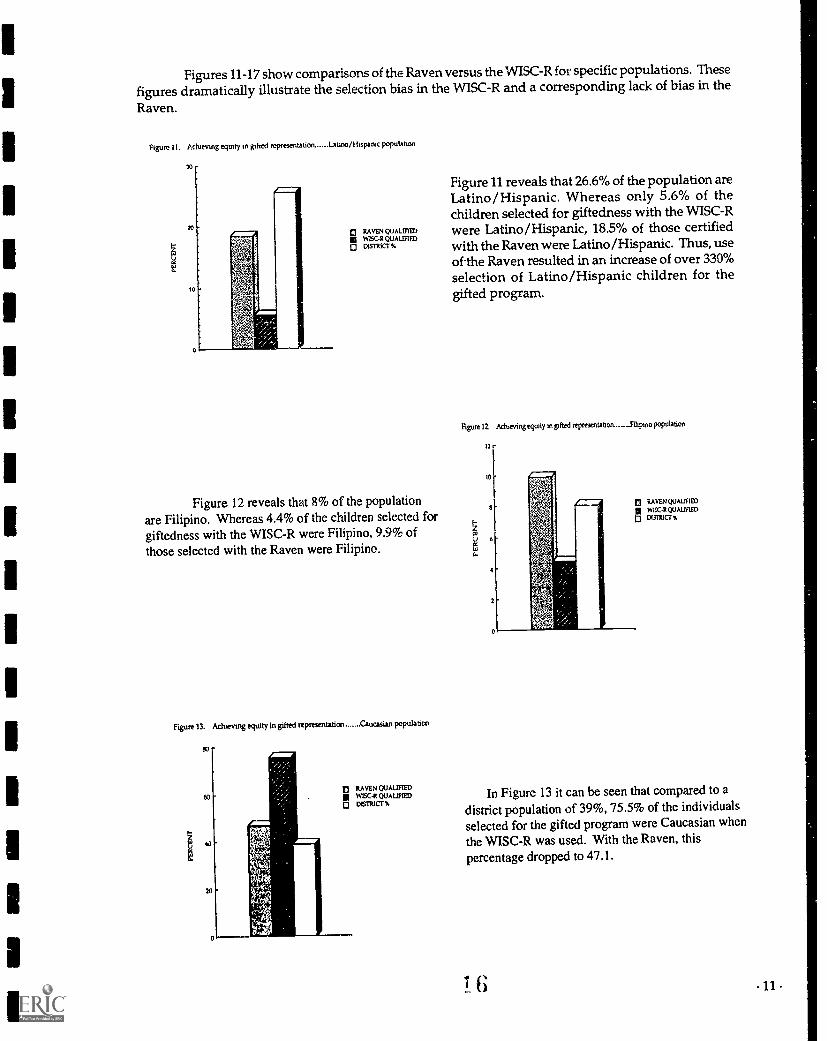
Figures 11-17 show comparisons of the Raven versus the WISC-Rfor specific populations. Thesefigures dramatically illustrate the selection bias in the WISC-R and a corresponding lack of bias in the
Raven.
Figure 11. Achieving equity in gifted representation. Latino/Hispanic population
fl RAVEN QUALIFIED8 WSCR QUAUFIRD0 DISTRia %
Figure 12 reveals that g% of the populationare Filipino. Whereas 4.4% of the children selected forgiftedness with the WISC-R were Filipino, 9.9% ofthose selected with the Raven were Filipino.
Figure 13. Adueving equity In gifted representatico Caucasian population
Figure 11 reveals that 26.6% of the population areLatino/Hispanic. Whereas only 5.6% of thechildren selected for giftedness with the WISC-Rwere Latino/Hispanic, 18.5% of those certifiedwith the Raven were Latino/Hispanic. Thus, useof-the Raven resulted in an increase of over 330%selection of Latino/Hispanic children for thegifted program.
Figure 12. Achieving equity tn gifted represeitation.-......Fdipino population
lie
10
6
fl RAVEN QUALIFIED
WlX-R QUALIFIEDDISTRICI%
In Figure 13 it can be seen that compared to adistrict population of 39%, 75.5% of the individuals
selected for the gifted program were Caucasian when
the WISC-R was used. With the Raven, this
percentage dropped to 47.1.
G

Figure 14 is quite dramatic. AlthoughIndochinese represented 7.7% of the total population,only 1.5% of those selected with the WISC-R wereIndochinese. With the Raven, there was more than a500% increase and these children were selectedapproximately in proportion to their numbers in thedistrict as a whole.
figure 15. Achienrg equity In gifted representaucei---.Afncan-Arninan populetion
RAVEN QUAUNEDWISCR QUALIFIED
o DISTRICT %
Figure 16 shows the familiar pattern ofmarked changes toward increased equity with theRaven. Comprising .7% of the district, PacificIslanders represented only .2% of the giftedpopulation selected with the WISC-R -- anunderselection of 350%. With the Raven, thesechildren were selected at slightly above theirproportion in the district.
12
Figure 11. Aclueving equity in gifted repretentation--Indochinese population
13 RAVEN QUALIFIEDWt5C-P.QUALIFIED
o D6TRKT %
Figure 15 reveals that compared to a percentageof 16.2 in the district, only 6.2% of the childrenselected for the gifted program were African-American when the WISC-R was used. This figurejumped to 10.4% with the Raven -- a 168% increasefor these traditionally underrepresented children.
Figure 16. Achieving equity in gifted representation........Pad& Islander populatica
7
a RAVEN QUAUF1EDQUAUFIED
o DISDUCT
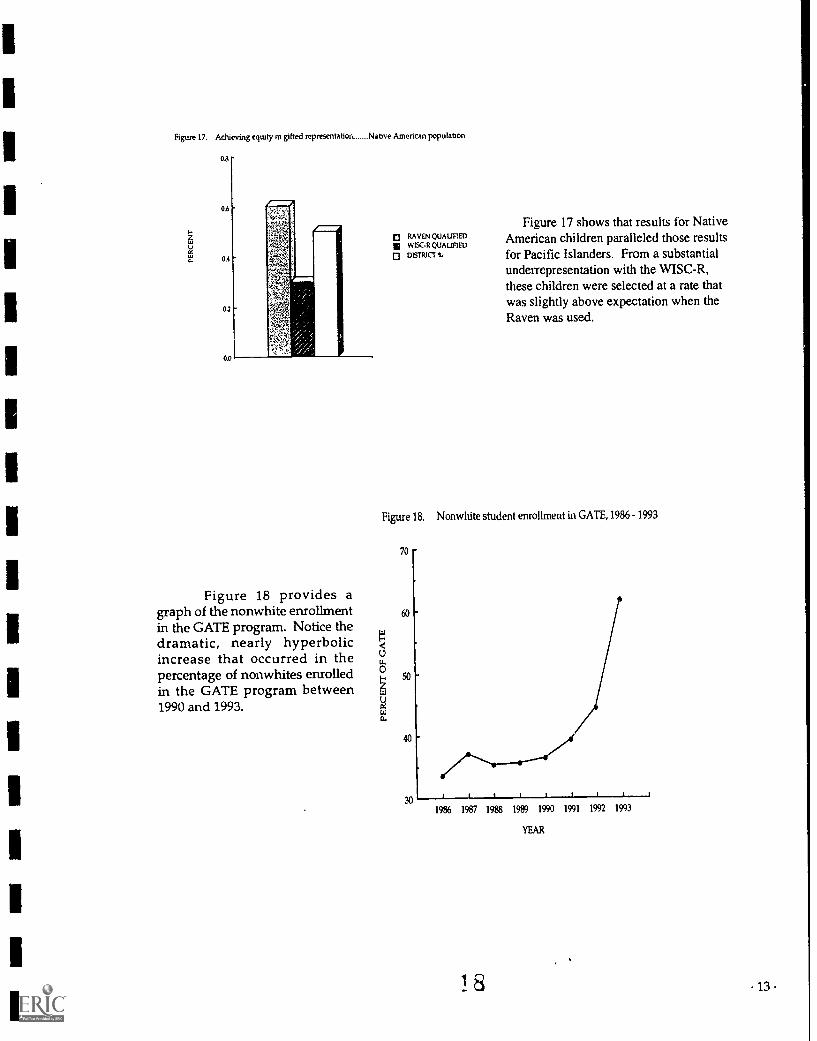
Figure 17. Achieving equity in gifted representatiort Natave American population
OS
0.6
0.4
0.2
OD
Figure 18 provides agraph of the nonwhite enrollmentin the GATE program. Notice thedramatic, nearly hyperbolicincrease that occurred in thepercentage of nonwhites enrolledin the GATE program between1990 and 1993.
RAVEN QUALIFIED
WISC.R QUALIFIED
DISTRICM
Figure 17 shows that results for NativeAmerican children paralleled those resultsfor Pacific Islanders. From a substantialunderrepresentation with the WISC-R,these children were selected at a rate thatwas slightly above expectation when theRaven was used.
Figure 18. Nonwhite student enrollment in GATE, 1986 - 1993
1986 1987 1988 1989 1990 1991 1992 1993
18
YEAR
13

14
Figure 19 shows the growth in numbers of Latino/Hispanic and African-American childrencertified as gifted for each year between 1989 and 1992. Notice that the growth in Latino/Hispanicchildren enrolled in the GATE program multiplied almost 70-fold from 1989 to 1992. The African-Americans, likewise, saw their rate of growth increase dramatically, with approximately an 8-fold increasebetween 1989 and 1992. In 1989 40 African-Americans were added to the GATE program. By 1992 thatnumber had grown to 350, while the proportion of African-Americans in the district remained steady.For Latino/Hispanic children, almost 700 were added to the GATE program, compared to less than 10
for 1989.
Figure 19. Growth in numbers of traditionally underrepresented children certified for GATE
1992
1991
1990
1989
1988
1987
0 200 400 600
1992
1991
1990
1989
1988
1987
0
AFRICAN-AMER1CAN
D. Emergent Problems
100 200 300 400
800
The dramatic increases in the number and proportionof Latino/Hispanic and African-American
children was not uniformly well-received. In fact, there was a political upheaval among some of the
more affluent white parents. Recall that many white parents viewed the gifted program as a superior
educational system for their children. Even thoughCaucasian children continued to be evaluated and
certified at least in proportion to their numbers, many white parents, including some whose own child
failed to be certified for the GATE program, complained forcefully.
Some parents wrote to the school board, while others called for the termination of the GATE
administrator and the present research program. Some parents recruited psychologists and statisticians
from the community to critique and refute the Raven. The Los Angeles Times did an investigation and
wrote an article. In the end, there was a move to combine the GATE program with the special
, 9
education program, presumably so that there could be a return to the old order. The move to combinethe two programs was successful, and the GATE program joined special education in an ExceptionalPrograms Department. However, there have been no changes to date in the methods of identification
outlined herein.
A second problem that emerged was tha t teachers of GATE children were not prepared to deal
with the large influx of high potential African-American and Latino/Hispanic children who, whilegifted, did not fit the mold of the more affluent children who had previously been certified as giftedwith the WISC-R. Prior selection procedures, in using tests such as the WISC-R and other verballyweighted standardized tests of crystallized ability, tended to identify a relatively homogeneous population
of high achieving, well-motivated, verbally mature children. While many of these children are indeed
of high potential, a significant proportion are simply verbally advanced due to the enriched experiencesavailable to affluent children. In contrast to these verbally mature children, there exists a significantnumber of disadvantaged children with extremelyhigh potential, but limited achievement.
In switching to the Raven Progressive Matrices Test, we began to identify children with highpotential, but not necessarily high achievement. The result was greater diversity in the classroom, but
new problems for teachers. Tohelp teachers deal with this new diversity, we held seminarsfor teachers.
However, much more effort will be needed if these more ailturally diverse children are to be successfully
integrated into the gifted program.
In Volume 2, we present the initial drafts of research manuscripts that have resulted from this
project. While it is our intent to publish each of these manuscripts in professional journals, we presentthem in Volume 2 in order to provide rapid dissemination of our findings to interested readers. InChapter 1 of Volume 2, we present our major findings pertaining to the Raven. Chapter 2 represents adoctoral dissertation pertaining to the WISC-R written by Nancy E. Johnson in partial fulfillment of the
.requirements of the Doctor of Philosophy degree.
Chapter 3 provides an overview of data relevant to risk factors. In Chapter 4 we present our
major findings pertaining to information-processing. Chapter 5 discusses our results relevant to locusof control. Finally, Chapter 6 provides a discussion of the characterisucs of gifted underachievers.
Our primary limiting factor is that funding for this grant ended on 12/31 /93. Given theconsiderable amount of data that we have accumulated, we will continue to analyze and disseminate
our findings during the next few years.
2 015

APPENDIX I
San Diego City SchoolsEducational Services DivisionGifted and Talented Education
TEACHER NOMINATION FORM
Date
Name Birth Date Sex Ethnic Code
School Grade Track Room Number
acDciALLEkagEmmENTALLAT Eizoixa
Please check all items that apply:
ELTLIBQNMENTAL
Lacks preschool/kindergarten experience
Irregular attendance
Transiency (3 or more school moves)
Limited home enrichment opportunities (availability of books, periodicals,
family interaction, family outings)
Home conflicts:Responsibilities and study timeExcessive child care responsibilityWorking to help support familyOvercrowding no study areaInconsistencies in the home
2. ECONOMIC
Economic hardship
Single parent head of household
Unemployment
3. LANGUAGE
Primary language of parent and/or student is ether than English
Not proficient/fluent in English
Uses non-standard English
Student enrolled in Second Language Immersion Magnet (SLIM)
4. CULTURAL
Limited home/school communication
Experience in dominant culture is limited
Cultural values and beliefs differ from dominant culture
1621

SOCIAL/ENVIRONMENTAL VARIABLES
Page 2
5. EQCIAL/ EMOTIONAL
Child abuse: physical
6. HEALTH
mental neglect
Emotional/adjustment problemsWorking with district counselorWorking with social workerUtilizing psychological servicesOther:
Significant home factorsSeparationDivorceDeath
Extended absence of parentMilitaryEmploymentOther:
FamilySingle parentRemarriage/step-parent
Designated instructional servicesPHDISSpeech and languageVisionHearingAdaptive RE.
Severe allergies
Asthma
Frequent medical/health referral
Regularly prescribed medication
Other:
Prepared by Recommended? Yes No
(Teacher)
Reviewed by Recommended? Yes No
0 0,17

18
APPENDIX II
San Diego City SchoolsSchool Services Division
Gifted and Talented Education
ED-DENT/PARENT INFORMAMMEQEM
Student Name: Date
Birth Date Sex School
(Last) (First) (mi)
Address Mother 's name Occupation
(Street) Work PhoneFather's name Occupation
(City) (State) (Zip) Work Phone
Grade Room Number Track Home Phone
Schools Attend& Grade Dates Attended
1. Names and ages of brothers and sisters:
2. Describe your child's attitude toward school:
3. List any special interests, talents, and skills your child may have:
4. What special lessons, training or learning opportunities has your child had outside of school?
5. To help us know more about your child, please check any of the following that apply:
O allergies
O asthma
O frequent absences
O prescribed medications
parent in military
O frequent parent absence
parents separated
O single parent
remarriage/step-parent
O recent death/significantillness in family
O 3 or more schools attended
O no kindergarten or pre-
school experience
additional language(s)
spoken in homeList-
6. Has your child been previously assessed? 0 yes 0 no If yes, when?
7. What other things would you like us to know that would assist us in assessing your child?
Name of person Relationship
completing this form to student
9
APPENDIX III
In Search of An Equal Access Model:Review of Saccuzzo's "Identifying Underrepresented
Disadvantaged GATE Children"
Margie K. KitanoSan Diego State University
Invited article submitted to Gifted Child Ouarterly
19

20
Abstract
"Identifying Underrepresented Disadvantaged Gifted and Talented Children:A Multifaceted Approach" is a collaborative research and development projectthat examined alternative procedures in search of an equal access model foridentifying underrepresented gifted students. A review of the project wasconducted using interviews with key participants and project-generatedmanuscripts and publications. The project analyzed archival and current data
on some 35,000 students to evaluate a large, urban school district's selectionprocess from referral to certification as gifted. Based on the findings, a newmodel designed to increase the proportion of ethnically and economically diversestudents referred for assessment and identified as gifted was implemented andevaluated. The new model incorporates the Raven Progressive Matrices as the
criterion measure of intellectual ability. Project data demonstrate that the newmodel has increased the number and proportion of underrepresented studentsreferred and selected for gifted programs but has not met the criterion forproviding equal access. Use of the Raven has led to certification of studentswith high cognitive ability, although not necessarily commensurate academicachievement, and to a decrease in the proportion of mainstream students certifiedag gifted. The review found diverse perspectives on the interpretation of theseoutcomes. It is clear that the project has had major impact on district practicesand has increased access for gifted students from ethnically, linguistically, and
economically diverse backgrounds.
In Search of An Equal Access Model:Review of Saccuzzo's "Identifying Underrepresented
Disadvantaged GATE Children"
In 1982, what is now the eighth largest school district in the nation observed a significant racial
imbalance in its gifted and talented education (GATE) program and set a course for change. Thedistrict had an early awareness o f the growing ethnic and linguistic diversity of its population and theunderrepresentation of nonmainstream students receiving services for the gifted. To find more equitableidentification and selection procedures, the GATE leadership conducted a comprehensive search of
extant literature and consulted other large urban districts, state and federal departments of education,and national leaders in the field. Concurrently, the GATE program instituted a central nominating
process and inservice opportunities ior teachers and administrators, requested that a team of school
psychologists be assigned to the GATE program, and sought to diversify its staff. Risk faaors (e.g.,environmental disadvantage) that impact test taking performance were added to standardized testcriteria for certification as gifted.
These changes significantly increased the numbers ofdiverse students served in programs for
the gifted. However, they continued to be underrepresented relative to their proportions in the district.
Meanwhile, the state's recession-related financial crisis combined with competing concerns voiced by
unions, community advisory groups, parents, and educators seriously threatened to dismantle the
GATE program. Within this context, the Javits-funded project titled "Identifying UnderrepresentedDisadvantaged Gifted and Talented Children: A Multifaceted Approach" began in the fall of 1990 to
establish an equitable identification procedure with strong empirical documentation. According to thesenior GATE administrator, had it not been for the timely implementation of the Javits project, "there
would be no gifted program in this school district" today.
This article provides a review of the project based on twomajor sources of information. First,manuscripts, publications, and documents from conference presentations given by project and school
district staff were examined (Saccuzzo, 1993; Saccuzzo & Johnson, 1992, undated; Saccuzzo, Johnson,
& Guertin, 1993; Saccuzzo, Johnson, & Russell, 1992). Second, the reviewer conducted face-to-face ortelephone interviews with the three key project staff members and with school district personnelincluding the senior GATE administrator, three GATE school psychologists and counselors, and fourelementary and secondary school principals. The interview findings suggest that project activities and
findings can be objectively described. Further, mostinformants agree that the project has dramatically
impacted school district policies and procedureswith regard to increased enrollment of students from
ethnically diverse backgrounds in programs for the gifted. At the same time, these changes havegenerated healthy debate regarding what constitutes an equitable identification process as well as
what constitutes gifted potential. This review begins with a description of the project and its findings
and then examines multiple perspectives regarding project outcomes and future challenges.
Project Description
"Identifying Underrepresented Disadvantaged Gifted and Talented Children: A Multifaceted
Approach" represents a 3-year cooperative research and development effort between a large urban
school district and a comprehensive state university. Dennis P. Saccuzzo, professor of psychology at
San Diego State University serves as prinicipal investigator and director. The San Diego Unified School
District's Gifted and Talented Education program, under the leadership of David P. Hermanson,
functions as the collaborating partner. The project focuses on evaluating strategies for identifying for
gifted programs students traditionally underrepresented in such programs; collaterally, it considers
the realistic needs of a highly diverse school district in a state undergoing severe economic stress. The
district serves over 123,000 students, of whom approximately 29 percent are Latino, 38 percent white
non-Hispanic, and 18 percent African-American. The remaining 15 percent are of otherbackgrounds,
primarily Filipino, Indochinese, Asian, Pacific Islander, and American Indian. This review was
conducted in the latter half of the project's third and final year.
21

Purposes
The project has as its primary purpose to determine whether an objective, reliable selectionmodel can be developed that will provide equal access togifted programs for children of all ethnic andeconomic backgrounds. Equal access is defined as selection of students in each ethnic or cultural group
in proportion to their numbers in the school district as a whole. The project also sought to enable the
school district to identify and select for gifted programs greater numbers and proportions of
underrepresented and disadvantaged students as defined by Javits legislation.
Three additional goals focus on exploring characteristics of underrepresented students on various
assessment devices and evaluating the potential of nontraditional measures for identifying students as
gifted. Specifically, project staff have analyzed archival data on 20,000 children referred for gifted
assessment since 1984 to test hypotheses about ethnic differences in patterns of intellectual strengths on
the WISC-R. The data bank now includes information on some 35,000 elementary to school-age
students. Additionally, they sought to test the efficacy of a battery of nontraditional micro-computerizedinformation-processing tasks and determine the information-processing characteristics of ethnically
diverse students. Finally, they investigated the potential of a locus of control measure for identifying
giftedness in target students.
Procedures and Findings
The purposes and goals are being implemented by the project's director, post-doctoral fellow,and coordinator with the assistance of thirty-four university students who have served as research
assistants. Three types of data were analyzed: standardized test data on students referred since 1984 aspotentially gifted; numbers of students from various ethnic groups referred, nominated, and certified
over the project's duration as gifted; and performance scores on a battery of nontraditional assessmentdevices. Findings related to each of the five project purposes are described in the following sections.
Evaluating the efficacy of pre-project identification measures: the WISC-R. Prior to the project'simplementation, students were nominated for evaluation by teachers, principals, parents, or self orthrough performance on the California Test of Basic Skills. Nominated students received groupadministration of the Developing Cognitive Abilities Test (DCAT). School psychologists administered
an individual intelligence test, most frequently the WISC-R, to those students who scored at the 90th
percentile or above on the DCAT. Because the WISC-R surfaced as the predominantly used criterionmeasure for certification as gifted in the district, the project examined the potential of the instrument for
unbiased selection. Archival WISC-R data were analyzed for a subset of elementary students referred as
potentially gifted from African-American, Asian-American, Caucasian, Filipino, and Hispanicbackgrounds. The project found no single model or combination of individual models using WISC-R
subtest scores that could select equally from each of the five groups. The researchers concluded that no
single model (i.e., not using ethnic norms) of WISC-R scores will result in an equal access program. The
data suggest that the WISC-R overselects Causcasian and underselects African-American and Latino
students for gifted programs (Saccuzzo & Johnson, 1992, Presentation #4).
Finding an equal access model and increasing the numbers and proportions of diverse students identified
as gifted. During the first implementation year, the project found that one barrier to equal access occurred
during the referral and nomination stages. Specifically. school personnel and parents were notnominating
African-American and Latino students in proportion to their numbers in the district as a whole. Project
staff systematically gathered, analyzed, charted, and disseminated to district personnel data on the
proportion of students tested by ethnic group. In collaboration with GATE personnel, a program was
implemented to monitor and share nomination data, provide teacher inservice, and actively engage
GATE psychologists in soliciting proportionate nominations. The program led to a steady increase in
the proportions of African-American and Latino students tested for GATE programs and a decrease in
the overrepresentation of Caucasian students.
In addition, given the project's findings on the WISC-R, the district added the Raven Progressive
Matrices (RPM), 1986 American norms, as one of the standardized tests that could be used to certify a
student as gifted. The RPM (Raven & Summers, et al., 1986) is an untimed, 60-item non-reading test of
. 22 . 9 7

general mental ability. Each item presents a design with a part missing and several choices from whichthe missing piece can be selected. The RPM can be administered in a group or individual setting. Asthe project progressed, the DCAT was eliminated as a screening measure and a psychologist-administered RPM adopted as the prescribed certifying tool. A score of 98 percentile, or90 percentilewith two or more risk factors, was retained as the criterion for documenting intellectual ability (see SanDiego City Schools, 1992 for additional information). Project data demonstrate that, combined withincreased ethnic nominations, the shift to the RPM dramatically raised the number of diverse studentsenrolled in GATE programs. For example, the number of Latino students enrolled increased 70-foldfrom 1989 to 1992 and the number of African-American students 8-fold over the same period (Saccuzzo,1993). Using the RPM, the project identified for gifted programs over one thousand African-Americanand Latino students who would not have been selected through WISC-R performance.
Proportional representation in enrollment in programs for the gifted also improved.Proportional representation is calculated by dividing the proportion of students enrolled from a givengroup by their proportion in the district as a whole, such that 1.0 represents the standard criterion.Prior to the project's implementation, the representation of white students was 1.5 (i.e., they wereoverselected for gifted programs by .5 relative to their proportion in the district as a whole). Therepresentation of Latino students was 0.5 (underselection by .5), and ofAfrican-American students0.33 (underselection by .67). At the time of this review, project data show the proportion of whitestudents enrolled in gifted programs as 1.2, Latinos as 0.8, and African-American students as 0.7.Additionally, implementation of the project model has increased the proportionate representation ofFilipino, Indochinese, Pacific Islander, and American Indian students selected for gifted programs andhas produced a slight overrepresentation of Filipino and Asian-American students.
The project staff also evaluated records of over 20,000 second- through sixth-grade students inthe data base who had been administered either the RPM or WISC-R or both. These data were correlatedwith language, reading, and math scores for the same students on the California Test of Basic Skills,DCAT, and Abbreviated Stanford Test of Achievement. Results suggest that theRPM provides a betterpredictor of academic achievement, including language achievement, than the WISC-R verbal,performance, or full scale IQ scores for African-American and Latino students (Saccuzzo & Johnson,
1992, Presentation #5).
Assessing the potential of nontraditional instruments for identifying gifted students. The project alsoevaluated the efficacy of the Nowicki-Strickland locus of control measure (Saccuzzo & Johnson, 1992,
Presentation #1) and a battery of micro-computerized information processing tasks for use in selectingdiverse students as gifted (Saccuzzo & Johnson, 1992, Presentations #2,3; Saccuzzo, Johnson, & Guertin,
1993). Included in the latter were information processing tasks that measured speed of processing aswell as tasks not dependent upon speed. In general, these studies produced information aboutdifferences and similarities by ethnic and by ability (gifted/nongifted) group. The project teamconcluded that, while some of these measures have potential, more work needs to be done in this area.
Project Outcomes: Multiple Perspectives
This section examines informants' various interpretations of the project's findings and impact.Diverse perspectives were found on two major issues: (a) whether the project successfully identifiedan equal access identification model using a single standardized measure and criterion across ethnic
groups; and (b) whether the students identified through the model are "gifted."
Does Proportionate Nomination and the RPM Produce Equal Access?
The project's major purpose was to determine whether a selection model could be developedthat would provide equal access to gifted programs for students of all ethnic and economic backgrounds.When asked whether the Raven Progressive Matrices provided an equal access selection model, ProjectDirector Dennis Saccuzzo responded "No, if the RPM is used in a standardized format with an ethnicallyand economically diverse population. Use of the RPM improves access, but does not produce equalaccess." Project staff have concluded from their data that attainment of proportionate representation
23

24
across ethnic and economic groups through monitoring and inservice for nomination to gifted programs
constitutes a realistic, attainable goal. Moreover, proportionate nomination in conjunction with selection
through use of the RPM significantly increased the numbers and proportion of ethnically and
economically diverse students enrolled in programs for the gifted, thus meeting the second primary
purpose of the project. However, they evaluate the model implemented in the district through the
project as not meeting the objective of producing equal access to gifted programs, since there continues
to be significant underrepresentation (by .3) of African-American students relative to their proportions
in the district as a whole. According to the research team, blanket use of the RPM or any other
standardized psychometric test will not produce equal access. They hypothesize that use of the RPM in
combination with dynamic assessment (Feuerstein, 1979) may lead to an equal access model.
GATE personnel, under pressure from the district and community to increase the number and
proportion of ethnically diverse students in gifted programs, offer a different perspective on project
outcomes. When asked if the goals have been met, the senior school psychologist replied, "Yes; very
nicely, especially if you consider the entire process from nomination to certification. I was skeptical in
the beginning but have been thoroughly won over by the results. All of us feel comfortable going out
anywhere and defending the practice."
Both project and GATE personnel report that some members of the community have been
vocally critical of project outcomes. For example, despite the continuing overrepresentation of white,
nonHispanic students selected for gifted programs, the proportion of white students nominated and
identified has declined with the implementationof the new model. For this reason, some parents argue
that the RPM is biased against mainstream students. One principal noted that parents whose children
qualify r a the WISC-R but fail to qualify on the RPM (and therefore for the GATE program) question
the mo .tel's validity.
Project and GATE personnel also report that members of the African-American community
have objected to the model because standardized tests traditionally have been used to discriminate
against their children and because the RPM has not eliminated bias in selection. On the other hand, the
dramatic increase in number and proportion of African-American and Latino students identified through
the project has produced many positive comments. The principal of a school with high enrollments of
Latino students (88%) and studen6 whose first language is not English (50%) reported a substantial
rise in the number of students from these groups served by GATE and "no complaints from parents."
The principal of a school whose students are 39 percent African-American and 29 percent Latino described
the RPM as an "excellent instrument" compared to the Wechsler and Binet and offered that "parents
have been extremely pleased and positive."
Does the Model Identify Gifted Students?
Informants agree that the combmation of increased nomination and use of the RPM as the
criterion measure has raised the numbers and proportions of traditionallyunderrepresented students
in the GATE program. Opinions differ regarding the nature of students identified as gifted by the
Ravens as opposed to the Wechsler. The question has arisen because some of the students certified by
the Ravens display achievement characteristics different from those certified by language-based tests.
Specifically, the earlier nomination practices and use of verbally weighted tests, such as the WISC-R,
tended to identify high achieving, academically motivated students. Implementing the new model
using the RPM leads to identification of students with high cognitive potential but not necessarily high
academic achievement.
The academic, cultural, and economic diversity exhibited by students selected through the
project's model has presented new challenges to GATE teachers. The principal of one ethnically diverse
school reported that the teachersconsider the Ravens "a step backward" because so many of the students
lack competitive academic skills and are "not ready for GATE materials and curriculum." This informant
suggested that "a battery may be more appropriate. I'm not sure if we are truly identifying disadvantaged
students. The RPM may be identifying students whose homes have providedexperience with puzzles.
. it identifies more boys than girls, perhaps because it measures spatial ability"
The principal of a school with high African-American and L,atino enrollments found the GATEteachers "extremely positive" about the changes. Nevertheless, one teacher at this school experiencedextreme distress from working with "too many who didn't belong." The principal of the school withpredominantly Latino enrollment "had no questions from teachers."
Interestingly, these principals reported different uses of the RPM. For example, the first principalquoted above has the RPM administered to all second- and fifth-grade students. In other schools, theRPM is administered only to those students nominated by school personnel and parents. The principalof a school with high enrollments of Latino and Indochinese students reported difficulty in assessingchanges resulting from use of the RPM since identification of gifted students at this school "continuesto rely on several versus one measure."
Based on the testing literature, project staff evaluate the RPM as a "far better measure of purepotential than tests such as the WISC-R, whose scores depend heavily onacquired knowledge" (Saccuzzo,1993, p. 14). GATE staff suggest that "Teachers need to understand that they're getting excellent thinkers
versus achievers."
Triumphs and Remaining Challenges
Triumphs
Despite the diversity of perspectives, this project clearly has had striking impact on studentsfrom groups traditionally underrepresented in programs for the gifted. Most significantly, the projectresulted in immediate implementation of a new model for nomination and certification that in turnproduced significant increases in the numbers and proportions of diverse students referred and enrolledin gifted programs. The project has produced additional data on nontraditional measures that mayhold promise for identification of giftedness across ethnic groups.
Interviews provided insights regarding benefits not predicted bythe proposal. As stated in theintroduction, the senior GATE administrator attributes the retention of the district's GATE program tothe project's development of a model that substantially increased access and provided strong theoreticaland empirical justification. While not as dramatic, other benefits accrued that promise long-rangeimpact. For example, project staff indicated that over thirty university students received direct experiencein research related to improving the identification of gifted students from diverse ethnic and economicbackgrounds. The project led to several graduate theses and dissertations that may stimulate furtheresearch in this area. The project has amassed a data base that includes more African-American, Latino,
and Indochinese students than included in the standardization sample of the WISC-R. A principalreported that compared to the Wechsler, after which students "felt frustrated," taking the Raven "boostedstudents' self-esteem" irrespective of their performance on the measure. Project staff observed that,after nontraditional students are certified as gifted by the Raven, teachers often begin noticing thesestudents' positive behaviors. The project is both "chipping away" at stereotypes regarding ethnicityand intelligence and giving access to bright students who otherwise would remain undiscovered and
lost in the system.
Challenges
As with any worthy but time-limited enterprise, the project has produced challenges forresearchers and practioners alike. Project staff point to a need to continue the search for a selectionmodel that provides equal access to gifted programs forstudents from all ethnic, linguistic, and economic
groups. They suggest that dynamic assessment ultimately may provide one alternative. Additionally,
it would be interesting to follow the progress of nontraditional students identified for gifted programs
to investigate long-term impact on these students. GATE staff perceive teacher and administratorinservice as a critical need to promote (a) understanding of the many manifestations of gifted potentialand (b) strategies for accommodating gifted students who initially display heterogeneous achievement
3 () 25
levels. As one principal commented, "We need to change attitudes as the population demographics
have changed; teachers' styles of teaching need to change. In addition, community and parent awareness
programs will support broader understanding of assessment issues and student needs.
Conclusion
In less than three years, the project "Identifying Underrepresented Disadvantaged Gifted and
Talented Children: A Multifaceted Approach" has directly affected the lives of over one thousand newly
identified ethnically and linguistically diverse gifted students who otherwise would not have received
special services. Moreover, the project's contribution to the institutionalization of a more equitable
selection model in the nation's eighth largest school district will continue to impact subsequent cohorts
of traditionally underrepresented gifted students as they enter the system. The results demonstrate the
critical role played by federal funding of discretionary projects.
The project's sto,cs-ess also attests to the importance of school-university collaboration in the
generation and implementation of new knowledge. Rapid change occurred through the interaction of
highly competent researchers and far-sighted GATE leaders who recognized the need for research-based
practice and were willing to take risks to improve access. Both project and GATE staff predict that the
results are generalizable to other large districtsserving similarly div.zse populations. In light of literature
on multiple intelligences (e.g., Gardener, 1983) and the need to use multiple measures and avoid cutoff
scores (e.g., Richert, 1991) especially when assessing diverse students, writers in the field will question
the use of a single, standardized instrument for identification. Yet as the GATE administator suggested,
"We welcome every urban school district to visit and review our program and would welcome an open
debate of procedums used."
26

1
1
1
IDENTIFYING UNDERREPRESENTED DISADVANTAGED GI1- !ED AND TALENTED
CHILDREN: A MULTIFACETED APPROACH
(Volume 2)
Dennis P. Saccuzzo, Nancy E. Johnson, & Tracey L. Guertin
San Diego State University
This research was funded by Grant R206A00569, U.S. Department ofEducation, Jacob Javits Gifted and Talented Discretionary Grant Program.
The authors express their appreciation to the San Diego Unified CitySchools, to Gifted and Talented Education (GATE) Administrator David P.Hermanson, and to the following school psychologists: Will Boggess, MarciaDijiosia, Eva Jarosz, Dimaris Michalek, Lorraine Rouse, Ben Sy, and Daniel
Williams.Correspondence should be addressed to Dennis P. Saccuzzo, Joint San
Diego State/University of California, San Diego Doctoral Training Program, 6363Alvarado Court, Suite 103, San Diego, California 92120-4913 (Telephone: 619-
594-2844 / FAX: 619-594-6780 / e-mail: [email protected]).
© 1994Do not reproduce in any form without express written permission from the
authors.
3227
CHAPTER 1
Use of the Raven Progressive Matrices Test in an
Ethnically Diverse Gifted Population
Dennis P. Saccuzzo*
Nancy E. Johnson
Tracey L. Guertin
San Diego State University
This research was funded by Grant R206A00569, U.S. Department ofEducation, Jacob Javits Gifted and Talented Discretionary Grant Program.
The authors express their appreciation to the San Diego Unified CitySchools, to Gifted and Talented Education (GATE) Administrator David P.Hermanson, and to the following school psychologists: Will Boggess, MarciaDijiosia, Eva Jarosz, Dimaris Michalek, Lorraine Rouse, Ben Sy, and Daniel
Williams.Correspondence should be addressed to Dennis P. Saccuzzo, joint
San Diego State/University of California, San Diego Doctoral TrainingProgram, 6363 Alvarado Court, Suite 103, San Diego, California 92120-4913(Telephone: 619-594-2844 / FAX: 619-594-6780 / e-mail:
C) Copyright 1994.Do not reproduce in any form without express written permission from the
authors.
33 29
30
Abstract
The efficacy of use of the Standard Raven Progressive MatricesTest (RPM) in the selection of gifted children from traditionallyunderrepresented groups was investigated in a large-scale study with adiverse population. A total of 16,985 Raven subjects included 22.7% Latinos,
37% Whites, 14% African-American, 2.8%Asian, 8.4% Filipinos, and 5.6%Indochinese, each of whom had been identified potentially gifted based on
a case study analysis by a school psychologist. The resultant sample of
children certified gifted based on Raven performance was compared with
a group certified gifted based on individual administrations of theWechsler
Intelligence Scale for Children - Revised (WISC-R). The Raven gifted sample
was also compared to actual enrollment ratios for the school district to
ascertain if equity in representation couldbe achieved for gifted programsusing the Raven. Although chi square results indicated that use of the RPM
as opposed to the WISC-R led to increased equity for all groups, full equity
was not achieved. When compared to the district population, the Raven-selected group showed underrepresentation for Latinos and African-Americans and overselection for Whites, Asians, and Filipinos. Chi squarecomparisons based on the expectation of equal gender representationrevealed that the WISC-R disproportionately overselected boys, while the
RPM showed no gender differences. The findings support the positionthat the RPM is a more equitable test than the WISC-R for ethnically diversegifted populations and for girls.
3 4

Use of the Raven Progressive Matrices Test in an Ethnically Diverse Gifted Population
Professionals in the field of Gifted Education continue to express considerable interest indeveloping alternatives to traditionally used standardized tests in identifying gifted students. Suchalternatives are particularly needed for students from traditionally underrepresented groups such asAfrican-Americans and Latino/Hispanics. One such alternative, repeatedly mentioned in the literature,
is the Raven Progressive Matrices (RPM) Test (Raven, 1958, 1960; Raven et al., 1986). A number ofinvestigators have pointed to the RPM as a culturally reduced measure of cognitive ability withconsiderable promise as a measure of giftedness in traditionally underrepresented and culturally diverse
students (Baska, 1986; James, 1984; Powers & Barkan, 1986; Powers, Barkan, & Jones, 1986).
The standard form of the RPM consists of 60 matrix problems, which are separated into five
sets of 12 designs each. Within each set of 12, the problems become increasingly difficult, and each of
the five sets is progressively more difficult. Each individual design has a missing piece. The student's
task is to select the correct piece to complete the design from among six to eight alternatives. Correct
responses are based on various organizing principles such as increasing size, reduced or increased
complexity, and number of elements.
Because RPM stimuli are visually presented, it is easy to mistake the test as one of visualperception or spatial reasoning. It is neither. As Cherkes-Julkowski, Stolzenberg, and Segal (1990)
have noted, "The Raven is as close to a study of pure thinking processes in the absence of the influence
of specific content acquisition as is available" (p.7). As Snow and Colleagues have shown using radex
and hierarchical models, the RPM is the best available measure of general intelligence (Marshalek,
Lohman, & Snow, 1983; Snow, Kyllonen, & Marshalek, 1984). As a measure of general intelligence the
RPM correlates highly with verbal measures of ability, even though the stimuli themselves arecompletely
nonverbal (Carpenter, Just, & Shell, 1990). In fact, Positron Emission Tomography (PET) Scans, which
produce computer generated images of the brain, have shown that the entire brain is involved in solving
RPM problems, with the three most used areas being the right cerebral hemisphere, the left temporal
lobes, and the left frontal lobes (Haier, Siegel, Nuechterlein, Hazlett, Wu, Paek, Browning, & Buchsbaum,
1988). The left temporal lobe involvement is most likely due to the use of verbal codes in solving RPM
problems.
Because its stimuli are nonverbal, the RPM can be administered fairly in American schools to
individuals who speak a language other than English. Because stimuli are visually presented, rather
than spoken, they are not transitory. Thus, the stimulus remains in front of the student, which reduces
the role of memory and even attentional factors in performance (Cherkes-Julkowski et al., 1990). Solving
RPM problems does not depend heavily, as do all language based tests, on acquired knowledge, specific
cultural experiences, or reading ability. As Carpenter et al. (1990) have noted, "The Raven measures
the ability to reason and solve problems involving new information, without relying extensively on an
explicit base of declarative knowledge derived either from schooling or previous experience." In sum,
the Raven measures general inteLligence and correlates with measures of linguistic ability. It uses
nonverbal stimuli and does not require a specific knowledge base.
Previous investigations have found that the Raven has not only been effective in identifying
traditionally underrepresented children for gifted programs, but also correlates with their success (Baska,
1986). In one study, Powers, Barkan, andJones (1986) found no significant differences between Hispanic
and Anglo-American children's mean scores, score variability, and test reliability for the RPM. Other
studies have supported the validity of the RPM for Hispanic (Powers & Barkm, 1986) and Navajo
students (Sidles & MacAvoy, 1987).
As Raven (1989) has noted, the Raven Progressive Matrices Tests have been used in over 1,600
published psychological studies (see Court, 1988; Court & Raven, 1977, 1982), making the RPM among
the most researched psychological tests. Until recently, however, the RPM has not been used widely in
applied clinical and educational settings. A major problem had been the lack of adequate U. S. norms
(Kaplan & Saccuzzo, 1989, 1993). An extensive and relatively current set of norms, which include U. S.
as well as worldwide norms, is now available (Raven, Summers et al., 1986). More than 30,000 students
31
32
aged 5 to 18 were chosen to be representative of school districts across the United States in approximately30 norming studies. Ethnicity and socioeconomic factors made independent contributions to thevariance. Ethnic differences, which were attributed to differences in birth weight, infant mortality, andthe incidence of serious childhood illness, showed a decline compared to earlier reports (Burciaga,1973; Hoffman, 1983; Jensen, 1980). There were, for example, no major Hispanic/White differences inthe Ontario-Montclair School District of California. Moreover, the RPM was found to have equalpredictive validity within each group (Hoffman 1983, 1986).
It should be noted that while ethnic differences may be declining, there remain differences inthe mean scores as a function of ethnicity as well as socioeconomic background. Nevertheless, thequestion remains as to whether the RPM can be used to achieve a more equitable selection of studentsthan can be obtained with more widely used traditional tests, such as the Wechsler Intelligence Scales.
In the present study we present the results of a Jacob Javits grant whose purpose was to evaluate
the efficacy of the RPM in the selection of traditionally underrepresented groups for gifted programs.The data were collected over a three year period and include an archival data pool of over 5,000administrations of the Wechsler Intelligence Scale to children from 8 major ethnic backgrounds.
Method
Subjects:The subjects were 16,985 children who were referred and evaluated for the gifted program at
San Diego City schools between the Fall of 1991 and the Spring of 1993. Students were classified intoone of eight ethnic backgrounds based on self-report of the parent as follows: 3,864 Latino/Hispanic,6,286 White, 2,389 African-American, 483 Asian, 75Native-American, 104 Pacific Islander, 1,419 Filipino,
and 958 Indochinese. There were 1407 classified as "Other". Of the 16,985 subjects, 51.5% (8,740) werefemale, 48.5% (8,245) male. The distribution by grade level was as follows: 24 first-, 7,664 second-,1,467 third-, 819 fourth-, 3,737 fifth-, 748 sixth-, 2,122 seventh-, 263 eighth-, and 90 ninth-graders. Therewere 51 cases where data on grade was missing.
As a comparison sample, the files of all children evaluated for giftedness in the San Diego CitySchool System between 1984 and 1990 were examined. During this time period, the district had usedthe WISC-R as the primary tool for identifying giftedness. Atotal of 9315 students had been given the
WISC-R durkng this time period.
A second point of comparison was based on actual enrollment figures by ethnic backgroundduring the course of the study. The average enrollment ratio in the district as a whole by ethnicbackground between 1991 and 1993 was as follows: 27.2%Latino/Hispanic, 37.2% White, 162% African-
American, 2.3% Asian, 0.6% Native-American, 0.7% Pacific Islander, 8% Filipino, and 7.7% Indochinese.
Procedure:Children were given either a WISC-R (entire 1984-1990 sample) or a Standard Raven (entire
1990-1993 sample) by a district school psychologist. The WISC-Rs were individually administered; the
Raven was group administered. As a part of the evaluation process the school psychologists conducted
a case study analysis of each child to evaluate for the presence of risk factors and level of achievement
(see Saccuzzo, Johnson, & Russell, 1992). Five risk factors were considered. These were: cultural/language, economic, emotional, environmental, and health. Achievement was evaluated in terms of
standard scores on the California Test of Basic Skills (C.:1'8S) or the Abbreviated Stanford Achievement
Test (ASAT).
Children were certified as gifted if they obtained a Full Scale IQ of 130 on the WISC-R or an IQ
equivalent of 130 on the Raven (i.e., achieved a score in at least the 98th percentile) based on the Smoothed
U.S. Norms reported by Raven et al. (1986). In addition, children who had two or more of the risk
factors were certified as gifted if they had a Full Scale WISC-R IQ of 120 or Raven IQ equivalent of 120.
Finally, children who obtained a WISC-R or Raven score of 3 standard deviations above the mean were
placed in a special "Seminar" program.
31;

Results
Figure 1 illustrates the ethnic composition of the district for all eight ethnic backgroundscompared to all children who were certified as gifted with the WISC-R (entire 1984-1990 sample) and toall children who were certified as gifted with the Raven (entire 1990-1993 sample). Inspection of Figure1 reveals that the RPM led to increased equity for all ethnic groups. For example, only about 20% of theexpected number of Latino/Hispanic were selected with the WISC-R, while about 80% of the expected
were selected using the RPM. For the Whites, about 200% of the expected were selected with the WISC-R, while only about 120% of the expected were selected with the RPM. Pacific Islanders, Native-Americans, and Indochinese were all greatly underselected by the WISC-R, but selected according tothe expectation based on their numbers with the Raven. Filipinos went from about 60% of expectationwith the WISC-R to about 120% with the Raven. African-Americans went from about 40% of theexpectation to over 60%. Thus, the RPM provided a more equitable distribution for all ethnicbackgrounds.
Figure 1. Ethnic composition of those certified gifted on the basis of W1SC-R scores (1984-1990)
versus Raven's Progressive Matrices scores (1990-1993).
80
60
40
20
0
111 Raven Qualified
o WISC-R Qualifiedm District %
iiiPtRozzz7z7z7fl CU
145ZU "Cl
(zs.....
E E< <
a)>
V r.i:.Z.:
2< Ethnicity
To demonstrate statistically the superiority of the RPM over the WISC-R in terms of equity, we
used the following procedure. ChiSquares were computed for each ethnic group using the number of
children certified by use of the WISC-R in each ethnic background as the expected and the number of
children in that ethnic background selected by use of the Raven as the observed. Table 1 provides a
summary of the findings. As Table 1 shows, there were significantdifferences in the dire ction of increased
equity for all groups but Native-Americans (where the n was small) and Asians.
. 33 .

Table 1. Chi Square results using children certified with the WISC-R as the expected
and children certified with the Raven as the observed
Ethnicity df n (Expected) n (Observed) Chi Square
Latino/Hispanic 1 413 1304 1922.23 ***
White 1 5535 3441 792.20***
African-American 1 454 714 148.90"*
Asian 1 260 306 8.14
Native American 1 20 36 12.80
Pacific Islander 1 10 50 160.00"*
Filipino 1 321 713 478.70***
Indochinese 1 112 513 1435.72***
* p < .05** p < .01*** p < .001
Despite the substantial improvement in equity when the RPM was used, inspection of Figure 1
indicates that full equity was not achieved. To verify this observation statistically, Chi Squares wereagain computed using the proportionate number of children in each ethnic background as the expectedcompared to the number actually certified with the Raven as the observed.
Table 2 presents a summary of these findings and reveals significant discrepancies for all groups
except Native-Americans, Pacific Islanders, and Indochinese. Latino/Hispanics and African-Americans
were significantly underselected compared to the expectation while Whites, Asians, and Filipinos were
significantly overselected.
Table 2. Chi Square results comparing the actual proportion of children in each ethnic
background with the number actually certified with the Raven
Ethnicity df n (Expected) n (Observed) Chi Square
Latino /Hispanic 1 2009 1351 215.51***
White 1 2743 3568 244.69***
African-American 1 1200 766 156.96***
Asian 1 170 319 130.59***
Native American 1 41 39 0.10
Pacific Islander 1 55 48 0.89
Filipino 1 595 739 34.85***
Indochinese 1 569 532 2.41
* p < .05** p < .01*** p < .001
34
38

To examine possible ethnic differences on the Raven independently of risk factors, we used thefollowing system. First, we considered only those children who scored in the 98th percentile or better
on tile Raven. Next, we determined the number of children in the school district in each ethnic backgroundthat would represent 2 percent of that group. For example, given the total number of Latino/Hispanicsin the district, 905 would be in the top two percent. The actual number of children in the tcp twopercent for each ethnic background was used as the expected, while the number of children in eachbackground who actually scored in the upper 2% (i.e., 98th percentile or better) was used as the observed
in a series of Chi Square analyses. Table 3 summarizes these analyses and shows significant discrepancies
for four groups: Latino/Hispanics and African-Americans, who were underselected; and Whites andAsians who were overselected compared to the expectation.
Table 3. Chi Square results comparing the actual number ofchildren in the top 2% of each ethnicbackground with the number who actually scored in the upper 2%
Ethnicity df n (Expected) n (Observed) Chi Square
Latino/Hispanics 1 905 379 305.72***
Whites 1 1238 2009 480.16***
African-Americans 1 541 209 203.74***
Asians 1 77 173 119.69***
Native Americans 1 18 21 0.50
Pacific Islanders 1 25 12 6.76
Filipinos 1 268 316 8.59
Indochinese 1 256 199 12.69
* p < .05p < .01
*** p < .001
To investigate the possibility of gender differences in WISC-R and Raven performance, thenumber of boys and girls who actually scored in the 98th percentile and above on each test in eachethnic group was compared to the expectation that there would be equal numbers of boys and girls. As
can be seen in Table 4, there were no significant differences in performance for boys and girls of any
ethnic background on the Raven.
Table 4. Chi Square results comparing the number of boys andgirls of each ethnic
background who actually scored in the top two percent on the Raven
Ethnicity df Total n Boys (Observed) Chi Square
Latino/Hispanics 1 374 181 0.19
Whites 1 2002 1057 3.13
African-Americans 1 206 116 1.64
Asians 1 172 79 0.57
Native Americans 1 21 12 0.21
Pacific Islanders 1 12 6 0
Filipinos 1 315 170 0.99
Indochinese 1 198 100 0.01
* p < .05** p < .01*** p < .001
Pt..:! a 7
35
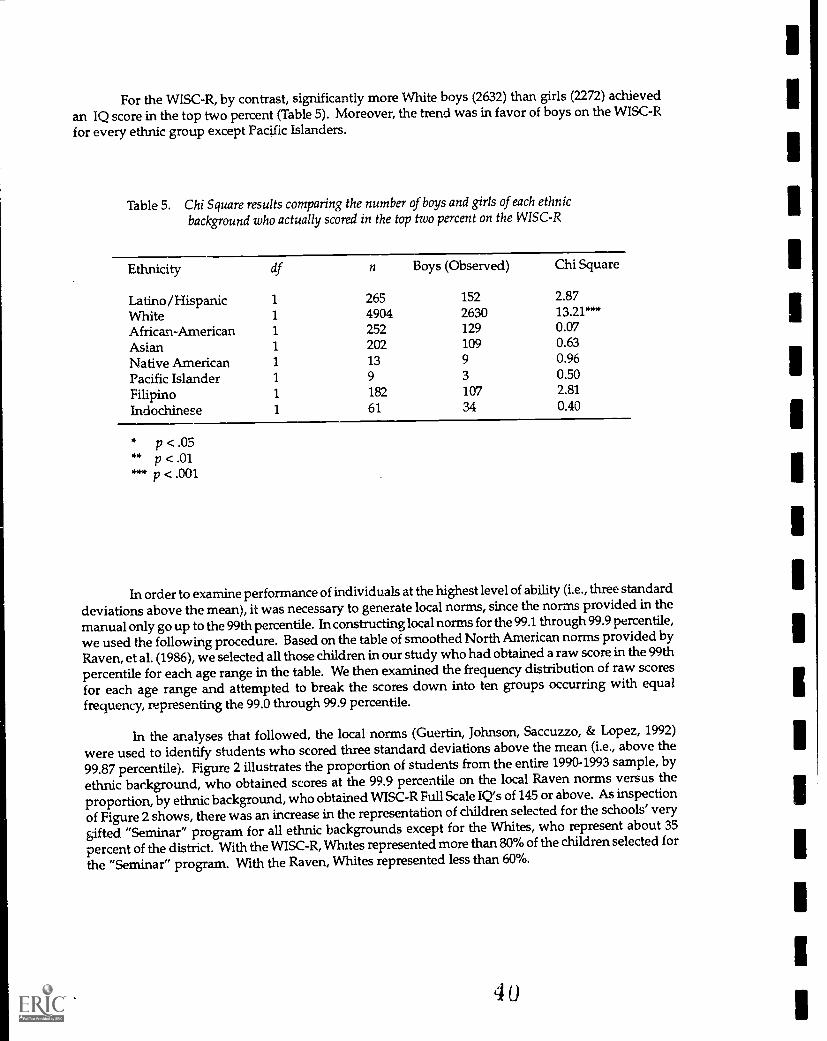
36
For the WISC-R, by contrast, significantly more White boys (2632) than girls (2272) achieved
an IQ score in the top two percent (Table 5). Moreover, the trend was in favor of boys on the WISC-Rfor every ethnic group except Pacific Islanders.
Table 5. Chi Square results comparing the number of boys and girls of each ethnicbackground who actually scored in the top two percent on the WISC-R
Ethnicity df n Boys (Observed) Chi Square
Latino /Hispanic 1 265 152 2.87
White 1 4904 2630 13.21***
African-American 1 252 129 0.07
Asian 1 202 109 0.63
Native American 1 13 9 0.96
Pacific Islander 1 9 3 0.50
Filipino 1 182 107 2.81
Indochinese 1 61 34 0.40
* p < .05** p < .01*** p < .001
In order to examine performance of individuals at the highest level of ability (i.e., three standarddeviations above the mean), it was necessary to generate local norms, since the norms provided in themanual only go up to the 99th percentile. In constructing local norms for the 99.1 through 99.9 percentile,
we used the following procedure. Based on the table of smoothed North American norms provided byRaven, et al. (1986), we selected all those children in our study who had obtained a raw score in the 99thpercentile for each age range in the table. We then examined the frequency distribution of raw scoresfor each age range and attempted to break the scores down into ten groups occurring with equalfrequency, representing the 99.0 through 99.9 percentile.
In the analyses that followed, the local norms (Guertin, Johnson, Saccuzzo, & Lopez, 1992)
were used to identify students who scored three standard deviations above the mean (i.e., above the
99.87 percentile). Figure 2 illustrates the proportion of students from the entire 1990-1993 sample, by
ethnic background, who obtained scores at the 99.9 percentile on the local Raven norms versus the
proportion, by ethnic background, who obtained WISC-R Full Scale IQ's of 145 or above. As inspection
of Figure 2 shows, there was an increase in the representation of children selected for the schools' very
gifted "Seminar" program for all ethnic backgrounds except for the Whites, who represent about 35
percent of the district. With the WISC-R, Whites represented more than 80% of the children selected for
the "Seminar" program. With the Raven, Whites represented less than 60%.
4 0

Figure 2. Ethnic composition of the 99.9th percentile: WISC-R versusRavens Standard Progressive Matrices
pi Raven Qualified
0 WISC-R Qualified
Ethnicity
0
a:
.Z
To demonstrate statistically the superiority of the RPM over the WISC-R for selection at thehighest level of ability, Chi Square analyses were computed for each ethnic background using theproportionate number of children selected by the WISC-R as the expected and the number selected bythe Raven as the observed, as was done in Table 1. Results were similar to those found for the childrenwho scored above 130. In fact, there were significant increases in the direction of increased equity for allethnic backgrounds except Asians and Native Americans (See Table 6).
Table 6. Chi Square results using children certified "Seminar" with the WISC-R as the
expected and children certified "Seminar" with the Raven as the observed
Ethnicity df n (Expected) n (observed) Chi Square
Latino/Hispanics 1 24 69 8438***
Whites 1 430 300 38.79***
African-Americans 1 22. 33 5.50*
Asians 1 26 33 1.88
Native Americans 1 1.4 3 1.83
Pacific Islanders 1 1 4 9.00**
Filipinos 1 13 49 99.69***
Indochinese 1 4 29 156.25***
* p < .05** p < .01*** p < .001
4137
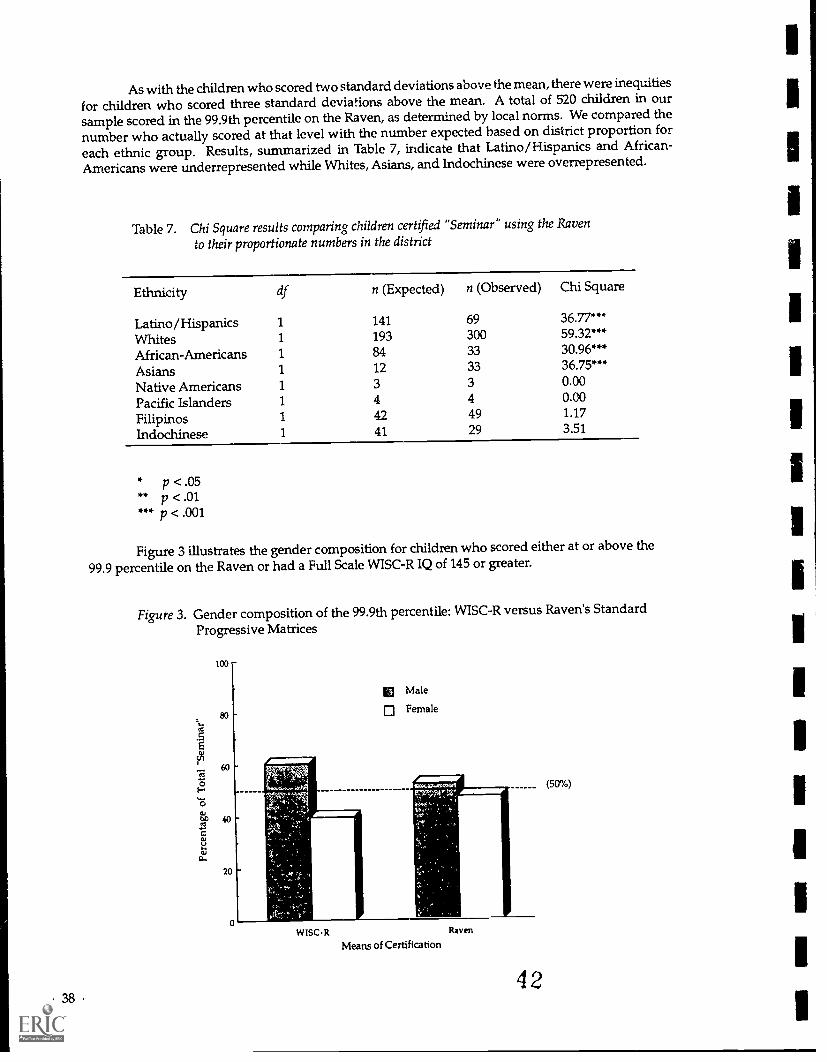
38
As with the children who scored two standard deviations above the mean, there were inequities
for children who scored three standard deviations above the mean. A total of 520 children in oursample scored in the 99.9th percentile on the Raven, as determined by local norms. We compared thenumber who actually scored at that level with the number expected based on district proportion foreach ethnic group. Results, summarized in Table 7, indicate that Latino/Hispanics and African-Americans were underrepresented while Whites, Asians, and Indochinese were overrepresented.
Table 7. Chi Square results comparing children certified "Seminar" using the Raven
to their proportionate numbers in the district
Ethnicity df n (Expected) n (Observed) Chi Square
Latino/Hispanics 1 141 69 36.77***
Whites 1 193 300 59.32***
African-Americans 1 84 33 30.96***
Asians 1 12 33 36.75***
Native Americans 1 3 3 0.00
Pacific Islanders 1 4 4 0.00
Filipinos 1 42 49 1.17
Indochinese 41 29 3.51
* p < .05** p < .01*** p < .001
Figure 3 illustrates the gender composition for children who scored either at or above the
99.9 percentile on the Raven or had a Full Scale WISC-R IQ of 145 or greater.
Figure 3. Gender composition of the 99.9th percentile: WISC-R versus Raven's StandardProgressive Matrices
100
80
60
40
20
WISC-R Raven
MeatiS of Certification
42
(50%)

As Figure 3 shows, the substantial gender imbalance in favor of males with the WISC-R wasessentially eliminated with the RPM. Chi square analyses statistically demonstrated the reduction ingender bias at the highest levels of ability. Results are summarized in Tables 8 and 9, where actualnumbers of boys and girls who scored three standard deviations above the mean on the WISC-R andthe Raven, respectively, were compared with the expectation of equal numbers of boys and girls.
Table 8. Chi Square results comparing boys and girls certified "Seminar" using theWISC-R with the expectation of equal gender numbers
Ethnicity df Total n Boys (Observed) Chi Square
Latino/Hispanic 1 52 29 0.35
White 1 925 570 22.47***
African-American 1 47 26 0.27
Asian 1 56 30 0.14
Native American 1 3 2 0.17
Pacific Islander 1 2 2 1.00
Filipino 1 29 21 2.91
Indochinese 1 8 5 0.25
* p < .05*4 p < .01*** p < .001
Table 9. Chi Square results comparing boys and girls certified "Seminar" using the
Raven with the expectation of equal gender numbers
Ethnicity df n (total) Boys (Observed) Chi Square
Latino/Hispanic 1 69 34 0.007
White 1 300 156 0.24
African-American 1 33 18 0.14
Asian 1 33 15 0.14
Native American 1 3 1 1.16
Pacific slander 1 4 3 0.5
Filipino 1 32 32 2.30
Indochinese 1 29 15 0.02
* p < .05** p < .01*** p < .001
4 3 39
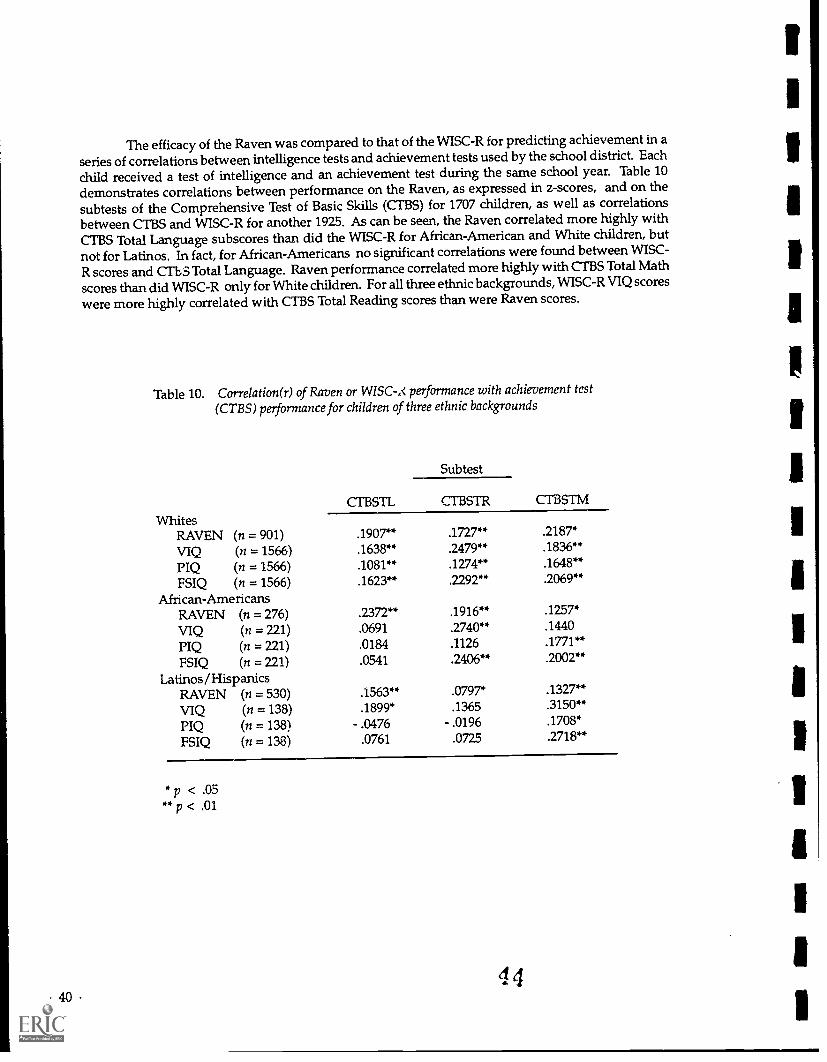
40
The efficacy of the Raven was compared to that of the WISC-R for predicting achievement in a
series of correlations between intelligence tests and achievement tests used by the school district. Eachchild received a test of intelligence and an achievement test during the same school year. Table 10demonstrates correlations between performance on the Raven, as expressed in z-scores, and on thesubtests of the Comprehensive Test of Basic Skills (ClBS) for 1707 children, as well as correlationsbetween CTBS and WISC-R for another 1925. As can be seen, the Raven correlated more highly with
C1 BS Total Language subscores than did the WISC-R for African-American and White children, but
not for Latinos. In fact, for African-Americans no significant correlations were found between WISC-
R scores and CMS Total Language. Raven performance correlated more highly with C1 BS Total Math
scores than did WISC-R only for White children. For all three ethnic backgrounds, WISC-R VIQ scores
were more highly correlated with CTBS Total Reading scores than were Raven scores.
Table 10. Correlation(r) of Raven or WISC-x petformance with achievement test(CTBS) performance for children of three ethnic backgrounds
Whites
Subtest
CTBSTMCTBSTRC1 BSTL
RAVEN (n = 901) .1907** .1727** .2187*
VIQ (n = 1566) .1638** .2479** .1836**
PIQ (n = 1566) .1081** .1274** .1648**
FSIQ (n = 1566) .1623** .2292** .2069**
African-AmericansRAVEN (71 = 276) .2372** .1916** .1257*
VIQ (n = 221) .0691 .2740** .1440
PIQ (n = 221) .0184 .1126 .1771**
FSIQ (n = 221) .0541 .2406** .2002**
Latinos/HispanicsRAVEN (n = 530) .1563** .0797* .1327**
VIQ (n = 138) .1899* .1365 .3150**
PIQ (n = 138) - .0476 - .0196 .1708*
FSIQ (n = 138) .0761 .0725 .2718**
* p < .05** p < .01
4 4

Correlations between the Raven and the Abbreviated Stanford Achievement Test (ASAT) for
children of six ethnic backgrounds are summarized in Table 11. Correlation coefficients ranged from.2235 to .3109, with a median r = .25. Clearly, the Raven correlates more highly with the ASAT than with
the CTBS in all three domains measured (language, reading, and math). In addition, RavenASATcorrelations were higher than WISC-RCTBS correlations.
Table 11. Correlation (r) of Raven performance with achievement as measured by the
Abbreviated Stanford Achievement Test for children of six ethnic backgrounds
(Raven performance was expressed in Z scores.)
Total Total Total
Ethnicity n Language Reading Math
African-American 1581 .2478** .2639** .2695**
Asian 305 .2386** .2654** .2634**
White 4020 .2245** .2252** .2494**
Filipino 1002 .2235** .24384* .2429**
Indochinese 587 .2582** .2484** .2584**
Latino 2528 .2468** .2981** .3109**
** p < .01
Discussion
Our results lead to two clear conclusions. First,considering only children referred for giftedness
testing, the RPM produces far better equity for all ethnic backgrounds when compared to the WISC-R.
While the RPM overselected Whites, it did so at a substantially reduced rate (i.e., 120 percent overexpectation with the Raven vs. 200 percent over expectation with the WISC-R). Moreover, while it did
not produce complete equity, even when considering such risk factors as low socioeconomic or cultural
differences, the RPM led to substantially increased selection ratios for traditionally underrepresented
groups such as Latino/Hispanics and African-Americans. Moreover, the RPM did lead to an equitable
selection for Native-Americans, Pacific Islanders, and Indochinese, all of whom had been
underrepresented with the WISC-R.
The success of the RPM with Indochinese is of interest in terms of evaluating non-Englishspeaking children. In the past the district had difficulties evaluating giftedness in Indochinesechildren
who spoke little or no English. Since use of the RPM enabled evaluation of ability independently of
language, it was possible to assess these children with the least bias heretofore achieved. With the RPM
Indochinese were selected almost exactly in proportion to their numbers in the district as a whole.
The advantage of the RPM was not only evident in terms of producing a more equitable
distribution, but it was more effective than the WISC-R in predicting language achievement for African-
American and White children, as well as in predicting math achievement for Whites. Although our
data cannot be used to directly compare the WISC-R with the Raven for predicting scores on the ASAT,
RPM scores were more highly correlated with ASAT scores than with CTBS scores for all groups.
However, the WISC-R correlated more highly than the RPM with CI tiS Total Reading for all groups
and with Total Math for African-Americans and Latinos. It would be instructive to directly compare
WISC-R ASAT and Raven ASAT correlations in the same sample to more completely compare
efficacy for predicting achievement.
The Raven's ability to predict achievement, even language achievement, is due to its high
correlation with Spearman's (1904, 1927a, 1927b) g factor (see Carpenter et al., 1990; Marshalek et al.,
1983; Snow et al., 1984). Since tests of language achievement are highly correlated with g, g-saturated
tests such as the RPM share common variance with them. Thus, the RPM can have clear advantages for
measuring abilities for individuals who speak a language other than English or are from a different
4 541
42
culture (Court, 1991). Moreover, since it does not depend on an explicit knowledge base, as does theWISC-R and other verbally weighted standardized tests, the RPM is better suited to traditionallyunderrepresented children. It must be emphasized, however, that the RPM is not simply forunderrepresented children, as it led to a more equitable distribution across ethnicity even for Whites.
Previous studies that have compared the WISC-R and the Raven in the selection of gifted children
(e.g., James, 1984; Pearce, 1983; Tulkin & Newbrough,1968; Meeker, 1973; Kier, 1949) have been primarily
concerned with the correlation between the two measures. Such studies have reported correlations in
the .70's and have been generally supportive of the Raven as an alternative. Our findings suggest that
where equity is a concern, the Raven is a far better measure.
It should be noted, however, that the population of gifted children selected by the Raven is not
identical to that selected by the WISC-R. The differences are important. First, there is the group ofchildren who would be selected by either test. These children tend to be verbally advanced, highlyintelligent, and high in achievement. Second, there is the group of children who would be qualified by
a WISC-R, but not by a Raven. In our experience, such children tend to be verbally advanced andhighly motivated. Teachers of academic gifted programs readily accept these children as gifted, especially
in the early years. Due to the unreliability of IQ scores at the upper IQ levels, especially for the younger
age levels, the IQ's of many of these verbally advanced children show regression to the mean as they
mature.
A third group of children are those who would not qualify with the WISC-R, but would with
the Raven. Such children are of extremely high potential, but may be only average (or even below
average) in achievement. Others may be of very high ability, but poorly motivated. Our experiencehas
revealed that this type of student is not always accepted by teachers as gifted. Yet, it is this very type of
child the one with raw, undeveloped potential for whom the present investigation was aimed. For
programs using the Raven on a widescale basis, teacher training is often needed to help integrate these
students into the gifted classroom.
One of the reasons tests like the WISC-R continue I beused, in spite of their obvious selection
bias, is that they are reliable and objective. To date, no other approach matches standardized tests in
terms of reliability, predictive validity and objectivity Yet, given the huge selection bias inherent in the
WISC-R, it is difficult to imagine how it, and others like it, can continue to be used in today's litigiousenvironment and heightened awareness of civil rights. A simple examination of Figure 1 would findthe WISC-R completely unacceptable as a tool to select for giftedness.
The Raven clearly fared better in terms of equity without sacrificing objectivity, reliability, andpredictive validity. Nevertheless, it is also clear that the Raven, even when used in conjunction with a
consideration of risk factors, still falls short of producing equity across all ethnic groups.
Based on our present findings, and on previous reviews of psychometric tests (Kaplan &Saccuzzo, 1993), we are convinced that as traditional tests are presently used, there exists not a single
one that would produce an equitable selection for gifted programs. If the goal is to select children for an
academic program using an objective, reliable measure with high predictive validity then traditional
tests, as they are presently used, fall short in terms of equity. The search for multiple intelligences, as
suggested by Gardner (1983), is, of course, one viable option. The use of portfolios and other subjectiveapproaches, however, while promising on a small scale, faces numerous obstacles in terms of objectivity
reliability and predictive validity.The question remains, are traditional tests beyond redemption? We believe that there remain
potentially promising options. One such option, suggested by Raven (1989), is the use of local ethnic
norms for selection purposes in gifted programs. A second, suggested by Carlson (1989) and Colleagues
(Carlson & Dillon, 1978; Carlson & Wiedl, 1978), is to use traditional tests in creative ways. For example,
using a dynamic testing approach with the Raven, Carlson and Wiedl (1979) were able to eliminate
Hispanic/White and Black/White differences in IQ. Before we abandon what remains the most objective,
reliable, and valid approach to selection, itbehooves us to determine whether innovative uses can rescuetraditional assessment procedures, or if they should be abandoned in favor of less psychometrically
sound, but perhaps more equitable, approaches.
4 6

CHAPTER 2
Use of the WISC-R with Disadvantaged Gifted Children:Current Practice, Limitations, and Ethical Concerns
Nancy E. JohnsonSan Diego State University/University of California San Diego
joint Doctoral Program in Clinical Psychology
This research was funded in part by Grant R206A00569, U.S.
Department of Education, Jacob Javits Gifted and Talented Discretionary
Grant Program.The author expresses appreciation to her mentor, Dennis P.
Saccuzzo, San Diego State University, to the San Diego Unified CitySchools, to Gifted and Talented Education (GATE) Administrator DavidP. Hermanson, and to the following school psychologists: Will Boggess,Marcia Dijiosia, Eva Jarosz, Dimaris Michalek, Lorraine Rouse, Ben Sy,
and Daniel Williams.Correspondence should be addressed to Nancy E. Johnson, San
Diego State University, 6363 Alvarado Court, Suite 103, San Diego,California 92120-4913 (Telephone: 619-594-2845 /FAX: 619-594-6780 /
e-mail: [email protected]).
Copyright 1992by
Nancy Ellen Johnson
47 43
44
The Wechsler Intelligence Scale for Children-Revised (WISC-R) is the
most widely used individual instrument for inclusion or exclusion of childreninto programs for the gifted in the UnitedStates. The present study investigatedthe psychometric adequacy of this use of the WISCR in a population of 8396potentially gifted elementai y grade children of diverse ethnic and culturalbackgrounds as well as diverse emotional and social environments. Study Iincluded analyses of VIQ-PIQ base rates in 5796 children who achieved FullScale IQ (FSIQ) scores of 130 or above, plus comparisons of similarities anddifferences in subsamples divided on ethnic background, on level of riskidentified in the child's home environment, and on the extremes of achievement(measured by a standardized achievement test). In contrast to findings from theWISC-R standardization sample, children in thisstudy differed strikingly, acrossethnic groups and across levels of risk, in shape of the VIQ-PIQ differencedistribution but not in absolute size of the VIQ-PIQ difference. The frequencydistributions for African-Americans and Caucasians were skewed in favor ofVIQ; for Filipinos, in favor of PIQ. Those of Asians and Hispanics closelyresembled normal distributions. Skewness for children with identified risk wasin favor of PIQ relative to those without risk. The importance of clinical versusstatistical significance in decision-making was discussed, with particularattention to what constitutes a 'rare' VIQ-PIQ difference in gifted children. Study
II attempted, through multivariate modeling, to identify either a single model
or individual models, using subtests of the WISC-R, that would select equallyaccurately from five ethnic groups (African-American,Asian, Caucasian, Filipino,and Hispanic). No single model or combination of individual models was foundto select equally from each of the ethnic backgrounds in a proportionatelybalanced random subsample of 1438. Implications for this use of the WISC-R in
divcrse gifted populations whose characteristics differ from those of thestandardization sample were discussed, in light of the professional ethics ofresponsible test use.
41 8
I. Introduction
Currently, identification of giftedness in school age children is undertaken nationwide with theaim of providing special educational services for those with special gifts and talents. Historically, the
use of tests to identify individuals with special talent has been recorded as early as 2200 BC in China
(DuBois, 1970). In 1869 Galton first addressed the concept of genius in the psychological literature. In1925 Tennan began the first major study in which giftedness was operationally defined in terms ofperformance on standardized IQ tests. Since these landmark contributions, conflict and controversyhave abounded in the educational and psychological literature on giftedness. Disagreements continueover the definition of giftedness per se, its measurement by the use of IQ and achievement tests, and its
nurturance by special instructional programs. This work will focus on one aspect of giftedness: ethical
use of tests in the selection of children from diverse backgrounds for early inclusion in special programs
for the gifted and talented.
Identification and inclusion of gifted children from varied cultural and linguistic backgrounds
into gifted and talented programs at an early age is vital. As Horowitz and O'Brien (1986) note, "there
is no way to measure the loss when individuals capable of functioning considerably above the normal
level do not contribute as much to society as their capabilities will allow" (p. 1147). The summary of
findings in an evaluation of the Gifted and Talented Education (GATE) program in San Diego in the
academic year 1989-1990 (Millett, 1990) included the information that "GATE students outperformedgifted students who are not participating in the program at every grade level" (p. 9). Given the
demonstrated benefits of programs for gifted children, educators face the challenge of early identification
of children with the highest potential for inclusion in enrichment programs. This problem becomes
more critical in light of mandates that educational programs strive to guarantee equal access and yet
operate within a framework of increasingly restrictive educational budgets.
Problems in the Definition of Giftedness
Currently in this country most efforts to identify giftedness in children utilize a definition based
on intelligence, measured by some form of standardized group or individual IQ test. The trend began
to be formalized in 1971, when the first definition of gifted and talented children was proposed on a
national level (Pub. L. 91-230, § 806):
Gifted and talented children are those identified by professionally qualified persons who
by virtue of outstanding abilities, are capable of high performance. These are children who
require differentiated educational programs and/or services beyond those normally provided
by the regular school programs in order to realize their contribution to self and society.
Children capable of high performance include those with demonstrated achievement and/
or potential ability in any of the following areas, singly or in combinations: (1) general intellectual
ability, (2) specific academic aptitude, (3) creative or productive thinking, (4) leadership ability,
(5) visual and performing arts, (6) psychomotor ability.
Seven years later, 42 states had either enacted laws or formulated guidelines for the definition of
giftedness. In all 42 states, including California and New York, general intellectual ability wasspecified
(Fox, 1981).
The issue of the definition of the nature of "intelligence," thought to underlie intellectual ability
and academic performance, has probably been debated as much as any other in the history of the
psychological literature. Binet (in Terman, 1916) defined intelligence as "the capacity to makeadaptations
for the purpose of attaining a desired end" (p. 45). Spearman (1923) wrote that intellect involves "educing
either relations or correlates" (p. 300), and proposed a two-factor theory; g was defined as an underlying
general mental energy, whereas s represented one or more specific factors. Wechsler (1958) espoused
the definition: "the aggregate or global capacity of the individual to act purposefully, to think rationally,
and to deal effectively with his environment" (p. 7). However, Thorndike (1927) theorized that
intelligence involves interconnected but distinct abilities and so advocated a multif actor approach.
45
4 9

46
Guilford (1967) developed a multifactor theory of intelligence based on three dimensionsthe operationsinvolved in information processing, the contents, and the products. In contrast, Vernon's (1950) was a
hierarchical theory of intelligence based on the hypothesis that g is at the highest level of the hierarchy
and represents the broadest aspect.
More recently, Sternberg (1986) developed a theory that divides intelligence into threedimensions. Gardner (1983), on the other hand, suggested that there are several distinct and relativelyseparate competencies, which he described as multiple intelligences. The debate continues, with sometheorists espousing models based on an underlyingbasic mental capacity and others favoring a set of
distinct and relatively discrete mental abilities.
Issues in the Assessment of Intellectual Giftedness
In acknowledging that there are many definitions of what constitutes intelligence, we mustalso acknowledge that there are many tests that purport to measure it. At the present time, however,
the single instrument most frequently used for identification of giftedness in children in the UnitedStates is the Wechsler Intelligence Scale for Children - Revised (WISC-R) (Klausmeier, Mishra, & Maker,
1987). The WISC-R has been widely acknowledged to have excellent reliability and concurrent validity
(Sattler, 1988). The current study examined the characteristics, efficacy, and fairness of this particular
use of the WISC-R in one large school district (San Diego City Schools) over a seven-year span of time.
The San Diego City School District is among the most culturally diverse in the nation. The
1991-92 student population of 123,503 included 35.4% Caucasian, 28.8% Hispanic, 16.3% African
American, and 8.1% Filipino children. The remaining 11.4% consisted of Indochinese, Asian, Pacific
Islander, and Native American students. Programs for gifted and talented students, begun in thedistrict in the 1940's, have demonstrated an on-going commitment to achieving equal access forindividuals of all ethnic backgrounds through the use of selection instruments more likely to identify
giftedness in culturally and linguistically different students. Despite these attempts, the non-Caucasianstudent population in gifted programs was 36.3% in 1989-90, as opposed to 61% in the school district as
a whole. Underrepresented groups included Hispanics and African Americans; overrepresented wereAsian, Filipino, and non-Hispanic white students (Millett, 1990). Richert (1987) cited figures published
by the U.S. Department of Education's Office of Civil Rights revealing that groups such as Hispanicsand African-Americans are underrepresented by as much as 70% in gifted programs throughout thisnation. Thus the underselection of these two groups in San Diego reflects a nationwide problem. The
National Report on Identification for Gifted and Talented Youth (Richert, Alvino, & McDonnel, 1982)
noted problems with traditional selection procedures. Indeed, today most authorities believe thatespecially for disadvantaged.groups traditional standardized tests should not be the sole or even the
primary measure of giftedness (Fox, 1981; Garcia, 1981; Horowitz & O'Brien, 1986; McKenzie, 1986;
Meeker & Meeker, 1973; Renzulli, 1978; Sternberg, 1981).
The American Educational Research Association, The American Psychological Association,
and the National Council on Measurement in Education take the position that "In elementary orsecondary education, a decision or characterization that will have a major impact on a test taker should
not automatically be made on the basis of a single test score." (Standard 8.2, Standards for Educational
and Psychological Testing, 1985). Although many authorities do recommend the use of multipleidentification procedures such as IQ achievement, and behavioral data in the identification ofgiftedness,
in practice much emphasis is commonly placed on a single measure of achievement or of overall
intelligence (Alvino, McDonnel, & Richert, 1981). Zigler and Farber (1985) stated that a specific defined
level of IQ (such as a score two standard deviations above the mean) is the most adequate index of
giftedness. Pegnato and Birch (1959), Clark (1979), and Hagen (1980) recommended use of an
individually administered IQ test as the best and the quickest way to find //lost gifted children. Sattler
(1988) concluded that "the single best method available for the identification of children with superior
cognitive abilities is a standardized, individually administered test of intelligence..." (p. 671), but went
on to note that among those who are difficult to identify as gifted are children who are culturally
different, especially since they may not show superior oral language skills. Indeed, as was so well
expressed by the Standards for Educational and Psychological Testing (1985), "A child from one culture
5 0

who is evaluated with mores appropriate to another culture may be considered taciturn, withdra wn, or
of low mental ability."
Methodological Issues in W/SC-R Testing of Ethnic Groups
Use of standardized intelligence test summary scores without ethnic, cultural, gender, economic,
and other considerations is based on a uniformity assumption: that all students, all testers, and all
situations are homogeneous. The fallacies inherent in this assumption in the use of standardized tests
have been repeatedly noted (Guertin, Ladd, Frank, Rabin, & Hiesler, 1971; Lewandowski & Saccuzzo,
1976). Unfortunately, most standardized tests have only a single set of norms that have not been corrected
for the demographic characteristics of the individual. The WISC-R, for example, yields scores corrected
only for chronologic age. It has long been recognized that the influence of demographic variables in
tests of brain function is apparent for individuals (Finlayson, Johnson, & Reitan, 1977; Reitan, 1955). For
example, recent cross-sectional studies of theWechsler tests for adults indicate that a single set of norms
cannot be used for individuals at different age and education levels (Heaton, Grant, & Matthews, 1986).
Further, the use of a single summary score may mask differences in the pattern of strengths
across ethnic backgrounds and gender in gifted children. Lesser, Fifer, and Clark (1965) reported results
of a comparison of mental abilities in seven and eight year old first grade children from four ethnic
groups and two socioeconomic levels in New York. Individuals of African-American, Chinese, Jewish,
and Puerto Rican background were compared on four basic dimensions of mental ability using amodified
version of the Hunter College Aptitude Scales for gifted children. The children were found to differ in
pattern of mental abilities across ethnic background but not across socioeconomic status. Lesser et al.
proposed that identification of the pattern ofrelative strengths and weaknesses of children from varied
cultural backgrounds was a vital prerequisite to decisions about education in general and curriculum in
particular.
Methodological Issues in Quasi-Experimental Assessment Studies
In reviewing the literature on the use of tests with different ethnic groups, several methodoligical
issues become apparent. Some are inherent in the nature of quasi-experimental and archival design
(e.g., the impossibility of random assignment to groups on key factors such as ethnic background or
socioeconomic status), and limit the generalizability and applicability of the studies. Others result from
a failure to control for moderator variables such as socioeconomic status and acculturation, or from a
failure to use multiple methods within the same study. Several of these points will be illustrated in the
following examination of studies subsequent to Lesser, et aL
Since publication of Lesser et al.'s findings, numerous investigators have made attempts to
confirm differences in pattern of mental abilities across ethnic groups (e.g., Flaugher & Rock, 1972;
Hennessy & Merrifield, 1976; Sitkei & Meyers, 1969). None of the subsequent studies have used the
same tests, the same ethnic groups, or even children of the same ages. Most did not control for level of
ability, and no single study looked at all of these confounds systematically. Despite these flaws, there
has been a tendency among reviewers (e. g., Sattler; 1988) to characterize these attempts as "failure to
replicate" the findings of Lesser et al.. Indeed, Sattler cited one study of 4 year olds (Sitkei & Meyers,
1969), one of junior high school students (Flaugher & Rock, 1972), and one of highschool seniors accepted
for admission to a major university (Hennessy & Merrifield, 1976) as evidence of failure to replicate.
These studies were factor analytic in nature. Whereas the original work by Lesser et al. was based on an
analysis of covariance method of comparing mean scores on tests across groups, the studies cited by
Sattler, as well as elsewhere in the literature, compared factor structure of a given test across groups,
and some included a comparison of factor means across the groups.
Several issues in quasi-experimental design and methodology become apparent when such
studies are compared as "replications":
1. It is not valid to compare results of studies with populations of preschool children, elementary
school children, junior high school students, and high school seniors. The increased exposure to
47
r,)
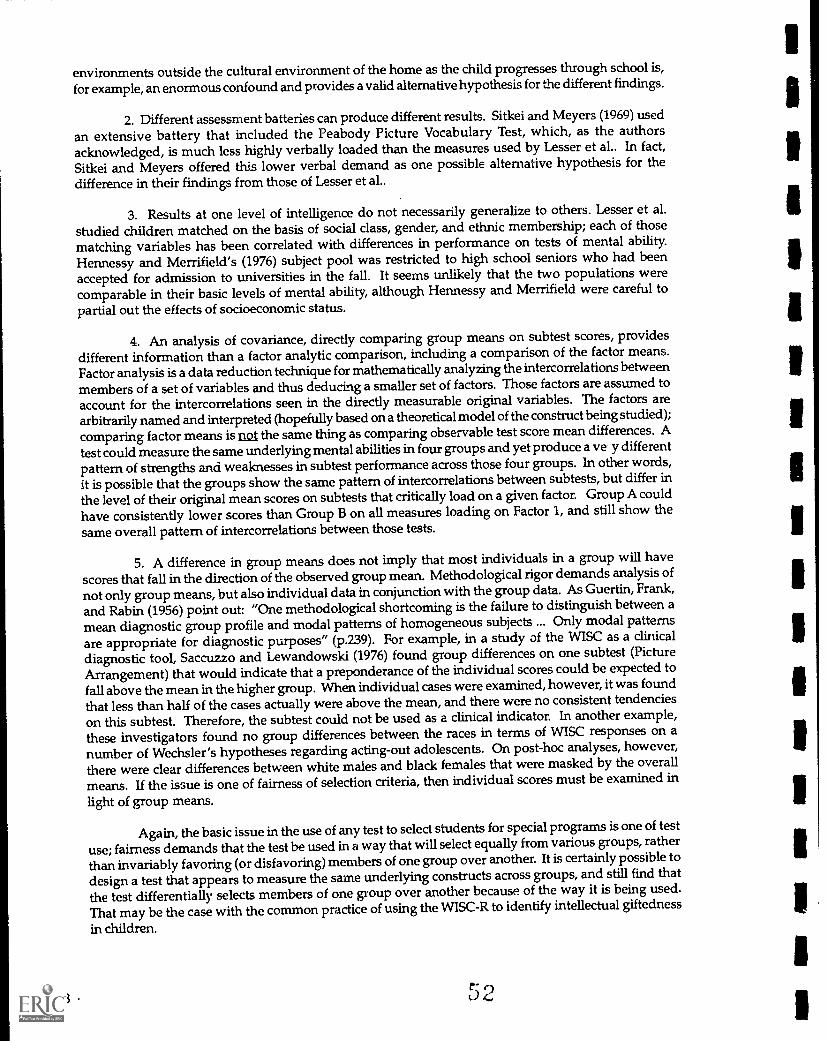
48
environments outside the cultural environment of the home as the child progresses through school is,for example, an enormous confound and provides a valid alternativehypothesis for the different findings.
2. Different assessment batteries can produce different results. Sitkei and Meyers (1969) used
an extensive battery that included the Peabody Picture Vocabulary Test, which, as the authorsacknowledged, is much less highly verbally loaded than the measures used by Lesser et al.. In fact,Sitkei and Meyers offered this lower verbal demand as one possible alternative hypothesis for thedifference in their findings from those of Lesser et al..
3. Results at one level of intelligence do not necessarily generalize to others. Lesser et al.studied children matched on the basis of social class, gender, and ethnic membership; each of thosematching variables has been correlated with differences in performance on tests of mental abilityHennessy and Merrifield's (1976) subject pool was restricted to high school seniors who had beenaccepted for admission to universities in the fall. It seems unlikely that the two populations werecomparable in their basic levels of mental ability, although Hennessy and Merrifield were careful topartial out the effects of socioeconomic status.
4. An analysis of covariance, directly comparing group means on subtest scores, providesdifferent information than a factor analytic comparison, including a comparison of the factor means.Factor analysis is a data reduction technique for mathematicallyanalyzing the intercorrelations betweenmembers of a set of variables and thus deducing a smaller set of factors. Those factors are assumed to
account for the intercorrelations seen in the directly measurable original variables. The factors arearbitrarily named and interpreted (hopefully based on a theoreticalmodel of the construct being studied);comparing factor means is not the same thing as comparing observable test score mean differences. A
test could measure the same underlying mental abilities in four groups and yet produce a ye y differentpattern of strengths and weaknesses in subtest performance across those four groups. In other words,it is possible that the groups show the same pattern of intercorrelations between subtests, but differ in
the level of their original mean scores on subtests that critically load on a given factor. Group A couldhave consistently lower scores than Group B on all measures loading on Factor 1, and still show the
same overall pattern of intercorrelations between those tests.
5. A difference in group means does not imply that most individuals in a group will have
scores that fall in the direction of the observed group mean. Methodological rigor demands analysis of
not only group means, but also individual data in conjunction with the group data. As Guertin, Frank,and Rabin (1956) point out: "One methodological shortcoming is the failure to distinguish between amean diagnostic group profile and modal patterns of homogeneous subjects ... Only modal patternsare appropriate for diagnostic purposes" (p.239). For example, in a study of the WISC as a clinical
diagnostic tool, Saccuzzo and Lewandowski (1976) found group differences on one subtest (PictureArrangement) that would indicate that a preponderance of the individual scores could be expected tofall above the mean in the higher group. When individual cases wereexamined, however, it was found
that less than half of the cases actually were above the mean, and there were no consistent tendencies
on this subtest. Therefore, the subtest could not be used as a clinical indicator. In another example,
these investigators found no group differences between the races in terms of WISC responses on anumber of Wechsler's hypotheses regarding acting-out adolescents. On post-hoc analyses, however,
there were clear differences between white males and black females that were masked by the overall
means. If the issue is one of fairness of selection criteria, then individual scores must be examined in
light of group means.
Again, the basic issue in the use of any test to select students for special programs is one of test
use; fairness demands that the test be used in a way that will select equally from various groups, rather
than invariably favoring (or disfavoring) members of one group over another. It is certainly possible to
design a test that appears to measure the same underlying constructs across groups, and still find that
the test differentially selects members of one group over another because of the way it is being used.
That may be the case with the common practice of using the WISC-R to identify intellectual giftedness
in children.
5 2

The San Diego City Schools Studies
Preliminary studies with a San Diego gifted population using a group measure of intelligence,
the Developing Cognitive Abilities Test, indicated that predictors of giftedness depend on ethnic
background (Saccuzzo, Hermanson, Dome, Johnson, & Sharnieh, 1990). For African-Ame ricans, the
quantitative score proved most predictive, while for Hispanics the spatial and total scores were mostpredictive of selection for gifted programs. Total scores alone were most predictive for only theCaucasians and Filipinos, who were overrepresented in the gifted and talented program. These findingssuggested that giftedness may be expressed in unique patterns of abilities not best measured by asummary IQ score. Although the study was not (and was not intended to be) a replication of Lesser et
al.'s work, the results did add weight to the idea thatidentifiable differences exist in the way giftedness
is expressed across ethnic and culturalbackgrounds. In further support of this hypothesis, a summaryof academic performance of all students in gifted programs in San Diego City Schools indicated that
Hispanic and African American students at all grade levels generally fall below other groups (and
below the 90th percentile) only in reading and language (Millett, 1990). Analysis of VIQ - PIQ
discrepancies in a random subset of this population also revealed differences that varied across ethnicbackground and as a function of the size of the discrepancy (Saccuzzo, Johnson, & Russell, 1992).
Given that the WISC-R is one of the single most widely used instruments for the identification
of giftedness in the United States, and given the problem of underselection of certain ethnic groups, the
goal of this study was to examine the feasibility of using the WISC-R in any way to select a balanced
population of gifted children,since it would appear that a summary IQ score will not do so. The present
work began with an analysis (Study I) of the WISC-R Verbal, Performance, and Full Scale scores of
children who achieved a Full Scale IQ score at least two standard deviations above the mean (FSIQ >
130). Children were compared and contrasted in terms of basic demographic factors such as ethnicity
and gender, as well as on environmental factors thought to place them at risk for limited expressionof
their full potential (e.g., economic, language, and emotional factors). Verbal-Performance differenceswere examined in a study of base rates for the entire sample of intellectually gifted children as well as
for subsamples defined on the basis of ethnic background, areas of risk, and documented low or highschool achievement test scores. In spite of excellentdiscussions by Kaufman (1976) and Matarazzo and
Herman (1984) on the difference between statistical and clinical significance, little has been documented
about the relative rarity of specific VIQ-PIQ discrepancies in different populations of children. Finding
that a child has a statistically significant VIQ-PIQdifference tells the clinician or educator nothing morethan that the difference is probably real and not due to chance: it does not address the issue of the rarity
of that difference in a given population or of its real world significance, nor does it address the likelihood
that such a VIQ-PIQ difference is associated with low achievement. Only by studying actual occurrence
in a population can we address such issues. Kaufman (1976) noted no differences in base rates across
ethnic backgrounds in children with IQ values of at least 120 in the standardization sample. Two
serious problems with that finding are that Kaufman did not take into account the direction of the
difference (only the size), and that there were almost certainly not enough non-Caucasian children inthe sample at those IQ levels to have found a difference even if it existed: the total number at that IQ
level was 213. The present study was undertaken to provide accurate base rates for a large, culturallydiverse sample of gifted children, with the hope that more evidence could be provided to dispel invaliduniformity assumptions and to shed light on this gifted population.
Study II examined the feasibility of deriving a single set of criteria from the WISC-R to select a
proportionately representative, ethnically diverse sample of children for inclusion in programs for the
gifted by exploring two alternative hypotheses: (1) there exists a single pattern of WISC-R subtest scores
that predicts giftedness equally across genderand ethnic background; or (2) there is a unique pattern of
cognitive strengths and thus different predictors of giftedness for each group. Ethnic backgrounds
represented included African-American, Asian, Caucasian, Filipino, and Hispanic.
General Considerations in the Use of Tests for Giftedness
Again, the basic issue is one of competent test use. Despite ongoing discussion,acknowledgment of the limitations of IQ tests, and exhortations to use these tests in an informed manner
(Borland, 1986; Kaufman & Harrison, 1986; Robinson & Chamrad, 1986; Sternberg, 1982), no single
49

50
study to date in the educational or psychological literature has directly and adequately addressed theissue of fairness of the use of this test in an ethnically diverse population of potentially gifted children.Goals of this study included possible explication of a more fair and adequate use of the WISC-R inidentification of giftedness, a discussion of selection bias that results from its use, and furtherunderstanding of the limits as well as the full potential of the WISC-R in the selection of students from
diverse backgrounds for gifted programs in schools.
Benefits to be gained from improved methods of selection aresubstantial. If we are to increase
the number of underrepresented minorities in the professions, as morally and legally mandated, it isvital to identify and encourage those individuals as early as possible. What are the consequences if we
continue to fail in this endeavor? They are perhaps best summed by D. D'Souza (1991) in his description
of the experience of one university noted for its aggressive affirmative action policy:
...the academic difficulties encountered by affirmative action students who find it impossible
to compete effectively with other, better-prepared students, are reflected in Berkeley's extremely
Berkeley at about the same rate: 65-75 percent. That is to say that 25-35 percent drop out beforehigh dropout rate for Hispanic and black undergraduates. Whites and Asians graduate from
graduation. Hispanics graduate at under 50 percent. More than half drop out. Blacks graduateat under 40 percent. More than 60 percent drop out.
...Berkeley does not release the number of blacks and Hispanics admitted on affirmativeaction who drop out, but these data are contained in a confidential internal report which tracksfreshmen enrolled in 1982. By 1987, five years later, only 18 percent of blacks admitted onaffirmative action had graduated from Berkeley; blacks admitted in the regular programgraduated at a 42 percent rate. Similarly, oJy 22 percent ofaffirmative action Hispanics finished
that approximately 30 percent of black and Hispanic students drop out before the end of theirin five years, compared with 55 percent for other Hispanics. The most recent figures suggest
freshman year; in the words of the report, they seem to stay "only long enough to enhance theadmissions statistics." (p. 39)
I would propose that the key phrase is "better prepared" students and suggest that such preparationmust begin as early in elementary education as possible.
Inclusion of more equitable proportions of high risk children in gifted programs is a goal muchsought in education. A unique opportunity exists in San Diego to study selection procedures for giftedand talented programs: a large, ethnically diverse metropolitan population plus a school district thatcontinues to demonstrate its commitment to identification of underrepresented and disadvantaged
students.
II. Methods
Two studies were completed: I) an analysis of the base rates of VIQ-PIQ differences in a
two standard deviations above the mean, and II) an examination of the use of the WISC-R to select apopulation of intellectually gifted children, defined as those who achieve a Full Scale IQ score at least
proportionately representative and ethnically diverse sample of gifted children from the population of
children identified as potentially gifted.
Subjects
Each child in this study was identified as potentially gifted based on achievement test data,teacher evaluation (Appendix A) and recommendation, and a social case study analysis (Appendices B
and C). The social case study analysis included an assessment of 6 areas of potential risk for achievement
and expression of full potential: 1) cultural, 2) economic, 3) emotional, 4) environmental, 5) health, and
6) language. Cultural risk included cultural values and beliefs that differ from the those of thedominant
culture, or limited experience in the dominant culture. Economic risk included parental unemployment
or household income low enough to qualify the child for the free lunch program. Emotional risk
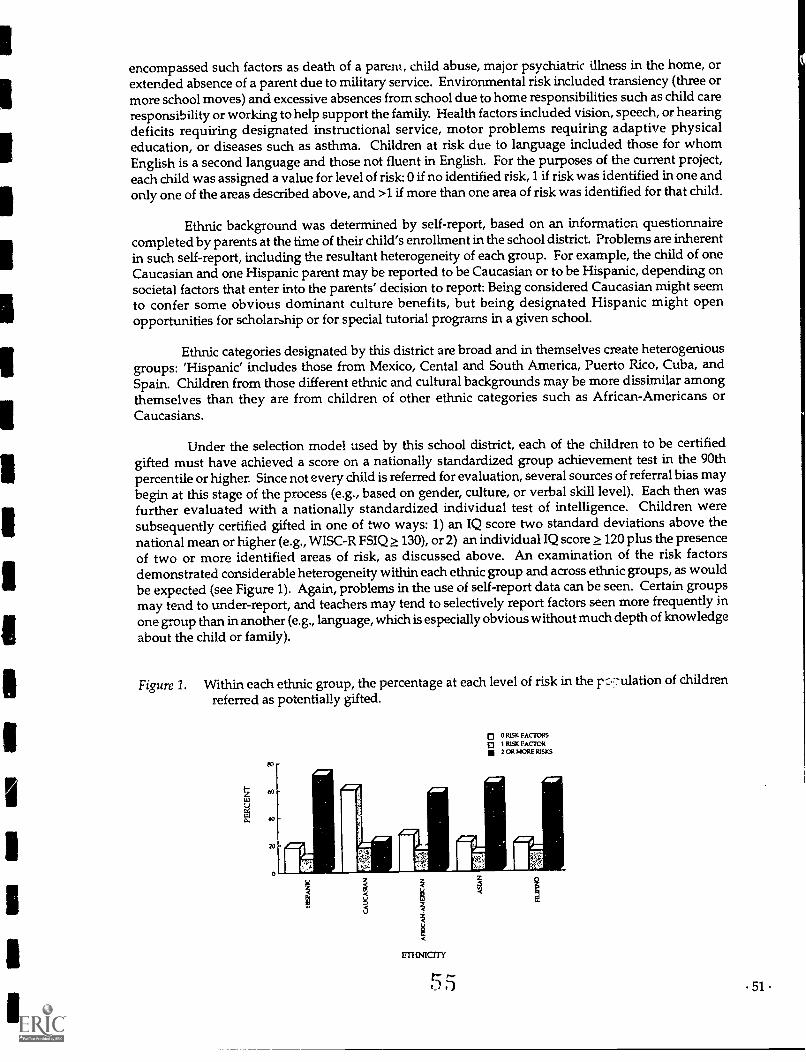
encompassed such factors as death of a parent, child abuse, major psychiatric illness in the home, orextended absence of a parent due to military service. Environmental risk included transiency (three ormore school moves) and excessive absences fromschool due to home responsibilities such as child careresponsibility or working to help support the family. Health factors included vision, speech, or hearingdeficits requiring designated instructional service, motor problems requiring adaptive physicaleducation, or diseases such as asthma. Children at risk due to language included those for whomEnglish is a second language and those not fluent in English. For the purposes of the current project,each child was assigned a value for level of risk: 0 if no identified risk, 1 if risk was identified in one andonly one of the areas described above, and >1 if more than one area of risk was identified for that child.
Ethnic background was determined by self-report, based on an information questionnairecompleted by parents at the time of their child's enrollment in the school district. Problems are inherentin such self-report, including the resultant heterogeneity of each group. For example, the child of oneCaucasian and one Hispanic parent may be reported to be Caucasian or to be Hispanic, depending onsocietal factors that enter into the parents' decision to report: Being considered Caucasian might seemto confer some obvious dominant culture benefits, but being designated Hispanic might openopportunities for scholarbhip or for special tutorial programs in a given school.
Ethnic categories designated by this district are broad and in themselves create heterogeniousgroups: 'Hispanic' includes those from Mexico, Cental and South America, Puerto Rico, Cuba, andSpain. Children from those different ethnic and cultural backgrounds may be more dissimilar amongthemselves than they are from children of other ethnic categories such as African-Americans orCaucasians.
Under the selection model used by this school district, each of the children to be certifiedgifted must have achieved a score on a nationally standardized group achievement test in the 90thpercentile or higher. Since not every child is referred for evaluation, several sources of referralbias maybegin at this stage of the process (e.g., based on gender, culture, or verbal skill level). Each then wasfurther evaluated with a nationally standardized individual test of intelligence. Children weresubsequently certified gifted in one of two ways: 1) an IQ score two standard deviations above thenational mean or higher (e.g., WISC-R FSIQ > 130), or 2) an individual IQ score > 120 plus the presenceof two or more identified areas of risk, as discussed above. An examination of the risk factorsdemonstrated considerable heterogeneity within each ethnic group and across ethnic groups, aswouldbe expected (see Figure 1). Again, problems in the use of self-report data can be seen. Certain groupsmay tend to under-report, and teachers may tend to selectively report factors seen more frequently inone group than in another (e.g., language, which is especially obvious without much depth of knowledgeabout the child or family).
Figure 1. Within each ethnic group, the percentage at each level of risk in the p.-:,f7u1ation of children
referred as potentially gifted.
o 0 RISK FACTORS
Ei 1 RISK FACTOR2 OR MORE RISKS
55 51
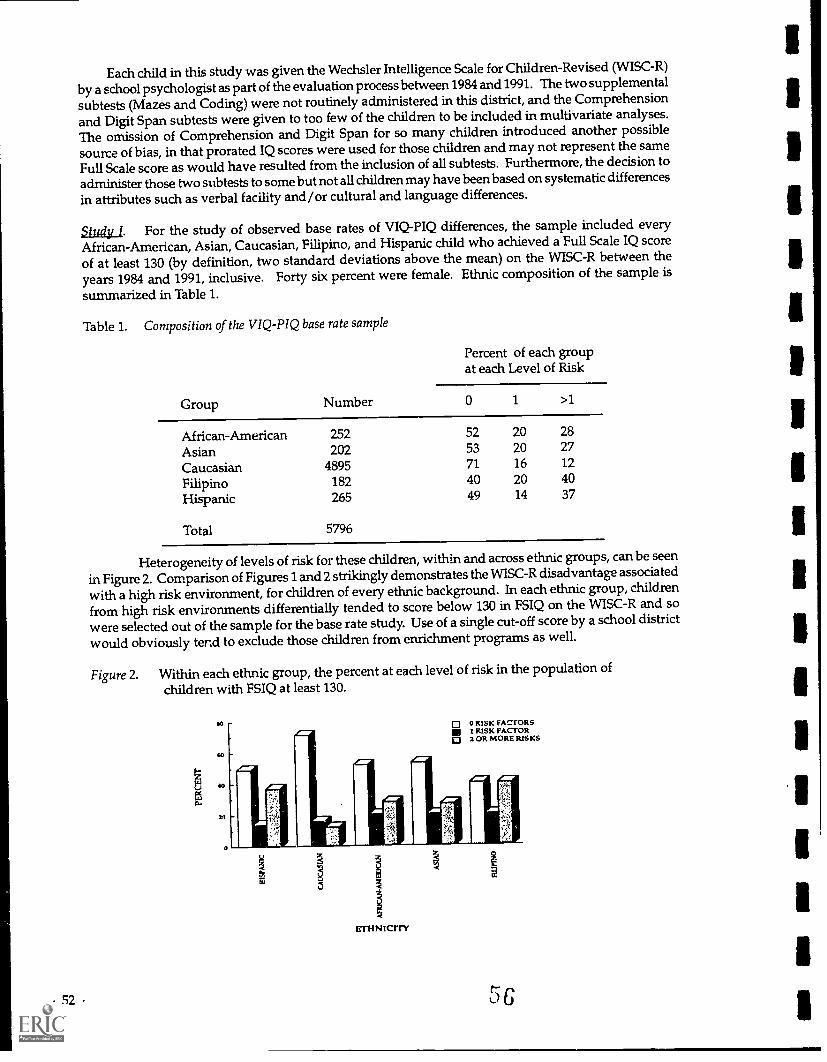
52
Each child in this study was given the WechslerIntelligence Scale for Children-Revised (WISC-R)by a school psychologist as part of the evaluation processbetween 1984 and 1991. The two supplemental
subtests (Mazes and Coding) were not routinely administered in this district, and the Comprehensionand Digit Span subtests were given to too few of the children to be included in multivariate analyses.The omission of Comprehension and Digit Span for so many children introduced another possiblesource of bias, in that prorated IQ scores were used for those children and may not represent the sameFull Scale score as would have resulted from the inclusion of all subtests. Furthermore, the decision toadminister those two subtests to some but not all children may have been based on systematic differences
in attributes such as verbal facility and /or cultural and language differences.
Study 1. For the study of observed base rates of VIQ-PIQ differences, the sample included everyAfrican-American, Asian, Caucasian, Filipino, and Hispanic child who achieved a Full Scale IQ score
of at least 130 (by definition, two standard deviations above the mean) on the WISC-R between the
years 1984 and 1991, inclusive. Forty six percent were female. Ethnic composition of the sample is
summarized in Table 1.
Table 1. Composition of the V1Q-PIQ base rate sample
Percent of each groupat each Level of Risk
Group Number 0 1 >1
African-American 252 52 20 28
Asian 202 53 20 27
Caucasian 4895 71 16 12
Filipino 182 40 20 40
Hispanic 265 49 14 37
Total 5796
Heterogeneity of levels of risk for these children, withinand across ethnic groups, can be seen
in Figure 2. Comparison of Figures 1 and 2 strikingly demonstrates the WISC-R disadvantage associated
with a high risk environment, for children of every ethnic background. In each ethnic group, childrenfrom high risk environments differentially tended to score below 130 in FSIQ on the WISC-R and so
were selected out of the sample for the base rate study. Use of a single cut-off score by a school district
would obviously tend to exclude those children from enrichment programs as well.
Figure 2. Within each ethnic group, the percent at each level of risk in the population ofchildren with FSIQ at least 130.
El 0 RISK FACTORSI RISK FACTOR2 OR MORE RISKS
ETHNICITY
t-
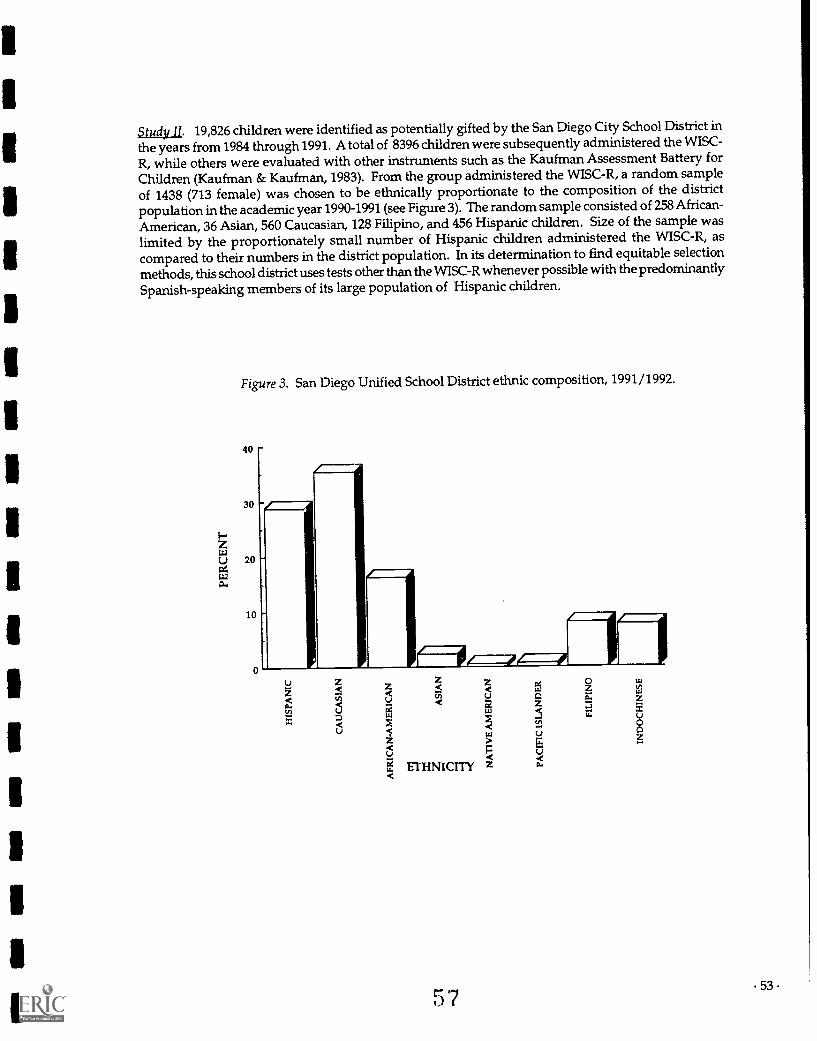
Study II. 19,826 children were identified as potentially gifted by the San Diego City School District inthe years from 1984 through 1991. A total of 8396 children were subsequently administered the WISC-R, while others were evaluated with other instruments such as the Kaufman Assessment Battery forChildren (Kaufman & Kaufman, 1983). From the group administered the WISC-R, a random sampleof 1438 (713 female) was chosen to be ethnically proportionate to the composition of the districtpopulation in the academic year 1990-1991 (see Figure 3). The random sample consisted of 258 African-
American, 36 Asian, 560 Caucasian, 128 Filipino, and 456 Hispanic children. Size of the sample waslimited by the proportionately small number of Hispanic children administered the WISC-R, ascompared to their numbers in the district population. In its determination to find equitable selectionmethods, this school district uses tests other than the WISC-R wheneverpossible with the predominantlySpanish-speaking members of its large population of Hispanic children.
Figure 3. San Diego Unified School District ethnic composition, 1991 /1992.
40
30
LJ 20Cd'La
10
t'
ETHNICITY z
5 7
0
53
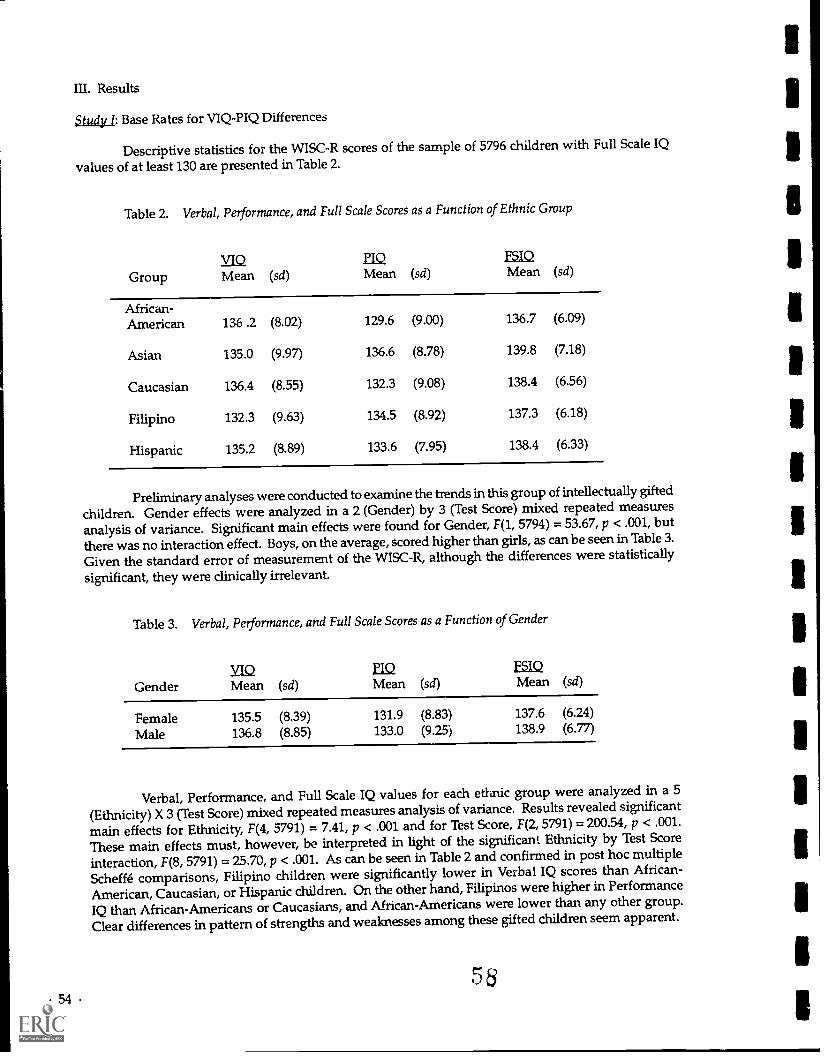
54
III. Results
5tudy I: Base Rates for VIQ-PIQ Differences
Descriptive statistics for the WISC-R scores of the sample of 5796 children with Full Scale IQ
values of at least 130 are presented in Table 2.
Table 2. Verbal, Performance, and Full Scale Scores as a Function of Ethnic Group
VIQ PIO ESIS2
Group Mean (sd) Mean (sd) Mean (sd)
African-American 136 .2 (8.02) 129.6 (9.00) 136.7 (6.09)
Asian 135.0 (9.97) 136.6 (8.78) 139.8 (7.18)
Caucasian 136.4 (8.55) 132.3 (9.08) 138.4 (6.56)
Filipino 132.3 (9.63) 134.5 (8.92) 137.3 (6.18)
Hispanic 135.2 (8.89) 133.6 (7.95) 138.4 (6.33)
Preliminary analyses were conducted to examine the trends in this group of intellectually gifted
children. Gender effects were analyzed in a 2 (Gender) by 3 (Test Score) mixed repeated measuresanalysis of variance. Significant main effects were found for Gender, F(1, 5794) = 53.67, p < .001, but
there was no interaction effect. Boys, on the average, scored higher than girls, as can be seen in Table 3.
Given the standard error of measurement of the WISC-R, although the differences were statisticallysignificant, they were clinically irrelevant.
Table 3. Verbal, Performance, and Full Scale Scores as a Function of Gender
GenderVIO PIO FSIOMean (sd) Mean (sd) Mean (sd)
Female 135.5 (8.39) 131.9 (8.83) 137.6 (6.24)
Male 136.8 (8.85) 133.0 (9.25) 138.9 (6.77)
Verbal, Performance, and Full Scale IQ values for each ethnic group were analyzed in a 5
(Ethnicity) X 3 (Test Score) mixed repeated measures analysis of variance. Results revealed significant
main effects for Ethnicity, F(4, 5791) = 7.41, p < .001 and for Test Score, F(2, 5791) = 200.54, p < .001.
These main effects must, however, be interpreted in light of the significant Ethnicity by Test Score
interaction, F(8, 5791) = 25.70, p < .001. As can be seen in Table 2 and confirmed in post hoc multiple
Scheffé comparisons, Filipino children were significantly lower in Verbal IQ scores than African-
American, Caucasian, or Hispanic children. On the other hand, Filipinos were higher in Performance
IQ than African-Americans or Caucasians, and African-Americans were lower than any other group.
Clear differences in pattern of strengths and weaknesses among these gifted children seem apparent.
58

To investigate the possibility that observed ethnic group differences in Verbal IQ scores couldbe due primarily to differences in risk status, a oneway analysis of covariance was performed withlevel of risk as the covariate. Results indicated that level of risk was a nonsignificant covariate, and thatethnic status remained a significant effect, F(4,5790) = 11.50, p < .001, regardless of risk.
In a series of oneway analyses of variance, level of identified risk was found to have a significanteffect only on Verbal IQ scores, F(2, 5793) = 9.46, p < .001, but not on Performance or Full Scale IQscores. Post hoc Scheffé comparisons revealed that those with one and only one identified area of riskobtained Verbal scores significantly higher than those with no risk, whose scores were higher thanthose with more than one risk area (see Figure 4).
Figure 4. WISC-R scores as a function of level of risk.
140
138
136
134
132VIQ PIQ
WISC-R SCALE
FSIQ
Thus the presence of multiple areas of risk or hardship in a gifted child's environment appears to be
associated with lower performance on l he Verbal Scale of the Wechsler, while the presence of oneunspecified risk factor alone does not.
In an effort to understand the finding that children with one and only one risk had highermean VIQ than those at no risk, a series of hypotheses was tested. The first hypothesis was that,
among children with a single identified risk, either ethnic groups with higher mean VIQ (i.e., Asians
and Caucasians) or males (who had higher VIQ than females) were disproportionately highlyrepresented. A oneway analysis of variance compared VIQ in the two levels of risk, with ethnic groupmembership and gender as covariates. Ethnicity was a significant covariate, F(1,4892) = 9.39, p < .01, as
was gender, F(1, 4892) = 27.45,p < .001. Risk level, however, remained a significant main effect, F(1,4892)
= 6.87, p < .01. Therefore, the VIQ differences across level of risk did not appear to be a simple function
of ethnicity or gender alone. In fact, a 2 (Risk Level) X 2 (Gender) X 5 (Ethnicity) ANOVAdemonstrated
significant main effects for Level of Risk, F(1,4876) = 7.27, p < .01, Gender, F(1,4876) = 27.78, p < .001, and
Ethnicity, F(1,4876) = 6.43, p < .001. None of the interaction effects were significant. Since neither
gender nor ethnic background accounted for the differences in VIQ across risk, an alternative hypothesis
that type of risk accounted for the higher mean in one-risk children was investigated in a onewayanalysis of covariance with type of risk as the covariate. Type of risk was a significant covariate,
F(1,4893) = 9.24, p < .01. When the variance accounted for by type of risk was removed, level of risk
was no longer a significant effect. To further elucidate this finding, frequencies of ethnic background
and gender across type of risk were examined in children with only one area of risk. Mostfrequent was
55 .

emotional risk (30.5% of the total), followed by health (26.1% of the total) and environmental (19.0% of
the total). The presence of cultural, economic, or language hardship alone was relatively rare (2.2%,10.1%, and 11.7%, respectively). Within the group at emotional risk, 89.8% of the children were Asian
and Caucasian; 53.0% were male. Among those at health risk, 96.0% were Asian and Caucasian; 64.9%
were male. In the environmental risk group, 89.1% were Asian and Caucasian; 56.8% were male. Type
of risk appears to be a mediator for ethnicity and for ;ender, and the higher mean VIQ scores in children
with only one risk area appear to be explainable in terms of a higher proportion of males and of Asians
and Caucasians (all associated with higher mean VIQ) in the group of children identified with onlyemotional, health, or environmental risk than in the overall sample.
Base rates for the difference between Verbal and Performance IQ score were obtained and are
summarized in Tables 4 through 8. Ranges were defined to be consistent with those of Matarazzo and
Herman (1984), so that comparisons with their findings could be made.
Table 4. African-Americans: Cumulative Percentage Distribuqons of the Difference
Between WISC-R VIQ and PIQ
Size of theDifferenceBetweenVIQ and PIQ
%V>P(+ Difference)
%P>V(-Difference)
Sum of WISC-R+ and -
DifferencesCumulativePercentage
30 and above 3.97 0 3.97 100.00
26-29 3.57 0 3.57 96.03
22-25 5.56 1.98 7.54 92.46
19-21 5.16 .79 5.95 84.92
16-18 8.33 1.19 9.52 78.97
13-15 6.35 1.19 7.54 69.45
10-12 5.56 3.17 8.73 61.91
7-9 9.92 4.37 14.29 53.18
4-6 6.75 7.94 14.69 38.89
1-3 11.11 9.92 21.03 24.20
0 - 3.17
Table 5. Asians: Cumulative Percentage Distributions of the Difference Between WISC-R
VIQ and PIQ
Size of theDifferenceBetween %V>PVIQ and PIQ (+ Difference)
%P>V(-Difference)
Sum of WISC-R+ and -
DifferencesCumulativePercentage
30 and above 0 .99 .99 100.00
26-29 .99 1.49 2.48 99.05
22-25 2.48 3.96 6.44 96.57
19-21 2.48 2.97 5.45 90.13
16-18 3.47 4.95 8.42 84.68
13-15 4.46 4.46 8.92 76.26
10-12 5.94 7.43 13.37 67.34
7-9 5.94 10.40 16.34 53.97
4-6 9.9 8.91 18.31 37.63
1-3 8.91 6.44 15.35 18.82
03.47
Table 6. Caucasians: Cumulative Percentage Distributions of the DifferenceBetween WISC-R VIQ and PIQ
Size of theDifference Sum of WISC-R
Between %V>P %P>V + and - Cumulative
VIQ and PIQ (+ Difference) (-Difference) Differences Percentage
30 and above 2.35 .16 2.51 100.00
26-29 2.25 .57 2.82 97.51
22-25 3.49 1.41 4.90 94.69
19-21 5.05 1.53 6.58 89.79
16-18 5.99 2.49 8.48 83.21
13-15 6.07 2.80 8.87 74.73
10-12 8.09 5.03 13.12 65.86
7-9 8.83 5.78 14.61 52.74
4-6 8.95 7.84 16.79 38.13
1-3 9.85 8.34 18.19 21.34
0 - - 3.15
Table 7. Filipinos: Cumulative Percentage Distributions of the Difference Between
WISC-R VIQ and PIQ
Size of theDifferenceBetween %V>PVIQ and PIQ (+ Difference)
%P>V(-Difference)
Sum of WISC-R+ and -
DifferencesCumulativePercentage
30 and above 1.65 1.65 3.30 100.00
26-29 0 1.65 1.65 96.70
22-25 2.20 5.49 7.69 95.06
19-21 3.85 3.85 7.70 87.37
16-18 2.75 9.89 12.64 79.67
13-15 5.49 6.04 11.53 67.03
10-12 5.49 3.85 9.34 55.50
7-9 4.40 5.49 9.89 46.16
4-6 11.00 9.34 20.34 36.27
1-3 6.04 6.59 12.63 15.93
0 - - 3.30

58
Table 8. Latinos/Hispanics: Cumulative Percentage Distributions of the Difference
Between WISC-R VIQ and PIQ
Size of theDifference Sum of WISC-R
Between %V>P %P>V + and - Cumulative
VIQ and PIQ (+ Difference) (-Difference) Differences Percentage
30 and above 1.13 1.13 2.26 100.00
26-29 .75 0 0.75 97.72
22-25 2.64 .75 3.39 96.97
19-21 2.26 1.89 4.15 93.58
16-18 6.04 2.64 8.68 89.43
13-15 4.53 4.15 8.68 80.75
10-12 6.04 7.92 13.96 72.07
7-9 9.43 5.28 14.71 58.11
4-6 10.57 10.57 21.14 43.40
1-3 9.81 10.19 20.00 22.26
0 2.26
Inspection of these tables suggests striking differences between ethnic groups. To examine
those differences, the VIQ - PIQ frequency distributionfor each ethnic group was compared to a reference
distribution using a Chi Square test with 20 degrees of freedom. The reference distribution chosen was
that of the standardization sample for the Wechsler Adult Intelligence Scale-Revised, reported by
Matarazzo and Herman (1984), since those authors reported direction as well as magnitude of the VIQ-
PIQ difference. Hispanics and Mians were not found to differ from the WAIS-R standardizationsample.
African-Americans, x2(20, N = 252) = 196.9, p<.001, Caucasians, x2(20, N = 4895) = 1382.6, p<.001, and
Filipinos, x2(20, N = 182) = 90.7, p<.001, did differ significantly from the reference distribution. The
nature of those distributions is shown in Figure 5.
6 2
MI NM In NM MINISMIN MI-11111 OIMMINI
C.4.)
PROPORTION
ig igi .i g g 12ti 12gi 30 Or Cot.
-30 or loos r-r----------_____, -26 to 29
-25 to 29 I -22 to -26
-22 to -25 I -ID to -21
-III to -21 7 -16 to -IS
-141 to 111 I 13 to -15
.13 to -IS I I0 to -12-10 to I2 I
-7 to -9
7 to -9
04,0 ..,
I 4 to ft
4 to 1 7 to 07 to J ,c, to 12
10 to 12 Ii to IS13 to IS
13 to 15 I 21
t6 to IS19 to 21
I 0. 19 lo 21
1 22 to 2522 to 26 3 26 to 2026 to 29 30 or more
30 or more
PROPORTION
rl ri ; til g 12S
0iG
-30 or toss-26 to -30 I
-33 to -25 I-10 to -21 I
-lb to -16 I
-13 to I5 I-10 to .12 1
7 to -9-6 to -6-1 to 3
t to 34 to
7 to
tO to 1213 to 1516 to IS49 to 21
22 to 2526 to 29
30 or rnOr
a
PROPORTION PROPORTION
,r. . ,r..,..-.
-30 or 1.44 j-26 to -29 3
ri-22 to -26
zI
-19 to 21 I TM t6 to -le In 13 to -15 1
I? -10 to -12 I
I-7 to 9 1Ig -4 to -6 I
I.1 to -3 I
I0 I to 3 I
Ito 6
17 to 9 I
Ito to ti II13 to 15 I
I16 to III II19 to 21 I
1221025 I
I26 to 29 I
J30 or mono I
PROPORTION PROI,ORTION
Ig go2 g g
o PRs'
o8.
at12gr.
I
. Nee30 oe 1.30 or tetto 326 to -29 26 to 20
I1522 to -25 -22 to 2
1110 to -21 19 to -21
18 to -IS 1 .10 to 16 3
I I-13 to -15
I
-13 to -15
I-10 to .12 -10 to -12
-7 to -9 1
-7 to -0 I
g I I
.tt
-4 to -6
11
x=1
1 to -3 I1
4 to 6 I '4 70 36 1
7109 1I
10 to t2 J .7:1:I 1 E13 to 16 13 to
I i 16 to 10 I16 to IS
I CAle to 21 I i §,, to 21
I / Ciri22 to 25 22 to 25
I26 to 29 D 26 to 29
30 ot mono m30 ot ots1
60
Again we see the trend for African-Amer!can and Caucasian children to have higher VIQthanPIQ, while the reverse is true for Filipino children. The previous analyses found the trend in groupmean scores. The Chi Square differences between VIQ and PIQ confirm those findings in individualsand further strengthens the evidence for differences in patterns of strengths and weaknesses acrossethnic background.
Given these differences in distributions between ethnic groups, it becomes crucial to look atpopulation incidence of large VIQ-PIQ discrepancies as a function of ethnic background. Only in thisway can we determine whether an event that is rare in one group, and is taken as a clinical indicator ofabnormality, also holds for other groups. Within each ethnic group, occurrences of magnitudes ofVIQ-PIQ discrepancies were counted so that population rarity could be compared with statisticalsignificance (as presented in the WISC-R manual) for each group. That is, a VIQ-PIQ difference of 12points has been found to be statistically significant at the .05 level. This finding is frequentlymisinterpreted to mean that only about 5% of normal children will have adifference of that magnitude.However, Kaufman (1976) pointed out that approximately 30% of normal children with averageintelligence have discrepancies at least that high, as do 36% of children in the standardization samplewith IQ scores of at least 120. In Table 9, the difference required for statisticalsignificance is comparedto that actually observed in each of the ethnic groups. For example, a difference of 12 points is neededto be sure (within an error probability of .05) that a child's Verbal and Performance abilities aresignificantly different. For the Asian children in this sample, however, a difference of 25 points or moreis needed in order for the difference to be rare enough to be observed only about 5 percent of the time.
Table 9. Empirically Different Magnitudes of VIQ-PIQ Discrepancies, as a Function of Ethnic Group
Magnitude of Magnitude of DifferenceDifference Required Empirically Observed at Each
Statistically* Level of Probability
p value Caucasian Hispanic Afr.Amer. Asian Filipino
.15 8 20 18 22 19 21
.10 10 23 19 25 22 23
.05 12 27 23 29 25 27
.01 15 34 40 35 30 38
* to be reliably different from 0
Considerable variation between groups can be seen in Table 9. Although a VIQ-PIQ difference
of 30 points is rare in the gifted Asian population of our sample (occurring only about once in every one
hundred children), 5 in every one hundred African-American children are observed to have thatdifference, and even more children in each of the other three groups. One cart easily imagine a scenario
in which, for example, norms are set using a predominantly Asian population, rare (less than 5% of the
population) VIQ-PIQ differences are defined to be a diagnostic indicator for learning disabilities, and
that standard is used for all children. In this particular gifted sample, such a criterion could lead to
labelling twice as many Caucasian, Filipino, andAfrican-American children as Asian or Hispanic learning
disabled. The scenario is admittedly an exaggerated one and it is to be hoped that in actual practice
one single test is never the sole criterion for diagnostic or placement decisions.
6 4
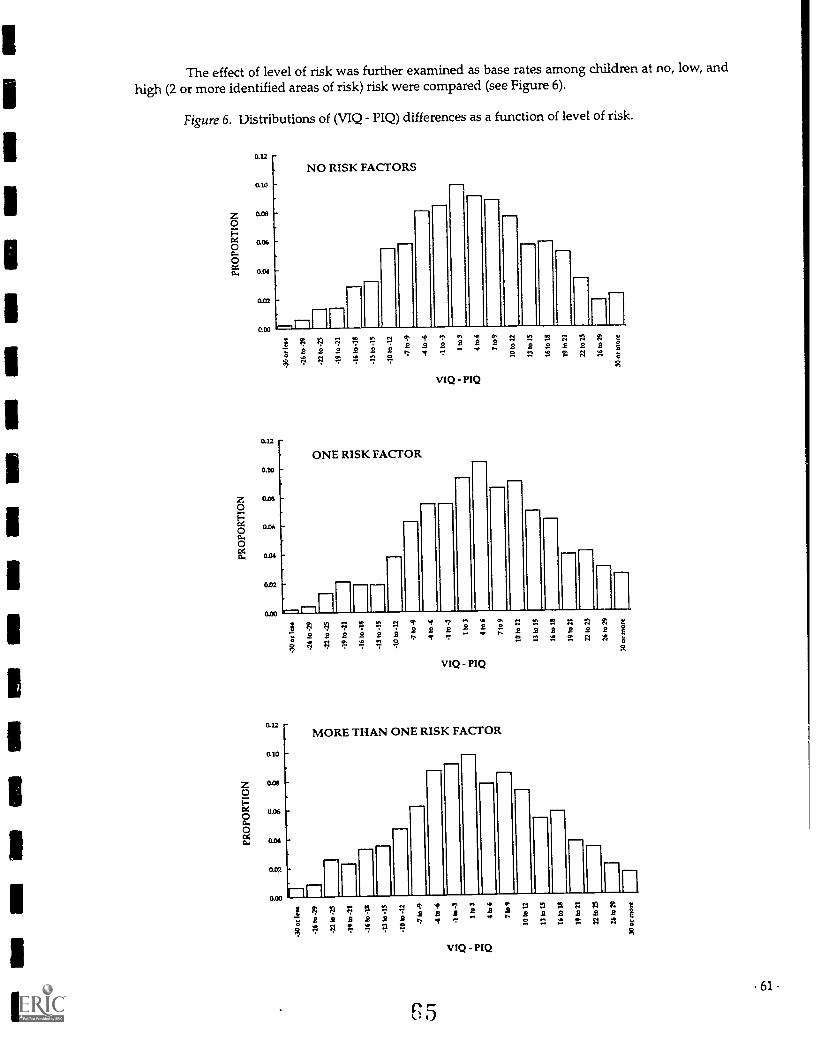
The effect of level of risk was further examined as base rates among children at no, low, andhigh (2 or more identified areas of risk) risk were compared (see Figure 6).
Figure 6. Distributions of (VIQ PIQ) differences as a function of level of risk.
0.12
0.10
0.1.2
0.10
0.06
0.06
0.04
002
0.00
012
0.10
0.08
0.04
0.02
NO RISK FACTORS
F-1
P.A A E
2 2 2 z 2 2 2922224 4 4
ONE RISK FACTOR
192 24 4
2
VIQ - PIQ
VIQ - PIQ
:2
MORE THAN ONE RISK FACTOR
n"i 2 25.t
Fin; 0 "" A t t
4 4 4
VIQ - PIQ
61

62
Distributions were statistically compared using Kohnogorov-Smirnov 2-sample tests. Childrenwith no identified risk differed from those with one risk (Z = 1.526, p < .05), and children with only onerisk differed from those with more than one risk (Z = 1.951, p < .001). As can be seen in the figure,children from high risk backgrounds more frequently tended to have higher PIQ than VIQ. This comes
as no surprise, in light of findings from group means that children at high risk have lower mean VIQ.
Each of these children achieved a Full Scale IQ of at least 130. In order to accomplish that in the face of
a disadvantaged VIQ, PIQ must be evenhigher than for those at no risk. Again, we see differences inpattern across groups.
Finally, subsamples of this demonstratedly gifted sample wereselected so that rates of VIQ-PIQ differences could be compared in gifted high and low achievers. For this purpose, scores on theCalifornia Test of Basic Skills (CTBS) were obtained. Two subsamples were selected; 96 children whose
CTBS scores were all at a stanine of 9 were designated "high achievers", and 108 children whose CTBSscores were all at a stanine of 6 or below were called "low achievers". Single classification ANOVAsrevealed that the groups did not significantly differ in PIQ; for high achievers, M = 132.2 (SD=9.7),while for low achievers M=130.6 (SD=9.1). Low achievers were, however, significantly different fromhigh achievers in VIQ, F(1,203) = 13.49; p < .001. Group means were 137.8 (SD=8.5) and 133.4 (SD=7.8).
respectively.
Figure 7. Distribution of VIQ-PIQ differences at the extremes of achievement.
2222 2 2 2 2 2 2 2 2 6
;VIQ
HIGH ACHIEVERS
VIQ ?IQ
VIQ - PIQ distributions for the two groups are shown in Figure 7. No sigrtificant differences
were found between the two distributions (Kolmogorov-Smirnov Z = 1.007, p =.263). This implies that
use of large VIQ-PIQ discrepancy as an indicator of risk for low achievement is indeed fallacious, since
relatively large VIQ-PIQ discrepancies are as likely to be seen in high achievers as in low achievers.
66

Study II: Multivariate attempts to use the WISC-R to select an ethnically balanced gifted population.
An ethnically balanced random sample of 1438 children identified as potentially gifted wasgenerated. Mean scores on the eight subtests of the WISC-R routinely administered in the district are
summarized in Table 10.
Table 10WISC-R Scores in a Randomly Balanced Sample ofChildren Identified Potentially Gifted
ScoreEntire
SampleAfrican-
American127.0(11.9)
Asian134.8(10.2)
Caucasian133.1(10.0)
Filipino128.5(11.4)
Hispanic129.8(11.8)
FSIQ 130.6*(11.3)**
VIQ 129.1 127.5 129.8 132.0 124.1 127.8
(12.1) (12.1) (12.4) (11.0) (12.5) (12.5)
PIQ 125.6 120.4 132.8 127.1 127.2 125.6
(12.3) (12.8) (11.6) (11.4) (12.3) (12.3)
Information 13.5 12.9 14.1 14.1 12.9 13.3
(2.5) (2.4) (3.1) (2.4) (2.4) (2.6)
Similarities 15.8 15.7 15.2 16.2 14.8 15.8
(2.4) (2.5) (2.5) (2.2) (2.7) (2.4)
Arithmetic 13.9 13.5 14.4 14.3 13.6 13.8
(2.4) (2.4) (2.3) (2.3) (2.3) (2.4)
Vocabulary 14.7 14.6 14.9 15.2 13.8 14.2
(2.6) (2.5) (2.6) (2.4) (2.8) (2.7)
Picture 13.2 12.7 13.5 13.3 13.0 13.4
Completion (2.4) (2.3) (2.2) (2.4) (2.4) (2.4)
Picture 14.0 13.3 14.5 14.2 14.0 14.1
Arrangement (2.7) (2.7) (2.7) (2.7) (3.0) (2.7)
Block 14.0 12.7 16.2 14.4 14.7 13.8
Design (3.0) (3.0) (2.8) (2.8) (2.7) (2.9)
Object 13.3 12.4 13.8 13.6 13.3 13.3
Assembly (2.8) (2.9) (2.8) (2.6) (2.9) (2.7)
* Mean** Standard Deviation
Inspection of Table 10 reveals the problem experienced by any diverse school district in its
efforts to provide equal access to gifted programs based primarily on Full Scale IQ as measured by the
WISC-R. As has happened in San Diego City Schools, Caucasians and Asians will be over-represented,
while Hispanics and African-Americans will be under-represented. Assuming that the WISC-R does
indeed predict academic achievement and that an ethnic balance in gifted programs is a desirable and
in fact necessary goal, each ethnic subsample was divided on the basis of FSIQ: the upper 70% of each
group was designated "gifted" for the purposes of the following analyses, and the lower 30% of each
was designated "nongifted". Those percentages were estimated based on theoverall number of children
referred for individual testing versus the 70% finally selected for inclusion in gifted enrichment
classrooms.Stepwise multiple linear regression analyses werecarried out on the scaled scores of the whole
sample, as well as each ethnic subsample, in order to determine which subtests of the WISC-R best
predict giftedness for each group. Results are summarized in Table 11.
63
7

64
Table 11. Stepwise Multiple Linear Regression Models to Predict Giftedness
Sample Subtests in the Model f R R2
Entire Sample VocabularyObject AssemblyPicture CompletionSimilaritiesBlock DesignPicture ArrangementArithmeticInformation
.156.172.153.167.150.144.105.101 .696 .485
African-Americans Information .180
Object Assembly .189
Similarities .163
Block Design .150Picture Arrangement .140
Arithmetic .131
Vocabu lary .114 .659 .483
Asians Information .457Block Design .357 .604 .365
Caucasians Object Assembly .236
Vocabulary .181
Picture Completion .183
Arithmetic .159Block Design .172
Similarities .157Picture Arrangement .120
Information .112 .753 .567
Filipinos Picture Arrangement .291
Picture Completion .271
Block Design .284
Similarities .274 .699 .489
Hispanics Similarities .226
Object Assembly .168
Information .154
Picture Completion .151
Picture Arrangement .154
Vocabulary .161
Block Design .131 .735 .533
For each group except Asians, the best stepwise selection model was able to account for
approximately 50% of the variance or more: forAsians, R2 was only .36. Variables in the model differed
across ethnic groups, as well. For Caucasians, as for the sample as a whole, all subtests entered into the
equation. For Hispanics, only Arithmetic failed to enter, while for African-Americans the Picture
Completion subtest did not enter the model. The best-fitting model for Filipinos included Picture
Arrangement, Picture Completion, Block Design, and Similarities. Only two subtests were include in
the model for Asians: Information and Block Design. Again we see differences in pattern of strengths
and weaknesses, reflected in different predictors of giftedness across ethnic background.
68

To determine the efficacy of the best predictive model, discriminant analysis was performedfor the entire sample using all subtests as predictors and giftedness as the criterion. With two groups(gifted and non-gifted), one discriminant factor was generated. Results are summarized in Table 12.
Table 12. Discriminant Function Coefficients for the Identification of Giftedness in the EntireEthnically Balanced Sample
Standardized CoefficientsPooled Correlations Between Subtests
and the Discriminant Function
Information .252 Similarities .566
Similarities .376 Vocabulary .555
Arithmetic .111 Information .549
Vocabulary .265 Object Assembly .461
Picture Completion .270 Block Design .437
Picture Arrangement .273 Picture Completion .424
Block Design .225 Picture Arrangement .412
Object Assembly .298 Arithmetic .347
False positives, false negatives, and hit rates, in percentages, areprovided for the whole sampleand for each ethnic group within that sample in Table 13.
Table 13. Hit Rates, False Positives, and False Negatives for the Best Overall Model
False False
Group Hit Rate Positives* Negatives**
Entire Sample 89.3 7.5 19.9
African-Americans 81.7 0 23.6
Asians 93.9 33.3 0
Caucasians 87.9 42.9 .5
Filipinos 89.6 3.6 12.4
Hispanics 95.0 4.2 5.3
* of those who were not gifted, the percent called "gifted"** of those who were gifted, the percent called "nongifted" by the model
The most critical errors are represented in the "false negatives" column of the table. Thosenumbers represent children who have unusually high potential that would not be recognized. Thosechildren would be denied a chance to excel in special programsfor the intellectually gifted. When weexamine false positive and negative rates for subgr-Jups, we see the repetitive pattern of over-selectionof Caucasians and Asians accompanied by the under-selection of African-Americans. The one group
for whom this model is an improvement is Hispanics. Thus we demonstrate that no one single modelusing the WISC-R, no matter how sophisticated and complex, will select an ethnically proportionatesample for inclusion into enrichment programs for the gifted.
%. 9 65

The efficacy of individual models of selection, based on ethnic background, was investigatedby performing discriminant analyses on each ethnic subsample, using all available subtests of theWISC-R as predictors and giftedness as the criterion. Results are summarized in Tables 14 through 18.
Table 14. African-Americans: Discriminant Function Coefficients for the Identification of Giftedness
Standardized CoefficientsPooled Correlations Between Subtests
and the Discriminant Function
Information .298 Information .573
Similarities .287 Object Assembly .549
Arithmetic .216 Arithmetic .522
Vocabulary .195 Similarities .517
Picture Completion .132 Block Design .512
Picture Arrangement .254 Vocabulary .500
Block Design .267 Picture Arrangement .455
Object Assembly .310 Picture Completion .364
Eigenvalue .9512 Wilks' Lambda .513
Table 15. Asians: Discriminant Function Coefficients for the Identification of Giftedness
Pooled Correlations Between SubtestsStandardized Coefficients and the Discriminant Function
Information .513 Information .648
Similarities .011 Vocabulary .579
Arithmetic .174 Arithmetic .554
Vocabulary .247 Picture Completion .502
Picture Completion .213 Block Design .500
Picture Arrangement .268 Similarities .379
Block Design .556 Object Assembly .311
Object Assembly -.055 Picture Arrangement .209
Eigenvalue .746 Wilks' Lambda .573
Table 16. Caucasians: Discriminant Function Coefficients for the Identification of Giftedness
Standardized Coefficients
Pooled Correlations Between Subtestsand the Discriminant Function
Information .202 Object Assembly .480
Similarities .289 Vocabulary .453
Arithmetic .294 Information .436
Vocabulary .324 Block Design .419
Picture Completion .337 Picture Completion .392
Picture Arrangement .227 Similarities .392
Block Design .313 Arithmetic .386
Object Assembly .417 Picture Arrangement .331
Eigenvalue 1.310 Wilks' Lambda .433
66 70

Table 17 . Filipinos: Discrirninant Function Coefficients for the Identification of Giftedness
Pooled Correlations Between SubtestsStandardized Coefficients and the Discriminant Function
Information .003 Picture Arrangement .507
Similarities .321 Vocabulary .486
Arithmetic .172 Similarities .471
Vocabulary .199 Block Design .468
Picture Completion .419 Object Assembly .427
Picture Arrangement .435 Picture Completion .424
Block Design .413 Information .376
Object Assembly .230 Arithmetic .359
Eigenvalue 1.076 Wilks' Lambda .482
Table 18. Hispanics: Discriminant Function Coefficients for the Identification of Giftedness
Pooled Correlations Between SubtestsStandardized Coefficients and the Discriminant Function
Information .252 Similarities .566
Similarities .376 Vocabulary .555
Arithmetic .111 Information .549
Vocabulary .265 Object Assembly .461
Picture Completion .270 Block Design .437
Picture Arnagement .273 Picture Completion .424
Block I-1:sign .225 Picture Arrangement .412
Obje..c Assembly .298 Arithmetic .347
Eigenvalue 1.191 Wilks' Lambda .456
Hit rates, false positive and false negative rates for the use of these individual functions aresummarized in Table 19.
Table 19. Hit Rates, False Positives, and False Negatives for the Best Individual Discriminant
Function Models
False False
Model Hit Rate Positives Negatives
African-American 93.6 17.5 3.1
Asian 90.9 16.7 7.4
Caucasian 95.0 12.2 2.3
Filipino 93.6 7.1 6.2
Hispanic 93.8 7.6 5.6
* of those who were not gifted, the percent called "gifted"** of those who were gifted, the percent called "nongifted" by the model
67
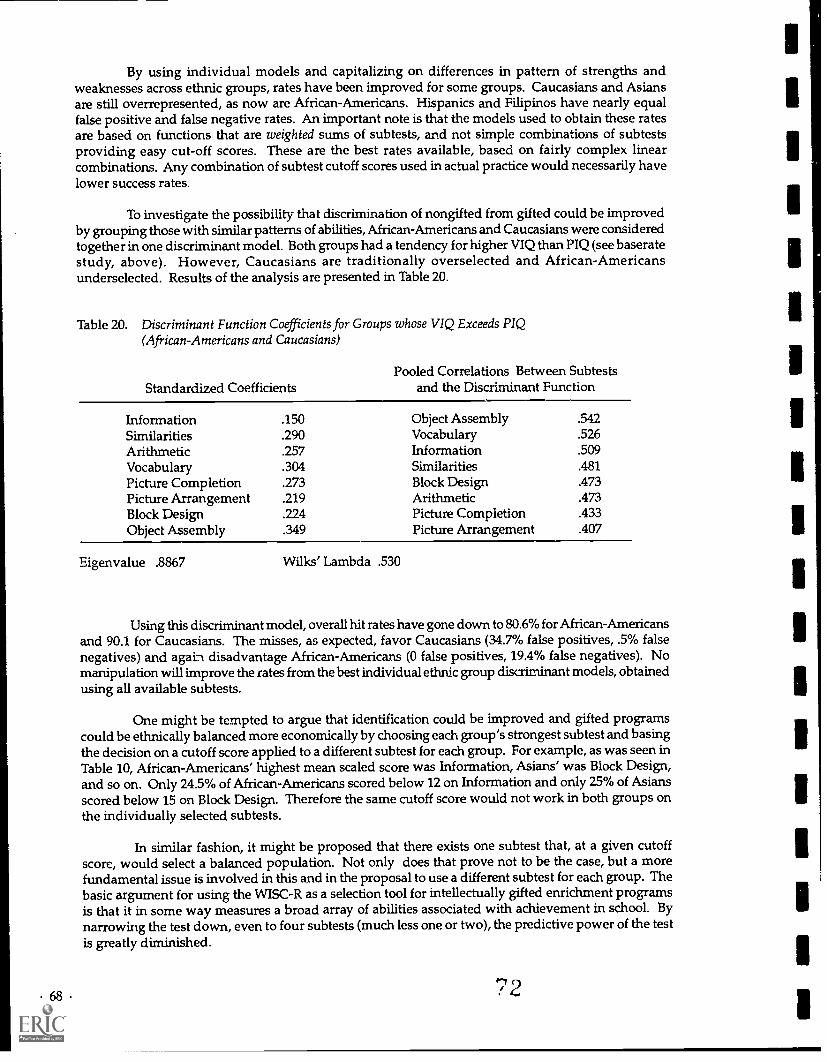
By using individual models and capitalizing on differences in pattern of strengths andweaknesses across ethnic groups, rates have been improved for some groups. Caucasians and Asiansare still overrepresented, as now are African-Americans. Hispanics and Filipinos have nearly equalfalse positive and false negative rates. An important note is that the models used to obtain these ratesare based on functions that are weighted sums of subtests, and not simple combinations of subtestsproviding easy cut-off scores. These are the best rates available, based on fairly complex linearcombinations. Any combination of subtest cutoff scores used in actual practice would necessarily havelower success rates.
To investigate the possibility that discrimination of nongifted from gifted could be improvedby grouping those with similar patterns of abilities, African-Americans and Caucasians were consideredtogether in one discriminant model. Both groups had a tendency for higher VIQ than PIQ (see baseratestudy, above). However, Caucasians are traditionally overselected and African-Americansunderselected. Results of the analysis are presented in Table 20.
Table 20. Discriminant Function Coefficients for Groups whose VIQ Exceeds PIQ(African-Americans and Caucasians)
Standardized CoefficientsPooled Correlations Between Subtests
and the Discriminant Function
Information .150 Object Assembly .542Similarities .290 Vocabulary .526Arithmetic .257 Information .509Vocabulary .304 Similarities .481
Picture Completion .273 Block Design .473Picture Arrangement .219 Arithmetic .473Block Design .224 Picture Completion .433Object Assembly .349 Picture Arrangement .407
Eigenvalue .8867 Wilks' Lambda .530
Using this discriminant model, overall hit rates have gone down to 80.6% for African-Americansand 90.1 for Caucasians. The misses, as expected, favor Caucasians (34.7% false positives, .5% falsenegatives) and agai-A disadvantage African-Americans (0 false positives, 19.4% false negatives). Nomanipulation will improve the rates from the best individual ethnic group discriminant models, obtainedusing all available subtests.
One might be tempted to argue that identification could be improved and gifted programscould be ethnically balanced more economically by choosing each group's strongest subtest and basingthe decision on a cutoff score applied to a different sub test for each group. For example, as was seen inTable 10, African-Americans' highest mean scaled score was Information, Asians' was Block Design,and so on. Only 24.5% of African-Americans scored below 12 on Information and only 25% of Asiansscored below 15 on Block Design. Therefore the same cutoff score would not work in both groups onthe individually selected subtests.
In similar fashion, it might be proposed that there exists one subtest that, at a given cutoffscore, would select a balanced population. Not only does that prove not to be the case, but a morefundamental issue is involved in this arid in the proposal to use a different subtest for each group. Thebasic argument for using the WISC-R as a selection tool for intellectually gifted enrichment programsis that it in some way measures a broad array of abilities associated with achievement in school. Bynarrowing the test down, even to four subtests (much less one or two), the predictive power of the testis greatly diminished.
68 7 2

Thus we see that no single selection model using the WISC-R will result in an ethnicallybalanced sample of gifted children from this population. In fact, the most accurate and mostcomplicated individual models for ethnic subgroups are notuniformly accurate either. There appearsto be no way to use the WISC-R to derive cut-off inclusion/exclusion scores in this ethnically diversesample for use in selecting balanced populations for gifted programs in the schools.
IV Discussion
Intellectually gifted children show differences in the pattern of their strengths and weaknesses
on the WISC-R, across ethnic background and across levels of risk in the environment. In the first
phase of this work, an analysis of base rates of VIQ-PIQ differences in 5796 children with FSIQ scores
at least two standard deviations above the mean (FSIQ > 130) revealed that African-Americans and
Caucasians tended to have a higher VIQ than PIQ whereas in Filipino children the tendency was thereverse. These trends, evident in group data, were confirmed m frequency distributions of individual
difference scores. The distributions of VIQ-PIQ difference scores of Asians and Hispanics most closelyresembled those obtained by Matarrazzo (1984) from the standardization sample for the WAIS-R, and
most closely approximated normal distributions.
Groups divided on the basis of level of risk from factors such as significant health problems,economic hardship, emotional deprivation, or cultural and linguistic factors were also found to differ
in pattern of strengths and weaknesses. Such hardships proved to be consistently associated with
lower VIQ relative to PIQ in the individual. It can be surmised that, of all children at risk from two or
more of these factors, this sample contained only the most invulnerable childrenonly the childrenstill able to achieve a Full Scale score two standard deviations above the meanand that in a randomlyselected population across IQ ranges, the differences would be more extreme. Comparison of therelatively low proportion of high-risk children seen in the gifted base rate sample, as opposed to theentire sample of children referred for giftedness assessment, appears to corroborate that hypothesis
(refer to Figures 1 and 2).
The myth that relatively large VIQ-PIQ discrepancies are somehow a diagnostic indicatorfor learning difficulties, such as low achievement relative to potential, was debunked in this sample.Groups of gifted children at the extremes of achievement (all achievement scores in the ninth stanine
versus all achievement scores in the sixth stanine or lower) were compared and found to have equivalent
ranges of VIQ-PIQ difference scores.
In the second phase of the work, an ethnically proportionately balanced sample of 1438
potentially gifted children was randomly selected. From that sample, selection models were derived
and examined for goodness of fit in an effort to find a way to use the WISC-R to select a balanced
population for educational enrichment programs. Alternative hypotheses that 1) there exists a single
pattern of subtest scores that predicts giftedness equally across ethnic background, or 2) there is a
unique pattern of cognitive strengths and thus different predictors of giftedness across groups, wereinvestigated. The best single model obtained bydiscriminant analysis appeared accurate overall. When
examined in terms of individual ethnic groups, however, it proved to be biased in favor of Caucasians
and Asians, and biased against African-Americans and Filipinos. As was seen in the base rate study,
different patterns of strengths were evident across groups. Even accounting for those differences with
individual best-fitting models, efforts to improve selection balance failed. The very best individual
models overselected African-American, Asian, and Caucasian children. No way was found to use the
WISC-R to select a proportionately baJanced population. If individual subtests or combinations of
two or more subtests are used, as is suggested by some authors (Dirks, Wessels, Quarforth, & Quenon,
1980; Elman, Blixt, & Sawicki, 1981; Karnes & Brown, 1981; Kaufman, 1979; Killian & Hughes, 1978;
Sattler, 1988), discriminability suffers. Perhaps more importantly, predictive power of the WISC-R is
decreased.
T'he present results confirm the findings of differences in pattern of WISC-R performances
between ethnic groups reported by Saccuzzo et al. (1992). Moreover, for the first time, base rates for
69

70
VIQ-PIQ difference scores are presented for a large, ethnically diverse sample of gifted children. Thedistributions of VIQ-PIQ difference scores were found to be substantively different in shape as well asin direction across ethnic groups, in contrast to the report that discrepancy scores "did not vary toogreatly with ... race" at any level of IC in the standardization sample of the WISC-R (Kaufman, 1976).In fact, statistical power was too low for identification of differences had they existed in the higher endof IQ scores in the standardization sample. Also for the first time, high levels of risk in a child's socialand home environment have been shown in the present work to be associated with lower VIQ relativeto PIQ in children in the upper end of the IQ distribution. Moreover, the influence of risk factorsappears to confer a disadvantage over and above any effect of ethnic background.
No model was found to enable the WISC-R to be used to select equal proportions of giftedchildren from a variety of ethnic backgrounds. Therefore, in an ethnically diverse population, it wouldseem that Sattler (1988) is correct in saying that children who are culturally different are difficult toidentify. The results of commonly used identification practices can be seen nationwide in the over-representation of Asians and Caucasians, as well as the under-representation of African-Americansand Hispanics. The results of this study strongly suggest that use of the WISC-R in diversepopulations as the primary selection device for gifted programs is an inappropriate use of the test,if one of the goals of such use is to select proportionately representative numbers from each group.
Uniformity assumption myths abound in psychological assessment. Sattler (1988) presentedcogent arguments in favor of national norms and against the idea of pluralistic norms. He pointed out,in part, that the WISC-R was standardized on a carefully stratified sample with ethnic minoritiesrepresented in proportion to their representation in the population. That is certainly true on a nationallevel, but the appropriateness of using national norms so derived to define cut-off scores in a population
which is predominantly non-Caucasian, as is this school district, is questionable. Normative scores
are derived based on factors known to affect test performance: the WISC-R manual provides only age-corrected norms. The current study has demonstrated that differences in test performance on theWISC-R exist across ethnic background and across gender. In the past, the major psychological andeducational assessment devices have been standardized primarily in terms of age or education, andsometimes gender. More recently, authors have stressed the importance of differences and the need for
sets of norms that consider multiple factors such as gender, age, and education concurrently (Heaton etal., 1986), especially when these scores are used for clinical decision-making. Use of the WISC-R forselection of individual children for enrichment programs is, in essence, a clinical decision-makingprocess. The idea of pluralistic norms based on ethnic background, however, is politically an extremelysensitive issue. Perhaps the clearest conclusion from the findings of the present work is that the test,with existing norms, produces scores that are certainly more appropriate for some groups of children
than for others.
If "intelligence" or "intellectual giftedness" were to be defined as exactly those abilitiesunderlying the quality of an individual's performance on the WISC-R, then we would have to conclude
that the WISC-R is the best instrument to use for selection,regardless of any socio-political considerations
such as the need for ethnic, socioeconomic, or even gender balance. However, we are dealing with atheoretical construct (intelligence) imperfectly measured by the WISC-R within a known error ofmeasurement. This work has demonstrated that groups divided either on ethnic background or onenvironmental factors differ in the pattern of their performances on the WISC-R. The results do notand can not address the issue of how much of the individual and group diffi,ences are a result ofbiologic (presumably neural) differences or of environmental influences. Aside from the social andpolitical implications of the use of the WISC-R as an entry criterion in diverse populations, the resultsof the present work indicate that the basic assumption of uniformity of pattern of performance across
groups on the WISC-R is flawed. For whatever reason, be it biologic, environmental, or a combination
of the two, pattern of performance across groups is not uniform.
Instead of attempting to find a way to continue to use the WISC-R in gifted selection models,
it may behoove educators to adopt the use of multiple test instruments, including a nonverbal instrument
such as Raven's Progressive Matrices (Raven, 1938) plus a measure of verbal reasoning ability as well
as behavioral and motivational indicators. In any case, inclusion/exclusion decisions should never be
7 4

based on a single test score, just as no clinical decision should be solely based on any one score or even
on one test.
The studies reported here are limited by the same factors inherent in any quasi-experimentaldesign as well as by the limitations of archival and cross-sectional research. Attempts weic made tocontrol for gender and to examine ethnic and risk level effects. It should be pointed out, however, thatthe original sample from which subsamples were drawn was not a random, znultivariate normal samplefrom the entire population. Instead, this was a sample of children referred by parents, teachers, andcentral nomination for assessment because each had in some way demonstrated the potential forintellectual giftedness. Almost certainly biases were inherent in that referral process. One of thosebiases can be seen in the unequal proportions of children from different ethnic backgrounds. Anotherconcerns the under-representation of WISC-R scores from Hispanic children who have English as asecond language, and are often tested with other assessment devices.
Self-report questionnaires are a source of error from both under-reporting and over-reporting.Ethnic background was deduced by response of the primary caregiver to a school district questionnaire,and incidence of risk was gathered from information questionnaires provided by teachers and by parents.For example, a child who is 10% Native American may be reported as Native American, while one whois Hispanic/Caucasian may be reported as Caucasian because of beliefs the parents hold about theimplications for their child of certain ethnic designations within the education system. The risk factors
examined in this work are almost certainly an under-representation of population incidence. Those at
risk may have been under-reported both by teachers who have have less contact with particular groupsof parents, and by the parents who are overwhelmed by the same environmental stressors that affecttheir children. It is likely that the more seriously economically and environmentally disadvantagedhave less access to health care and may also mistrust an educational establishment that doesn't seem tobe addressing their most pressing needs. On the otherhand, affluent parents may over-report certainrisk factors, such as health problems and emotional problems.
There could be other areas of risk not included in the risk factor questionnaires used by this
district. For example, acculturation issues are complex and are not well investigated in thesequestionnaires. Other than the self-report of cultural differences in the home (in the student-parentquestionnaire, Appendix C), no attempt could be made to divide groups on the basis of acculturation,since we did not have access to detailed structured interviews. Lastly, ethnic categories were broad andincluded diverse groups within some single categories. For example, the one category "Hispanic"included Latinos, Cubans, Puerto Ricans, and Hispanics. The group "Asians" included children ofJapanese and Chinese background. It may be that more differences exist within these heterogeneousgroups than across our ethnic categories.
In terms of the test data itself, some subtest scores were frequently missing from the data since
the school district, due to time and financial constraints, does not routinely administer all of the subtests
of the WISC-R. Therefore Coding, Mazes, Comprehension, and Digit Span could not be included in themultivariate modeling phase of the study. It may be possible to find more accurate selection modelswith the WISC-R if those subtests are included.
Finally, the sample was drawn entirely from the San Diego area. Results may not generalize to
other geographic areas: San Diego is a metropolitan areawith a preponderance of Latinos in its Hispanicpopulation and a significant proportion of first and second generation Asians in its Asian population.
As noted above, the majority of the students in the district are non-Caucasian.
On the other hand, the sample reported here is derived from an ethnically diverse district thathas consistently shown a commitment to identificationof disadvantaged students for gifted programs.The sample does consist of the entire population of children referred and subsequently administeredthe WISC-R as part of the selection process for gifted education programs. The number of non-Caucasianchildren, particularly in the gifted base rate sample, is larger and more diverse than any previouslyreported. Moreover, a completely balanced sample of 1438 was randomly selected from an overall
71

72
sample of 83%. Lastly, if risk factors were indeedunder-reported and ethnic groups were heterogeneous,the likelihood of finding clear differences between groups would be decreased. Nevertheless, differences
were found.
This work has demonstrated clear differences in pattern of abilities across ethnic backgroundsand across levels of iisk in the children's environment. Population rates of VIQ-PIQ discrepancieshave been documented, and the importance of the difference between statistical significance and clinicalrarity across ethnic groups has been illustrated. No single model using the WISC-R was found toprovide proportionately equal access to gifted programs. Individual models based on ethnic background
failed to achieve ethnic balance, since individual models over-selected African-Americans, Asians, andCaucasians relative to Filipinos and Hispanics. Therefore, use of the WISC-R in a diverse populationto select a balanced group was demonstrated to be inappropriate.
Other instruments, such as Raven's Progressive Matrices, need to be tested in such a large,multicultural population, as has been repeatedly recommended (Baska, 1986; Pearce, 1983; Valencia,
1984). Some combination of assessment devices that account for motivation as well as intellectualpotential may need to be evaluated. Given that we find a way to identify greater proportions ofdisadvantaged children with high potential, the focus then must turn to finding ways to ensure thatthese "different" children express that potential. The children we identify with alternative methodsmay not be the verbally gifted, behaviorally compliant children who currently populate the giftedclassrooms in this district. Further work will need to focus on changes in the enrichment programsthemselves, to enable teachers of the gifted to unlock anddirect the potential these children demonstrate.Improved identification is certainly a goal that needs to be met, but it will be an empty victory if it isachieved and the children so identified fail to be able to express that potential in ways that add to their
own growth as well as the growth of their cultures and societies.
There is a dearth of data on how best to nurture particular kinds of talents: that lack of research-
based knowledge, combined with administrative inflexibility in the use of resources (particularly in aclimate of increasing budget constraints), bodes poorly for children whose giftedness is expressed not
so much in verbal domains as in other intellectual areas. We have seen from the experience at Berkeley
and other universities (D'Souza, 1991) the disturbing outcome of including individuals who would
not have qualified based on established, traditional, uniform criteria into a system which does notchange to fit their needs. Dropout rates are high, and we do not know the long-term negative effects ofthe experience for those who are not able to complete the program. Future studies are needed toexamine ways to develop effective educational programs for diverse classes of very young giftedchildren, and longitudinal studies will be necessary to evaluate the effectiveness of the interventions
so developed. Understanding of motivational principles, group process, and cultural as well asindividual differences in achievement needs and in pattern of abilities is vital for the development ofinterventions to provide mastery experiences for these children early in the educational process. Onlythen can we provide more effective strategies for engaging these children in the life-long growth anddevelopment of the potential they as individuals possess.

Appendix A.
San Diego City SchoolsEducational Services DivisionGifted and Talented Education
Teacher Nomination FormDate
Student Birth
Name Date Sex Ethnic Code
(last) (first) (mi)
School Grade Room Number
IIP
Please rate (name) on each of the following characteristics. This is a
five-point scale with the lower end of the scale (#1) indicating lower than average performance and
the upper end (#5) indicating excellent or exemplary performance.
I. PERSONAL
1. Curious; asks many questions2. Self-motivated; requires little
external direction or encouragement3. Likes to organize people and structure activities4. Generates many ideas, questions, and suggestions5. Flexible; adapts readily to new situations6. Impatient with routine tasks
II. EXPRESSION
7. Vocabulary beyond chronological age or grade level
8. Advanced skill in written expression9. Proficiency in oral expression
III. THOUGHT PROCESSES
10. Quick and accurate recall of factual information11. A storehouse of information on a variety of topics
12. Readily recalls visual information13. Readily recalls auditory information14. Generalizes learning from one experience to another
15. Finds differences and similarities in events16. Understands concepts without extensive concrete
examples17. Can establish relationships between seemingly
unrelated concepts and ideas18. Is insightful about cause and effect relationships
7 7
1 2 3 4 5
73 .

74
GUIDE FOR IDENTIFICATION OF PROSPECTIVE GATE CHILDREN
Page 2
ERQPILCUQN_Ahlaatarla 1 2 3 4 5
19. Displays a great deal of imagination20. Manipulates ideas (i.e., makes changes and
elaborates upon them)21. Concerned with improving or adapting objects and systems22. Capable of intense concentration on tasks of interest
to her/him23. Does not give up easily when confronted with a challenge;
shows determination in achieving goals24. Offers unique, clever responses to questions25. Resourceful, knows where to find answers
V. ACEIEZEMEM
26. High performance (grades) in a particular subject,e.g., math, language arts, science, other
27. Achieves at a high educational level
VI. LEADERSHIP
28. Has strong communication skills; gets ideas acrosseffectively
29. Assumes leadership role easily30. Facilitates and directs efforts
VII. OTHER CHARACTERISTICS
31. Dominates situations32. Expressive of thoughts and opinions33. Compulsive about work and work habits; strives for
perfection34. Becomes involved in task, loses awareness of time35. Persistent in pursuing discussion beyond cutoff point
36. Appears inattentive, withdrawn (daydreams)
Prepared by Recommended? Yes No
(Teacher)
Reviewed byRecommended? Yes No
(Administrator/Designee)

Appendix B.
San Diego City SchoolsEducational Services DivisionGifted and Talented Education
TEACHER NOMINATION FORM
Date
Name Birth Date Sex Ethnic Code
School Grade Track
SOCIAL/ENVIRONMENTAL VARIABLES
Room Number
Please check all items that apply:
1. EN3EIRQITZENTAL
Lacks preschool/kindergarten experience
Irregular attendance
Transiency (3 or more school moves)
Limited home enrichment opportunities (availability of books, periodicals,family interaction, family outings)
Home conflicts:Responsibilities and study timeExcessive child care responsibilityWorking to help support familyOvercrowding no study areaInconsistencies in the home
2. ECONOMIC
Economic hardship
Single parent head of household
Unemployment
3. LANGUAGE
Primary language of parent and/or student is other than English
Not proficient/fluent in English
Uses non-standard English
Student enrolled in Second Language Immersion Magnet (SLTM)
4. CULD/RAL
Limited home/school communication
Experience in dominant culture is limited
Cultural values and beliefs differ from dominant culture
9

76
SOCIAL/ENVIRONMENTAL VARIABLES
Page 2
5. spcIALLEUMIONA
Child abuse: physical mental neglect
Emotional/adjustment problemsWorking with district counselorWorking with social workerUtilizing psychological servicesOther:
Significant home factorsSeparationDivorceDeath
Extended absence of parentMilitaryEmploymentOther:
6. MAIM
FamilySingle parentRemarriage/step-parent
Designated instructional servicesPHDISSpeech and languageVisionHearingAdaptive P.E.
Severe allergies
Asthma
Frequent medical/health referral
Regularly prescribed medication
Other:
Prepared by Recommended? Yes No
(Teacher)
Reviewed by Recommended? Yes No

Appendix C
San Diego City SchoolsSchool Services Division
Gifted and Talented Education
STUDENT/PARENT INFORMATION FORM
Student Name:
(Last)Address
(First) (mi)
(Street)
Birth Date
Mother's name
Father's name(City)
Grade
(State) (Zip)
Room Number Track
GradeSchools Attended
Date
Sex School
OccupationWork PhoneOccupationWork Phone
Home Phone
Dates Attended
1. Names and ages of brothers and sisters:
2. Describe your child's attitude toward school:
3. List any special interests, talents, and skills your child may have:
4. What special lessons, training or learning opportunities has yourchild had outside of school?
3. To help us know more about your child, please check any of the following that apply:
O allergies
O asthma
CI frequent absences
O prescribed medications
O parent in military
O frequent parent absence
ID parents separated
O single parent
O remarriage/step-parent
O recent death/significantillness in :family
CI 3 or more schools attended
CI no kindergarten or pre-
school experience
CI additional language(s)
spoken in homeList:
6. Has your child been previously assessed? Cl yes 0 no If yes, when?
7. What other things would you like us to know that would assist us in assessing your child?
Name of person Relationship
completing this form to student
. 77 .
CHAPTER 3
Evaluation of Risk Factors in Selecting Children for Gifted Programs
Part 1: Gifted Children at Risk: Evidence of an Associationbetween Low Test Scores and Risk Factors
Nancy E. Johnson, Dennis P. Saccuzzo, & Tracey L. GuertinSan Diego State University
Part 2: Intelligence, Aptitude, and Achievement in Gifted ChildrenWith and Without Language Risk
Tracey L. Guertin, Nancy E. Johnson, & Dennis P. SaccuzzoSan Diego State University
* This research was funded by Grant R206A00569, U.S. Department of Education,Jacob Javits Gifted and Talented Discretionary Grant.
The authors express their appreciation to the San Diego City Schools, to Giftedand Talented Education (GATE) Administrator David Hermanson, and to the followingschool psychologists: Will Boggess, Marcia Dome, Eva Jarosz, Dimaris Michalek,Lorraine Rouse, Ben Sy, and Daniel Williams.
Correspondence concerning these article should be addressed to Dennis P.
Saccuzzo, Joint San Diego State/University of California, San Diego Clinical TrainingProgram, 6363 Alvarado Court, Suite 103, San Diego, California 92120-4913.
1994Do not reproduce in any form without express written permission from the authors.
5 2 79

Part 1:
Gifted Children at Risk: Evidence of an Associationbetween Low Test Scores and Risk Factors
Nancy E. Johnson, Dennis P. Saccuzzo, & Tracey L. Guertin
San Diego State University
This research was funded by Grant R206A00569, U.S. Department ofEducation, Jacob javits Gifted and Talented Discretionary Grant Program.
The authors express their appreciation to the San Diego Unified City Schools,
to Gifted and Talented Education (GATE) Administrator David P. Hermanson,
and to the following school psychologists: Will Boggess, Marcia Dijiosia, Dimaris
Michalek, Ben Sy, and Daniel Williams.Correspondence should be addressed to Nancy E.Johnson, JSan Diego State
University, 6363 Alvarado Court, Suite 103, San Diego, California 92120-4913
(Telephone: 619-594-2845 / FAX: 619-594-6780 / e-mail:
©1994Do not reproduce in any form without express written permission from the
authors.
,s3 81

82
Abstract
Intellectually gifted children from diverse ethnic and cultural backgrounds aswell as varying levels of risk were evaluated to determine the effect of risk ongifted children when intelligence level has been controlled. Each of the 7,323children from six ethnic backgrounds had achieved a standardized intelligencetest score (Wechsler Intelligences Scale for Children - Revised or Raven's StandardProgressive Matrices) at least two standard deviations above the mean. Six areasof risk evaluated in a case study approachincluded cultural, economic, emotional,environmental, health and language factors. Although each child in the sample
had demonstrated high intellectual potential, differences were found betweengroups defined on level of risk: no risk, low risk (one and only one area of risk),and high risk (more than one area of risk). High risk gifted children were foundto be disadvantaged relative to those at low or no risk in all measures of bothaptitude and achievement, as assessed with the Developing Cognitive AbilitiesTest and the Comprehensive Test of Basic Skills. Furthermore, those at high riskdemonstrated lower WISC-R Verbal IQ scores than children at lower levels ofrisk. Implications and limitations of these findings for assessment of giftedness,identification of potential gifted underachievers, and development of giftedcurriculum are discussed.
4

Gifted Children at Risk: Evidence of an Association between Low Test Scores and Risk Factors
Since the 1960's, much has been written about gifted children at risk. One focus of this literatureis the failure to identify gifted children at risk, presumably because of the use of standardized tests ascriterion measures. Criticism has repeatedly been leveled at the use of standardized tests in any childconsidered to be at risk because of ethnic or cultural background (Cronbach, 1984; Sullivan, 1973; Sattler,1982), socioeconomic disadvantage (Fetterman, 1986; Harty, Adkins, & Sherwood, 1984; Shaw, 1986),health or handicapping condition (Pledgie, 1982), or differences in language (Sattler, 1982). Otherinvestigators have noted the difficulty in the identification of giftedness in children with these riskfactors (Albrecht & Rost, 1983; Bruch, 1971; Harty, et al., 1984). However, less attention has been givento children who, despite risk factors, perform at highlevels on standardized tests of intellectual potentialand so are recognized gifted. Passow (1989) suggested that priority areas of research in the educationof high-ability children should include not only the need to identify and nurture giftedness in"disadvantaged" populations, but also explication of what is needed to transform potential intoperformance in the gifted. We hypothesize that intellectually gifted children at risk show patterns ofdisadvantage on tests of potential and achievement when compared to intellectually gifted childrennot at risk, and submit that these patterns may prove useful in the development of educational programsdesigned to unlock potential in gifted children at risk.
Several factors have been shown to be associated with underachievem&it in children. Includedin emotional factors are such stresses as parental conflict due to the absence of a parent, or childmaltreatment. Zilli (1971) found that underachievers tend to come from broken homes. Wallerstein(1985) found that children from single parent homes have a higher rate of absenteeism as well as loweracademic competence at school entry, and suggested that they may be burdened by too muchresponsibility for care of themselves and of younger siblings. However, the effects of emotional factorsmay be confounded with the effects of socioeconomic status, particularly in single-parent homes.
Low socioeconomic status has consistently been found to correlate negatively with identificationfor gifted programs (Fetterman, 1986; Harty, et al., 1984; Shaklee, 1992; Shaw, 1986). A 1983 (Albrecht &
Rost) survey of San Diego gifted and talented classrooms using zip code as an indicator of socioeconomic
status revealed that children from neighborhoods with higher housing prices were more likely to beidentified gifted and to participate in gifted and talented programs. Pirozzo (1982) pointed out thatsocioeconomic status is a major difference between potentially giftedunderachievers and gifted childrenwhose achievement matches their potential. One weakness of many studies that attempt to look atsocioeconomic status is that socioeconomic sta tus is often confounded with ethnic or culturalbackground, and with poor health.
Nichols and Anderson (1973) attempted to control for differences in socioeconomic statusbetween African-American and White 7-year-old children to yield a clearer indication of ethnicdifferences between these two groups by matching on SES, geographic location, and provision of prenatal
care. These authors found that differences in IQ were reduced to approximately five points, in favor of
White children, rather than the 15-point advantage often cited. In contrast to the approach of mostinvestigators to examine deficits, Bruch (1971) reported the intellectual strengths found in intelligencetest performance in gifted African-American children in the southeast. These strengths included practicalproblem-solving, memory operations, and visual and auditory figural content.
It has been well documented that low socioeconomic statusaffects the health of children andtheir mothers. African-Americans, in particular, have a higher rate of premature birth and abnormalitiesin pregnancy than do Whites (Wiener & Milton, 1970). Because of multiple risk factors in theirenvironments, migrant children and homeless children are characteristic of those described by Haney(1963) as, "The most educationally deprives' group of children in the Nation" (p. 101). Given theinconsistencies in their educational experience as well as the demands placed on them te care for theirsiblings, it seems unlikely that the potential of such gifted children could be fully expressed (Frasier,1979 & 1982). As Laslow & Nelson (1974) pointed out, cultural differences, emotional problems, andphysical disabilities are more likely to occur in children from lower socioeconomic households.
83
S 5

The present study attempted to examine a range of identified risk factors as well as level of risk
for children who attained standardized intelligence test scores that were at least two standard deviationsabove the mean. Therefore, despite varying levels of risk,each of these children had demonstrated highacademic potential and had been identified intellectuallygifted. The sample was selected from a large,diverse sample of children who had been referred and evaluated for giftedness. Six areas of risk were
examined: cultural, economic, emotional, environmental, health, and language. Cultural risk includedcultural values and beliefs that differ from those of the dominant culture, or limited experience in thedominant culture. Economic risk included parental unemployment orlow household income. Emotionalrisk encompassed such factors as death of a parent or sibling, child abuse, psychiatric illness in thenuclear family, or extended parental absences due to military service. Environmental risk includedtransiency (three or more school moves) and excessive absences from school that were due to specificfactors not related to another risk factor (e.g., absences due to home responsibilities such as child care or
working to help support the family). Health risk includedvision, speech, or hearing deficits requiringdesignated instructional service, motor problems requiring adaptive physical education, or chronicdiseases such as asthma. Language risk included English as a second language or lack of fluency in
English.
For the purposes of this study, three levels of risk were defined. Children at no risk were thosewho had no identified risk factors. Those at low risk were children who had identified risk in one of the
six areas previously described. High risk children were those who had been identified as having risk inat least two of the areas defined. For the purposes of this study, level of risk was defined by number of
areas of risk, rather than by absolute numbers of individual risk variables within the areas. For example,
a child who had asttma as well as a hearing deficit would, by definition, be at low risk since both risk
factors fall in the one area of health risk.
Since these risk areas have been shown to be associated with lower achievement in children, we
hypothesized that, even among children identified intellectually gifted based on intelligence test scores,differences would be found in aptitude and achievement test scores as a function of level of risk in the
child's background.
Method
SubjectsThe sample was drawn from the 11,074 children who had been referred for giftedness testing in
the San Diego City School System between 1984 and 1991. Of these referred children, 1,107 were Latino/
Hispanic; 7,751 were White; 855 were African-American; 393 were Asian; 390 were Indochinese; and 578
were Filipino. Fifty-one percent were male. The majority of the children were in the second (4,276),
third (2,473), or fourth (1,248) grade. The remainder were in the first (187), fifth (993), sixth (962), seventh
(392), eight (276), or ninth (192) grade. Information on grade level was not available for 75 children.
For the purposes of this study, a sample of all children who achieved a WISC-R Full Scale IQ
score of at least 130 or a Raven IQ equivalent of 130 was selected. Thus, we isolated the group of high IQ
scoring children. A total of 7,323 children met this criterion. Of these, 464 were Latino/Hispanic, 5750
White, 366 African-American, 279 Asian, 303 Filipino, and 161 Indochinese. Fifty-four percent were
male.
Procedure
Each subject was referred for giftedness testing by a parent or teacher, or through centralnomination of high-achieving children. Each was then either individually tested with the Wechsler
Intelligence Scale for Children - Revised (WISC-R) or group tested with the Raven Standard Progressive
Matrices Test, and group tested with the Developing Cognitive Abilities Test (DCAT). The DCAT, an
aptitude test designed to predict academic achievement, provides estimates of potential for verbal,
quantitative, and spatial abilities. Reliability coefficients for the composite score are in the low .90's,
84

while those for the verbal, quantitative, and spatial scores range from the mid .70's to the mid .80's. TheWISC-R or Raven and DCAT were used in conjunction with the child's scores on the ComprehensiveTest of Basic Skills (CTBS), a standardized achievement test. A school psychologist then conducted acase study analysis of each child and determined, through a self-report questionnaire sent to the homeand to the child's teacher, whether the child had any one of six risk factors: language, cultural, economic,emotional, health, and environmental. In the high IQ sample, 4,303 children had no identified riskfactors; 1,340 had one; and 1,680 had more than one. The distribution of level of riskvaried across ethnicbackground. Figure 1 illustrates the percentage of children at risk (one risk factor versus more than one)for each ethnic group. The majority of white children had no identified risk factors, whereas the majorityof Latino, African-American, Asian, Filipino, and Indochinese children had at least one. Seventy-fivepercent of Indochinese children had two or more risk factors, placing them at high risk for failure toachieve their potential.
Figure 1. Percentage at each positive level of risk (one risk factor versus two or more) for each ethnic
background.
100
80
60
40
20
r-1
o ONE RISK FACTOR
TWO OR MORE RISK FACTORS
7
L.
ETHNICITY
0
85

Results
Table 1 shows the correlation among the various risk factors. Due to the large number of subjects,most correlations are statistically significant. Notably high correlations were found between Culturaland Language risk, Economic and Environmental risk, Economic and Emotional risk, and Emotionaland Environmental risk.
Table 1Risk factor correlations (Pearson r)
Cultural Economic Emotional Environmental Health Language
Cultural 1.00 .21** .05** .18** -.02*
Economic 1.00 .40** .30** .08** .15**
Emotional 1.00 .30** .16**
Environmental 1.00 .09**
Health 1.00 -.01
Language 1.00
*p<.05** p < .01
For all subsequent analyses, Level of Risk has been defined as No (no risk factors), Low (onerisk factor, and High (more than one risk factor).
For those children who had been given the WISC-R, data were analyzed in a 3 (Risk Level: No,Low, High) X 2 (IQ Score: Verbal, Performance) mixed repeated measures ANOVA with repeatedmeasures on IQ score. Significant main effects were found for Risk Level, F(2, 5881) = 3.21, p < .05, andfor IQ Score F(1, 5881) = 292.65, p < .001. There was also a significant Risk Level by IQ Score interactionF(2, 5881) = 11.21, p < .001. Given the number of subjects, observed power at the .001 level ranged from.992 to 1.000. Table 2 shows the means and standard deviations for the WISC-R data.
Table 2
WISC-R IQ scores: descriptive statistics for three levels of risk.
No Risk(n= 3964)
Low Risk(n = 974)
High Risk Marginals(n = 946) (n = 58841
M SD M SD M SD M SD
VIQ 136.15 (8.63) 136.78 (8.87) 134.83 (9.10) 136.04 (8.76)
PIQ 132.55 (9.05) 131.95 (9.21) 132.75 (9.34) 132.48 (9.12)
Marginals 134.15 (8.84) 134.65 (9.04) 133.79 (9.22)
86
IIIIIIII
IIII
I
I
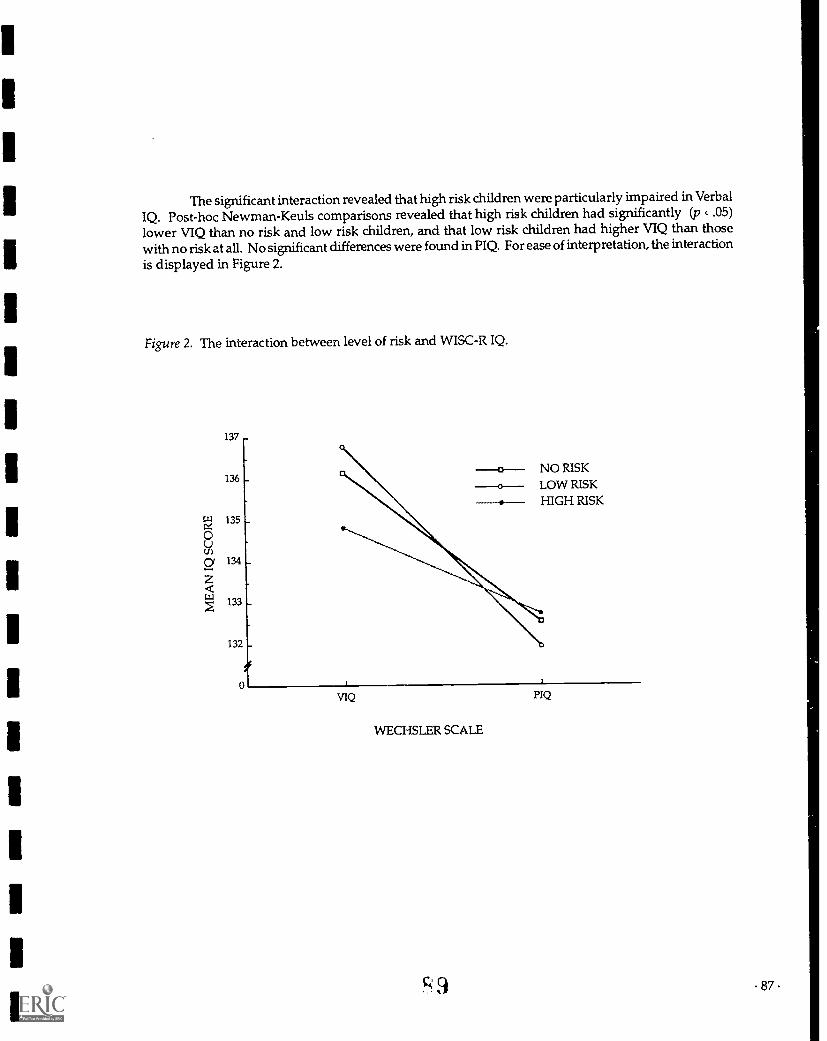
The significant interaction revealed that high risk children were particularly impaired in VerbalIQ. Post-hoc Newman-Keuls comparisons revealed that high risk children had significantly (p < .05)lower VIQ than no risk and low risk children, and that low risk children had higher VIQ than thosewith no risk at all. No significant differences were found in PIQ. For ease of interpretation, the interaction
is displayed in Figure 2.
Figure 2. The interaction between level of risk and WISC-R IQ.
137
136
135
134
133
132
VIQ P1Q
WECHSLER SCALE
9 87 .
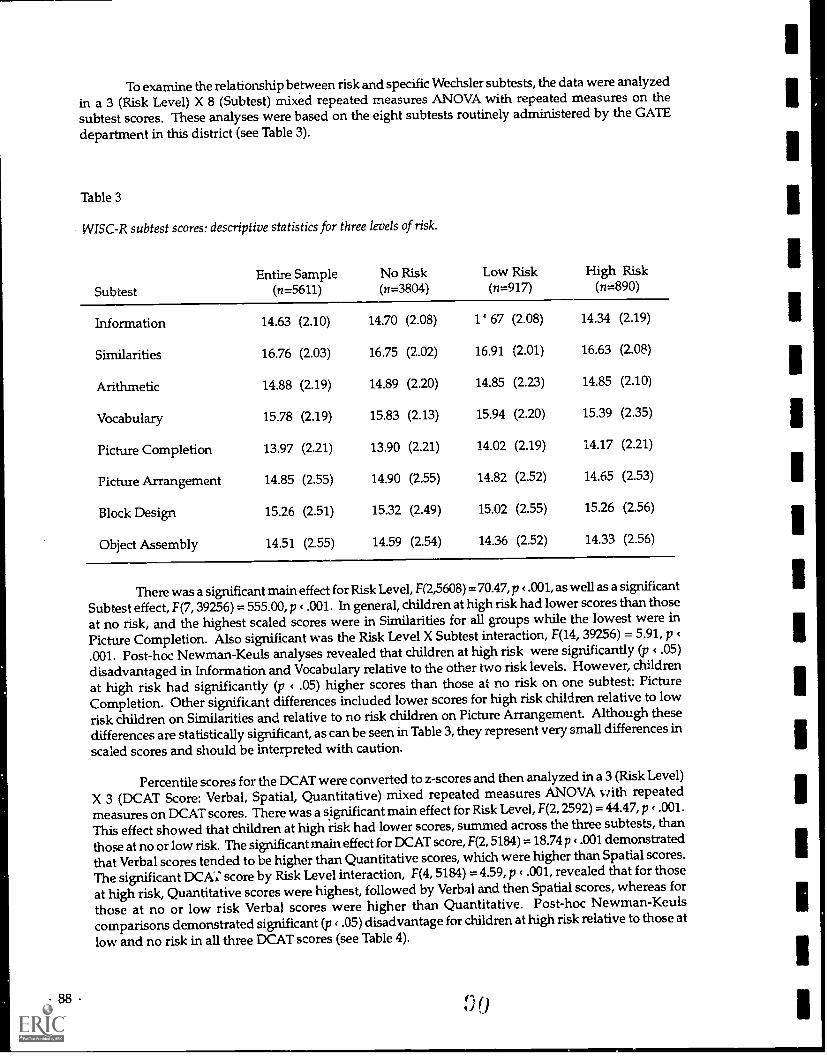
88
To examine the relationship between risk and specific Wechslersubtests, the data were analyzedin a 3 (Risk Level) X 8 (Subtest) mixed repeated measures ANOVA with repeated measures on thesubtest scores. These analyses were based on the eight subtests routinely administered by the GATE
department in this district (see Table 3).
Table 3
WISC-R subtest scores: descriptive statistics for three levels of risk.
SubtestEntire Sample
(n=5611)No Risk(n=3804)
Low Risk(n=917)
High Risk(n=890)
Information 14.63 (2.10) 14.70 (2.08) 14 67 (2.08) 14.34 (2.19)
Similarities 16.76 (2.03) 16.75 (2.02) 16.91 (2.01) 16.63 (2.08)
Arithmetic 14.88 (2.19) 14.89 (2.20) 14.85 (2.23) 14.85 (2.10)
Vocabulary 15.78 (2.19) 15.83 (2.13) 15.94 (2.20) 15.39 (2.35)
Picture Completion 13.97 (2.21) 13.90 (2.21) 14.02 (2.19) 14.17 (2.21)
Picture Arrangement 14.85 (2.55) 14.90 (2.55) 14.82 (2.52) 14.65 (2.53)
Block Design 15.26 (2.51) 15.32 (2.49) 15.02 (2.55) 1526 (2.56)
Object Assembly 14.51 (2.55) 14.59 (2.54) 14.36 (2.52) 14.33 (2.56)
There was a significant main effect for Risk Level, F(25608) = 70.47, p < .001, as well as a significant
Subtest effect, F(7 , 39256) = 555.00, p < .001. In general, children at high risk had lower scores than thoseat no risk, and the highest scaled scores were in Similarities for all groups while the lowest were inPicture Completion. Also significant was the Risk Level X Subtest interaction, F(14, 39256) = 5.91, p <
.001. Post-hoc Newman-Keuls analyses revealed that children at high risk were significantly (p < .05)disadvantaged in Information and Vocabulary relative to the other two risk levels. However, childrenat high risk had significantly (p < .05) higher scores than those at no risk on one subtest: PictureCompletion. Other significant differences included lower scores for high risk children relative to lowrisk children on Similarities and relative to no risk children on Picture Arrangement. Although thesedifferences are statistically significant, as can be seen in Table 3, they represent very small differences in
scaled scores and should be interpreted with caution.
Percentile scores for the DCAT were converted to z-scores and then analyzed in a 3 (Risk Level)
X 3 (DCAT Score: Verbal, Spatial, Quantitative) mixed repeated measures ANOVA with repeatedmeasures on DCAT scores. There was a significant main effect for Risk Level, F(2, 2592) = 44.47, p < .001.
This effect showed that children at high risk had lower scores, summed across the three sub tests, than
those at no or low risk. The significant main effect for DCAT score, F(2, 5184) = 18.74 p < .001 demonstrated
that Verbal scores tended to be higher than Quantitative scores, which were higher than Spatial scores.The significant DCA; score by Risk Level interaction, F(4, 5184) = 4.59, p < .001, revealed that for those
at high risk, Quantitative scores were highest, followed by Verbal and then Spatial scores, whereas for
those at no or low risk Verbal scores were higher than Quantitative. Post-hoc Newman-Keulscomparisons demonstrated significant (p < .05) disadvantage for children at high risk relative to those at
low and no risk in all three DCAT scores (see Table 4).
f) 0

Table 4
DCAT scores: descriptive statistics for three levels of risk.
Verbal:
Quantitative:
Spatial:
percentile (SD)z-score (SD)
percentile (SD)z-score (SD)
percentile (SD)z-score (SD)
Total(n=2595)
No Risk(n=987)
Low Risk(n=704)
High Risk(n=904)
85.58 (15.09) 87.85 (12.50) 87.49 (12.98) 81.61 (18.12)
1.35 (0.76) 1.46 (0.72) 1.42 (0.71) 1.16 (0.81)
84.99 (16.30) 86.02 (14.46) 85.97 (15.18) 83.09 (18.70)
1.28 (0.74) 1.32 (0.69) 1.32 (0.71) 1.21 (0.80)
83.82 (17.46) 85.59 (15.18) 85.00 (16.27) 80.97 (20.13)
1.23 (0.78) 1.31 (0.73) 1.28 (0.75) 1.10 (0.84
Achievement scores, as measured by the CTBS, were analyzed in a 3 (Risk Level) X 3 (CTBS
Score: Total Language, Total Reading, Total Math) mixed repeated measures ANOVA with repeated
measures on the CTBS scores. Again, there was a significant main effect for Risk Level , F(2, 1616) =
20.45, p < .001. This result again showed that children at high risk achieved lower scores, summed
across the three areas of achievement, than did those at low or no risk. There was also a significant
main effect for CTBS score, F(2, 3232) = 221.61, p < .001, with significantly higher Total Math scores than
Total Language, and significantly higher Total Language than Total Reading. The interaction of C113S
score and Risk Level, F(4, 3232) = 2.81,p < .05, indicated that children at low risk achieved scores equivalent
to or lower than those at no risk in Total Reading and Total Math, but slightly higher than those at no
risk in Total Language. Post-hoc Newman-Keuls comparisons revealed that those at high risk were
again significantly (p < .05) disadvantaged relative to those at low or no risk . The disadvantage wasapparent for all three CTBS scores (See Table5).
Table 5
CTBS stanine scores: descriptive statistics for three levels of risk.
Total(n=1619)
No Risk(n=662)
Low Risk(n=388)
High Risk(n=569)
Total Language M (SD) 7.65 (1.14) 7.74 (1.07) 7.78 (1.06) 7.46 (1.24)
Total Reading M (SD) 7.43 (1.19) 7.56 (1.06) 7.56 (1.16) 7.19 (1.31)
Total Math M (SD) 8.16 (1.09) 8.22 (1.07) 8.20 (1.07) 8.07 (1.12)
Discussion
The present study compared intellectually gifted children at three levels of identified risk: no
risk, low risk (one area of risk) and high risk (two or more areas of risk). These children were evaluated
in six areas of risk: cultural, economic, emotional, environmental, health, and language. Every child in
the study had been referred as potentially gifted and had subsequently achieved either a WISC-R Full
Scale IQ score of at least 130, or a Raven Standard Progressive Matrices score at least two standard
deviations above the mean. Therefore IQ was tightly controlled. Every child in the study had
fli89

90
demonstrated high intellectual potential despite the presence of varying levels of risk for failure tofully express that potential. This design allowed us to evaluate the effect of risk without confounding
IQ.
The data support our hypothesis of a different pattern of scores in children at risk. This patternis characterized by depressed verbal abilities. In general, children at high risk were found to bedisadvantaged relative to those at low or no risk in all measures of both aptitude and achievement.Furthermore, those at high risk demonstrated lower WISC-R Verbal IQ than those at lower levels ofrisk. The disadvantage in Verbal IQ was particularly evident in theInformation and Vocabulary subtests.Thus our findings support the hypothesis that high levels of risk negatively impact expression of a
gifted child's intellectual potential.
These data are not surprising. Low scores on Information and Vocabulary have long beenknown to be associated with risk factors such as poor reading ability, environmental deprivation, andemotional problems (Guertin, Ladd, Frank, Rabin, & Hies ler, 1971; Lewandowski & Saccuzzo, 1976;Saccuzzo & Lewandowski, 1976). The present study is unique in showing that Information andVocabulary are depressed even while IQ is controlled and even for intellectually gifted children.
The consistency of the low scores on Information and Vocabulary for children at risk across a
variety of studies strongly points to the possible diagnostic significance of these subtests. Certainly,when evaluating for giftedness, practitioners should be alert to the presence of risk factors whenever
these scores are depressed.
Other findings from the study should be interpreted more cautiously. The finding of relativelyhigh scores on Picture Completion needs to be considered in light of the standards promulgated byLewandowski & Saccuzzo (1976). As these investigators noted, in order for a specific test sign to havereliable diagnostic significance, a number of methodological standards must be met. These includecontrol of all major relevant variables, sufficient power, and cross-validation.
The present study, while meeting the standards for control and power, did not include a cross-validation. Thus, before we accept the diagnostic significance of the Picture Completion subtest as amarker of risk, it would be important that the present findings be cross-validated on an independent
sample.
From the standpoint of the education of children at risk, a number of factors should beconsidered. First, despite their high IQ's, these children have a relatively depressed vocabulary. Teachersof gifted children at risk might, therefore, concentrate on enriching the vocabularies of these children.The low score on the Information subtest may have several implications. It could be that these children
do not have the same opportunity to acquire everyday factual information as do children not at risk.Alternatively, these children, due to such factors as economic disadvantage and environmental distress,do not have the same interest in acquiring factual information as do more advantaged children. It
would seem important that teachers of the high risk gifted attempt tobring relevance to the educational
process for these children.
The results show a surprisingly high concentration of risk for Latino, African-American, andFilipino children. Practically 80 percent of the Latino, 60 percent of the African-American, and 70 percent
of the Filipino children had at least one risk factor. These findings reveal that individuals from thesegroups, even though gifted, have a high potential for risk. Even more surprising was the finding that
nearly 80 percent Indochinese had two or more risk factors. Educators working with these populationsneed to be sensitized to the high level of adversity these children face. It should be emphasized thatthese children, in spite of their adversity, still managed to score two standard deviations above themean on a standardized IQ test. Children within these groups who are not as intellectually capable
clearly are far more vulnerable to the varieties of risk that they must deal with on a daily basis.
There were some important correlations among the various areas of risk. The strong association
between cultural and language risk is not surprising. Children who come from nonEnglish-speaking
Q 0
homes, more often than not, come from a different culture. Another important area of association wasfound among environmental, economic, and emotional risk. Although causeeffect relationships cannotbe discerned from these data, it is easy to see how these risk factors are associated. Teachers need to bealert to the association among these three areas of risk.
The sample for this study was drawn from a population of children referred as potentiallygifted. Therefore, it does not constitute a truly random sample of children two standard deviationsabove the mean in intelligence test scores. However, the sample does accurately represent children whohave been identified and certified gifted based on attainment of standardized intelligence test scorestwo standard deviations above the mean in a diverse school district that has come extremely close toachieving ethnic and cultural equity in its gifted education program. It represents childrer who havedemonstrated their intellectual potential in an objective manner, despite varying levels of risk. Therefore,this sample powerfully illustrates the impact of risk factors on the expression of potential for giftedchildren.
0 391

Part 2:
Intelligence, Aptitude, and Achievement in Gifted ChildrenWith and Without Language Risk
Tracey L. Guertin, Nancy E. Johnson, and Dennis Saccuzzo*
San Diego State University
* This research was funded by Grant R206A00569, U.S. Department ofEducation, Jacob Javits Gifted and Talented Discretionary Grant.
The authors express their appreciation to the San Diego CitySchools, to Gifted and Talented Education (GATE) Administrator DavidHermaiison, and to the following school psychologists: Will Boggess,Marcia Dome, Eva Jarosz, Dimaris Michalek, Lorraine Rouse, Ben Sy, and
Daniel Williams.Correspondence concerning this article should be addressed to
Dennis P. Saccuzzo, Joint San Diego State/University of California, SanDiego Clinical Training Program, 6363 Alvarado Court, Suite 103, San Diego,California 92120-4913 (Telephone: 619-594-2844 / FAX: 619-594-6780 /
e-mail: [email protected]).
© 1994Do not reproduce in any form without express written permission from the authors.
9 4 93
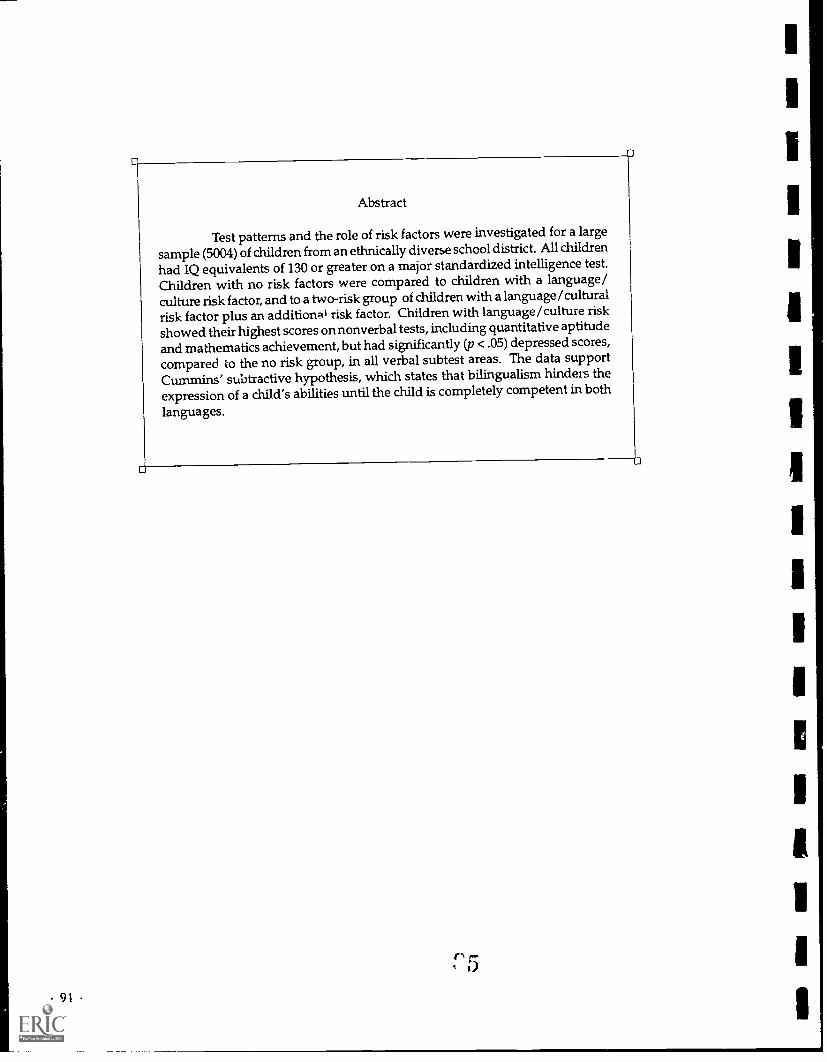
94
Abstract
Test patterns and the role of risk factors were investigated for a large
sample (5004) of children from an ethnically diverse school district. All childrenhad IQ equivalents of 130 or greater on a major standardized intelligence test.Children with no risk factors were compared to children with a language/culture risk factor, and to a two-risk group of children with a language/culturalrisk factor plus an additional risk factor. Children with language/culture riskshowed their highest scores on nonverbal tests, including quantitative aptitudeand mathematics achievement, but had significantly (p < .05) depressed scores,
compared to the no risk group, in all verbal subtest areas. The data supportCummins' subtractive hypothesis, which states that bilingualism hinders theexpression of a child's abilities until thechild is completely competent in both
languages.
r-,
Intelligence, Aptitude, and Achievement in Gifted ChildrenWith and Without Language Risk
Numerous studies support the hypothesis that being bilingual enhances a person's performance
on a variety of cognitive tests (Ben-Zeev, 1977; Cummins, 1976, 1978, 1981, 1986, 1989; Cunimins &
Gulutsan, 1974; Dash & Misahra, 1988; Diaz, 1983; Feldman & Shen, 1971; Gallegos & Franco, 1985;
Hakuta, 1987; Hakuta & Diaz, 1985; Hakuta & Garcia, 1989; Ianco-Worrall, 1972; Landry, 1974; Lindholm,
1991; Peal & Lambert, 1962; Zentella, 1981). In all of these studies bilingualism has been defined asadding a second language to an already well-developed language, or acquiring a second language toreplace the first language. Cummins' (1976) threshold hypothesis best explains the enhancedperformance of bilingual individuals by suggesting that once an unspecified threshold point of fluency
in both languages is reached, the languages complement each other and add to the bilingual person'sability to perceive the environment from multiple cultural viewpoints. Theorefically, those who aredeveloping bilingually are constantly monitoring and confrolling two symbol systems that could possiblyinterfere with each other. Additionally, comparing two languages may increase a person's ability towork with abstract ideas, such as language or quantitative tasks, that am commonly referred to as"metacomponential abilities" (Dash & Mishra, 1988; Reynolds, 1991). Until a threshold point ofbilingualism is reached, however, the process of learning and being evaluated in a second languagecan only be subtractive, thus hindering the complete expression of one's abilities.
Often, for minority language children in the American school system, neither English or the
native language is adequately developed because native speakers of another language are immersedinto classrooms where only English is spoken. The child's primary language is not used in the classroom;
thus English is used only in a formal setting. The result is that children do not identify with eitherlanguage and often speak a combination of the two; for example, "spanglish" for bilingual Spanish/English speaking children (Cauce & Jacobson, 1980). Teachers mayerroneously assume that if a student
is proficient in conversational English with peers, he or she is also English proficient in the classroom.Classroom proficiency, however, requires more than simply having an understanding of the language(Cummins, 1981). Cummins (1981) points out that parents may be encouraged by teachers or peers tospeak to their children in English to help them obtain proficiency. However, since the parents are often
not fluent, the child is at best exposed to poor English. At worst, parents may be uncomfortable speakingin a foreign language and consequently may not communicate with their children as much. Thus,having a native language other than English is a risk factor in American classrooms.
There is a cultural component coupled with any language risk factor a child may bring into the
school system. A theory by Vygotsky (1962) states that language is initially used as a form of socialcommunication and eventually evolves into a way of ordering thoughts and working with abstractsymbol systems. In essence, speech and thought are not the same thing. Speech is simply one form of
a symbolic thought process that humans use to communicate ideas (Ben-Zeev, 1977; Peal & Lambert,
1962; Vygotsky, 1962). Each society is in fact limited by its language because it can only express thosethoughts, feelings, and experiences that the language has words to express. Therefore, learning alanguage is a socialization process that affects how one perceives the environment (Vygotsky, 1962).One's perception of the environment is often referred to as a cognitive set. Theoretically, a person who
is bilingual may have a broader cognitive set, plus more cultural viewpoints from which to view any
new experience, and thus may accumulate more crystallized intelligence (Cattell, 1963).
Becoming bilingual may also act as a disadvantage for children in terms of the testing measures
traditionally used to assess intelligence (e.g., the WISC-R, or the Stanford-Binet Intelligence
Scales) because most of the evaluations are performed in English, the minority language child's second
language. The measures are additionally biased in favor of the Anglo American cognitive set andculture upon which they were based (Bernal, 1974; Melesky, 1985). As a result, poor scores are often
obtained, and may be interpreted as a learning disability or lack of subject knowledge, instead of ademonstration of the level of second language fluency and cultural assimilation the child has attained
(Ascher, 1990; Cummins, 1982; Ortiz, 1991).
9695
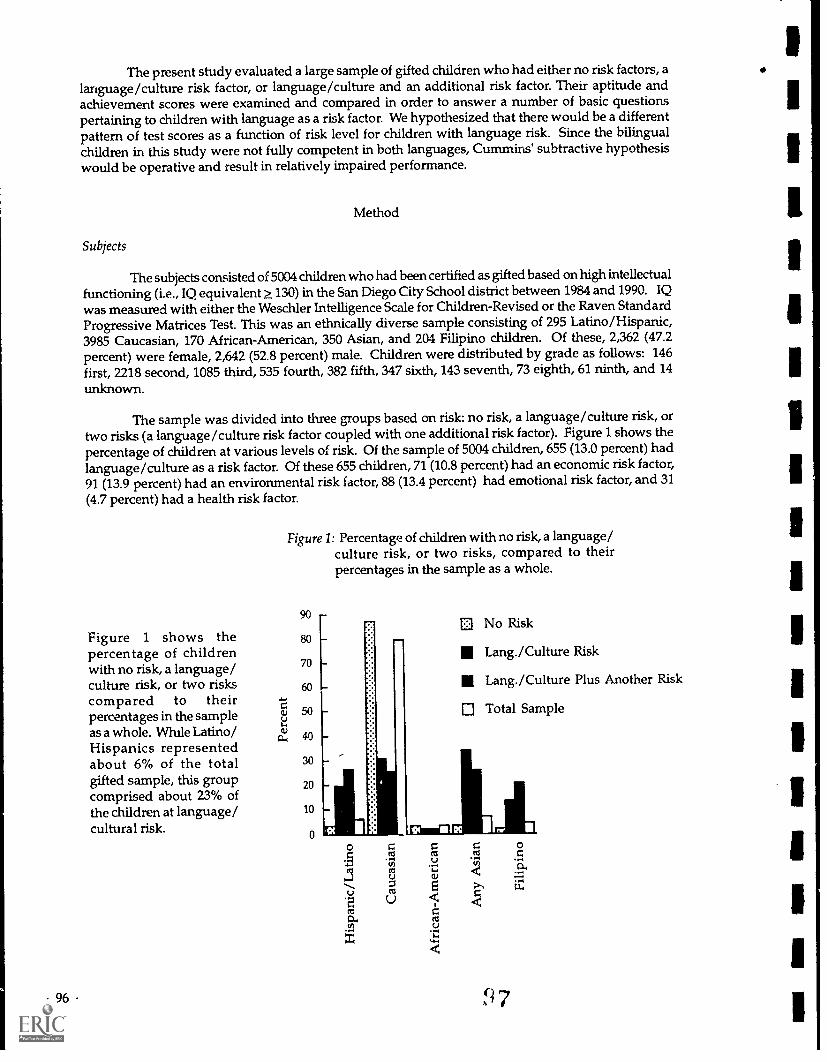
The present study evaluated a large sample of gifted children who had either no risk factors, alanguage/culture risk factor, or language/culture and an additional risk factor. Their aptitude andachievement scores were examined and compared in order to answer a number of basic questionspertaining to children with language as a risk factor. We hypothesized that there would be a differentpattern of test scores as a function of risk level for children with language risk. Since the bilingualchildren in this study were not fully competent in both languages, Cummins' subtractive hypothesiswould be operative and result in relatively impaired performance.
Method
Subjects
The subjects consisted of 5004 children who had been certified as gifted based on high intellectualfunctioning (i.e., IQ equivalent > 130) in the San Diego City School district between 1984 and 1990. IQwas measured with either the Weschler Intelligence Scale for Children-Revised or the Raven StandardProgressive Matrices Test. This was an ethnically diverse sample consisting of 295 Latino/Hispanic,3985 Caucasian, 170 African-American, 350 Asian, and 204 Filipino children. Of these, 2,362 (47.2percent) were female, 2,642 (52.8 percent) male. Children were distributed by grade as follows: 146first, 2218 second, 1085 third, 535 fourth, 382 fifth, 347 sixth, 143 seventh, 73 eighth, 61 ninth, and 14unknown.
The sample was divided into three groups based on risk: no risk, a language/culture risk, ortwo risks (a language/culture risk factor coupled with one additional risk factor). Figure 1 shows thepercentage of children at various levels of risk. Of the sample of 5004 children, 655 (13.0 percent) hadlanguage/culture as a risk factor. Of these 655 children, 71 (10.8 percent) had an economic risk factor,91 (13.9 percent) had an environmental risk factor, 88 (13.4 percent) had emotional risk factor, and 31(4.7 percent) had a health risk factor.
Figure 1 shows thepercentage of childrenwith no risk, a language/culture risk, or two riskscompared to theirpercentages in the sampleas a whole. While Latino/Hispanics representedabout 6% of the totalgifted sample, this groupcomprised about 23% ofthe children at language/cultural risk.
96
Figure 1: Percentage of children with no risk, a language/culture risk, or two risks, compared to theirpercentages in the sample as a whole.
O No Risk
Lang./Culture Risk
Lang./Culture Plus Another Risk
El Total Sample
'cg
o..
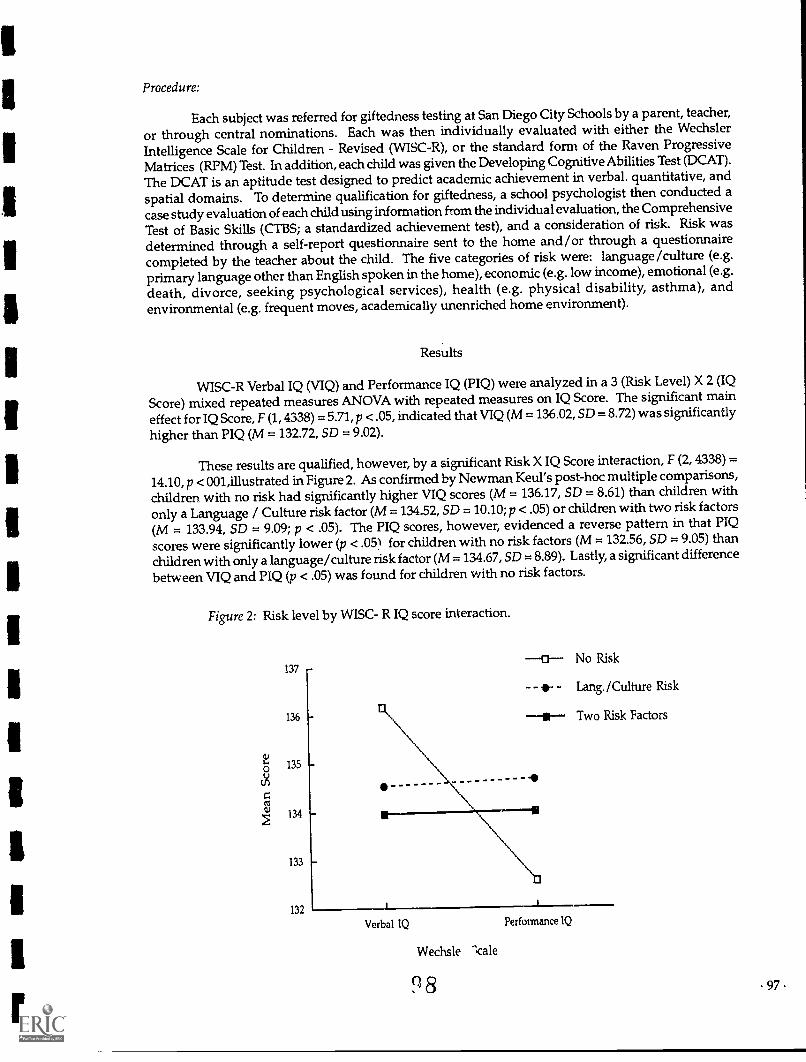
Procedure:
Each subject was referred for giftedness testing at San Diego City Schools by a parent, teacher,
or through central nominations. Each was then individually evaluated with either the Wechsler
Intelligence Scale for Children - Revised (WISC-R), or the standard form of the Raven ProgressiveMatrices (RPM) Test. In addition, each child was given the Developing Cognitive Abilities Test (DCAT).
The DCAT is an aptitude test designed to predict academic achievement in verbal, quantitative, andspatial domains. To determine qualification for giftedness, a school psychologist then conducted a
case study evaluation of each child using information from the individual evaluation, theComprehensive
Test of Basic Skills (CTBS; a standardized achievement test), and a consideration of risk. Risk wasdetermined through a self-report questionnaire sent to the home and/ or through a questionnairecompleted by the teacher about the child. The five categories of risk were: language/culture (e.g.primary language other than English spoken in the home), economic (e.g. low income), emotional (e.g.
death, divorce, seeking psychological services), health (e.g. physical disability, asthma), andenvironmental (e.g. frequent moves, academically unenriched home environment).
Results
WISC-R Verbal IQ (VIQ) and Performance IQ (PIQ) were analyzed in a 3 (Risk Level) X 2 (IQScore) mixed repeated measures ANOVA with repeated measures on IQ Score. The significant maineffect for IQ Score, F (1, 4338) = 5.71, p < .05, indicated that VIQ (M = 136.02, SD = 8.72) was significantly
higher than PIQ (M = 132.72, SD = 9.02).
These results are qualified, however, by a significantRisk X IQ Score interaction, F (2, 4338) =
14.10, p < 001,illustrated in Figure 2. As confirmedby Newman Keul's post-hoc multiple comparisons,children with no risk had significantly higher VIQ scores (M = 136.17, SD = 8.61) than children withonly a Language / Culture risk factor (M = 134.52, SD = 10.10; p < .05) or children with two risk factors
(M = 133.94, SD = 9.09; p < .05). The PIQ scores, however, evidenced a reverse pattern in that PIQscores were significantly lower (p < .05) for children with no risk factors (M = 132.56, SD = 9.05) than
children with only a language/culture risk factor (M = 134.67, SD = 8.89). Lastly, a significant difference
between VIQ and PIQ (p < .05) was found for children with no risk factors.
Figure 2: Risk level by WISC- R IQ score interaction.
1370 No Risk
- - - Lang. /Culture Risk
13611.. 6 Two Risk Factors
1.)
135
z-41
134Nronr111
133
\13
132
Verbal IQ Performance IQ
Wechsle "kale
(1 8 97
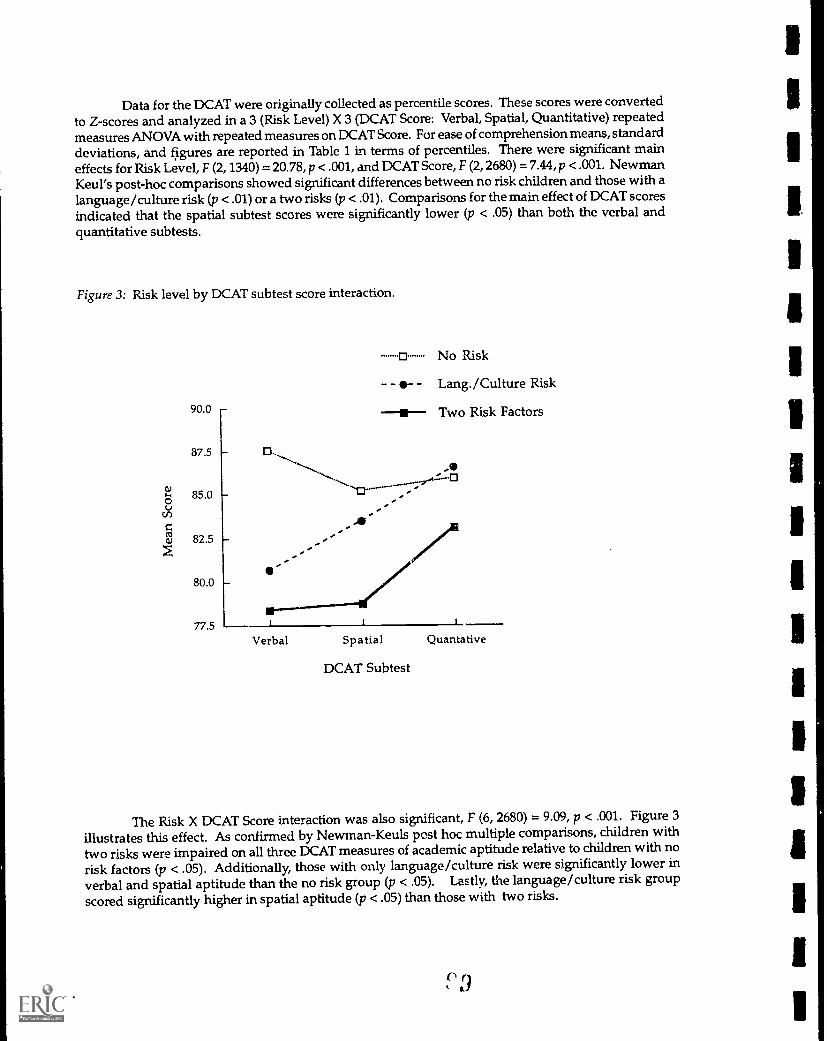
98
Data for the DCAT were originally collected as percentile scores. These scores were convertedto Z-scores and analyzed in a 3 (Risk Level) X 3 (DCAT Score: Verbal, Spatial, Quantitative) repeatedmeasures ANOVA with repeated measures on DCAT Score. For ease of comprehension means, standarddeviations, and figures are reported in Table 1 in terms of percentiles. There were significant maineffects for Risk Level, F (2, 1340) = 20.78, p < .001, and DCAT Score, F (2, 2680) = 7.44, p < .001. NewmanKeul's post-hoc comparisons showed significant differences between no risk children and those with alanguage/culture risk (p < .01) or a two risks (p < .01). Comparisons for the main effect of DCAT scoresindicated that the spatial subtest scores were significantly lower (p < .05) than both the verbal andquantitative subtests.
Figure 3: Risk level by DCAT subtest score interaction.
90.0
87.5
85.0
82.5
80.0
77.5
o No Risk
S- - Lang./Culture Risk
Two Risk Factors
Verbal Spatial Quantative
DCAT Subtest
The Risk X DCAT Score interaction was also significant, F (6, 2680) = 9.09, p < .001. Figure 3
illustrates this effect. As confirmed by Newman-Keuls post hoc multiple comparisons, children withtwo risks were impaired on all three DCAT measures of academic aptitude relative to children with norisk factors (p < .05). Additionally, those with only language/culture risk were significantly lower inverbal and spatial aptitude than the no risk group (p < .05). Lastly, the language/culture risk groupscored significantly higher in spatial aptitude (p < .05) than those with two risks.
9

Table 1Means and Standard Deviations of Z-Scores and Percentiles for the DCAT
DCAT Verbal DCAT Spatial DCAT Quantative Marginals
Z(SD)
Percentile(SD)
Z(SD)
Percentile(SD)
Z(SD)
Percentile(SD)
; Z(SD)
Percentile(SD)
No Risk* 1.39 87.56 1.23 85.20 1.28 85.95 1.30 86.24
(0.78) (12.90) (0.76) (15.87) (0.70) (14.69) : (0.73) (14.48)
Lang/Cult 0.97 80.71 1.03 83.50 1.24 86.57 1.08 83.58
Risk** (0.81) (18.43) (0.86) (18.05) (0.77) (15.72) (0.81) (17.40)
Lang/Cult + 0.89 78.37 0.88 78.79 1.14 83.11 0.97 80.09
Another Risk*** (0.88) (20.65) (0.89) (21.80) (0.79) (20.44) (0.85) (20.96)
Marginals 1.35 85.57 1.25 84.24 1.32 85.71
(0.78) (15.21) (0.77) (17.06) (0.73) (15.61)
n = 1331** n = 305*** n = 329
For those with no risk factors, verbal scores were significantly higher than spatial (p <.01) andquantitative scores. Children with a language/culture risk factor demonstrated the same pattern aschildren with two risk factors in that verbal scores for both groups were significantly depressed comparedto their quantitative scores (p < .05). Additionally, for the group with two risk factors, quantitativescores were significantly higher than spatial scores.
Data for CTBS Scores were analyzed in a 3 (Risk Level) X 3 (C1BS Score: Total Language, Total
Reading, Total Math) repeated measures ANOVA with repeated measures on CTBS Score. As with theprevious ANOVA's, there were significant main effects for Risk Level, F (2, 879) = 9.44, p < .001, and
CTBS Score, F (2, 1758) = 103.16, p < .001. The Risk Level by CTBS Score interaction was also significant,
F (4, 1758) =3.49, p < .01.
The main effect for Risk Level showed that children with no risk factors (M = 7.89, SD = 1.05)performed at a significantly higher level (p < .05) than those with two risk factors (M = 7.56, SD = 1.21).
The main effect for CTBS showed that CT13S Total Math Scores (M = 8.25, SD = 1.05) were significantlyhigher (p < .01) than both Total Reading (M = 7.52, SD = 1.08) and Total Language scores (M = 7.68,
SD = 1.10).
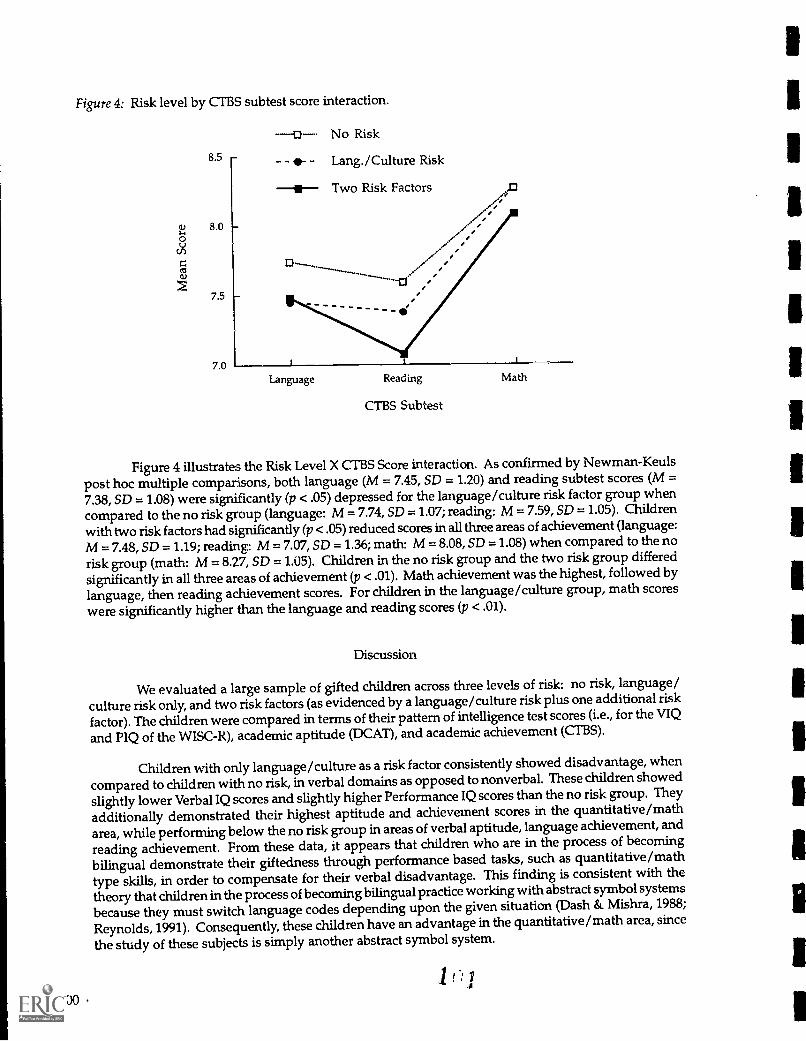
Figure 4: Risk level by CTBS subtest score interaction.
No Risk
8.5 - - - Lang./Culture Risk
Two Risk Factors
cu 8.0 ///8
z
7.5
---------- 4.1
7.0Language Reading
CTBS Subtest
Math
Figure 4 illustrates the Risk Level X C 113S Score interaction. As confirmed by Newman-Keulspost hoc multiple comparisons, both language (M = 7.45, SD = 1.20) and reading subtest scores (M =7.38, SD = 1.08) were significantly (p < .05) depressed for the language/culture risk factor group whencompared to the no risk group (language: M = 7.74, SD = 1.07;reading: M = 7.59, SD = 1.05). Childrenwith two risk factors had significantly (p < .05) reduced scores in all three areas of achievement (language:M = 7.48, SD =1.19; reading: M = 7.07, SD = 1.36; math: M = 8.08, SD = 1.08) when compared to the norisk group (math: M = 8.27, SD = 1.05). Children in the no risk group and the two risk group differedsignificantly in all three areas of achievement (p < .01). Math achievement was the highest, followed bylanguage, then reading achievement scores. For children in the language/culture group, math scores
were significantly higher than the language and reading scores (p < .01).
Discussion
We evaluated a large sample of gifted children across three levels of risk: no risk, language/culture risk only, and two risk factors (as evidenced by a language/culture risk plus one additional riskfactor). The children were compared in terms of their pattern of intelligence test scores (i.e., for the VIQ
and PIQ of the WISC-R), academic aptitude (DCAT), and academic achievement (CFBS).
Children with only language/culture as a risk factor consistently showed disadvantage, whencompared to children with no risk, in verbal domains as opposed to nonverbal. These children showedslightly lower Verbal IQ scores and slightly higherPerformance IQ scores than the no risk group. They
additionally demonstrated their highest aptitude and achievement scores in the quantitative/math
area, while performing below the no risk group in areas of verbal aptitude, language achievement, and
reading achievement. From these data, it appears that children who are in the process of becoming
bilingual demonstrate their giftedness through performance based tasks, such as quantitative/math
type skills, in order to compensate for their verbal disadvantage. This finding is consistent with the
theory that children in the process of becomingbilingual practice working with abstract symbol systems
because they must switch language codes depending upon the given situation (Dash & Mishra, 1988;
Reynolds, 1991). Consequently, these childrenhave an advantage in the quantitative/math area, since
the study of these subjects is simply another abstract symbol system.
100
Children with two risk factors demonstrated the same pattern of test scores as the language/culture risk children. The results are more devastating for the high risk group, however, because theirscores were even more depressed compared to the no risk children.
Overall, the data indicate that language/culture acts as a significant risk factor for those childrenevaluated for gifted education. Because of limited English skills when tested, these children may oftenbe excluded from programs in which they would excel if they were competent in classroom English.These data support Cummin's (1976) subtractive hypothesis that while these children are becomingcompetent in English, their bilingualism hinders-the complete expression of their abilities. The language;culture risk children whc were certified gifted with the WISC-R in this samplemight actually be expectedto show improvements in their IQ scores once English proficiency is obtained, given the generally highPerformance IQs. There may be an even larger number of children who have been excluded fromgifted education because their Performance IQs could not compensate for their current level of VerbalIQ performance, when verbal tests such as the WISC-R are used as the criterion for giftedness.
Children who are not native English speakers in the U.S. are often at a disadvantage in theeducational system because o: their lack of verbal proficiency. Present data indicate, however, that thestrengths of these children can be found in nonverbal areas. The data also highlight the special needsand vulneralilities that children with language risk have in all areas of verbal ability Are these strengthsand weaknesses only indicative of an English language deficiency, or are there additional variables,perhaps involving cultural discrepancies, that account for the language/culture risk group's patternsof test results? Once fluency is obtained in English for these at risk children, do their test patterns moreclosely resemble these of no risk children? Further research is needed to shed light on these questions.
1 2 . 101 .
CHAPTER 4
Information-Processing in Gifted Versus Nongifted African-American, Latino, Filipino,and White Children: Speeded Versus Nonspeeded Paradigms
Dennis P. Saccuzzo, Nancy E. Johnson, and Tracey L. Guertin
San Diego State University
Funded by Grant #R206A00569, Jacob Javits Discretionary Grant Program, U.S.Department of Education. Direct requests for reprints to Dennis P. Saccuzzo, San DiegoState University, 6363 Alvarado Court, Suite 103, San Diego, CA 92120-4913.
The authors wish to thank Gerald Larson for providing the battery of tasks andfor valuable input into this study. The authors also express theirappreciation to the SanDiego City Schools, to Gifted and Talented Education (GATE) Administrator DavidHermanson, and to the following school psychologists: Will Boggess, Marcia Dome, EvaJarosz, Dimaris Michalek, Lorraine Rouse, Ben Sy, and Daniel Williams.
Correspondence concerning this article should be addressed to Dennis P. Saccuzzo,Joint San Diego State/University of California, San Diego Clinical Training Program, 6363Alvarado Court, Suite 103, San Diego, California 921204913 (Telephone: 619-594-2844 /FAX: 619-594-6780 / e-mail: [email protected]).
© 1994Do not reproduce in any form without express written permission from the authors.
. 103 .
3
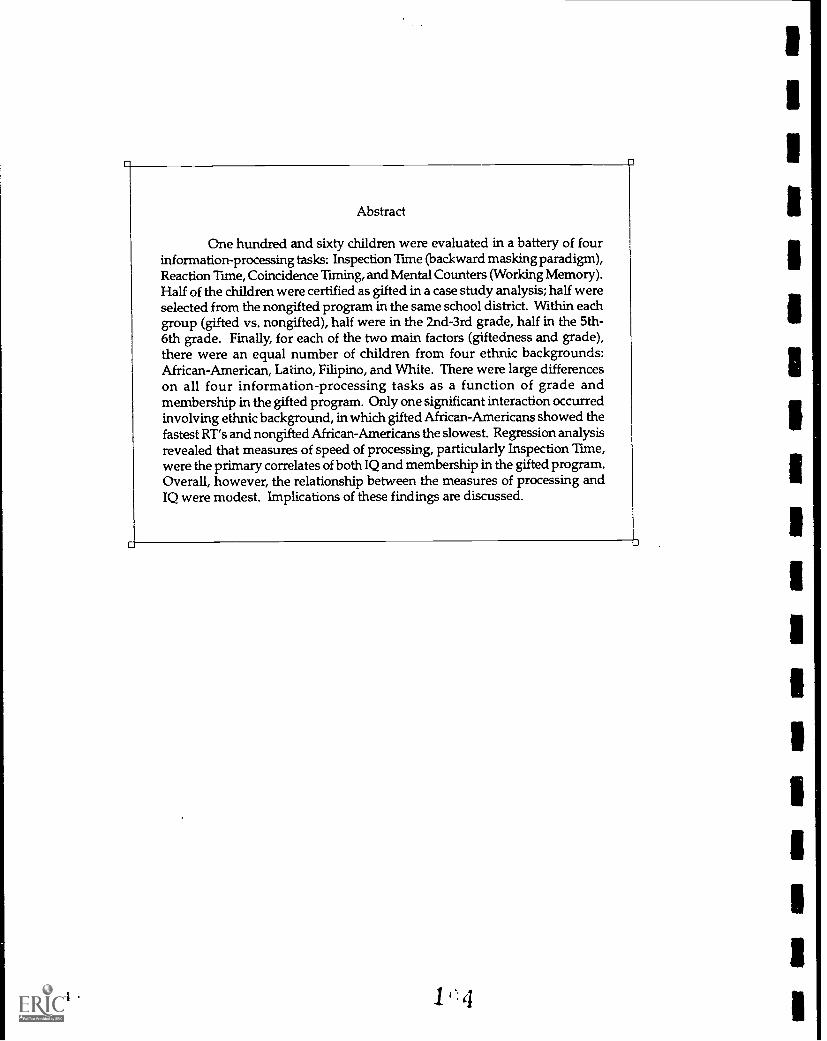
104
Abstract
One hundred and sixty children were evaluated in a battery of fourinformation-processing tasks: Inspection Time (backward masking paradigm),Reaction Time, Coincidence Timing, and Mental Counters (Working Memory).Half of the children were certified as gifted in a case study analysis; half wereselected from the nongifted program in the same school district. Within eachgroup (gifted vs. nongifted), half were in the 2nd-3rd grade, half in the 5th-6th grade. Finally, for each of the two main factors (giftedness and grade),there were an equal number of children from four ethnic backgrounds:African-American, Ladno, Filipino, and White. There were large differenceson all four information-processing tasks as a function of grade andmembership in the gifted program. Only one significant interaction occurredinvolving ethnic background, in which gifted African-Americans showed thefastest RT's and nongifted African-Americans the slowest. Regression analysisrevealed that measures of speed of processing, particularly Inspection Time,were the primary correlates of both IQ and membership in the gifted program.Overall, however, the relationship between the measures of processing andIQ were modest. Implications of these findings are discussed.
1 4

Information-Processing in Gifted vs. Nongifted African-American, Latino, Filipino, and WhiteChildren: Speeded vs. Nonspeeded Paradigms
A relatively little-used nontraditional method of selecting children from diverse backgroundsfor gifted programs involves the analysis of information-processing abilities (Grinder, 1985; Sternberg,
1981). As Horowitz and O'Brien (1986) noted, "If different subcultures in the U. S. foster different styles
of thinking on different strategies of information processing, then it should be possible to identify anddescribe these for each population" (p. 1148). Alternately, measures of information-processing mayprovide an unbiased method of selecting for giftedness.
Wagner and Sternberg (1984) identified information-processing as oneof three main approaches
to the concept of intelligence. The other two were the psychometric approach, which uses traditionalstandardized tests, and the Piagetian approach, which is based on Piaget's theory of cognitivedevelopment. In the information-processing approach, researchers attempt to analyze responses in
terms of the basic component processes that underlie them. For example, information-processing begins
initially with input of external stimulation. This input is then stored or held in a short-term storage orworking memory system while analytical processes are performed. The results of this analysis aresubsequently transferred to other systems, such as long-term memory, where new incoming information
can be compared to one's present store of knowledge so that an appropriate response can be made.
Theoretically, faster or more efficient information processors arebetter able to learn and to solve problems.
Indeed, reviews of an extensive literature have supported the view that the speed or efficiency withwhich an individual can execute a small number of basic cognitive processes is highly related to one'sperformance on psychometric tests of intelligence such as the Wechsler Intelligence Scales and RavenProgressive Matrices Test (Jensen, 1982; Jensen & Reed, 1990; Larson & Rim land, 1984; Vernon, 1987;
Vernon, Nador, & Kantor, 1985).
Thus far, two main variations of the information-processing approach have been advanced.
Sternberg's (1981) theory emphasizes complex processes"metacomponential" or executive skills, such
as problem recognition, process selection, strategy selection, and solution monitoring. Sternberg's theory
stresses the role of the ability to make inferences and apply previously made inferences to new domains,
and of learning skills such as encoding and retrieval of information from long-term memory storage(Sternberg & Davidson, 1983). Although promising, this approach presently lacks a standard and widely
accepted set of tasks to evaluate the various stages of processing. In addition, many of the skills arehighly dependent on verbal ability, which may make them less suitable in selecting disadvantaged
child ren.
A second information-processing approach, the one evaluated in the present study, attempts to
tap into a basic ability that theoretically underlies performance on more complex tasks through the use
of elementary cognitive tasks (Hunt, 1978; Jensen, 1982, 1987) that evaluate speed of information-
processing. According to this view, gifted children are faster in their ability to encode and manipulate
environmental input and to retrieve and analyze existing knowledge. Consistent with this speed of
processing theory, Saccuzzo, Larson, and Rimland (1986) found that several measures of visual and
auditory speed of processing, which contained little or no complex problem solving skills and required
minimal language skills (only the ability to understand instructions) shared significant common variance
with conventional standardized psychometric tests that did contain a high degreeof intellectual content
and involved complex problem solving.
Empirical support for a relationship between processing speed and individual 4.14i-rences in
intelligence has come from reaction time studies that manipulate the level of uncerta loty to which a
subject must respond (Jensen, 1979; Jensen & Munro, 1979; Jensen & Reed, 1990; Lunneborg, 1978;
Smith & Stanley, 1983; Vernon, 1981). Using parameters such as median reaction time, slope of reaction
time as a function of the number of bits, and intraindividual standard deviations of reaction time
. 105 .
1 5

106
performance, investigators have reported large differences between retarded persons and those ofnormal IQ, as well as between vocational-college students and university students (Jensen 1980; 1982).Based on his own findings and a survey of the literature,Jensen (1982) estimated the correlation between
reaction time and individual differences on IQ tests to be between -.3 and -.4. The correlations varywidely across samples, however (Lunneborg, 1978).
A number of investigators have found support for a relationship between speed of processing
and giftedness (Span & Overtoom-Corsmit, 1986). Cohn, Carlson, and Jensen (1985), for example,
found that gifted children differed fundamentallyfrom average children in their speed of information-processing as evaluated in a reaction time paradigm. Cohn et al. (1985) compared a group of "bright-average" 7th-grade children to a group of academically gifted children of comparable age who weretaking college-level courses in mathematics and science. Large and significant group differences were
found on each of nine elementary reaction-time measures of speed of information-processing.
A second line of investigation, the study of speed of visual information-processing, also hassupported a relationship between processing speed and performance on complex cognitive tasks. Inthe typical visual paradigm, the subject makes a discrimination for a briefly exposed " target" stimulus,
such as identifying which of two lines presented to the right and left of central fixation is longer. The
target stimulus is followed by a spatially overlapping non-informational mask ( e.g., a uniform linethat completely superimposes the lines of the target stimulus). An extensive literature on the masking
task itself reveals that it limits the duration that the informational impulse provided by the target isavailable for processing in the central nervous systemTelsten & Wasserman, 1980). Speed of processing,
or "Inspection Time" as it is usually called (Vickers, Nettelbeck, & Willson, 1971), is estimated by either
systematically varying the exposure duration of the target and estimating the minimum duration neededfor criterion accuracy (Lally & Nettlebeck, 1977; Nettelbeck & Lally, 1976), or by keeping the stimulusduration constant and varying the interval between the target and mask (Saccuzzo, Kerr, Marcus, &
Brown, 1979; Saccuzzo & Marcus, 1983).
Numerous studies have reported a statistically significantdifference between mentally retarded
and non-retarded (average IQ) individuals in inspection time as evaluated in a backward maskingparadigm. Such differences occur in spite of wide variations in the nature of the stimulus, method ofstimulus presentation, and technique used to estimate visual processing speed (Saccuzzo & Michael,
1984). There are, moreover, clear-cut developmental differences. The general finding is a directrelationship between chronological as well as mental age and performance (Blake, 1974; Liss & Haith,
1970; Saccuzzo et aL, 1979). Finally, the evidence supports a significant relationship between degrees
of normal intelligence and visual processing speed; however, the magnitude of the relationship remainscontroversial (Mackintosh, 1981; Nettelbeck, 1982).
Though an early study reported an astonishing -.92 correlation between scores on thePerformance Scale of the Wechsler Adult Intelligence Scale (WAIS) and Inspection Time (Nettelbeck &
Lally, 1976), most subsequent investigators found a less spectacular, but significant, relationship between
Inspection Time arid intelligence, with a median correlation of about -.45. These positive findings have
been criticized, however, on methodological groundssmall sample sizes (usually no more than 25subjects); the inclusion of mentally retarded persons, which greatly inflates the correlation due to the
extremely disparate range of performance relative to the sample size; and analyses based only on
extreme scoring subjects, which, again, is well-kriown to inflate correlations (Irwin, 1984; Nettelbeck,
1982).
Nettelbeck (1982) took a careful look at his own and others' work in the area. Nettelbeck'sanalysis revealed a relatively small but consistent association between intelligence and Inspection Time.
Irwin (1984) similarly found modest but significant correlations between Inspection Time and intelligence
test performance. More recently, Nettlebeck (1987) provided an estimate of -.50 as the relationship
between Inspection Time (IT) and intelligence. This estimate was subsequently confirmed by Kranzler
and Jensen (1989) in a meta-analysis. Based on an extensive literature review and meta-analytic
procedures, Kranzler and Jensen estimated that for adults, with general measures of IQ, the IT-
intelligence correlation is about -.54 after correction for the effects of artifactual sources of error, and
1 6

-.30 prior to correction. Despite these promising findings, more work is needed to determine if giftedchildren can be distinguished from nongift children on IT tasks, and whether they can be sodistinguished in an unbiased manner.
A few studies have attempted to examine racial differences in speed of information processing.In a reaction time study, Lynn and Holmshaw (1990) compared 350 black South African 9-year-oldchildren with 239 white British children on 12 reaction time tests. While the black children had slowerdecision times and greater variability than the whitechildren, there were also tremendous IQ differencesbetween the groups. The black children's mean Raven IQ corresponded to the first percentile and wasequivalent to an IQ of about 65. The white children, by contrast, were in the 56th percentile, with anequivalent Raven IQ of 102. Because the black sample in this study was lower in IQ than is generallyfound for U.S. samples, these results have little, if any, generalizability to American black and white
populations.
A study of racial differences in a backward masking paradigm is similarly limited. Bosco (1972)compared the performance of first- and sixth-grade black and white school children. There.were cleardifferences in socioeconomic status between the whites, who were selected from a suburban area, and
the blacks, who were selected from the inner city Since race and socioeconomic background wereconfounded, the issue of the relationship between race and IT was unresolved.
To date, studies of information-processing and intelligence have focused on speed, with telatively
little attention given to other information-processing tasks that might also underlie intelligent behavior.
One such task is coincidence timing (CT), a task that requires subjects to respond at the instant two
objects intersect or "coincide" (Dunham, 1977; Poulton, 1950).
Smith and McPhee (1987) traced the history of coincidence timing (Dorfman, 1977; Poulton,
1950; Thomas, Gallagher, & Purvis, 1981). As Smith and McPhee noted, coincidence timing relates to
such everyday tasks as stepping on and off escalators, picking up an object on a conveyor belt, and
predicting when one's chaliging of lanes on the freeway will coincide with a gap in traffic. In more
primitive societies, coincidence timing also had survival value, as in predicting where to aim a spear to
hit a moving animal. Coincidence timing tasks require subjects to attend to changing conditions, integrate
information over time, and use that information to predict a future event (Smith & McPhee, 1987).
Smith and McPhee conducted the first published attempt to determine if a correlation exists
between psychometric intelligence, as evaluated by the Standard Raven Progressive MatricesTest, and
a coincidence timing task. These investigators administered a 10 minute CT task to 56 males and females
of "high" to "moderate to high" socioeconomic status. Subjects were required to press a key at the very
moment a moving target touched (coincided with) a stationary line. There was a significant negative
correlation (-.294) between the number of errors on the CT task and Raven scores. In addition, there
was a significant negative correlation (-.359) between intrasubject standard deviation (consistency of
performance) and Raven scores.
As Larson (1989) noted, the correlation between Raven scores and coincidence timing adds a
new dimension to the well-known correlation between psychometric intelligence and information-
processing tasks in that, unlike previous tasks such as reaction time, coincidence timing does not require
speed of processing, but rather attention and estimation. Thus, the task has potential foradding to the
range of relatively simple tasks devoid of intellectual content that maybe related to, and perhaps underlie,
tests involving complex problemsolving such as the Raven. Larson (1989) confirmed Smith and McPhee's
finding of a significant relationship between the CT task and psychometric intelligence, as measured
by the Armed Forces Qualifying Test (AFQT), in a group of 127 male Navy recruits. To date, however,
it has yet to be determined if a coincidence timing task can distinguish gifted and nongifted children, or
whether there are ethnic differences in this skill.
A question raised by Larson (1989) is whether some variable might underlie performance on
reaction time, inspection time, and coincidence timing. One such common variable, according to Larson,
may be working memorythe hypothetical cognitive work space for problem solving. As Larson
(1989) noted, working memory provides a theoretical bridge between simple cognitive tasks and
1 7. 107 .
psychometric tests, based on concepts such as "representational agility and/or fidelity" (p. 366). In thepresent study, we attempted to provide a direct test of Larson's theoretical bridge hypothesis throughthe use of a microcomputerized task of working memory called mental counters (Larson, 1986).
108
Method
Subjects:
Eighty children who had been certified as gifted by a school psychologist were compared to amatched sample of eighty nongifted children. For each of these two samples (gifted and nongifted)there were forty 2nd- to 3rd-grade children and forty 5th- to 6th-grade children. Each of the foursubgroups of forty children had 10 African-American, 10 Filipino, 10 Latino/Hispanic, and 10 Whitechildren. The nongifted children were matched to the gifted children on the basis of age, race, andschool district.
Procedure:
Giftedness was determined individually for each child by a school psychologist in acomprehensive case study analysis. This analysis considered recommendations by parents or teachers,a behavior checklist, achievement, standardized tests scores, and the presence of risk factors includingeconomic disadvantage, cultural differences, English as a second language, and negative environments.Each child was given a battery of microcomputerized tests as follows: Inspection Time (IT), ChoiceReaction Tune (CRT), Coincidence Timing (CT), and Mental Counters (MC). These tests were presentedon an IBM PC / XT microcomputer with a black and white monitor and standard keyboard. The testswere administered in counterbalanced order in one session, which lasted approximately one hour.Subjects were administered a standard Raven in a separate, second session. All subjects, and theirparents, provided voluntary written informed consent for their participation. Nevertheless, one schooldistrict refused to allow the administration of the Raven; 18 children (11 gifted) did not receive theRaven. The specific parameters for each task in the information-processing battery are described below.
Inspection Time (IT). The inspection time (IT) task was a non-adaptive procedure based on themethods of Larson and Rim land (1984) and Saccuzzo and Larson (1987) and described in detail byLarson and Saccuzzo (1989). A target stimulus consisting of two horizontal lines of unequal length (17.5mm and 14.3 mm) was briefly presented in the center of the computer monitor. The two lines appearedto the right and left of central fixation, with the longer appearing right or left on a random basis.Immediately following termination of the target, a backward visual noise mask, consisting of a singlehorizontal line that completely superimposed spatially on the target, was presented. The mask is knownto limit the duration of the sensory signal delivered to the central nervous system by the target (Felsten& Wasserman, 1980). Targets were presented at one of five completely randomized stimulus durations:16.7, 33.4, 66.8, 102.2, and 150.3 msec, which corresponded to 1, 2, 4, 6, and 9 refresh cycles on the videomonitor. There were 10 trials per stimulus duration, for a total of 50 trials. The subject's task was tomake a forced-choice discrimination, indicating which of the two lines of the target is longer, by pressingone of two keys on the microcomputer keyboard. The task began with a set of instructions, examples,and practice to criterion prior to the test proper. Subjects were given computer-generated visual feedbackon their performance.
Choice Reaction Time (Hick Paradigm). A Hick paradigm for a 1,3, and 5 choice reaction time task,as described by Saccuzzo et al. (1986) and Larson and Saccuzzo (1989), was used to evaluate choicereaction time performance. A horizontal arrangement of lights was presented at the bottom of themonitor. All subjects were presented with 1-,3-, and 5-choice conditions, with order of presentationcompletely randomized. Open squares on the monitor were used as stimulus lights. Subjects respondedby pressing the space bar as soon as a square was illuminated. The subject's forefinger rested lightly onthe space bar, so that there was essentially no movement time involved. Previous research has shownthat this "no movement" reaction time task is as effective as more traditional reaction time tasks involvingmovement (Kostas, Saccuzzo, Larson, 1987), and has the advantage of minimizing errors that occur dueto the necessity of pressing two keys in the movement time paradigm. In this procedure, the subjectviews the monitor on which there are one, three, or five line drawn squares. After a random period of
1. 8
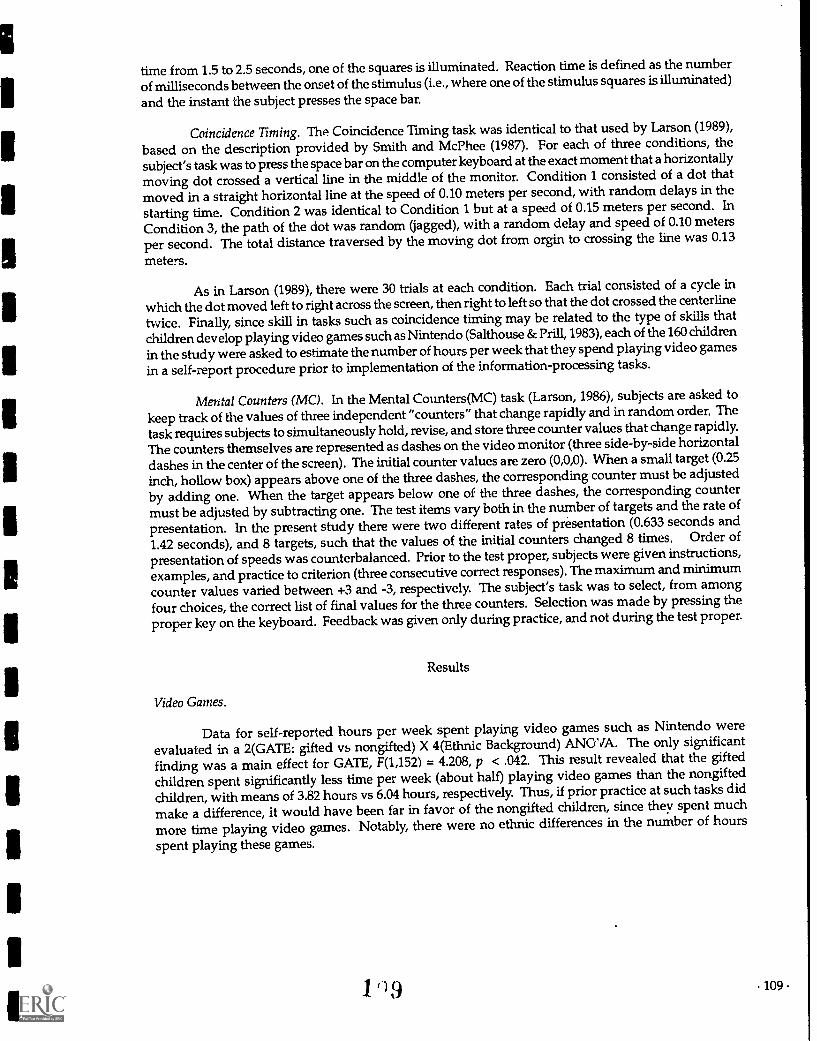
time from 1.5 to 2.5 seconds, one of the squares is illuminated. Reaction time is defined as the numberof milliseconds between the onset of the stimulus (i.e., where one of the stimulus squares is illuminated)and the instant the subject presses the space bar.
Coincidence Timing. The Coincidence Tuning task was identical to that used by Larson (1989),
based on the description provided by Smith and McPhee (1987). For each of three conditions, thesubject's task was to press the space bar on the computer keyboard at the exact moment that a horizontally
moving dot crossed a vertical line in the middle of the monitor. Condition 1 consisted of a dot thatmoved in a straight horizontal line at the speed of 0.10 meters per second, with random delays in thestarting time. Condition 2 was identical to Condition 1 but at a speed of 0.15 meters per second. In
Condition 3, the path of the dot was random (jagged), with a random delay and speed of 0.10 meters
per second. The total distance traversed by the moving dot from orgin to crossing the line was 0.13
meters.
As in Larson (1989), there were 30 trials at each condition. Each trial consisted of a cycle inwhich the dot moved left to right across the screen, then right to left so that the dot crossed the centerlinetwice. Finally, since skill in tasks such as coincidence timing may be related to the type of skills thatchildren develop playing video games such as Nintendo (Salthouse & Prill, 1983), each of the 160 children
in the study were asked to estimate the number of hours per week that they spend playing video games
in a self-report procedure prior to implementation of the information-processing tasks.
Mental Counters (MC). In the Mental Counters(MC) task (Larson, 1986), subjects are asked to
keep track of the values of three independent "counters" that change rapidly and in random order. Thetask requires subjects to simultaneously hold, revise, and store three counter values that change rapidly.The counters themselves are represented as dashes on the video monitor (three side-by-side horizontaldashes in the center of the screen). The initial counter values are zero (0,0,0). Wnen a small target (0.25
inch, hollow box) appears above one of the three dashes, the corresponding counter must be adjustedby adding one. When the target appears below one of the three dashes, the corresponding countermust be adjusted by subtracting one. The test items vary both in the number of targets and the rate of
presentation. In the present study there were two different rates of presentation (0.633 seconds and1.42 seconds), and 8 targets, such that the values of the initial counters changed 8 times. Order of
presentation of speeds was counterbalanced. Prior to the test proper, subjects were given instructions,examples, and practice to criterion (three consecutive correct responses). The maximum and minimum
counter values varied between +3 and -3, respectively. The subject's task was to select, from amongfour choices, the correct list of final values for the three counters. Selection was made by pressing the
proper key on the keyboard. Feedback was given only during practice, and not during the test proper.
Results
Video Games.
Data for self-reported hours per week spent playing video games such as Nintendo wereevaluated in a 2(GATE: gifted vs nongifted) X 4(Ethnic Background) ANO'IA. The only significant
finding was a main effect for GATE, F(1,152) = 4.208, p < .042. This result revealed that the gifted
children spent significantly less time per week (about half) playing video games than the nongifted
children, with means of 3.82 hours vs 6.04 hours, respectively. Thus, if prior practice at such tasks did
make a difference, it would have been far in favor of the nongifted children, since they spent much
more time playing video games. Notably, there were no ethnic differences in the number of hours
spent playing these games.
1 9 . 109

110
Raven.
Table 1 shows the Raven scores for gifted vs nongifted children as a function of ethnicbackground. The table shows the average Raven Z scores based on the U.S. smoothed norms providedby Raven et al (1986). These data were subjected to a 2(GATE) X 2(Grade) X 4(Ethnic Background)ANOVA. As might be expected, there was a significant main effect, F(1,135) = 42.69, p < .001, for Gifted(M = 1.11, SD = .92) vs Nongifted(M = .02, SD = 1.0) children. The only other significant finding was aGATE X Ethnic Background interaction, F(3,135) = 3.58, p < .05. Newman-Keuls post hoc multiplecomparison tests of this difference revealed the gifted White, African-American, and Filipino childrendid not differ significantly among themselves and all three of these groups were significantly higherthan the gifted Latino children and each of the four nongifted groups, none of whom differed significantlyamong themselves. It should be noted, however, that of the 11 gifted children who did not receiveRaven, 6 were in the Latino group. The absence of these children may have artificially lowered theoverall mean for the L,atino children.
Table 1.
Raven Z-Scores as a Function of Ethnic Background for Gifted versus Nongifted Children
Latino /Hisparuc White African-American
Gifted Nongifted Gifted Nongifted
0.51 0.36 1.36 0.01
SD 1.17 0.79 0.78 0.81
Gifted Nongffted
1.34 -0.38
0.58 0.92
Filipino
Gifted Nongifted
1.09 0.16
0.95 1.31
For each of the four information-processsing variables, all F values, silificance levels, means,and standard deviations are presented in Table 2 to conserve space. Whereas Grade reflects differencesbetween 5th and 6th versus 2nd and 3rd graders, GATE reflects differences between Gifted versusNongifted children, and Condition reflects the condition under study, such as Stimulus Duration, Choices,and Fast vs. Slow.
0

Table 2Summary of significant findings
Significant Effects df Level A4 SD
Inspection TimeMain Effect: Grade 1/140 36.73*** 5th - 6th Grade 66.17 13.19
2nd - 3rd Grade 57.50 14.68
Main Effect: GATE 1/140 7.84** Gifted 63.78 14.62Nongifted 59.83 15.01
Main Effect: 4/560 80.12*** Duration 1 52 10.7
Stimulus Duration Duration 2 57 13.4Duration 3 57 15.7Duration 4 68 17.2Duration 5 74 18.3
Grade X Inspection Time 4/560 8.73***
GATE X Inspection Tmie 4/560 3.76**
Reaction Time (msec)Main Effect: Grade 1/135 56.83*** 5th - 6th Grade 383 90.55
2nd - 3rd Grade 564 133.47
Main Effect: GATE 1/135 6.21* Gifted 422 113.75Nongifted 467 139.70
Main Effect: Choices 2/278 141.99*** One Choice 384 117.71
Three Choices 454 127.01
Five Choices 479 142.00
Grade X Choices 2/278 4.17*
GATE X Choices 2/278 5.08**
GATE X Ethnicity 3/139 3.23*
Coincidence Timing (Errors)Main Effect: Grade 1 /140 36.27*** 5th - 6th Grade 18.34 7.51
2nd - 3rd Grade 29.16 17.87
Main Effect: GATE 1 /140 19.95*** Gifted 19.80 8.89Nongifted 27.73 18.01
Main Effect: Condition 2/280 94.76*** Slow, NonVariable 16.95 11.39
Fast, NonVariable 25.18 14.69Random 29.32 18.21
Grade X Condition 2/280 3.75*
GATE X Condition 2/280 3.58*
Mental CountersMain Effect: Grade 1/112 48.00*** 5th - 6th Grade 10.84 4.11
2nd - 3rd Grade 6.46 3.76
Main Effect: GATE 1/112 7.08** Gifted 9.68 4.34Nongifted 8.34 4.59
Main Effect: Condition 1/112 66.00*** Slow 10.17 5.07Fast 7.87 3.95
Grade X Condition 1/112 8.99**
GATE X Condition 1/112 6.41**
* p < .05** p < .01
*** p .001
1 1 i
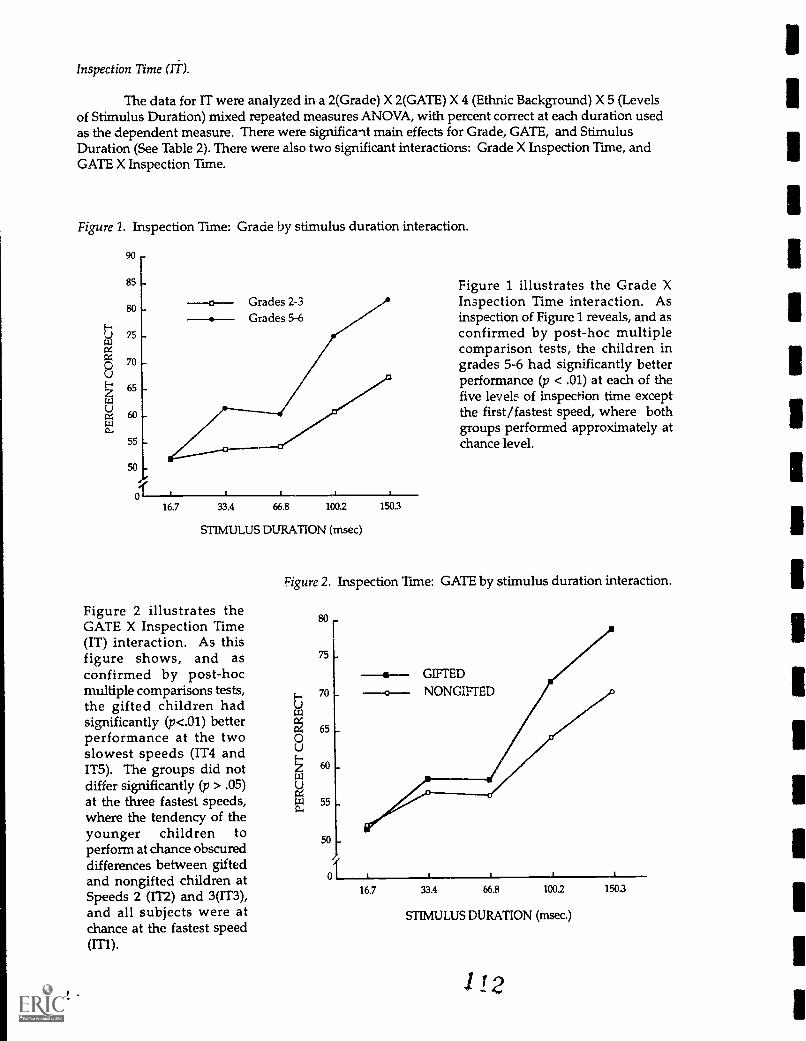
Inspection Time (M.
The data for IT were analyzed in a 2(Grade) X 2(GATE) X 4 (Ethnic Background) X 5 (Levelsof Stimulus Duration) mixed repeated measures ANOVA, with percent correct at each duration usedas the dependent measure. There were significant main effects for Grade, GATE, and StimulusDuration (See Table 2). There were also two significant interactions: Grade X Inspection Time, andGATE X Inspection Time.
Figure 1. Inspection Time: Grade by stimulus duration interaction.
90
85
80
75
70
65
60
55
50
0 1
--a Grades 2-3Grades 5-6
16.7 33.4 66.8 100.2 150.3
STIMULUS DURATION (msec)
Figure 2 illustrates theGATE X Inspection Time(IT) interaction. As thisfigure shows, and asconfirmed by post-hocmultiple comparisons tests,the gifted children hadsignificantly (p<.01) betterperformance at the twoslowest speeds (IT4 andIT5). The groups did notdiffer significantly (p > .05)at the three fastest speeds,where the tendency of theyounger children toperform at chance obscureddifferences between giftedand nongifted children atSpeeds 2 (IT2) and 3(IT3),and all subjects were atchance at the fastest speed(IT1).
112
Figure 1 illustrates the Grade XInspection Time interaction. Asinspection of Figure 1 reveals, and asconfirmed by post-hoc multiplecomparison tests, the children ingrades 5-6 had significantly betterperformance (p < .01) at each of thefive level$ of inspection time exceptthe first/fastest speed, where bothgroups performed approximately atchance level.
Figure 2. Inspection Time: GATE by stimulus duration interaction.
80
75
GIFTED
70 0 NONGIFTEDt.14
650E-
60
PJ 55
50
0L16.7 33.4 66.8 1002 150.3
STIMULUS DURATION (msec.)

Reaction Time.
The median reaction time for each subject was analyzed in a 2(Grade) X 2(GATE) X 4(Ethnic
Background) X 3(Choices) mixed repeated measures ANOVA. There were significant main effects forGrade, GATE, and Choices (See Table 2). There also were three significant interaction effects: Grade XChoices, GATE X Choices, and GATE X Ethnicity.
Figure 3 illustrates theGrade X Choicesinteraction. While thechildren in grades 5-6outperformed the childrenin grades 2-3 at each levelof choice, the differencebetween the groupsincreased as the number ofchoices increased.
Figure 3. Reaction Time: Grade by level of choice interaction.
600
550
500'CI
Z450
5e 400
I-.c4 350
300
o
GRADES 2-3
GRADES 5-6
i 3
LEVEL OF CHOICE
Figure 4. Reaction Time: Gate by level of choice interaction.
550
500
450
400
350
0
GIFTED
o-- NONGIFTED
I
1 3 5
LEVEL OF CHOICE
1 1 3
5
Figure 4 illustrates theGATE X CHOICESinteraction. The groupsdid not differ (p > .05) at theone choice condition, butwere significantly diiferentat the 3 and 5 choiceconditions (p < .01).
113
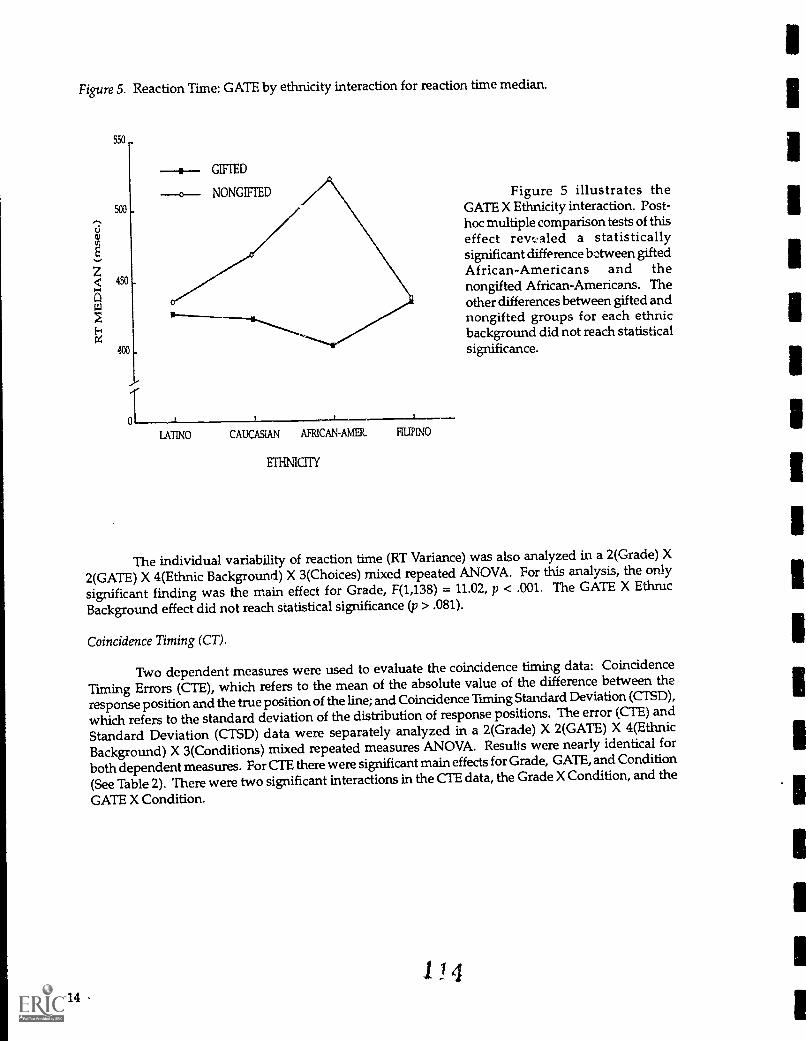
Figure 5. Reaction Time: GATE by ethnicity interaction for reaction time median.
550
450
400
0
GIFTED
0-- NONGIFTED
LATINO CAUCASIAN AFRICAN-AMER. FILIPLNO
ETHNICHT
Figure 5 illustrates theGATE X Ethnicity interaction. Post-hoc multiple comparison tests of thiseffect revealed a statisticallysignificant difference las2tween giftedAfrican-Americans and thenongifted African-Americans. Theother differences between gifted andnongifted groups for each ethnicbackground did not reach statisticalsignificance.
The individual variability of reaction time (RT Variance) was also analyzed in a 2(Grade) X
2(GATE) X 4(Ethnic Background) X 3(Choices) mixed repeated ANOVA. For this analysis, the only
significant finding was the main effect for Grade, F(1,138) = 11.02, p < .001. The GATE X Ethruc
Background effect did not reach statistical significance (p > .081).
Coincidence Timing (CT).
Two dependent measures were used to evaluate the coincidence timing data: Coincidence
Timing Errors (cm), which refers to the mean of the absolute value of the difference between the
response position and the true position of the line; and Coincidence Timing Standard Deviation (CTSD),
which refers to the standard deviation of the distribution of response positions. The error (CTE) and
Standard Deviation (CTSD) data were separately analyzed in a 2(Grade) X 2(GATE) X 4(Ethnic
Background) X 3(Conditions) mixed repeated measures ANOVA. Results were nearly identical for
both dependent measures. For CIE there were significant main effects for Grade, GATE, and Condition
(See Table 2). There were two significant interactions in the CTE data, the Grade X Condition, and the
GATE X Condition.
1 ! 4114

Figure 6 illustrates the Gradeby Condition interaction forthe Coincidence Timingerrors. In this interaction,while the children in grades5-6 outperformed children ingrades 2-3 at all levels, theydid so at a greater rate for thevariable condition (Condition3).
40
35
30
0 25
Z< 20
15 _
0 1
Figure 6. Grade by condition interaction (crE).
a GRADES 2-3---.--- GRADES 5-6
Figure 7. Gate by condition interaction (C.1 h).
40
30
1 2
CONDITION
. GIFTED
o-- NONGIFTED
1 2
CONDI110N
3
3
Figure 7 illustrates the GATE XCondition interaction, and againshows the greatest differenceoccurring between the groupsunder the variable condition(Condition 3).
The analysis of standard deviations produced all the same main effects as well as a GATE X
Condition interaction. The only difference between the two measures was that the Grade X Condition
interaction did not reach statistical significance for the standard deviation data. For both CT measures,
there were no main or interaction effects involving ethnicity.
1?5

Mental Counters.
For the Mental Counters Test, the number of correct responses was analyzed in a 2(Grade) X2(GATE) X 4(Ethnic Background) X 2(Conditions - Fast and Slow) mixed repeated measures ANOVA.Results were parallel to those obtained with Inspection Time and Coincidence Timing. There were thefamiliar main effects for Grade, GATE, and Condition. As with the prior analyses, there were twosignificant interactions: Grade X Condition, and GATE X Condition. Figures 8 and 9 illustrate these
interactions.
Figure 8. Mental Counters: Grade by condition interaction.
0
14
13
12
11
10 o--- GRADES 2-3
9
8
7
6
5
GRADES 5-6
ofFAST SLOW
CONDITION
In the GATE by Conditiuninteraction, as shown inFigure 9, the differencesbetween the groups weresignificant (p < .01) only atthe slow speed.
116
In the Grade X Conditioninteraction, as shown inFigure 8, the children ingrades 5-6 outperformedchildren in grades 2-3 at bothconditions, but did so at agreater rate for the slowcondition.
Figure 9. Mental Counters: Gate by condition interaction.
12
11
U 10
C4
0U 9
Po
8
7
0
FAST
CONDITION
SLOW

Other Analyses.
Multiple regression analysis was used to determine the information-processing predictors ofRaven IQ scores and of placement in the GATE program. First, the following variables were used topredict Raven scores in a stepwise multiple regression: the five levels of inspection time, (IT1, IT2...IT5);each of the three reaction time choices for both variability and median RT; each of the three conditionsof coincidence timing for both errors (CTE) and standarddeviation (CTSD); and the two levels of mental
counters. Dn ly one of these information-processing variables, IT4(Inspection Time, duration 4) enteredinto the equation and produced a significant F value, F(1,102) = 13.38, p < .0004. The multiple R betweenIT4 and the Raven was .34. Next, each of the above information-processing variables were used topredict GATE membership in a stepwise regression analysis. Three variables were significant inpredicting GATE status: IT5, F(1, 118) = 8.45, p < .005, CTSD(condition 3), F2, 117 = 6.65, p < .002, and
reaction time variance (5 choice condition), F(3, 116 = 6.13), p < .001. The multiple R between IT5 andGATE membership was .258. Adding in CTSD (condition 3) increased the multiple R to .319. With theaddition of reaction time variance (5 choice condition), the multiple R increased to .370.
Finally, an attempt was made to determine a possible cut-off score for the information-processing
tasks to discriminate gifted from nongifted children. Given that IT5 was the best predictor of GATEmembership, we began with this variable. First, a discriminant analysis was conducted to determinethe best score to discriminate the gifted vs the nongifted children. For IT5, this score was 73.5 percentcorrect. Next, frequency tables were constructed to determine the frequency of gifted vs nongiftedchildren who scored above or below the cut-off. Twenty-one out of 77 gifted children (27 percent)scored below the cut-off; thirty-two out of 79 nongifted children (40 percent) scored above the cut-off.
Results were similar for other information-processing tasks, which suggested that the use of these tasks
to make individual decisions would indeed be hazardous.
Discussion
The present study adds to the literature in being the first toexamine the information-processingabilities of children and the relationship between IQ and information-processing as a function of three
major variables: grade (age), giftedness (as determinedby an individual case study analysis by a schoolpsychologist), and ethnic background. Whereas most of the relevant studies in this field are restricted
to one or at most two measures of information-processing, the present study examined four different
measures, two of which depended heavily on speed of processing (IT and RT) and two of which did not
depend exclusively on speed. All information-processing tasks, however, can best be described aselementary cognitive tasks (ECTs), in that they are essentially devoid of complex content and problem
solving skills.
All of the tasks easily discriminated older children as a group versus younger children. This
finding is consistent with known developmental differences in choice reaction time and backwardmasking paradigms, and further shows that such differences can be extended to coincidence timingand mental counters, which is believed to reflect working memory capacity.
The analyses of gifted versus nongifted differences in specific information-processing abilities
yielded a number of critical interaction effects. For inspection time, gifted and nongifted children did
not differ at the faster stimulus durations, where performance for both groups remained close to chance.
As the stimulus duration increased, significant differences between the groups emerged. These
differences are consistent with faster information-processing in the gifted children. In the reaction time
paradigm, the differences between gifted and nongifted children occurred only for the three and five
choice conditions, and were greater as the number of choices increased. Again, this significant interaction
is consistent with faster processing (i.e., faster decision time) in the gifted group. Similarly, the gi eatest
difference between gifted and nongifted children in coincidence timing occurred for the most variable
condition. In the mental counters task, the fast condition was too difficult for all subjects; chance
performance was the result for both groups. In the slower condition, however, the gifted children
1 1 7117

c'c.arly outperformed the nongifted children. In sum, excluding simple reaction time and a level ofdifficulty so great that virtually all subjects were at chance, the gifted children showed a generalsuperiority across all four elementary cognitive tasks.
The superiority of the gifted children was essentially independent of ethnic background. Therewere no ethnic differences for inspection time, coincidence timing, and mental counters. Median reactiondata did reveal a significant interaction between ethnic background and GATE membership. The giftedAfrican-Americans had the fastest reaction times of all, whereas the nongifted African-Americans hadthe slowest. This result is of interest in that previous RT studies with African-Americans have studiedordy low or, at best, low-average to average IQ African-Americans. The general result has been slowerchoice RT's in the African-Americans compared to Whites. The present results show that among giftedAfrican-Americans, reaction times are at least comparable, if not faster, than among other ethnicbackgrounds. This finding warrants further investigation as it is suggestive of two different subgroupsof African-Americans based on reaction time.
Regression analyses were conducted to determine if the relationships between information-processing and IQ and between information-processing and GATE membership are due to speed ofprocessing, or to a factor (or factors) other than speed. The results revealed that inspection time was theonly siplificant predictor of Raven scores. This finding parallels that of Larson (1989), who used thesame battery of information-processing tasks (except mental counters) on a group of 127 male Navyrecruits. Larson found that inspection time was the only significant predictor of a measure of IQ based
on the Armed Forces Qualifying Test (AFQT).
Three information-processing variables predicted GATE membership: Inspection Time (IT5),Coincidence Timing (CTSD, Condition 3), and Reaction Time (5 Choice RT). The additionalinformation-processing predictors of GATE membership may be attributable to the absence of 18 Raven scores. Onthe other hand, this result more likely reflects the multi-dimensional approach of the casestudy analysisused to select gifted children, as opposed to the use of a score on a single test. ln either case, it is clearthat the predominant underlying factor is speed. Both IT and RT involve speed of processing. Moreover,while Condition 3 of the CT task involves randomness, this task is also faster than Condition 1 of the CTtask and equal in speed to CT2. It is reasonable to conclude that the addition of randomness in CTCondition 3 favored faster processors. In any case, speed of processing clearly was the predominantfactor in the gifted-nongifted differences that were found in the information-processing tasks.
An attempt to identify cut-off scores for the information-processing tasks failed to produce areliable method of discriminating gifted vs nongifted children. Thus, while information-processingtasks may have relevance for our theoretical understanding of giftedness, there are no indications atpresent that such tasks could be used to make decisions about individuals. Much more work will beneeded if such tests are to become practical. Moreover, the relationship between these elementarycognitive tasks and IQ or GATE membership remained low, with multiple correlations of .34 and .37,respectively. These correlations are in line with others reported in the literature. Therefore, it wouldappear that speed of processing by itself is insufficient to account for giftedness or intelligence level,and that the use of a variety of elementary cognitive tasks adds little. Thus, for a full account of individualdifferences in intelligence in terms of information-processing, it would appear necessary to go beyondthe elementary cognitive tasks and examine more complex information-processing skills as suggestedby Sternberg (1981). In order to account for what is being measured by complex IQ tests, it appearsnecessary to examine the full range of information-processing skills.
1 1 8118
CHAPTER 5
Ethnic and Gender Differences in Locus of Control in At Risk Gifted and Nongifted Children
Susan C. McLaughlin and Dennis P. Saccuzzo*
San Diego State University
* This research was funded by Grant R206A00569, U.S. Department of Education, JacobJavits Gifted and Talented Discretionary Grant.
The authors express their appreciation to the San Diego City Schools, to Gifted
and Talented Education (GATE) Administrator David P. Hermanson, and to the followingschool psychologists: Will Boggess, Marcia Dome, Dimaris Michalek, Ben Sy, and Daniel
Thanks should also be expressed to Nancy E. Johnson and Tracey L. Guertin for
their assistance in data collection and analysis.Correspondence concerning this article should be addressed to Dennis P.
Saccuzzo, Joint San Diego State/University of California, San Diego Doctoral TrainingProgram, 6363 Alvarado Court, Suite 103, San Diego, California 92120-4913.
© 1994Do not reproduce in any form without express written permission from the authors.
119
120
Abstract
The effect of ethnicity, gender, and risk on locus of control wereinvestigated for gifted children and for high ability nongifted children. Eighthundred and five 5th through 7th grade African-American, Caucasians,Latino/Hispanic and Filipino children who had been referred for an evaluation ofgiftedness were evaluated in a case study analysis that included anevaluationof intellectual ability and the presence of one or more of six risk factors. Eachchild was given the Nowicki Strickland Locus of Control Scale for Children. A2(Gifted vs. Non Gifted) X 4(Ethnic Background) X 4(Level of Risk) ANOVArevealed significant (p < .01) main effects for Giftedness, Ethnic Background,and Level of Risk, as well as a significant Ethnic X Risk Interaction (p < .038). In
addition, a 2(Gender) X 2(Giftedness) X 4(Ethnic Background) ANOVA yieldeda significant (p < .024) main effect for Gender. Overall, higher internal locus ofcontrol was associated with female Caucasians not at risk. However, in contrastto Caucasians, greater risk was associated with a higher internal locus of controlin nonCaucasians. Results confirm previous findings in showing a more internallocus of control in gifted children, and further indicate that for gifted andintellectually bright nonCaucasians, risk is associated with, and may serve tostrengthen, a greater internal locus of control. Results support the use of locusof control as an alternative in identifying gifted traditionally underrepresentedgroups such as African-Americans and Latino/Hispanics.
1LO

Ethnic and Gender Differences in Locus of Control for Gifted and Nongifted ChildrenWith and Without Risk
Locus of control is a theoretical construct referring to the degree to which a person perceives arelationship between his or her own behaviors and the outcomes of those actions (Rotter, 1966). Themost widely used instrument to measure locus of control is the Internal-External Scale developed byRotter (1966). According to Rotter 's theory, a person who assumes control and responsibility for theevents in his or her life is said to have an internal locus of control. When a person attributesresponsibility to outside sources, such as chance, luck or fate, he or she is said to have an external locusof control. Investigators have found that students who attribute their successes to their own efforts andabilities and their failures to a lack of effort will probably attempt a failed task again. Those studentswho attribute their successes to luck and their failures to lack of ability, however, are less likely to re-attempt a failed task (Payne & Payne, 1989; Weiner, 1977).
In examining several locus of control studies, Rotter found strong support for the hypothesisthat individuals who have a strong belief that they can control their own destinies are likely to a) bemore aware of environmental factors that may influence future behavior; b) take steps to improveenvironmental conditions; c) place greater value on skill or achievement reinforcement; and d) be resistiveto conformity and other subtle attempts to influence their behavior (see Rotten 1966). In a review of theliterature on the locus of control variable, Lefcourt (1976) found that individuals with an internal ratherthan external locus of control were more perceptive, inquisitive and efficient in processing information.
One of the main criticisms of Rotter's Internal-External Scale is that it is not suitable for children.Nowicki and Stricldand have developed a measure to extend the investigation of the locus of controlvariable to children (Nowicki & Strickland, 1973). This measure has been used to examine severaldimensions of child behavior. Empirical findings have revealed that locus of control becomes moreinternal with age (Nowicki & Strickland, 1973; Brown et al., 1984). As children grow older, more isexpected of them and they are given an opportunity to succeed; thus, their perceptions of their ability tocontrol their academic progress will become more internal (Payne & Payne, 1989). Internality has alsobeen associated with higher social class and ethnicity, with middle class whites being most internal(Nowicki & Strickland, 1973; Crandall, Katkovsky & Crandall, 1965).
An extensive body of research has explored the relationship between locus of control andachievement. Nowicki and Strickland (1973) found a negative relationship between the locus of controland achievement of children in grades 3 through 12. As achievement scores went up, external scoreswent down; the children became more internal. This was particularly true for males. Gordon (1977)studied 113 fourth grade children and found that academic achievement, as measured by grades orachievement tests scores, could be predicted by knowing a child's locus of control score. Crandall,Katkovsky and Crandall (1965) measured locus of control with the IAR (Intellectual AchievementResponse) Questionnaire, which is a measure aimed at assessing children's beliefs in reinforcementresponsibility exclusively in intellectual academic situations. They reported that a higher internalityscore on the LAR was positively correlated with at least two measures of academic achiev ement.
Locus of control has been used to assess different populations. Fincham and Barling (1978), forexample, found significant differences in locus of control between learning disabled, normal achievingand gifted children, with learning disabled being the most externally oriented and gifted children theleast externally oriented. Gifted children have been identified as having a greater internal locus ofcontrol than nongifted children (Delisle & Renzulli, 1982; McClelland, Yewchuk, & Mulcahy, 1991).Laffoon, Jenkins-Friedman, and Tollefson (1989) looked at 137 achieving gifted, underachieving giftedand nongifted students in third, fourth and fifth grades. Their results indicated that gifted underachieversand nongifted students were significantly more external than achieving gifted students. They alsofound that the underachieving gifted and nongifted students made significantly more luck attributionsfor their failures.
121
Recently, an area of increasing interest has been in ethnic differences in locus of control (Chiu,1986). Hsieh, Shybut and Lotsof (1969), for example, studied Anglo-American, American Chinese andHong Kong students. Their findings suggested that cultural orientation may be closely related to apersonal belief in internal versus external control. Individuals raised in a culture that valuesindependence, uniqueness, self-reliant individualism, and personal output of energy are likely to bemore internally oriented than individuals from a culture that tends to emphasize a different set ofvalues. Hsieh et al. (1969) also found Anglo-Americans to be more internally oriented than ChineseAmericans who were, in turn, more internally oriented than Hong Kong Chinese, suggesting theimportance of the role that cultural context plays in the socialization process. In another study ofculture and locus of control, Battle and Rotter (1963) compared 80 black and white sixth and eighthgraders. These investigators found middle class whites to be the most internal and lower class blacksto be the most external. Similar findings have been shown in other studies (Nowicki & Strickland,1973; Gurin, Gurin, Lao & Beathe, 1961; Brown, Fulkerson, Fur, Ware & Voight, 1984). Studies ofmotivation and performance of black students suggest that blacks are less likely to hold strong beliefsof internal control and that social class and race probably interact so that lower class blacks stand out asexternally oriented.
In an attempt to explain differences in locus of control, Payne and Payne (1989) hypothesizedthat at-risk children will have a more external locus of control than children not considered at risk. Thepresence of certain external variables such as low socioeconomic status makes a child at risk. In a studyof 643 black and white students classified as either at-risk or not-at-risk, Payne and Payne (1969) foundthat at-risk students had a significantly greater tendency to attribute their achievement and lifeexperiences to external forces and influences. In contrast to other investigators, however, Payne andPayne found no main effect of locus of control for race. Browne and Rife (1991) also looked at locus ofcontrol orientation of at-risk and not-at-risk sixth grade students. They defined at-risk in terms of thefollowing variables: previous grade failures and retentions, attendance, prior disciplinary actions, familyincome, and number of parents in the family. They found that students at risk tended to have a moreexternal locus of control. Studies of risk are limited, however, in that there is a lack of consistency in thedefinitions of at-risk children. In addition, previous studies have failed to consider the amount of riskand level of cognitive ability for each child.
The literature shows that there is a positive relationship between locus of control and academicachievement. To date, however, no one has studied the effects of risk, ethnicity, cognitive ability andgender on the locus of control of children. The present study attempted to fill this gap in the literature.We examined the locus of control scores of children with no risk factors, one risk factor, two risk factorsand three or more risk factors, as described below, to determine the effect of the presence of differentlevels of risk on locus of control. Furthermore, we compared gifted and nongif ted children acrossseveral ethnic categories. Finally, we considered the role of gender.
Method
Subjects:
The subjects consisted of 805 fifth through seventh grade students who had been referred foran evaluation of giftedness and whose parent provided informed consent to include the Locus of ControlScale as an experimental test whose results would not be used in determining giftedness. Of these, 190were Latino/Hispanic, 341 Caucasian, 155 African-American, and 119 Filipino; 435 were female, 370male.
Procedure:
Each child was evaluated for giftedness in a case study evaluation by a school psychologist.The case study considered scores on tests of intelligence and achievement. In addition, each child wasevaluated for the presence of risk factors. A risk factor was operationalized as the presence of one or
122
more of if llowing six variables: environmental, economic, language, culture, social /emotional andhealth. Environmental risk included transiency (three or morechanges in schools) and excessive absencefrom school because of home responsibilities such as child care duties or working to help support thefamily. Economic risk included parental unemployment or low income. Language risk included speakingEnglish as a second language and lack of fluency in English. Cultural risk included cultural values andbeliefs that differ from those of the dominant culture or limited experience in the dominant culture.Emotional risk encompassed such factors as death of a parent, child abuse, major psychiatric illness inthe home, or extended absence of the parent because of military service. Health factors included vision,speech, and hearing deficits that required designateri instructional service; motor problems that requiredadaptive physical education; or diseases that caused absences or hampered school progress, such asasthma or diabetes. Of the subjects, 85 had no risk factors, 114 had one risk factor, 236 had two risk
factors, 370 had 3 or more risk factors.
At the time of their evaluation for giftedness, each child was given the Nowicki StricklandInternal External Locus of Control Scale for Children (NSLOCS). The NSLOCS is a 40 item paper andpencil instrument in which the child answers "YES" or "NO" to such questions as "Do you believe thatmost problems will solve themselves if you just don't fool with them?" and "Do you believe that whetheror not people like you depends on how you act?". A high score on the NSLOCS indicates externality.
Nowicki and Strickland have reported internal reliability coefficients ranging from .68 to .81. The NSLOCS
has also been found to correlate with other measures of locus of control such as the Rotter I-E Scale
(Rotter, 1966) and the Bialer-Cromwell Scale (Bialer, 1961).
Data on Locus of Control were not made available to the school psychologist who conductedthe giftedness evaluation. The psychologists used objective test results to determine giftedness. Allchildren who obtained an IQ score two standard deviations above the mean on a standardized test ofintelligence such as the Wechsler Intelligence Scale for Children-Revised (WISC-R) were automaticallycertified for the gifted program. In addition, childrenwith two or more risk factors who obtained an IQ
score of 120 or greater were certified as gifted. For the purposes of the present analysis, only thosechildren who scored two standard deviations above the mean on a standardized individual intelligencetest were included as "gifted." Of the total sample, 364 met the criterion. Of these, 131 were Latino/Hispanic, 147 were Caucasian, 24 were African-American, and 62 were Filipino.
Results
To examine risk factors and possible interactions of risk with giftedness and ethnicity, the data
were analyzed in a 2(Giftedness: Gifted vs. NonGifted) X 4(Ethnic Background: Latino/Hispanic,Caucasian, African-American, Filipino) X 4(Level of Risk: 0, 1, 3, risk factors) ANOVA. There weresignificant main effects for Giftedness, F(1,804 ).= 8.31, p < .004, Ethnic Background, F(3, 804) = 6.29, p <
.001, and Level of Risk, F(3,804) = 2.84, p < .037. Also significant was the Ethnic X Risk Interaction, F(9,
804 ). 1.99, p < .038.
The main effect for Ethnic Background showed that the Caucasian children (M = 13.74, SD =
4.57) had a significantly more internal locus of control than the Filipino children (M = 14.73, SD = 4.37),
who, in turn, were significantly more internal than Latino (M = 15.54, SD = 4.96) and African-American
children (M = 15.90, SD = 4.40).
The main effect for risk showed that children with two (M = 15.27, SD = 4.86) and three or more
risk factors (M = 15.01, SD = 4.49) had a significantly more external locus of control than children with
only one risk factor (M = 13.42, SD = 4.56) indicating that, summing across the other variables, the more
risk factors a child has, the more likely he or she will be to attribute successes to external causes.
Figure 1 illustrates the Ethnic Background by Level of Risk Interaction. For the Caucasians,
having no risk factors was associated with a higher internal locus of control, and the children became
more external as risk level increased. For the other three groups, with the exception of one data point
123

(Latino/Hispanic with one risk factor), the reverse was found. That is, for these nonCaucasians, greaterrisk was associated with a higher internal locus.
20
180
0C4
16
0
0(.9 14
0
12
10
Figure 1. Locus of control as a function of risk and ethnic background
LATINO/HISPANICCAUCASIAN
--a-- AFRICAN-AMERICAN-0- FILIPINO
NONE ONE TWO
LEVEL OF IDENTIFIED RISK
THREE OR MORE
To evaluate gender effects and possible interactions among gender, giftedness, and ethnicbackground, the data were evaluated in a 2(Gender) X 2(Giftedness) X 4(Ethnic Background) ANOVA.As with the previous ANOVA, there were significant main effects for Giftedness and EthnicBackground.The main effect for Gender was also significant, F(l, 804) = 5.15, p < .024. This effect was due to a higherinternal locus in the females (M = 14.40, SD = 4.65) compared to the males (M = 15.23, SD = 4.67).
Discussion
The results revealed that, overall, gifted children have a more internal locus of control thannongifted children. This result is not surprising, and is consistent withfindings from Laffoon, Jenkins-Friedman, & Tollefson (1989). Laffoon et al. (1989) found that high achieving gifted students had asignificantly higher internal locus of control than both underachieving gifted and nongifted students.Other studies have also found internal locus of control to be related to giftedness (Fincham & Barling,1987) and achievement (Keith et al., 1986; Harty et al., 1984).
There were also ethnic differences in locus of control. The results of the present study revealedthat Caucasian children have a more internal locus of control than Filipino, Lafino, and African-Americanchildren. These findings are consistent with Hsieh et al. (1969), who found Anglo-American studentsto have a more internal locus of control than other ethnic groups. These findings suggest that culturalorientation may be closely linked to an individual's belief in external or internal control. As Hsieh et al.(1969) suggest, an individual who is raised in a culture that emphasizes independence, self-reliance,and individuation will typically develop a more internal locus of control than individuals who are
'raised with a different set of values. This is an important finding considering the positive relatdonshipbetween internal locus of control and achievement. If children, and specifically traditionally
124
underrepresented or disadvantaged children, are underachieving in school, one possible area on which
to focus may be increasing the child's internal locus of control. The discrepancies in intelligence andachievement scores may be due to differences in socialization processes as opposed to deficits in
intellectual abilities.
Level of risk also affected locus of control. Overall, children with two or more risk factors had
a significantly more external locus of control than children with none or only one risk factor. Browne &
Rife (1991) and Payne & Payne (1989) also found that at-risk students tended to ascribe their achievements
and successes to outside, "external" causes. A child is generally considered at-risk if specificcircumstances in the child's life affect his or her ability to perform at full potential. The child typicallyhas little or no control over these variables. Language and cultural factors, for example, may influence
a child's ability to perform in school, yet the child has no control over what culture into which he or she
is born. It follows that the presence of multiple risk factors may lead the child to feel that he or she haslittle control over his or her environment and thus, develop an external locus of control.
Findings with level of risk must be considered in conjunction with ethnic background, as there
was a significant interaction between risk and ethnic background. This interaction indicated that fornonCaucasians the presence of risk factors was actually associated with a greater internal locus ofcontrol. Perhaps these children respond to adversity by becoming more internal. In any case, there
was a clear association between risk and internal locus of control for gifted nonCaucasians. Whetherthese results generalize to children of average orbelow average ability, however, remains to be seen,and would seem unlikely based on previous studies (Brown & Rife, 1991; Payne & Payne, 1989). Thus,
a high internal locus may serve as a marker for at risk gifted nonCaucasians.
There were also gender effects in locus of control. Females showed a slight but significantlygreater internal locus of control. These results are consistent with Young and Shorr (1986) and Cooper
et al. (1981), who found that females tended to attribute both success and failure outcomes to internal
causes significantly more often than males. This difference may be a result of differences in socialization
of girls and boys. However, several other studies have failed to find any differences in locus of controlbetween males and females (Payne & Payne, 1989; Browne & Rife, 1991; Brown et al., 1984). Furthermore,
while the differences in locus of control for the present study were significant, in general all subjects in
this gifted and high ability sample tended to be more internal. More research is needed in order todetermine the extent of differences in locus of control for males and females of average or below average
abilities.
In general, our results further support the conclusion that internal locus of control is positively
related to academic success, including identification for gifted programs. In addition, female students
were found to be more internal than male students. Several factors have been identified that appear to
influence an individual's locus of control. One factor that may lead to a more external locus of controlis cultural orientation. The extent to which a culture believes in independence and self-reliance will
possibly effect the degree to which a person perceives control over his or her successes and failures. Asecond variable that appears to affect internal versus external locus of control is the number of riskfactors attributed to the individual. It appears that the more risk factors a child has, the less internal
control the child perceives. However, the effects ofnumber of risk factors must be looked at in conjunction
with ethnicity and IQ. The results of the present study suggest that for high IQ scoring nonCaucasians
the presence of multiple risk factors may actually serve to increase internal locus of control. Thus, locus
of control has multiple determinants and interacts with risk and ethnicity.
Future work in this area should be directed at examining, more specifically, how measures of
locus of control might be used to produce equity in selecting diverse children for gifted programs. In
the present study locus of control was used as an experimental tool. Scores on locus of control were not
used for selection purposes. Certainly such measures have shown promise and merit further
investigation.
. 125 .
CHAPTER 6
Understanding Gifted Underachievers in an Ethnically Diverse Population
Nancy E. Johnson, Dennis P. Saccuzzo, & Tracey L. Guertin
San Diego State University
* This research was funded by Grant R206A00569, U.S. Department of Education, JacobJavits Gifted and Talented Discretionary Grant.
The authors express their appreciation to the San Diego City Schools, to Giftedand Talented Education (GATE) Administrator David Hermanson, and to the followingschool psychologists: Will Boggess, Marcia Dome, Dimaris Michalek, Ben Sy, and DanielWilliams.
The authors also wish to aLknowledge Susan McLaughlin for her assistance.Correspondence concerning this article should be addressed to Nancy E. Johnson,
Joint San Diego State/University of California, San Diego Clinical Training Program, 6363
Alvarado Court, Suite 103, San Diego, California 92120-4913 (Phone: 619-594-2845/FAX:619-594-6780/E-mail: [email protected]).
© 1994Do not reproduce in any form without express written permission from the authors.
126127
Abstract
A well defined sample of gifted underachievers was compared to a sample ofgifted high-achievers. All children had full scale WISC-R IQ scores of 130 or greater.Underachievers were performing at or below the 50th percentile in at least one major areaof achievement, whereas high-achievers were at the 96th percentile or greater in threeareas of achievement: language, math, and reading. Of 6,067 children who had obtainedfull scale IQ scores of 130 or greater over a nine year period in an ethnically diversepopulation, 108 met criteria for gifted underachievement, and 96 met criteria for highachievement. Results of a 2 (achievement level) by 9 (WISC-R subtest) mixed repeatedmeasures ANOVA revealed significant (p < .01) differences in scores on four verbal subtests:Information, Similarities, Vocabulary, and Comprehension. High-achievers hadsignificantly (p < .001) higher Verbal, but not Performance, IQ scores than underachievers.However, comparison of the VIQ-PIQ discrepancy distributions for the children in thetwo groups revealed no significant differences. This finding negates the idea that a largeVIQ-PIQ discrepancy can be used as an indicator of risk for low achievement in giftedchildren, since large VIQ-PIQ discrepancies were as likely to be seen in high-achievers asin low. Analysis of gender, ethnicity, and risk revealed a greater concentration ofnonCaucasian males with at least two risk factors in the underachieving group. Presentfindings are consistent with, and confirm those of others concerning the importance anddiscriminating power of the Information subtest in distinguishing high versusunderachievers. The findings indicate that gifted underachievers are not as motivated orinterested in acquiring traditional factual information as high-achievers. Creative teachingstrategies are recommended to maxiniize the talents of underachievers.
128

Understanding Gifted Underachievers in an Ethnically Diverse Population
Traditionally, gifted underachievers are defined as those children who cannot or will not perform
at a level of academic achievement commensurate with their intellectual potential (Emerick, 1989; Fine,1967; Gowan, 1955). Underachievement manifests itself as a discrepancy between a child's performancein the classroom and his or her intellectual ability (Rimm, 1988); a discrepancy between what is expected
and what is actually accomplished (Newell, & d'Lberville, 1989).
As Gowan (1955) noted some time ago, gifted underachievers represent one of the greatestsocial wastes in our culture. Gifted underachievers are children of exceptional ability who achieve at
average or even below average levels. Unfortunately, gifted underachievers tend to be overlookedbecause such children perform at relatively good levels (Wolfe, 1991). Thus, while gifted children maybe as susceptible to factors that cause underachievement as are children of normal intelligence, theirunderachievement is less likely to be recognized because oftheir giftedness (Supplee, 1989).
According to various estimates, between 10% and 20% of high school dropouts are judged tohave very superior ability (Lajoie & Shore, 1981; Nyquist, 1973; Whitmore, 1980). Ten to fifteen percentof the academically gifted are believed to achieve at a rate far below their potential (Gallagher, 1985;Ford, 1992). Consequently, an increasing number of researchers have called for more study of thesegifted children who fail to fulfill their high potential and yet are so easily missed, or dismissed as lazy,manipulative or irresponsible (Emerick, 1989; Ford, 1992; Gallagher, 1985; Wolfle, 1991).
Because they usually perform at satisfactory levels, gifted underachievers are difficult to identify,
and consequently have proved resistant to systematic scientific inquiry. Much of the available researchhas been devoted to the problem of identification (Ford & Harris, 1990; Mather & Udall, 1985). Somestudies have looked at the role of the family (VanTassel-Baska, 1989) or socioemotional consequences(Cornell, Callahan, & Lloyd, 1991). Still other reports have used case studies to examine giftedunderachieving children (Hannel, 1990).
A major line of investigation has been concerned with test patterns in order to better understandand operationalize underlying correlates of underachievement in gifted children. The basis for thesearch for test patterns can be found, in part, in evidence that suggests that gifted children processinformation in a qualitatively different manner from average children on tests such as the WISC-R(Brown & Yakimowski, 1987). Moreover, in a study of WISC test patterns of bright and giftedunderachievers, Bush and Mattson (1973) found that normal achievers and underachievers differed onthree subtests: Information, Arithmetic, and Digit Span. In a related study, Moffitt and Silva (1987)examined children from an unselected birth cohort who had WISC-R Verbal and Performance IQdiscrepancies that placed them beyond the 90th percentile. Underachieving children in this sample
were found to have depressed a Verbal IQ relative to the Performance IQ.
In the present study, we continued the exploration of the testpatterns of gifted underachievers.A well-defined sample of gifted underachievers was compared to a well-defined sample of gifted high-achievers, to explicate differences in patterns of subtest scores aswell as verbal-performance discrepancies.
Method
Subjects:The subjects were drawn from children who were referred for an evaluation of giftedness in the
San Diego School District between 1984 and 1993. The San Diego City School District consists of over
123,000 children who attend more than 130 elementary,middle, and high schools across a wide geographic
and ethnically diverse area. Children may be referred for a giftedness evaluation by teachers, parents,
or central nomination from the District office. Each child referred is examined by a school psychologist
who conducts a case study analysis including a consideration of IQ, achievement, aptitude, and risk
factors. For each child evaluated, the psychologist determines whether the child has one or more of five
129
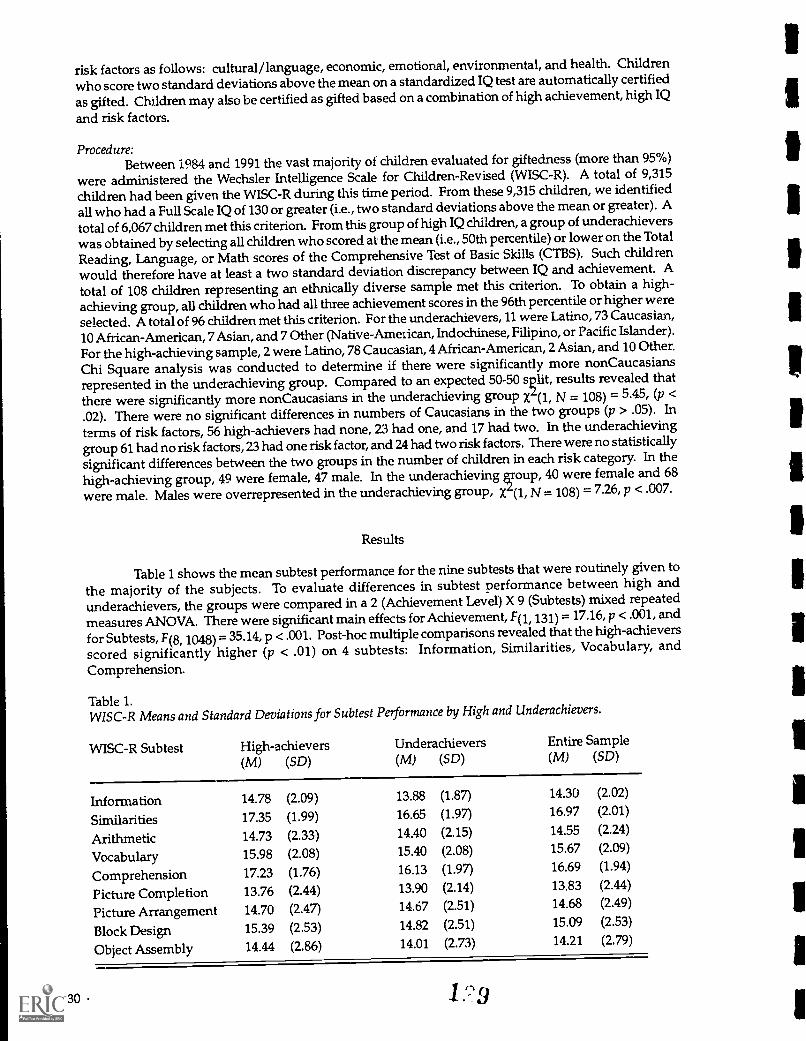
risk factors as follows: cultural/ language, economic, emotional, environmental, and health. Childrenwho score two standard deviations above the mean on a standardized IQ test are automatically certified
as gifted. Children may also be certified as gifted based on a combination of high achievement, high IQ
and risk factors.
Procedure:Between 1984 and 1991 the vast majority or children evaluated for giftedness (more than 95%)
were administered the Wechsler Intelligence Scale for Children-Revised (WISC-R). A total of 9,315
children had been given the WISC-R during this time period. From these 9,315 children, we identifiedall who had a Full Scale IQ of 130 or greater (i.e., two standard deviations above the mean or greater). Atotal of 6,067 children met this criterion. From this group of high IQ children, a group of underachievers
was obtained by selecting all children who scored at the mean (i.e., 50th percentile) or lower on the Total
Reading, Language, or Math scores of the Comprehensive Test of Basic Skills (CTBS). Such childrenwould therefore have at least a two standard deviation discrepancy between IQ and achievement. A
total of 108 children representing an ethnically diverse sample met this criterion. To obtain a high-achieving group, all children who had all three achievement scores in the 96th percentile or higher were
selected. A total of 96 children met this criterion. For the underachievers, 11 were Latino, 73 Caucasian,
10 African-American, 7 Asian, and 7 Other (Native-American, Indochinese, Filipino, or Pacific Islander).For the high-achieving sample, 2 were Latino, 78 Caucasian, 4 African-American, 2 Asian, and 10 Other.
Chi Square analysis was conducted to determine if there were significantly more nonCaucasiansrepresented in the underachieving group. Compared to an expected 50-50 split, results revealed thatthere were significantly more nonCaucasians in the underachieving group x4(1, N = 108) = 5.45, <
.02). There were no significant differences in numbers of Caucasians in the two groups (p > .05). Interms of risk factors, 56 high-achievers had none, 23 had one, and 17 had two. In the underachievinggroup 61 had no risk factors, 23 had one risk factor, and 24 had two risk factors. There were nostatistically
significant differences between the two groups in the number of children in each risk category. In thehigh-achieving group, 49 were female, 47 male. In the underachieving &roup, 40 were female and 68
were male. Males were overrepresented in the underachieving group, X4(1, N = 108) = 7.26, p < .007.
130
Results
Table 1 shows the mean subtest performance for the nine subtests that were routinely given to
the majority of the subjects. To evaluate differences in sub test performance between high and
underachievers, the groups were compared in a 2 (Achievement Level) X 9 (Subtests) mixed repeated
measures ANOVA. There were significant main effects for Achievement, F(i, 131) = 17.16, p < .001, and
for Subtests, F(8, 1048) = 35.14, p < .001. Post-hoc multiple comparisons revealed that the high-achievers
scored significantly higher (p < .01) on 4 subtests: Information, Similarities, Vocabulary, and
Comprehension.
Table 1.WISC-R Means and Standard Deviations for Subtest Peiformance by High and Underachievers.
WISC-R Subtest High-achievers(M) (SD)
Underachievers(M) (SD)
Entire Sample(M) (SD)
Information 14.78 (2.09) 13.88 (1.87) 14.30 (2.02)
Similarities 17.35 (1.99) 16.65 (1.97) 16.97 (2.01)
Arithmetic 14.73 (2.33) 14.40 (2.15) 14.55 (2.24)
Vocabulary 15.98 (2.08) 15.40 (2.08) 15.67 (2.09)
Comprehension 17.23 (1.76) 16.13 (1.97) 16.69 (1.94)
Picture Completion 13.76 (2.44) 13.90 (2.14) 13.83 (2.44)
Picture Arrangement 14.70 (2.47) 14.67 (2.51) 14.68 (2.49)
Block Design 15.39 (2.53) 14.82 (2.51) 15.09 (2.53)
Object Assembly 14.44 (2.86) 14.01 (2.73) 14.21 (2.79)
1 9
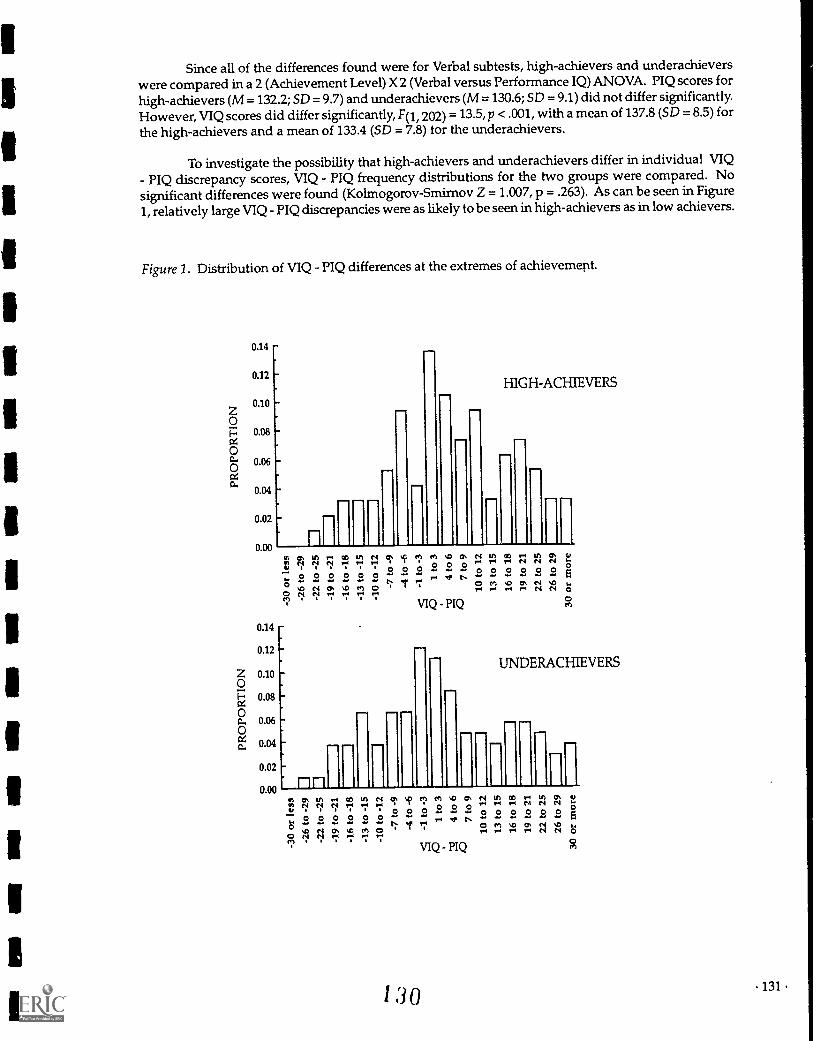
Since all of the differences found were for Verbal subtests, high-achievers and underachieverswere compared in a 2 (Achievement Level) X 2 (Verbal versus Performance IQ) ANOVA. PIQ scores forhigh-achievers (M = 132.2; SD = 9.7) and underachievers (M = 130.6; SD = 9.1) did not differ significantly.However, VIQ scores did differ significantly, F(1, 202) = 13.5, p < .001, with a mean of 137.8 (SD = 8.5) forthe high-achievers and a mean of 133.4 (SD = 7.8) for the underachievers.
To investigate the possibility that high-achievers and underachievers differ in individual VIQ- PIQ discrepancy scores, VIQ - PIQ frequency distributions for the two groups were compared. Nosignificant differences were found (Kolmogorov-Smirnov Z = 1.007, p = .263). As canbe seen in Figure1, relatively large VIQ PIQ discrepancies were as likely to be seen in high-achievers as in low achievers.
Figure 1. Distribution of VIQ - PIQ differences at the extremes of achievement.
0.14
0,12
0.10
0.08
0.06
0.04
0.02
0.00sr:
0.14
0.12
0.10
0.08
0.06
0.04
0.02
0.00
HIGH-ACHIEVERS
nncr. tfl 1- co cn N cn 0 en N tn co N N N2 0 0 1-
2 2 0 0 0 0 0 0O 0 0 0 0 0e l "cr. v>e, tne, 1.4 N N0 te) ,13 Cr, N
11 17
111
VIQ PIQ
UNDERACHIEVERS
most') T* Tm.0 e4 it) to 1-4 tf) C to1-1 v-I
2 2 2 2N
, ° c, c,O 0 0 0
ctse4g.,4,0mo 11-1"7 cmu, L.
VIQ PIQ
130 131

Performance was further analyzed through correlational analysis and stepwise multipleregression (see Table 2). Table 2 shows the intercorrelation matrix of the WISC-R subtests and CYBS(Language, Reading, and Math) scores. Stepwise multiple linear regression was performed, with thenine Wechsler subtest scores as predictors and level of achievement (i.e., whether the child was in thehigh versus underachievement group) as the criterion. Three subtests were significant in predictingachievement level. The first variable that entered into the equation was the Information subtest, with a
multiple R of .29, F(1, 131) = 12.08, p < .001. The Comprehension subtest added significant variance,F(2, 30) = 10.1, p < .001, and increased the multiple R to .37. Finally, the Block Design subtest significantly,F(3, 129) = 8.5; p < .001, increased the multiple R to .41.
Table 2.
Correlation Matrix for WISC-R Subtests and Achievement Scores
MO
INFO COMP ARITH SIMS VOCAB PC PA BD OA
1.00COMP .22 1.00ARITH .11 .07 1.00
SIMS .07 .18* .09 1.00
VOCAB .40** .24** .11 .29** 1.00
PC -.01 -.11 .02 -.07 .07 1.00
PA -.08 -.11 .02 .11 .06 .12 1.00
BD .02 -.16 -.07 -.12 -.06 .06 .03 1.00
OA -.11 -.07 -.06 .08 .09 .18* .36** .31** 1.00
CODING -.21* -.05 .20* -.06 -.03 .01 -.05 -.07 -.12
CTBSL .26** .29** .05 .10 .15 -.10 -.04 .09 .10
C1 I3SR .23** .23** .02 .10 .12 .02 .01 .11 .11
CTBSM .05 .17 .07 .12 -.04 -.04 .01 .16 .03
CODINGCT13SLC113SR
CODING CTBSR CTBSMC 113SL
1.00.08.11.09
1.00.71**.52**
1.00.40** 1.00C I3SM
Note.:
* p < .05**p < .01
C I I3SL = CTBS Total LanguageC113SR = C1 I3S Total ReadingC I I3SM = C113S Total Math
To aid in understanding the gender and ethnic differences between high-achievers andunderachievers, the groups were further compared in terms of gender, risk, and ethnicity simultaneously.
Chi Square analysis revealed significantly more male, nonCaucasians with 1 or more risk factors in theunderachieving group: x2(1, N 33) = 5.50, p < .019.
132
Discussion
The present stv.dy compared intellectually gifted children who were achieving at least twostandard deviations below expectation to a very high-achieving sample. In general, the high-achievingsample had slightly higher IQ scores. This superiority, however, was attributable only to Verbal subtests.The high-achievers had significantly higher scores on Information, Similarities, Vocabulary, andComprehension. Although mean Verbal IQ was significantly higher for the high-achieving group,there were no differences for any of the Performance subtests or for the Performance IQ as a whole.
Differences in the pattern of individual VIQ - PIQ discrepancy scores wereplotted in frequencydistributions for each group. No differences were found between the two distributions. Indeed, VIQVIQ discrepancies on the order of 15 points or greater were found to be equally common in both high-achievers and underachievers. This finding underscores the fallacy of confusing statistical significance(i.e., the 15-point difference necessary to conclude with 95% certainty that an individual's VIQ and PIQ
differ) with clinical significance (i.e., the mistaken conclusion that a 15-point VIQ-PIQ differencenecessarily has prognostic significance and indicates risk for underachievement). Large V1Q-PIQdiscrepancies are equally common in high- and low-achieving gifted children; only with the additionof a low achievement test score can a low-achiever be identified. In terms of predicting achievementlevel using WISC-R subtests, the primary correlates were Information and Comprehension, with BlockDesign adding a small, but significant, contribution to the variance.
Analysis of gender, ethnicity, and risk further revealed a greater concentration of nonCaucasian
males with at least two risk factors in the underachieving group. These findings are consistent withprevious studies, which indicate that of the intellectual underachievers, males outnumber females(Gallagher, 1985; Wolfle, 1991), and that many of these students areethnic minorities (Ford, 1992). Thus,
there is a need, as advocated by Gallagher (1985), to provide particular focus on underachieving minority
males.
Our results confirm the findings of Bush and Mattson (1973) concerning the importance anddiscriminating power of the Information subtest in distinguishinghigh-achievers versus underachievers.Present findings show that the older results with the WISC generalize to the WISC-R. The findingspertaining to the Information subtest, taken at face value, seem to suggest that gifted underachieverssimply do not have as much interest or motivation for acquiring factual information as do high-achievers.
This suggests that gifted underachievers may require creative teaching strategies, such as makinginformation more relevant and interesting or channeling their abilities into more creative pursuits.
Our findings are also consistent with those reported by Moffitt and Silva (1987). Giftedunderachievers are characterized by certain depressed verbal skills; their Performance IQ's arecomparable to that of the high-achievers. Thus, we can characterize the gifted underachiever as anindividual who has not used his or her potential, or as Cattell (1963) would say, fluid intelligence, toacquire a traditional body of knowledge (i.e., crystallized intelligence). Again, the challenge for teachers
is to find ways to motivate these underachievers to make full use of their potential.
Our findings pertaining to gifted underachievers are also relevant to a previous report of the
direction of the difference between Verbal versus Performance IQ in 4,546 gifted African-American,Caucasian, Filipino, and Hispanic children (Saccuzzo, Johnson, & Russell, 1992). This study showed
that for the typically gifted African-American, the Verbal IQ was actually higher than the PerformanceIQ. For Hispanics, the Verbal and Performance IQ's were roughly equivalent. Thus, the relevantdimension includes both direction and size; a very high Performance IQ relative to Verbal IQ for an
African-American and perhaps an Hispanic should signal the possibility of a gifted underachieverbecause these individuals tend to have higher Verbal than Performance IQ's. For Filipinos, just the
reverse is true since these individuals tend to have higher Performance than Verbal IQ (Saccuzzo et al.,
1992). Therefore, while the WISC-R may be biased in terms of selection (Johnson, 1992), it (or its relative,
the WISC-III) may still have utility in identifying gifted underachieving African-American and Hispanic/
Latino students.
133
132
134
Beyond modification of our educational strategies, researchers have pointed to three majorapproaches to gifted underachievers. The first focuses on motivational factors (e.g., Boyd, 1990).According to this model there is a need to add excitement or relevance to the learning process in orderto help gifted underachievers fulfill their potential. A second approach emphasizes the importance offamilies as a source of encouragement and support for gifted underachievers (VanTassel-Baska, 1989).The third emphasizes the importance of personality variables, especially locus of control one'sperceived ability to influence or control the events of one's life (Laffoon, Jenkins-Friedman, & Tollefson,1989; Waldron, Saphire, & Rosenbaum, 1987; Willings & Greenwood, 1990). Certainly any one, two, orall three of these factors play a role in gifted underachievement and need to be considered in addressingthe problems of each individual and unique student.

References
Albrecht, H. T. & Rost, D. H. (1983). Uber den Zusammenhang von Hochbegabung undWohnqualitat. Eine Wohnbezirksanalyse aus San Diego, USA. / On the relationship betweengiftedness and housing quality: A social area analysis of San Diego, USA. Psychologie inErziehung und Unterricht, 30, 281-290.
Alvino, J., McDonnel, R., & Richert, S. (1981). National survey of identification practices in gifted andtalented education. Exceptional Children, 46, 124-132.
Ascher, C. (1990). Assessing bilingual students for placement and instruction. (Report No. EDO-UD90-5). New York, NY: Columbia University (ERIC Document Reproduction Service No.ED322273).
Baska, L. (1986A). The use of the Raven Advanced Progressive Matrices for the selection of magnetjunior high school students. Roeper Review, 8,181-184.
Baska, L. (1986B). Alternatives to traditional testing. Roeper Review, 8, 181-184.
Battle, Ester,& Rotter, J. (1963). Children's feelings of personal control as related to social class andethnic group. Journal of Personality, 31, 482-490.
Ben-Zeev, S. (1977). The effect of bilingualism in children from Spanish-English low economicneighborhoods on cognitive development and cognitive strategy. Working Papers on Bilingualism,
14, 83-122.
Bernal, E. M. (1974). Gifted Mexican American children: An ethnic-scientific perspective. (Report No.OEC-4-7-062113-307). Washington, D. C.: Office of Education. (ERIC Document ReproductionService No. ED091411).
Blake, J. (1974). Developmental changes in visual information processing under backward masking.Journal of Experimental Child Psychology, 17, 133-146.
Borland, J. H. (1986). IQ tests: Throwing out the bathwater, saving the baby. Roeper Review, 8,163-165.
Bosco, J. (1972). The visual information prof essing speed of lower- and middle-class children. ChildLevelopment, 43, 1418-1422.
Boyd, R. (1990). Academically talented underachievers at the end of high school. Gifted Education
International, 7, 23-26.
Brown, D., Fulkerson, Fee, K., Furr, S., Ware, W., & Voight, N. L. (1984). Locus of control, sex roleorientation, and self-concept in black and white third- and sixth-grade male and female leadersin a rural community. Developmental Psychology, 20, 717-721.
Brown, S. W., & Yakimowski, M. E. (1987). Intelligence scores of gifted students on the WISC-R.
Gifted Child Quarterly, 31, 130-134.
Browne, C. S., & Rife, J. C. (1991). Social, personality, and gender differences L atrisk and not-at-risk sixth-grade students. Journal of Early Adolescence, 11, 482-495.
Bruch, C. B. (1971). Modification of procedures for identification of the disadvantaged gifted. GiftedChild Quarterly, 15, 267-272.
Burciaga, L.E. (1973). A research study on the Raven Coloured Progressive Matrices among school children of
the El Paso public schools. Doctoral dissertation, Universityof El Paso, Texas.
. 135
134
Bush, W. J., & Mattson, B. D. (1973). WISC test patterns and underachievers. Journal of LearningDisabilities, 6 (4), 54-59.
Caplan, N., Choy, M. H., & Whitmore, J. K. (Feb. 1992). Indochinese refugee families and academicachievement. Scientific American, 36-42.
Carlson, J. S. (1989). Advances in research on intelligence: The dynamic assessment approach. TheMental Retardation and Learning Disabilihy Bulletin, 17, 1-20.
Carlson, J.S., & Dillon, R. (1978). The effects of testing-the-limits procedures on Raven matricesperformance of deaf children. Volta Review. 4, 216-224.
Carlson, J. S., & Wiedl, K.H. (1978). Use of testing the limits procedures in the assessment ofintellectual capabilities in children with learning difficulties. American Journal of MentalDeficiency, 82,599-564.
Carlson, J. S., & Wiedl, K.H. (1979). Towards a differential testing approach: Testing-the-limitsemploying the Raven Progressive Matrices. Intelligence, 3, 323-344.
Carpenter, P.A., Just, M.A, & Shell, P. (1990). What one intelligence test measures: A theoreticalaccount of the processing in the Raven Progressive Matrices Test. Psychological Review, 97,404-431.
Carroll, J.B. (1992). Cognitive abilities: The state of the art. Psychological Science, 3, 266-270.
Cattell, RB. (1963). Theory of fluid and crystallized intelligence. Journal of Educational Psychology,54, 1-22.
Cauce, A. M., Jacobson, L. I. (1980). Implicit and incorrect assumptions concerning tilt: assessmentof the Latino in the United States. American Journal of Community Psychology, 8, 571-586.
Cherkes-Julkowski, M., Stolzenberg, J., & Segal, L. (1990). Prompted cognitive testing as a diagnosticcompensation for attentional deficits: The Raven Standard Progressive Matrices and attentiondeficit disorder. Learning Disabilities, 2,1-7.
Chiu, L. (1986). Locus of control in intellectual situations in American and Chinese school children.International Journal of Psychology, 21, 167-176.
Clark, B. (1979) Growing up gifted. Columbus, OH: Charles E. Merrill.
Cohn, S. J., Carlson, J. S., & Jenson, A. R. (1985). Speed of information-processing in academically giftedyouths. Personality and Individual afferences, 6, 621-629.
Cooper, H. M., Burger, J. M., & Good, T. L. (1981). Gender differences in the academic locus ofcontrol beliefs of young children. Journal of Personality and Social Psychology, 40, 562-572.
Cornell, D. G., Callahan, C. M., & Loyd, B. H. (1991). Socioemotional adjustment of adolescent girlsenrolled in a residential accelerant program. Gifted Child Quarterly, 35, 58-66.
Court, J.H. (1988). A researcher's bibliography for Raven's Progressive Matrices and Mill Hill Vocabulany
Scales (7th Ed.). Published by J.H. Court, 500 Goodwood Rd., Cumberland Park, South Australia
5041.
Court, J. H. (1991). Asian applications of Raven's ProgressiveMatrices. Psychologia: An International
Journal of Psychology in the Orient, 34 (2):75-85.
136
Court, J.H., & Raven, J. (1982). Summaries of reliability, validity, and normative studies for Raven'sProgressive Matrices and Vocabulary Scales. In A manual for Raven's Progressive Matrices and Mill
Hill Vocabulary Scales (Research Supp. No. 2). London: H.K. Lewis; San Antonio, TX: Psychological
Corporation.
Crandall, V. C., Katkovsky, W., & Crandall V. J. (1965). Children's beliefs in their own control ofreinforcements in intellectual-academic achievement situations. Child Development, 36, 91-109.
Cummins, J. (1976). The influence of bilingualism on cognitive growth: A synthesis of researchfindings and explanatory hypotheses. Working Papers in Bilingualism, No. 9. Ontario: Institute
for studies in Education.
Cummins, J. (1978). Metalinguisitic development ofchildren in bilingual education programs: Datafrom Irish and Canadian Ukrainian-English programs. In M. Paradis (Ed.), The Fourth Locus
Forum. Columbia, S.C.: Hornbeam Press.
Cummins, J. (1981). Empirical and theoretical underpinnings of bilingual education. Journal ofEducation, 163 (1), 16-29.
Cummins, J. (1986). Empowering minority students: A framework for intervention. HarvardEducational Review, 56(1), 18-36.
Cummins, J. (1989). A theoretical framework for bilingual special education. Exceptional Children.
56, 111-119.
Cummins, J., & Gulutsan, M. (1974). Bilingual education and cognition. Alberta Journal of
Educational Research, 20, 259-266.
Dash, U. N., & Mishra, H. C. (1988). Bilingualism and meta linguistic developments: Evidencefrom Kond tribal culture. Journal of Indian Psychology, 7(2), 7-19.
Diaz, R. M. (1983). Thought and two languages: The impact of bilingualism on cognitivedevelopment. In E. W. Gordon (Ed.), Review of research in education (Vol. 10, pp. 23-54).Washington, DC: American Educational Research Association.
Dirks, J., Wessels, K., Quarforth, J., & Quenon, B. (1980). Can short-form WISC-R IQ tests identifychildren with high Full Scale IQ? Psychology in the Schools,17, 40-46.
Dorfman, P. W. (1977). Tuning and anticipation: Adevelopmental perspective. Journal of Motor
Behavior, 9, 67-69.
D'Souza, D. (1991). Illiberal education: The politics of race and sex on campus. New York: The Free Press.
DuBois, P. H. (1970). A history of psychological testing. Boston: Allyn & Bacon.
Duke, M. P., and Nowicki, S. (1974). Locus of control and achievement-the confirmation of a
theoretical expectation. Journal of Psychology., 87, 263-267.
Dunham, P. (1977). Age, sex and practice in coincidence-anticipation performance of children. Perceptual
and Motor Skills, 45, 187-193.
Elman, L., Blixt, S., & Sawicki, R. (1981). The development of cutoff scores on a WISC-R in themultidimensional assessment of gifted children. Psychology in the Schools, 18, 426-428.
Emerick, L. J. (1989). The gifted underachiever: Another look. Preventing School Failure, 34 (1), 6-9.
137
146

138
Feldman, C., & Shen, M. (1971). Some language-related cognitive advantages of bilingual five-year-
olds. Journal of Genetic Psychology, 118, 235-244.
Felsten, G., & Wasserman, G. S. (1980). Visual masking: Mechanisms and theories. Psychological
Bulletin, 88, 329-353.
Fetteiman, D. M. (1986). Gifted and talented education: A national test case in Peoria. EducationalEvaluation and Policy Analysis, 8, 155-156.
Feuerstein, lz (1979). The dynamic assessment of retarded performers. Baltimore: University Park Press.
Fincham, F. and Barling, J. ( 1987). Locus of control and generosity in learning disabled, normalachieving, and gifted children. Child Development, 49, 530-533.
Fine, B. (1967). Underachievers: How they can be helped. New York: E. P. Dutton.
Finlayson, M.A.J., Johnson, K.A., & Reitan, R.M. (1977). Relationship of level of education toneuropsychological measures in brain-damaged and non-brain-damaged adults. Journal ofConsulting and Clinical Psychology, 45, 536-542.
Flaugher, R.L., & Rock, D.A. (1972). Patterns of ability factors among four ethnic groups. Proceedings
of the 80th Annual Convention of the American Psychological Association, 7, 27-28.
Ford, D. Y. (1992). Determinants of underachievement as perceived by gifted, above average, andaverage black students. Roeper Review, 14, 130-136 .
Ford, D. Y, & Harris, J. J. (1990). On discovering the hidden treasure of gifted and talented blackchildren. Roeper Review, 13, 27-32.
Fox, L. H. (1981). Identification of the academically gifted. American Psychologist, 36, 1103-1111.
Frasier, M. M. (1979). Rethinking the issue regarding the culturally disadvantaged gifted. ExceptionalChildren, 45, 538-542.
Frasier, M. M. (1982). Counseling the culturally diverse gifted. In N. Colangelo & R. T Zaffrann(Eds.), New voices in counseling the gifted. Iowa: Kendall/Hunt.
Gallagher, J. J. (1985). Teaching the gifted child (3rd ed.). Boston: Allyn and Bacon.
Gallegos, R., & Franco, J. N. (1985). Effects of a bilingual education program on language andacademic achievement. Perceptual and Motor Skills, 60, 438.
Galion, F. (1869). Hereditary genius. Landon & McMillan.
Garcia, J. (1981). The logic and limits of mental aptitude testing. American Psychologist, 36, 1172-1180.
Gardner, H. (1983). Frames of mind : The theory of multiple intelligences. New York : Basic Books.
Gordon, D. (1977). Children's beliefs in internal-external control and self-esteem as related toacademic achievement. Journal of Personality Assessment, 41, 383-386.
Gowan, J. C. (1955). The underachieving gifted child - a problem for everyone. Exceptional Children,
21, 247-271.
Grinder, R. E. (1985). The gifted in our midst:By their divine deeds, neuroses, and mental test scores we
have known them. In F.D. Horowitz & M. O'Brien (Eds.), The gifted and talented: Developmental
perspectives. Washington, D.C.: American Psychological Association.
137

Guertin, T., Johnson, N., Saccuzzo, D., & Lopez, C. (1992). Performance at the top: Raven norms forthe very gifted. In D.P. Saccuzzo (Chair), Identifying underrepresented, disadvantaged gifted children:Models and new approaches. Symposium conducted at the 72nd annual meeting of the WesternPsychological Association, Portland, OR.
Guertin, W.H., Frank, G.H., & Rabin, A.I. (1956). Research with the Wechsler-Bellevue IntelligenceScale: 1950-1955. Psychological Bulletin, 53, 235-257.
Guertin, W.H., Ladd, C.E., Frank, G.I-L, Rabin, A.1., & Hiesler, D.S. (1971).Research with the WechslerIntelligence Scales for Adults. The Psychological Record, 21, 289-339.
Guilford, J.P. (1967). The nature of human intelligence. New York: McGraw-Hill.
Gurin, R, Gurin, G., Lao, R. C., & Beattie, M. (1969). Internal external control in the motivationaldynamics of Negro youth. Journal of Social Issues, 25(3), 29-53.
Hagen, E. (1980). Identification of the gifted. New York: Teachers College Press.
Haier, R.J., Siegel, B.V., Nuechterlein, K.H., Hazlett, E., Wu, J.C., Paek, J., Browning, H.L., &Buchsbaum, M.S. (1988). Cortical glucose metabolic rate correlates of abstract reasoning andattention studied with positron emission tomography. Intelligence, 12, 199-217.
Hakuta, K. (1987). Degree of bilingualism and cognitive ability in mainland Puerto Rican children.Child Development, 58, 1372-1388.
Hakuta, K., & Diaz, R. M. (1985). The relationship between degree of bilingualism and cognitiveability: A critical discussion and some new longitudinal data. In K. E. Nelson (Ed.), Children'slanguage: Volume 5. Hillsdale, NJ: Lawrence Erlbaurri Associates.
Hakuta, K. & Garcia, E. E. (1989). Bilingualism and Education. American Psychologist. 44, 374-379.
Haney, G. E. (1963). Problems and trends in migrant education. In A. H. Passow, M. Gcldberg, & A.J. Tannenbaum (Eds.), Education of the disadvantaged (pp. 100-108). New York: Holt, Rinehart &
Winston.
Hannel, G. (1990). Gifted but failing-a case study. Gifted Education International, 7, 20-22.
Harty, H., Adkins, D. M., & Sherwood, R. D. (1984). Predictability of giftedness identification indicesfor two recognized approaches to elementary school gifted education. Journal of Educational
Research, 77 , 337-342.
Heaton, R.K., Grant, I., & Matthews, C.G. (1986). Differences in neuropsychological test performanceassociated with age, education, and sex. In I. Grant & K.M. Adams (Eds.), Neuropsychological
Assessment of Neuropsychiatric Disorders. New York: Oxford University Press.
Hennessy, J.J., & Merrifield, P.R. (1976). A comparison of the factor structures of mental abilities in fourethnic groups. Journal of Educational Psychology, 68, 754-759.
Hoffman, H. V. (1983). Regression analysis of test bias in the Raven's Progressive Matrices for Anglos and
Mexican-Americans. Unpublished doctoral dissertation, University of Arizona, Department of
Educational Psychology.
Hoffman, H.V. (1986). In J. Raven, J.H. Court, & J. Raven, Manual for Raven's Progressive Matrices and
Vocabulary tests: A compendium of North American normative and validity studies, Research Stipp. No.
3. London: H.K. Lewis.
139
1 '3 8
Horowitz, F.D., & O'Brien, M. (1986). Gifted and talented children: State of knowledge and directionsfor research. American Psychologist, 41, 1147-1152.
Hsieh, Tm-Yee, T. Shybut, J., & Lotsof, E. (1969). Internal versus external control and ethnic groupmembership. Journal of Consulting and Clinical Psychology, 33, 122-124.
Humphreys, L.G. (1992). Commentary: What both critics and users of ability tests need to know.Psychological Science, 3, 271-274.
Hunt, E. (1978). Mechanics of verbal ability. American Psychological Review, 85, 109-130.
Ianco-Worrall, A. D. (1972). Bilingualism and cognitive development. Child Development, 43,1390-1400.
Irwin, R. J. (1984). Inspection time and its relation to intelligence. Intelligence, 8, 47-65.
James, P.R. (1984). A correlational analysis between the Raven's Matrices and WISC-R performancescales. The Volta Review, 86, 336-341.
Jensen, A. R. (1979). g: Outmoded theory or unconquered frontier? Creative Science & Technology, 2,16-29.
Jensen, A.R. (1980a). Bias in mental testing. New York: Free Press.
Jensen, A. R. (1980b). Chronometric analysis of mental ability. Journal of Social Biological Structures, 3, 26.
Jensen, A. R. (1982). Reaction time and psychometric g. In H. G. Eysenck (Ed.), A model for intelligence.Berlin: Springer-Verlag.
Jensen, A. R. (1987). Process differences and individual differences in some cognitive tasks. Intelligence,11, 137-136.
Jensen, A. R. (1992). Spearman's hypothesis: Methodology and evidence. Multivariate BehavioralResearch, 27, 225-233.
Jensen, A. R., & Munro, E. (1979). Reactior, time, movement time, and intelligence. Intelligence, 3,121-126,
Jensen, A. R., & Reed, T. E. (1990). Simple reaction times as a suppressor variable in the chronometricstudy of intelligence. Intelligence, 14, 375-388.
Johnson, N. E. (1992). Use of the WISC-R with disadvantaged gifted children: Current pratice,limitations, and ethical concerns (Doctoral dissertation, San Diego State University / Universityof California, San Diego. Dissertation Abstracts International, 53, (5-B): 2544.
Kanoy, R. C., M. (1980). Locus of control and self-concept in achieving and underachieving brightelementary students. Psychology in the Schools, 17, 395-399.
Kaplan, R., & Saccuzzo, D.P. (1989). Psychological testing: Principles, applications, and issues (2nd ed.).Pacific Grove, CA: Brooks/Cole.
Kaplan, R., & Saccuzzo, D.P. (1993). Psychological testing: Principles, applications, and issues (3rd ed.).Pacific Grove, CA: Brooks/Cole.
Karnes, F.A,, & Brown, K.E. (1981). A short form of the WISC-R for gifted students. Psychology in theSchools, 18, 169-173.
140

Karnes, F. A., Lee, L. A., & May, B. (1982). Correlations among scores on the 1966, 1973, and 1979
norms of Raven's Standard Progressive Matrices for economically disadvantaged students.
Perceptual & Motor Skills, 55 , 793-794.
Kaufman, A. S. (1976). Verbal-performance discrepancies on the WISC-R. Journal of Consulting and
Clinical Psychology, 44, 739-744.
Kaufman, A. S. (1979). Intelligent testing with the WISC-R. New York: Wiley-Interscience.
Kaufman, A. S., & Doppelt, J. E. (1976). Analysis of WISC-R standardization data in terms of
the stratification variables. Child Development, 47, 165-171.
Kaufman, A. S. & Harrison, P. L. (1986). Intelligence tests and gifted assessment: What are the positives?
Roeper Review, 8, 154-159.
K. ufman, A.S., & Kaufman, N.L. (1983). Kaufman Assessment Bat" ..ry for Children (K-ABC) interpretive
manual. Circle Pines, MN: American Guidance Service.
Kier, G. (1949). The Progressive Matrices as applied to school children. British Journal of Statistical
Psychology, 2, 140-150.
Killian, J.B. & Hughes, L.C. (1978). A comparison of short fo:ms of the Wechsler Intelligence Scale for
Children-Revised in the screening of gifted referrals. Gifted Child Quarterly, 22, 111-115.
Klausmeier, K., Mishra, S. P., & Maker, C. J. (1987). Identification of gifted learners: A national survey of
assessment practices and training needs of school psychologists. Gifted Child Quarterly, 31,
135-137.
Kostas, D., Saccuzzo, D. R, & Larson, G. E. (1987). No movement reaction time as afunction of Hick's Law.
Paper presented at the 67th Annual Meeting of the Western Psychological Association,
Long Beach, CA.
Kranzler, J. H., & Jensen, A. R. (1989). Inspection time and intelligence: A meta-analysis. Intelligence,
13, 329-347.
Laffoon, K., Jenkins-Friedman, R., & Tollefson, N. (1989). Causal attributions of underachievinggifted, achieving gifted and nongifted students. Journal for the Education of the Gifted, 13, 4-21.
Lajoie, S. P., & Shore, B. M. (1981). Three myths? The over-representation of the gifted among
dropouts. Gifted Child Quarterly, 25, 138-143.
Lally, M., & Nettlebeck, T. (1977). Intelligence, reaction time, and inspection time. American Journal of
Mental Deficiency, 82, 273-281.
Landry, R. B. (1974). A comparison of second language learners and monolinguals on divergent
thinldng tasks at the elementary school level. Modern Language Journal, 58, 10-15.
Larson, G. E. (1989). A brief note on coincidence timing. Intelligence, 13, 361-367.
Larson, G. E. (1986). The Mental Counters Test. San Diego: Navy Personnel Research and Development
Center.
Larson, G. E., & Rimland, B. (1984). Cognitive speed and performance in Basic Electricity and Electronics
(BE&E) School (Report No. 85-3). San Diego: Navy Personnel Research and Development Center.
Larson, G. E., & Saccuzzo, D. P. (1989). Cognitive correlates of general intelligence: Toward a process
theory of g. Intelligence, 13, 5-31.
140141 .

142
Las low, A., & Nelson, P. (1974). Testing the gifted child in the elementary school. Gifted Child
Quarterly, 18, 152-162.
Lefcourt, H.M. (1966). Internal versus external control of reinforcement: A review. Psychological
Bulletin, 65, 206-220.
Lesser, G. S., Fifer, G., & Clark, D. H. (1965). Mental abilities of children from different social-classand cultural groups. Monographs of the Sociehj for Research in Child Development, 30 (4), 1-115.
Lewandowski, D.G., & Saccuzzo, D.P. (1976). The decline of psychological testing. Professional
Psychology, 7, 177-184.
Lindholm, K. J. (1991). Theoretical assumptions and empirical evidence for academic achievementin two languages. Hispanic Journal of Behavioral Sciences, 13(1), 3-17.
Liss, P. H., & Haith, M. M. (1970). The speed of visual processing in children and adults: Effects ofbackward and forward masking. Perception and Psychophysics, 8, 396-398.
Lunneborg, C. (1978). Some information-processing correlates of measures of intelligence. Multivariate
Behavioral Research, 13, 153-161.
Lynn, R., & Holmshaw, M. (1990). Black-White differences in reaction times and intelligence. Social
Behavior and Personality, 18, 299-308.
Mackintosh, N. J. (1981). A new measure of intelligence?Nature, 289, 529-530.
Marshalek, B., Lohman, D.P., & Snow, RE. (1983). The complexity continuum in the radex andheirarchical models of intelligence. Intelligence, 7, 107-127.
Matarazzo, J. D., & Herman, D. 0. (1984). Base rate data for the WAIS-R: Test-retest stability and VIQ-PIQ differences. Journal of Clinical Neuropsychology, 6, 351-366.
Mather, N., & Udall, A. J. (1985). The identifaction of gifted underachievers using the Woodcock-Johnson Psycho-Educational Battery. Roeper Review, 8, 54-56.
McClelland, R., Yewchuk, C., & Mulcahy, R. (1991). Locus of control in underachieving andachieving gifted students. Journal.* the Education of the Gifted, 14, 380-392.
McKenzie, J. A. (1986). The influence of identification practices, race and SES on the identification ofgifted students. Gifted Child Quarterly, 30, 93-95.
Meeker, M. (1973). Patterns of giftedness in 'Mack, Anglo, and Chicano boys ages 4-5 and 7-9. Paper
presented to the First National Conference for Disadvantaged Gifted, Ventura County, CA.
Meeker, M.N., & Meeker, R. (1973). Strategies for assessing intellectual patterns in Black, Anglo, and
Mexican-American boys-or any other children-and implications for education. Journal of
School Psychology, 11, 341-350.
Melesky, T. J. (1985). Identifying and providing for the Hispanic gifted child. The journal for the
national association for bilingual education, 9 (3), 43-56.
Millett, S. (1990). Annual evaluation of the gifted and talented education program, 1989-90. San Diego: San
Diego City Schools Evaluation Department Report Number 647.
Moffitt, T. E., & Silva, P. A. (1987). WISC-R verbal and performance IQ discrepency in an unselected
cohort: clinical significnce and longitudinal stability. Journal of Consulting and Clinical Psychology,
55, 768-774.
4 I

Nettelbeck, T. (1982). Inspection time: An index for intelligence? Quarterly Journal of ExperimentalPsychology, 34A, 299-312.
Nettlebeck, T. (1987). Inspection time and intelligence. In RA. Vernon (Ed.) Speed ofinformationprocessing and intelligence. Norwood, NJ: Ablex Publishing Co.
Nettelbeck, T., & Lally, M. (1976). Inspection time and measured intelligence. British Journal of
Psychology, 67, 17-22.
Newell, M., d'Lberville, L. (1989). Adapting the triad model to serve gifted underachievers. GiftedEducation International, 6, 98-101.
Nichols, P. L., & Anderson, V. E. (1973). Intellectual performance, race, and socioeconomic status.Social Biology, 20, 367-374.
Nowicki, S. Jr., & Strickland, B. R. (1973). Locus of control scale for children. Journal of Consulting
and Clinical Psychology, 40, 148-154.
Nyquist, E. (1973). The gifted: The invisably handicapped or there is no heavier burden than greatpotential. Paper presented at the National Conference on the Gifted, Albany, N.Y.
Ortiz, A. A. (1991). Assessment and intervention model for the bilingual exceptional student.Teacher education and special education, 14 (1), 35-42.
Passow, A. H. (1989). Needed research and development in educating high ability children: Aneditorial. Roeper Review,11, 223-229.
Payne, B. D., and Payne, D. A. (1989). Sex, race, and grade differences in the locus of controlorientations of at-risk elementary students. Psychology in the Schools, 26, 84-88.
Peal, E., & Lambert, W. E. (1962). The relation of bilingualism to intelligence. PsychologicalMonographs: General and Applied, 76, 1-23.
Pearce, N. (1983). A comparison of the WISC-R, Raven's Standard Progressive Matrices, andMeeker's SOI - Screening Form for Gifted. Gifted Child Quarterly, 27,13-19.
Pegnato, C.W., & Birch, J.W. (1959). Locating children in the juniorhigh school: A comparison of methods.
Exceptional Children, 25, 300-304.
Pirozzo, R. (1982). Gifted Underachievers. Roeper Review, 4 (4), 18-21.
Pledgie, T. K. (1982). Giftedness among handicapped children: Identification and programmingdevelopment. Journal of Special Education, 16, 221-227.
Poulton, E. C. (1950). Perceptual anticipation and reaction time. Quarterly Journal of Experimental
Psychology, 2, 99-112.
Powers, S., & Barkar, J.H. (1986). Concurrent validity of the Standard Progressive Matrices forhispanic and nonhispanic seventh-grade students. Psychology in the Schools, 23, 333-336.
Powers, S., Barkan, J.H. , & Jones , P.B. (1986). Reliability of the Standard Progressive Matrices Testfor Hispanic and Anglo-American children. Perceptual and Motor Skills, 62, 348-350.
Raven, J. (1989). The Raven Progressive Matrices: A review of national norming studies and ethnicand socioeconomic variation within the United States. Journal of Educational Measurement, 26,
1-16.
143
142

Raven, J., Summers, W.A., et al. (1986, 1990). A compendium of North American normative andvalidity studies. In J.C. Raven, J.H. Court, and J. Raven, A manual for Raven's Progressive Matricesand vocabulany tests (Research Supp. No. 3). London: H.K. Lewis; San Antonio, TX: PsychologicalCorporation.
144
Raven, J.C. (1938). Progressive matrices: A perceptual test of intelligence. London: H.K. Lewis.
Raven, J.C. (1958). Standard Progressive Matrices. San Antonio, TX: Psychological Corporation.
Raven, J.C. (1960). Guide to the Progressive Matrices. London: H.K. Lewis.
Reitan, RM. (1955). The distribution according to age of a psychologic measure dependent on organicbrain functions. Journal of Gerontology, 10, 338-340.
Renzulli, J.S. (1978). What makes giftedness? Reexamining a definition. Phi Delta Kappan, 60,
180-184.
Reynolds, A. G. (1991). The cognitive consequences of bilingualism, In A. G. Reynolds (Ed.),Bilingualism, multiculturalism, and second language learning: The McGill conference inhonour of
Wallace E. Lambert. Hillsdale, NY: Lawrence Erlbaum Associates, Publishers.
Richert , E.S. (1985). The state of the art of identification of gifted students in the United States.Gifted Education International, 3, 47-51.
Richert , E.S. (1986). Toward the Tao of giftedness. Special Issue: The IQ controversy. Roeper Review,
8 , 197-204.
Richert, E. S. (1987). Rampant problems and promising practices in the identification ofdisadvantaged gifted students. Gif'ted Child Quarterly, 31 , 149-154.
Richert, E.S., Alvino, J.J., & McDonnel, R.C. (1982). National report on identification: Assessment andrecommendations for comprehensive identification of gifted and talented youth. Sewell, NJ:Educational
Improvement Center.
Rimm, S. B. (1988). Family environments of underachieving gifted students. Gifted Child Quarterly,
32, 353-359
Robinson, N. M., & Chamrad, D. L. (1986). Appropriate uses of intelligence tests with gifted children.
Roeper Review, 8,160-163.
Rotter, J. B. Generalized expectancies for internal versus external control of reinforcement.Psychological Monographs, 80, (Whole No. 609).
Rotter, J. B. (1975). Some problems and misconceptions related to the construct of internal versusexternal control of reinforcement. Journal of Consulting and Clinical Psychology, 43, 56-67.
Saccuzzo, D. P. (1993). Identifying underrepresented disadvantaged gifted and talented children: Amultifaceted approach. (Available from D.P. Saccuzzo, Ph.D.; San Diego State University; 6363Alvarado Court,Suite 103; San Diego, CA 92120-4913).
Saccuzzo, D.P., Hermanson, D.P., Dome, M., Johnson, N.E., & Shamieh, E. (1990). The identification ofgiftedness as a function of ethnic background. Paper presented at the meeting of the Western
Psychological Association, Los Angeles.
1 3
Saccuzzo, D. P., & Johnson, N. E. (1992). Symposium overview: Evaluating giftedness across ethnic
backgrounds: Traditional vs nontraditional approaches. Abstracts of seven presentations preparedfor the WPA-RMPA Annual Meeting, April 22-25. 1993, Phoenix.
Saccuzzo, D. E, & Johnson, N. E. (undated). Identifying underrepresented gifted and talented children:
Results for 35,000 culturally diverse children. Proposal to present at Javits conference on December
11.
Saccuzzo, D. P., Johnson, N. E., & Guertin, T. L. (1993). Information-processing in gifted vs nongifted
African-American, Latino, Filipino, and white children: Speeded vs nonspeeded paradigms. Manuscript
submitted for publication.
Saccuzzo, D. P., Johnson, N.E., & Russell,G. (1992). Verbal versus performance IQs for giftedAfrican-American, Caucasian, Filipino, and Hispanic children. Psychological Assessment, 4,
239-244.
Saccuzzo, D. P., Kerr, J., Marcus, A., & Brown, R. (1979). Input capability and speed of inform ation-
processing in mental retardation. Journal of Abnormal Psychology, 88, 341-345.
Saccuzzo, D. P., & Larson, G. E. (1987). Analysis of test-retest reliability for a battery of cognitive speed
tests. (Report No. 88-10). San Diego CA: Navy Personnel Research and Development Center.
Saccuzzo, D. P., Larson, G. E., & Rimland, B. (1986). Visual, auditory and reaction time approaches tothe measurement of speed of information processing and individual differences in intelligence.Personalihy and Individual Differences, 2, 659-668.
Saccuzzo, D.P., & Lewandowski, D.G. (1976). The WISC as a diagnostic tool. Journal of Clinical
Psychology, 32, 115-124.
Saccuzzo, D. P., & Marcus, A. (1983). Speed ofinformation processing in mental retardation improves
with practice. Paper presented at the 63rd Annual Meeting of the American PsychologicalAssociation, San Francisco, CA.
Saccuzzo, D. P., & Michael, B. (1984). Speed of information processing and structural limitations inretarded and dual-diagnosed retarded-schizophrenic persons. American Journal of Mental
Deficiency, 89, 187-195.
Salthouse, T. A., & Prill, K. (1983). Analysis of a perceptual skill. Journal of Experimental Psychology:
Human Perception and Performance, 9, 607-621.
San Diego City Schools. (1992). Proceduresfor the certification of gifted and talented students 1992-1993.
San Diego, CA: San Diego City Rhools, School Services Division, Exceptional Programs
Department.
Sattler, J.M. (1988). Assessment of children. San Diego: Jerome M. Sattler, Publisher
Shaklee, B. D. (1992). Identification of young gifted students. Special issue: Early childhood. Journal
for the Education of the Gifted, 15 (2), 134-144.
Shaw, F.W. II (1986). Identification of the gifted: Design defects and the law. Urban Education, 21,
42-61.
Sidles, C., & MacAvoy, J. (1987). Navajo adolescents' scores on a primary language questionnaire, the
Raven Standard Progressive Matrices (RSPM), and the Comprehensive Test of Basic Skills
(C18S): A correlational study. Educational and Psychological Measurement, 47, 703-709.
144 145

146
Sitkei, E.G., & Meyers, C.E. (1969). Comparative structure of intellect in middle- and lower-class four-
year-olds of two ethnic groups. Developmental Psychology, 1, 592-604.
Smith, G. A., & McPhee, K. A. (1987). Performance on a coincidence timing task correlates with
intelligence. Intelligence, n, 161-167.
Smith, G. A., & Stanley, G. (1983). Clocking g:Relating intelligence and measures of timed performance.
Intelligence, 7, 353-368.
Snow, RE., Kyllonen, P.C., & Marshalek, B. (1984). The topography of ability and learning
correlations. In R.J. Sternberg (Ed.), Advances in the psychology of human intelligence (Vol. 2,
pp. 47-103). Hillsdale, NJ: Erlbaum.
Span, P., & Overtoom-Corsmit, R. (1986). Information processing by intellectually gifted pupils solving
mathematical problems. Educational Studies in Mathematics, 17, 273-295.
Spearman, C. (1904). "General intelligence" objectively determined and measured. American
Journal of Psychology, 15, 210-293.
Spearman, C.E. (1923). The nature of intelligence and the principles of cognition. London: Macmillan.
Spearman, C. (1927a). The abilities of man. New York: MacMillan.
Spearman, C. (1927b). The nature of "intelligence" and the principles of cognition (2nd ed.). London:
MacMillan.
Sternberg, R.J. (1981). A componential theory of intellectual giftedness. Gifted Child Quarterly, 25,
86-93.
Sternberg, R.J. (1982). Lies we live by; Misapplication of tests in identifying the gifted. Gifted Child
Quarterly, 26, 157-161.
Sternberg, R. J., & Davidson, J. E. (1983). Insight in the gifted. Educational Psychologist, 18, 51-57.
Sternberg, R.J. (1986). Intelligence applied: Understanding and increasing your intellectual skills. San
Diego: Harcourt Brace Jovanovich.
Stevenson, H. W., Chen, C., & Uttal, D. H. (1990). Beliefs and achievement: A study of Black, White
and Hispanic children. Child Development, 61, 508-523.
Sullivan, A. R. (1973). The identification of gifted and academically talented black students: A
hidden exceptionality Journal of Special Education, 7, 373-379.
Sunset Review Advisory Committee III (1986). Sunset Review Advisony Committee III Report: A report
to the legislature. Sacramento, CA: California State Department of Education.
Supplee, P. L. (1989). Students at risk: The gifted underachiever. Roeper Review, 11, 163-166.
Terman, L.M. (1916). The measurement of intellig,mce. Boston: Houghton-Mifflin.
Thomas, J. A., Gallagher, J., & Purvis, J. (1981). Reaction time and anticipation time: Effects of
development. Research Quarterly for Exercise and Sport, 52, 359-367.
Thorndike, E.L. (1927). The measurement of intelligence. New York: Bureau of Publications, Teachers
College, Columbia University
145

Tulkin, S.R., & Newbrough, J.R. (1968). Social class, race, and sex differences on the Raven (1956)Standard Progressive Matrices. Journal of Consulting and Clinical Psychology, 15, 201-293.
Valencia, R. (1984). Reliability of the Raven Coloured Progressive Matrices for Anglo and for Mexican-American children. Psychology in the Schools, 21, 49-52.
VanTassel-Baska, J. (1989). The role of the family in the success of disadvantaged gifted learners.Journal for the Education of the Gifted, 13, 22-36.
Vernon, P. A. (1981). Reaction time and intelligence in the mentally retarded. Intelligence, 5, 345-355.
Vernon, P. A. (1987). Speed of information-processing and intelligence. Norwood, NJ: Able:: Publishing Co.
Vernon, P. A., Nador, S., & Kantor, L. (1985). Reaction times and speed-of-processing: Their relationshipto timed and untimed measures of intelligence. Intelligence, 9, 357-374.
Vernon, P.E. (1950). The structure of human abilities. New York: Wiley.
Vickers, D., Nettelbeck, T., & Willson, R. J. (1972). Perceptual indices of performance: The measurementof "inspection time" and "noise" in the visual system. Perception, 1, 263-295.
Vygotsky, L. S. (1962). Thought and language. (E. Hanfmann & G. Vakar, Eds. and Trans.).Cambridge, MA: MIT Press. (Original work published 1934).
Wagner, R. K., & Sternberg, R. J. (1984). Alternativeconceptions of intelligence and their implications
for education. Review of Educational Research, 54, 179-224.
Waldron, K. A., Saphire, D. G., & Rosenbaum, S. A. (1987). Learning disabilities and giftedness:Identification based on self concept, behavior, and academic patterns. Journal of Learning
Disabilities, 20 (7, 422-427): 432.
Wallerstein, J. S. (1985). The overburdened child: Some long-term consequences of divorce. Social
Work, 30, 116-123.
Wechsler, D. (1958). The measurement and appraisal of adult intelligence (4th ed.). Baltimore: Williams
& Wilkins.
Whitmore, J. R. (1980). Giftedness, conflict, and underachievement. Boston: Allyn & Bacon.
Wiener, G., & Milton, T. (1970).Epidemiology, 91, 260-272.
Willings, D., & Greenwood, B.International, 7, 27-32.
Demographic correlates of low birth weight. American Journal of
(1990). Some ways of helping underachievers. Gifted Education
Wolfe, J. A. (1991). Underachieving gifted males: Are we missing the boat? Roeper Review, 13,
181-184.
Young, T W. & Shorr, D. N. (1986). Factors affecting locus of control in school children. Genetic,
Social, and General Psychology Monographs, 112, 405-417.
Zentella, A. C. (1981). Language variety among Puerto Ricans. In C. A. Ferguson & S. B. Health
(Eds.), Language in the USA (pp. 218-238). New York: Cambridge University Press.
Zigler, E., & Farber, E.A. (1985). Commonalities between the intellectual extremes: Giftedness and
mental retardation. In F.D. Horowitz & M.D. O'Brien (Eds.), The gifted and talented: Developmental
perspectives. Washington, D.C.: American Psychological Association.
146147
Zilli, M. G. (1971). Reasons why the gifted adolescent underachieves and some of the implications ofguidance and counseling to this problem. Gifted Child Quarterly, 15, 279-292.
148
147
Related Documents