1 A Descriptive Study of Informal Learning Spaces in the College of Business Administration, Northern Arizona University, Fall 2006 James V. Pinto Professor of Economics Sabbatical Semester

Welcome message from author
This document is posted to help you gain knowledge. Please leave a comment to let me know what you think about it! Share it to your friends and learn new things together.
Transcript
1
A Descriptive Study of Informal Learning Spaces in the College of Business Administration, Northern
Arizona University, Fall 2006
James V. PintoProfessor of EconomicsSabbatical Semester
2
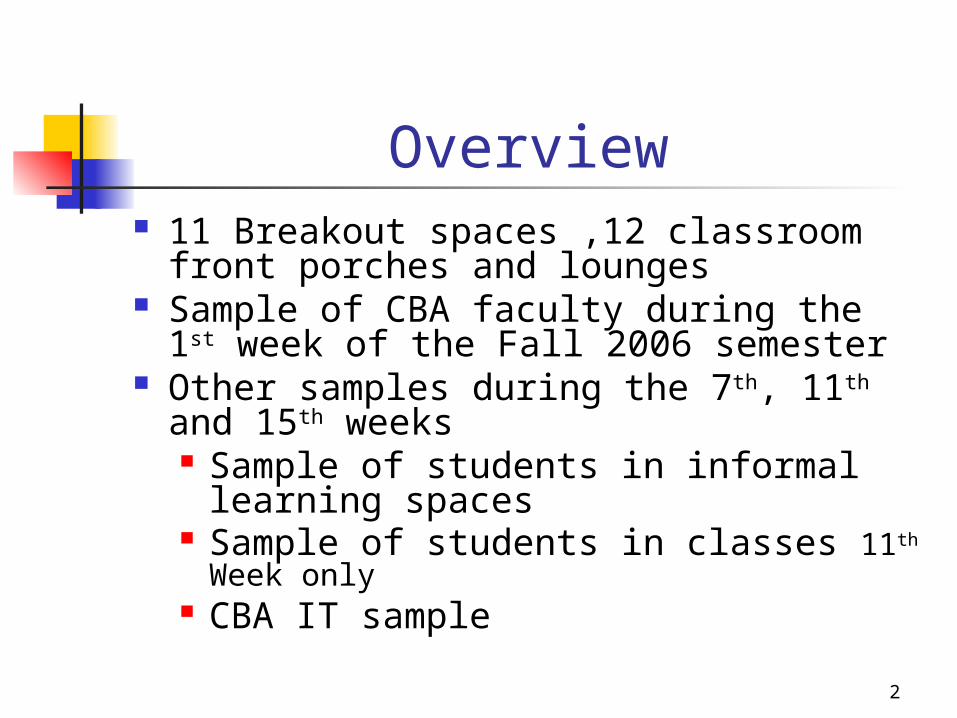
Overview 11 Breakout spaces ,12 classroom front
porches and lounges Sample of CBA faculty during the 1st
week of the Fall 2006 semester Other samples during the 7th, 11th and
15th weeks Sample of students in informal
learning spaces Sample of students in classes 11th
Week only CBA IT sample
3
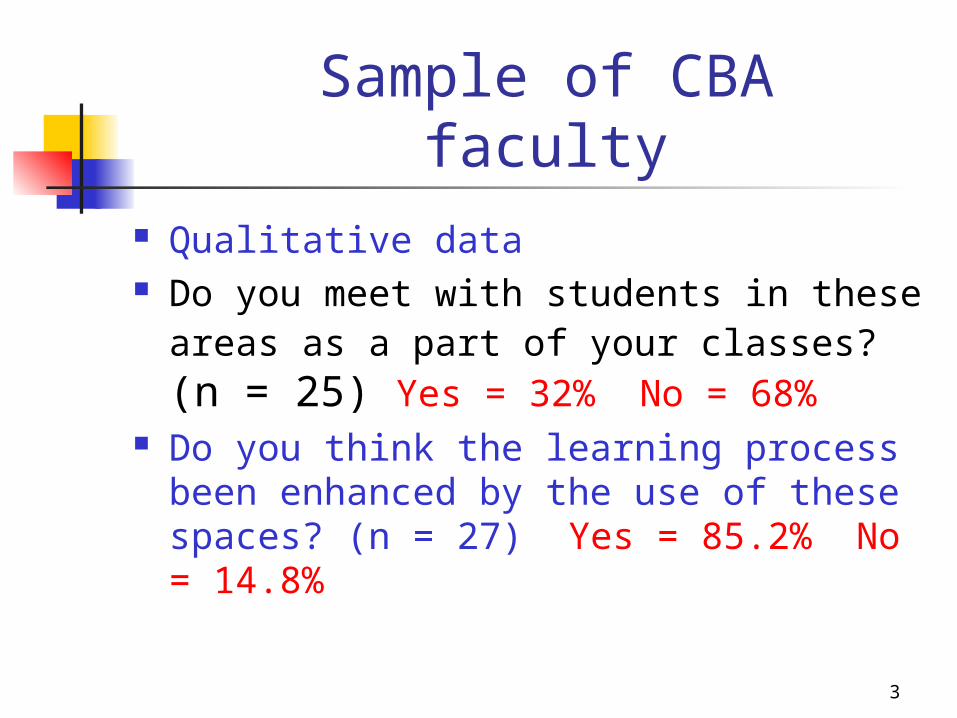
Sample of CBA faculty Qualitative data Do you meet with students in these
areas as a part of your classes? (n = 25) Yes = 32% No = 68%
Do you think the learning process been enhanced by the use of these spaces? (n = 27) Yes = 85.2% No = 14.8%
4
Sample of Students in Informal Learning Spaces
Thanks to MBA students Krista Conway and Eileen Maldonado for doing the surveys
Both quantitative and qualitative data (in- person surveys )
Stratified sample across all stations and times of day (each day of the 7th, 11th and 15th weeks of the semester)
Detailed data by station and aggregated by floors and building totals
Data from students who use the spaces
5
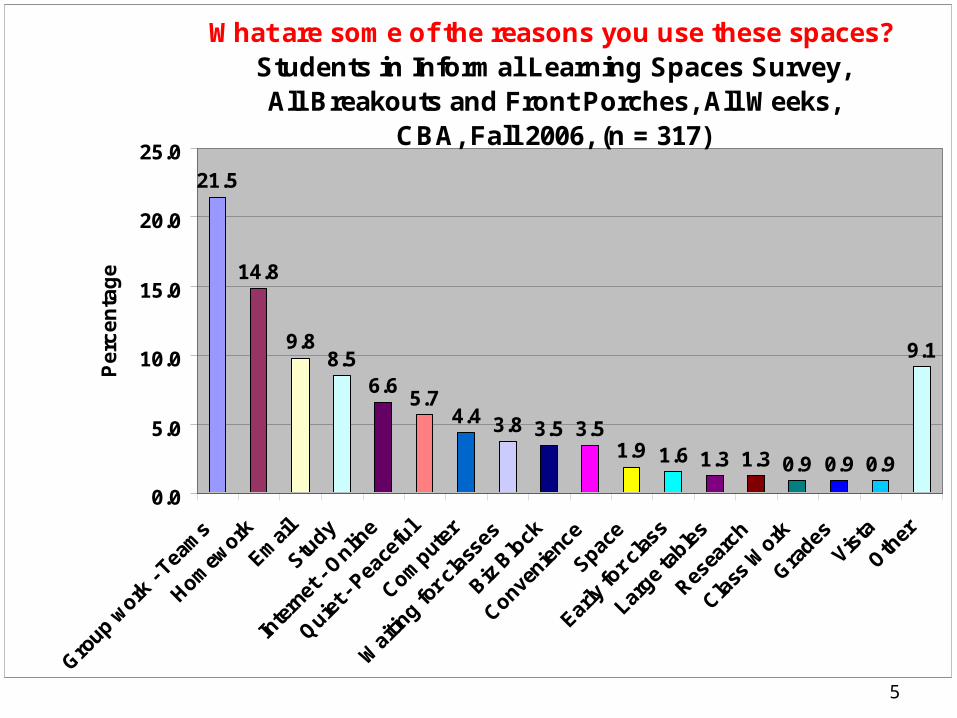
What are some of the reasons you use these spaces? Students in Informal Learning Spaces Survey,All Breakouts and Front Porches, All Weeks,
CBA, Fall 2006, (n = 317)
21.5
14.8
9.88.5
6.65.7
4.4 3.8 3.5 3.51.9 1.6 1.3 1.3 0.9 0.9 0.9
9.1
0.0
5.0
10.0
15.0
20.0
25.0
Group w
ork -
Team
s
Homew
ork
Emai
l
Study
Inte
rnet
- Onlin
e
Quiet -
Pea
cefu
l
Comput
er
Wai
ting fo
r cla
sses
Biz B
lock
Convenie
nce
Space
Early
for c
lass
Large
table
s
Resea
rch
Class
Work
Grades
Vista
Other
Pe
rce
nta
ge
6
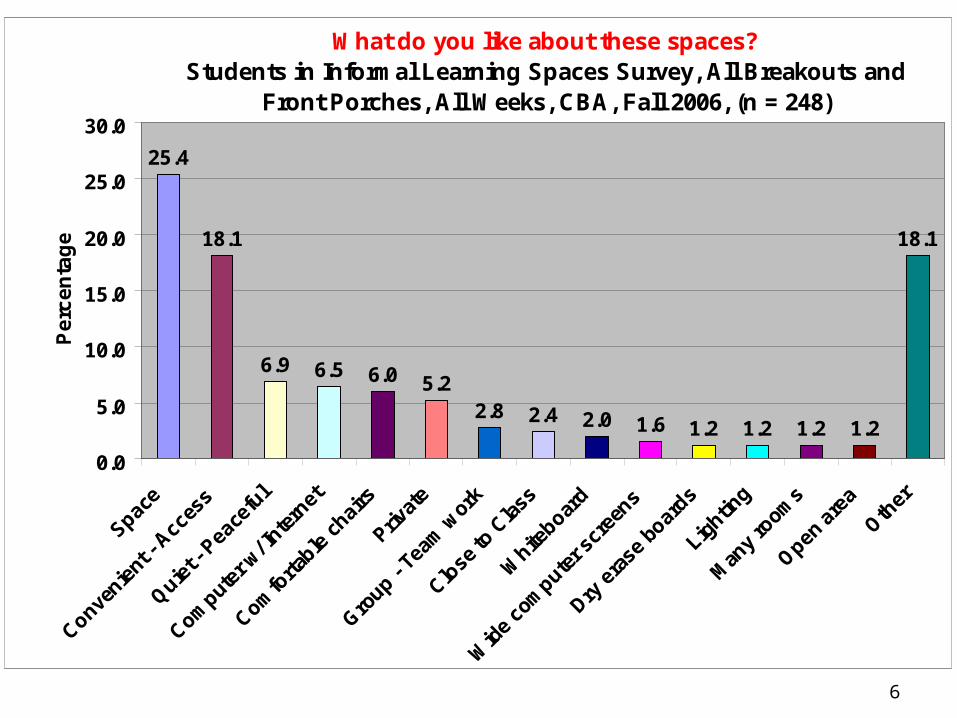
What do you like about these spaces?Students in Informal Learning Spaces Survey, All Breakouts and
Front Porches, All Weeks, CBA, Fall 2006, (n = 248)
25.4
18.1
6.9 6.5 6.0 5.22.8 2.4 2.0 1.6 1.2 1.2 1.2 1.2
18.1
0.0
5.0
10.0
15.0
20.0
25.0
30.0
Space
Convenie
nt -
Acces
s
Quiet -
Pea
cefu
l
Comput
er w
/ Inte
rnet
Comfo
rtable
chai
rs
Privat
e
Group -
Team
wor
k
Close
to C
lass
White
board
Wid
e co
mpute
r scr
eens
Dry e
rase
boar
ds
Lightin
g
Man
y ro
oms
Open a
rea
Other
Pe
rce
nta
ge

7
How could these spaces be improved? Students in Informal Learning Spaces Survey, All Breakouts and
Front Porches, All Weeks, CBA, Fall 2006, (n = 168)
20.2
14.3
8.3 8.36.5
4.83.6 3.6 3.6
1.8 1.2 1.2 1.2
21.4
0.0
5.0
10.0
15.0
20.0
25.0
More
than
one
com
puter
More
spac
es -
Rooms
Divis
ion- W
all d
ivid
ing -
too lo
ud
Printe
rs N/A
Doors
More
sea
ting
Climat
e Contro
l-Too c
old
Comfo
rtable
chai
rs
Campus
phones
Ability
to s
ave
on com
puter
Shades
/blin
ds in
bre
akout s
paces
Speake
rs fo
r com
puters
Other
Pe
rce
nta
ge
8
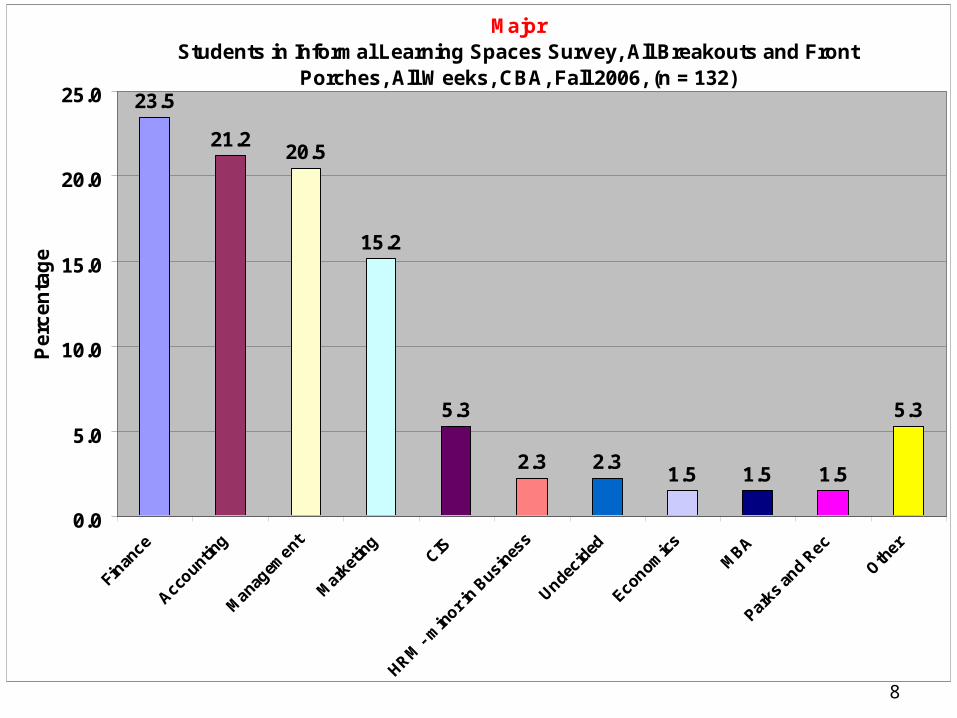
MajorStudents in Informal Learning Spaces Survey, All Breakouts and Front
Porches, All Weeks, CBA, Fall 2006, (n = 132)23.5
21.220.5
15.2
5.3
2.3 2.31.5 1.5 1.5
5.3
0.0
5.0
10.0
15.0
20.0
25.0
Finan
ce
Accoun
ting
Mana
gemen
t
Mark
etin
g CIS
HRM -
min
or in B
usine
ss
Undeci
ded
Econom
ics
MBA
Parks
and R
ec
Other
Pe
rce
nta
ge

9
Where did you study or use computers before the new CBA building was opened?
Students in Informal Learning Spaces Survey, All Breakouts and Front Porches, All Weeks, CBA, Fall 2006, (n = 45)
33.3 33.3
11.1
6.74.4
11.1
0.0
5.0
10.0
15.0
20.0
25.0
30.0
35.0
Home Library SLAC Old BusinessLab
Other Labs Other
Per
cent
age

10
Percentage of Times Visited and Found Empty or Occupied, All Spaces, All Weeks,
Students in Informal Learning Spaces Survey, CBA, Fall 2006, n = 398
83.6
43.0
63.0 61.8
16.4
57.0
37.0 38.2
0.0
10.0
20.0
30.0
40.0
50.0
60.0
70.0
80.0
90.0
Front Proches Breakout Spaces Lounges All Spaces
Per
cen
tag
e
% of Times Empty % of Times Occupied
11
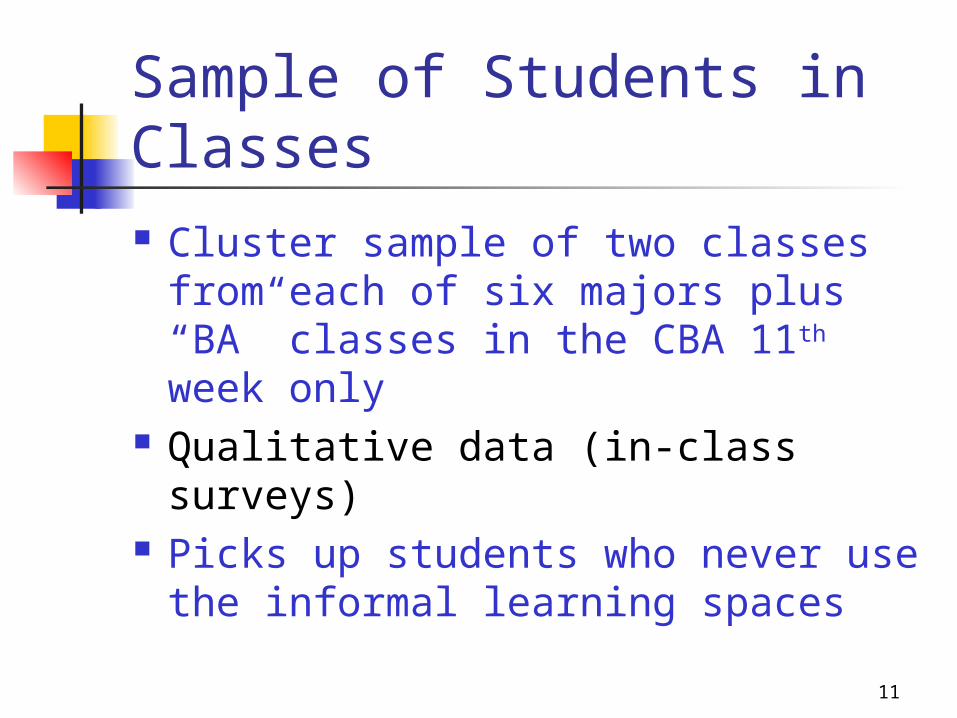
Sample of Students in Classes Cluster sample of two classes from
each of six majors plus “BA” classes in the CBA 11th week only
Qualitative data (in-class surveys) Picks up students who never use
the informal learning spaces
12
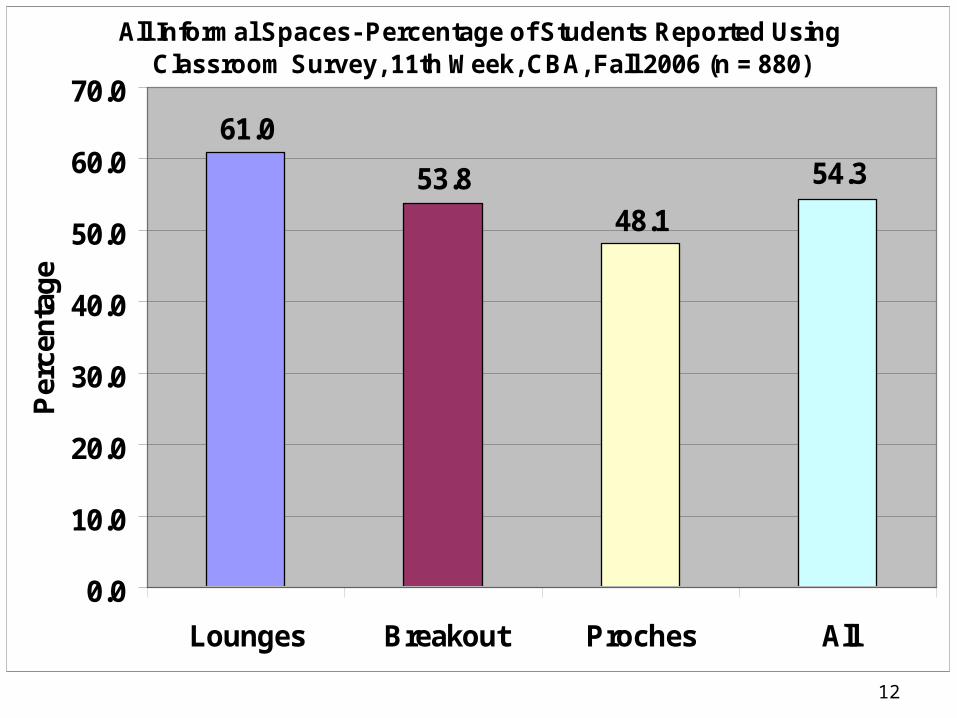
All Informal Spaces- Percentage of Students Reported UsingClassroom Survey, 11th Week, CBA, Fall 2006 (n = 880)
54.3
48.1
53.8
61.0
0.0
10.0
20.0
30.0
40.0
50.0
60.0
70.0
Lounges Breakout Proches All
Per
cen
tag
e
13
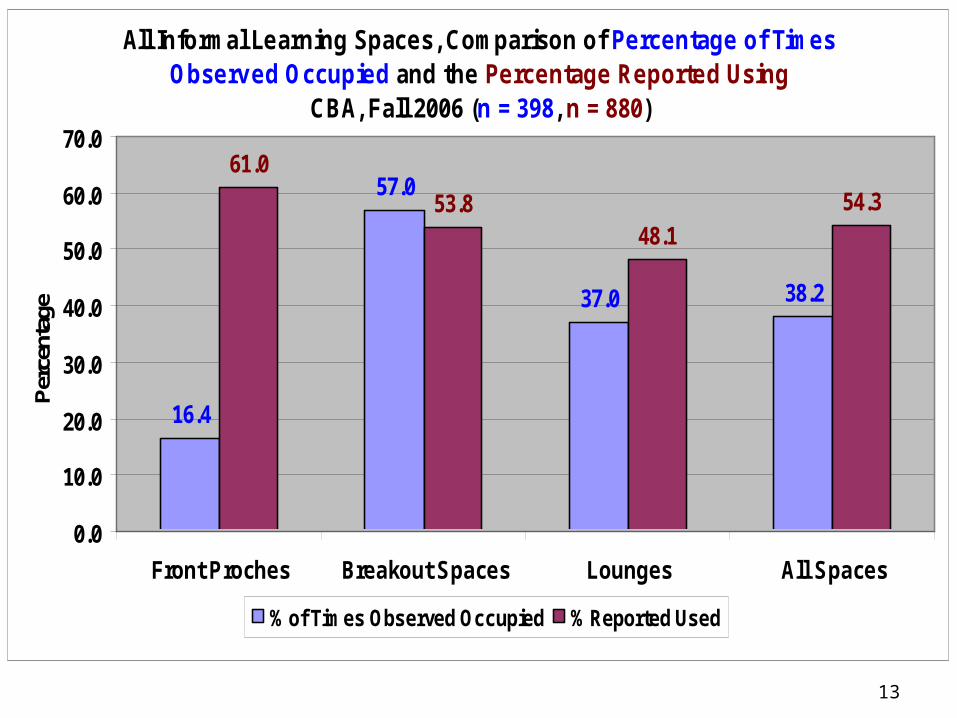
All Informal Learning Spaces, Comparison of Percentage of Times Observed Occupied and the Percentage Reported Using
CBA, Fall 2006 (n = 398, n = 880)
38.237.0
57.0
16.4
54.348.1
53.8
61.0
0.0
10.0
20.0
30.0
40.0
50.0
60.0
70.0
Front Proches Breakout Spaces Lounges All Spaces
Per
cent
age
% of Times Observed Occupied % Reported Used
14
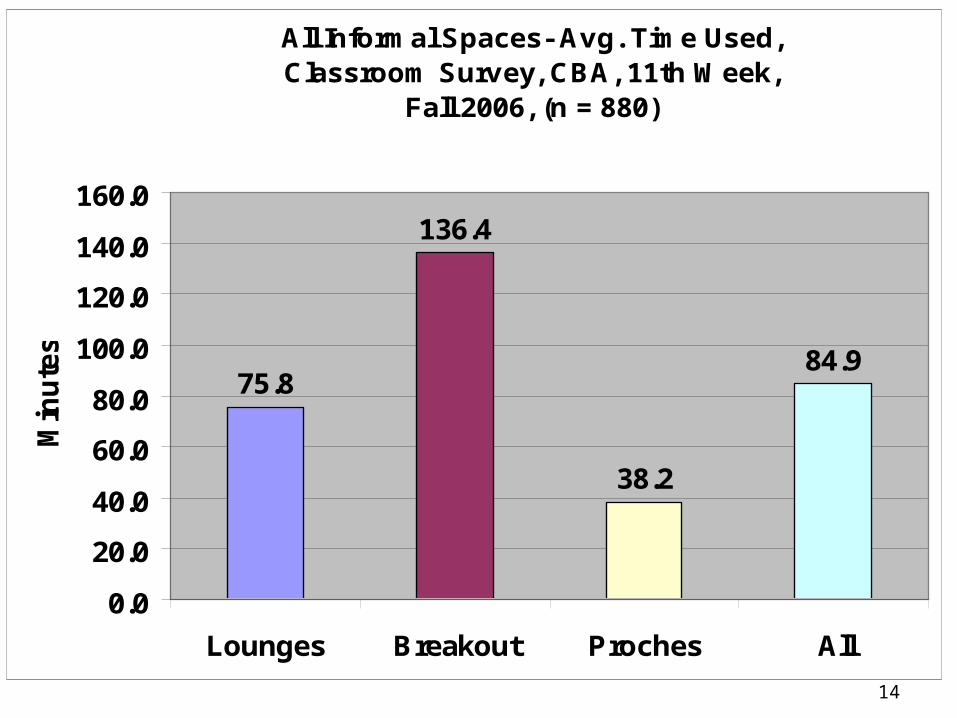
All Informal Spaces- Avg. Time Used, Classroom Survey, CBA, 11th Week,
Fall 2006, (n = 880)
75.8
136.4
38.2
84.9
0.0
20.0
40.0
60.0
80.0
100.0
120.0
140.0
160.0
Lounges Breakout Proches All
Min
ute
s
15
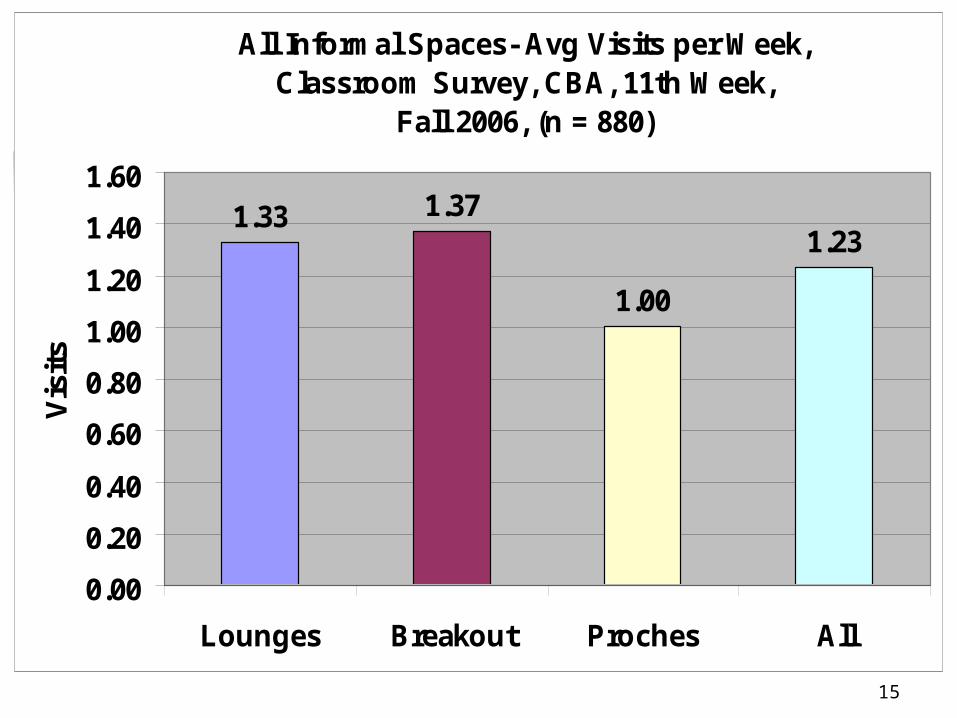
All Informal Spaces- Avg Visits per Week,Classroom Survey, CBA, 11th Week,
Fall 2006, (n = 880)
1.33 1.37
1.00
1.23
0.00
0.20
0.40
0.60
0.80
1.00
1.20
1.40
1.60
Lounges Breakout Proches All
Vis
its
16
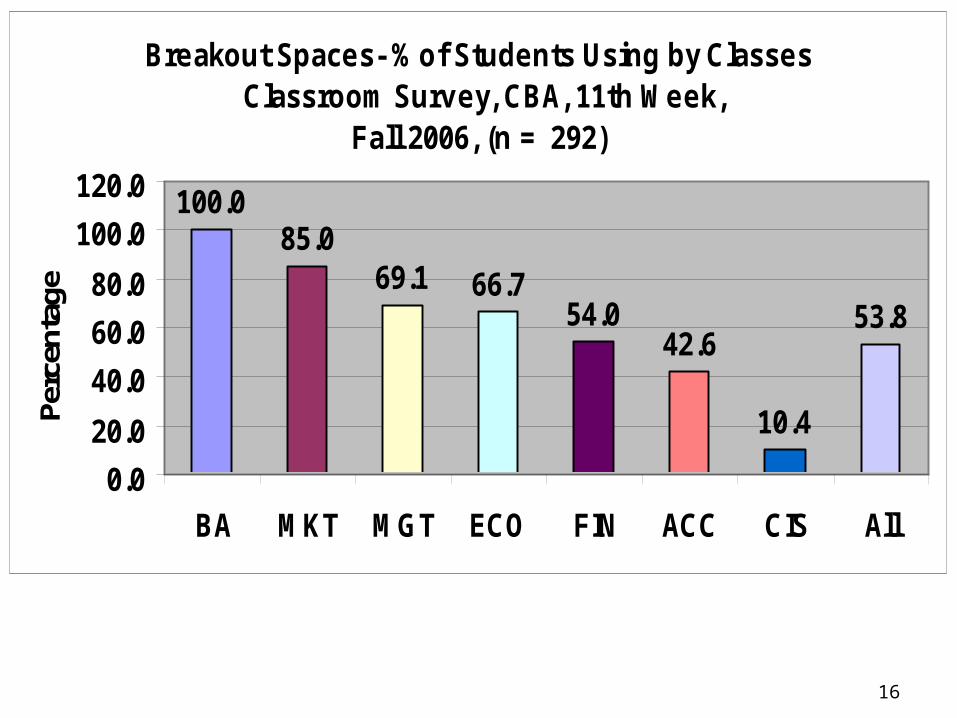
Breakout Spaces- % of Students Using by Classes Classroom Survey, CBA, 11th Week,
Fall 2006, (n = 292)
100.085.0
69.1 66.754.0
42.6
10.4
53.8
0.0
20.0
40.0
60.0
80.0
100.0
120.0
BA MKT MGT ECO FIN ACC CIS All
Perc
enta
ge
17
CBA IT sample Thanks to Dick Toeniskoetter, Damon
Brown and MBA student Jeff Gilbert Sampling of all logons at all front
porches and breakout space locations in the CBA (each day of the 7th, 11th and 15th weeks)
Quantitative data on location, day, time of day and duration of each logon
Detailed data by station and aggregated by floors and building totals

18
Percentage of Logons, All Weeks, All Front Porches and Breakout Spaces
CBA IT Survey, Fall 2006 (n = 2633)
24.4 24.622.5
20.7
6.7
1.00.0
5.0
10.0
15.0
20.0
25.0
30.0
Per
cent
age
19
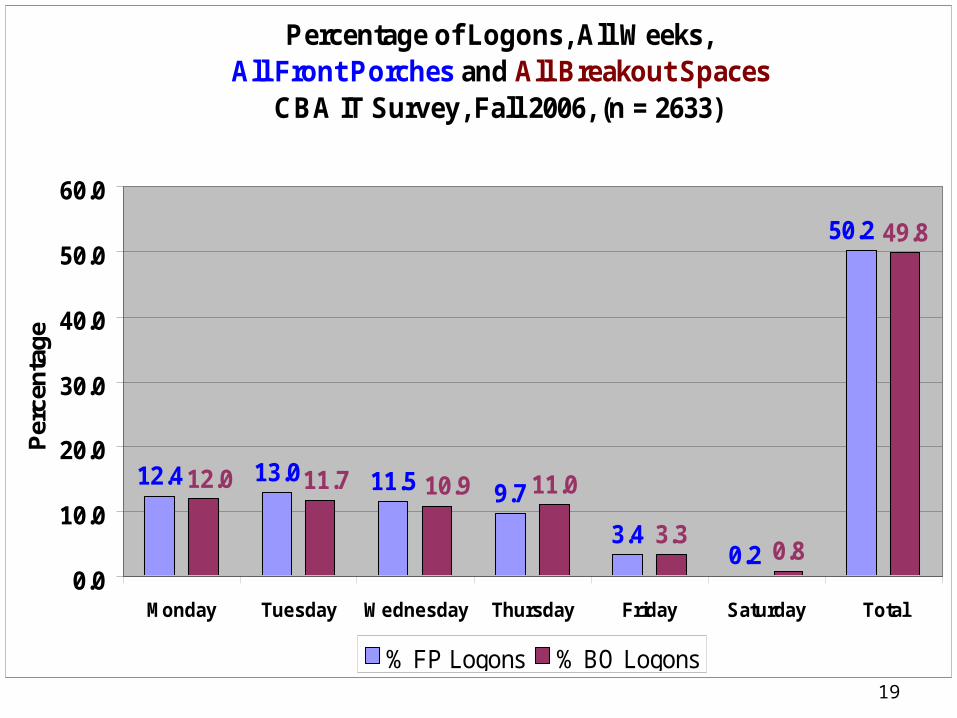
Percentage of Logons, All Weeks, All Front Porches and All Breakout Spaces
CBA IT Survey, Fall 2006, (n = 2633)
12.4 13.0 11.5 9.7
3.40.2
11.0
3.30.8
49.850.2
10.911.712.0
0.0
10.0
20.0
30.0
40.0
50.0
60.0
Monday Tuesday Wednesday Thursday Friday Saturday Total
Per
cen
tag
e
% FP Logons % BO Logons

20
Average Length of Logons, All Weeks, All Front Porches and Breakout Spaces
CBA IT Survey, Fall 2006 (n = 2633)
0:30:16 0:29:21 0:30:33 0:31:08 0:31:40
0:59:07
0:00:00
0:07:12
0:14:24
0:21:36
0:28:48
0:36:00
0:43:12
0:50:24
0:57:36
1:04:48
Monday Tuesday Wednesday Thursday Friday Saturday
Avg
Tim
e L
og
on
(h
r, m
in, s
ec)
21
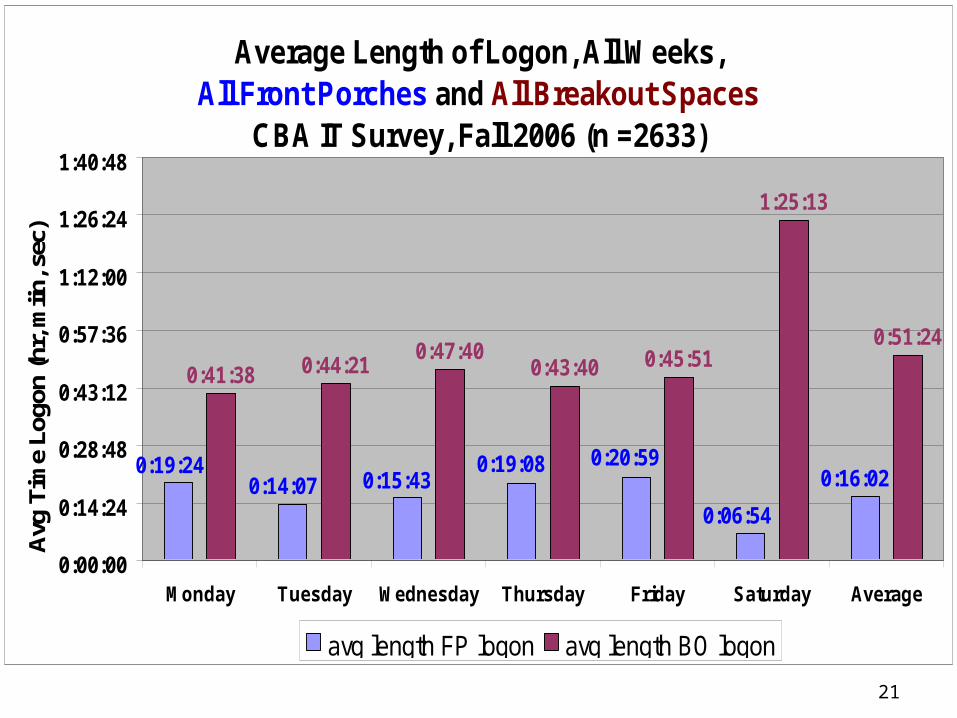
Average Length of Logon, All Weeks, All Front Porches and All Breakout Spaces
CBA IT Survey, Fall 2006 (n =2633)
0:41:38 0:44:210:47:40
0:43:40 0:45:51
1:25:13
0:51:24
0:16:02
0:06:54
0:20:590:19:080:15:430:14:07
0:19:24
0:00:00
0:14:24
0:28:48
0:43:12
0:57:36
1:12:00
1:26:24
1:40:48
Monday Tuesday Wednesday Thursday Friday Saturday Average
Avg
Tim
e Lo
gon
(hr,
miin
, sec
)
avg length FP logon avg length BO logon
22
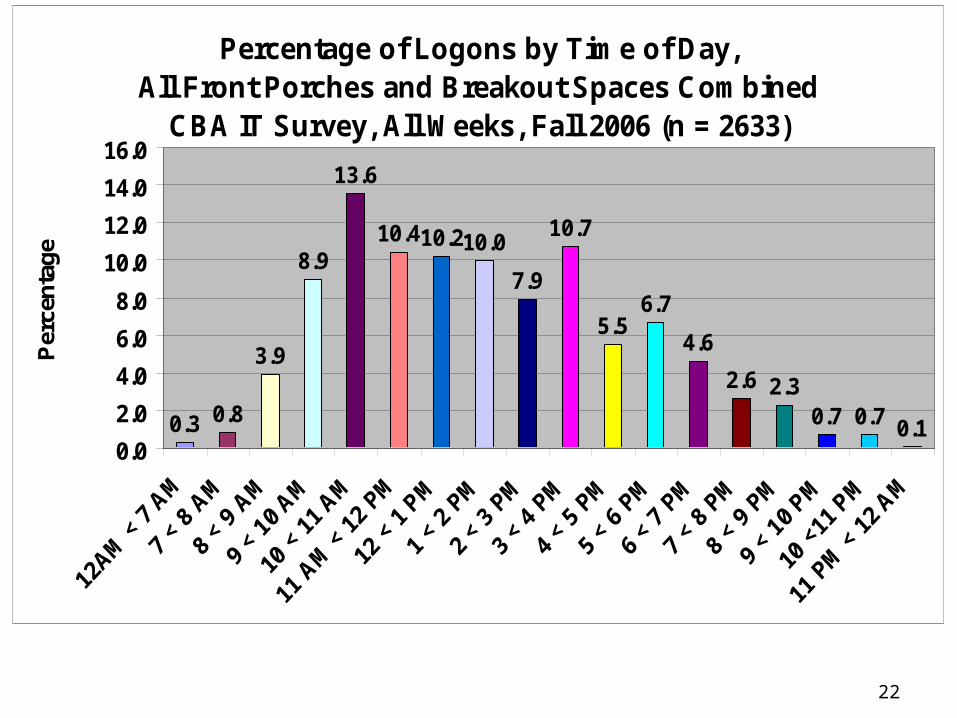
Percentage of Logons by Time of Day, All Front Porches and Breakout Spaces Combined
CBA IT Survey, All Weeks, Fall 2006 (n = 2633)
0.3 0.8
3.9
8.9
13.6
10.410.210.0
7.9
10.7
5.56.7
4.6
2.6 2.30.7 0.7 0.1
0.0
2.0
4.0
6.0
8.0
10.0
12.0
14.0
16.0
Per
cent
age
23
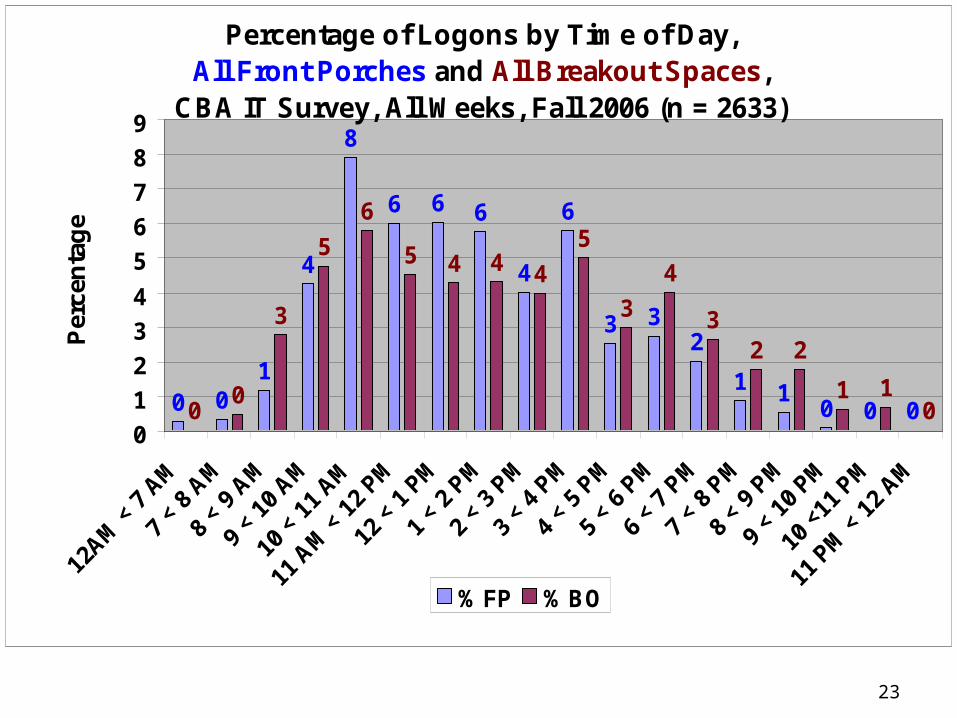
Percentage of Logons by Time of Day,All Front Porches and All Breakout Spaces,
CBA IT Survey, All Weeks, Fall 2006 (n = 2633)
0 01
4
8
6 6 6
4
6
3 32
1 10 0 00
0
3
5
6
5 4 4 4
5
3
4
32 2
1 10
0
1
2
3
4
5
6
7
8
9
Per
cen
tag
e
% FP % BO
24
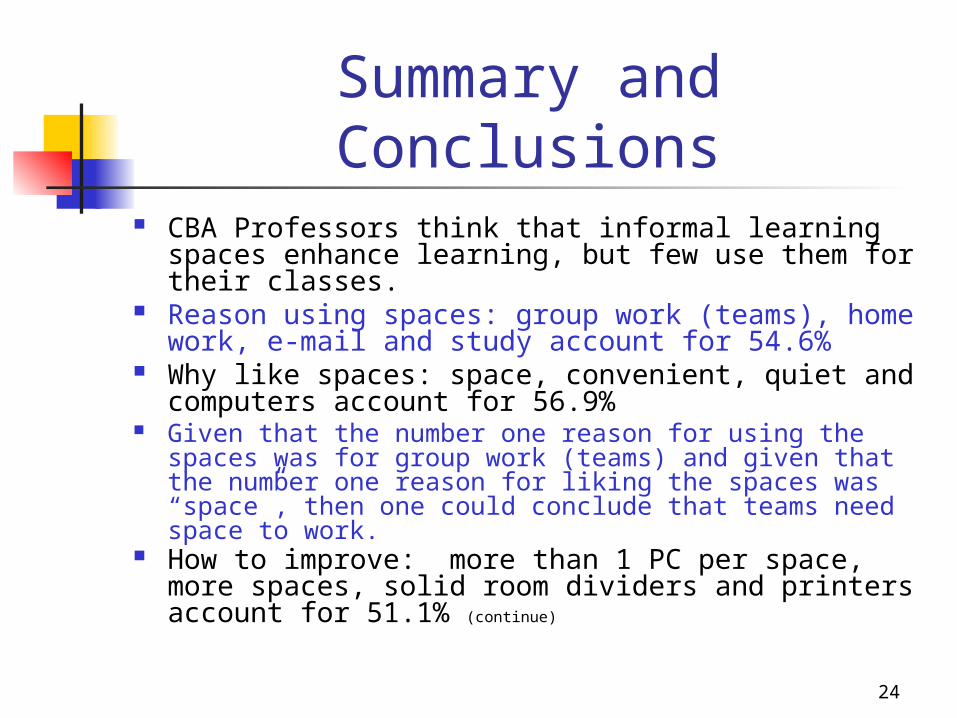
Summary and Conclusions CBA Professors think that informal learning spaces
enhance learning, but few use them for their classes.
Reason using spaces: group work (teams), home work, e-mail and study account for 54.6%
Why like spaces: space, convenient, quiet and computers account for 56.9%
Given that the number one reason for using the spaces was for group work (teams) and given that the number one reason for liking the spaces was “space”, then one could conclude that teams need space to work.
How to improve: more than 1 PC per space, more spaces, solid room dividers and printers account for 51.1% (continue)
25
Summary and Conclusions (continued)
Where study before new CBA: home and library accounted for 66.5%
Observed percentage of times used was less than percentage used reported by students in all but one category (breakout)
Measured average length of logons was less than that reported by students in all spaces with PCs
Uniform distribution of logons Monday through Thursday (continue)
26
Summary and Conclusions (continued)
Breakout spaces average length of logon is 3.2 times that of front porches
Highest percentage logons 10-11AM 13.6%
10AM-2PM accounts for 44.2% of logons

27
More Analysis Needed How can more disaggregation of
the data lead to useful results? Identification of under and over
utilized individual spaces Can aggregation by floors give useful
results? Can analysis of the individual
weeks lead to trends or patterns?
Related Documents