1 511 Services “Hit the 511 Services “Hit the Road” Road” Kentucky Kentucky Florida Florida Nebraska Nebraska Minnesota Minnesota San Francisco San Francisco Iowa Iowa

1 511 Services “Hit the Road” Kentucky Florida Nebraska Minnesota San Francisco Iowa.
Dec 29, 2015
Welcome message from author
This document is posted to help you gain knowledge. Please leave a comment to let me know what you think about it! Share it to your friends and learn new things together.
Transcript

1
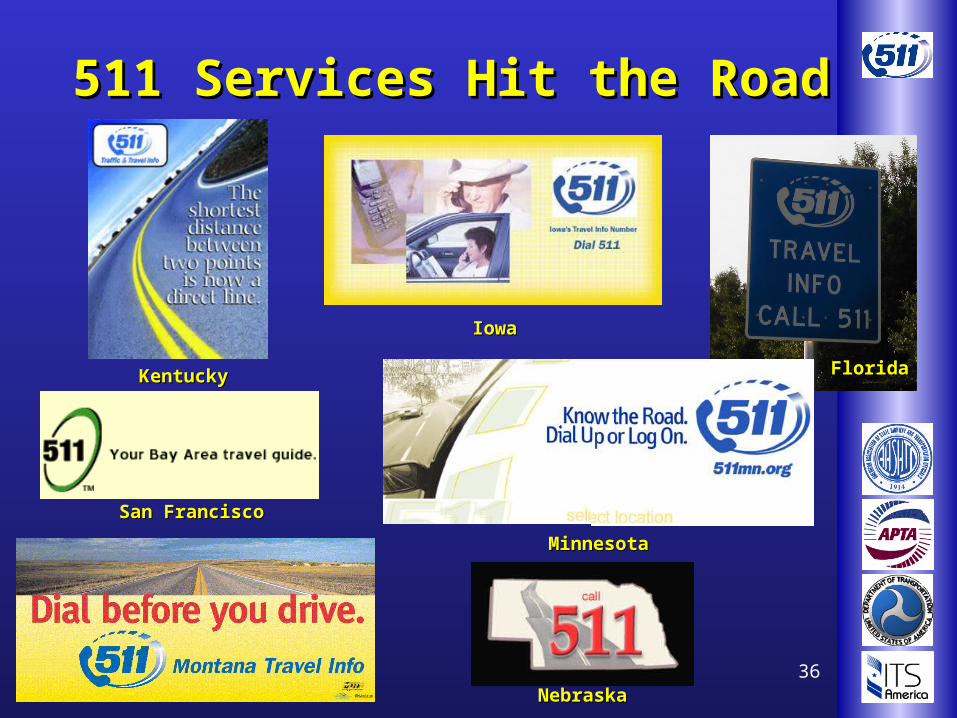
511 Services “Hit the Road”511 Services “Hit the Road”
KentuckyKentucky FloridaFlorida
NebraskaNebraska
MinnesotaMinnesota
San FranciscoSan Francisco
IowaIowa

2
AgendaAgenda
• BackgroundBackground• Consumer Market Research Consumer Market Research • 511 Deployment Progress511 Deployment Progress• Performance Measures for 511 Performance Measures for 511 • 511’s Future511’s Future• Wrap-upWrap-up

3
BackgroundBackground
• March 1999 – March 1999 – US DOT’s N11 US DOT’s N11 Petition to FCC Petition to FCC
• July 2000 – FCC July 2000 – FCC designated 511 designated 511
• 2005 – FCC will 2005 – FCC will review progress review progress in implementing in implementing 511511

4
BackgroundBackground
• 511 Deployment Coalition511 Deployment Coalition – Policy and deployment guidance in an Policy and deployment guidance in an
entrepreneurial and institutional home.entrepreneurial and institutional home.• Led by AASHTO and includes ITS America, Led by AASHTO and includes ITS America,
APTA, states, metro areas, transit properties, APTA, states, metro areas, transit properties, associations, private sector providers, associations, private sector providers, telecommunicationstelecommunications
• Support from US DOTSupport from US DOT
– Goal Statement: Goal Statement: “The establishment “The establishment of a national 511 system available of a national 511 system available to a majority of Americans by 2005 to a majority of Americans by 2005 that is sustainable and provides that is sustainable and provides value to its users.”value to its users.”

5
Gallup ResearchGallup Research
• Conducted surveys (August - October 2001)Conducted surveys (August - October 2001)– National Telephone SurveyNational Telephone Survey– Mail-in Survey of Landstar Long-haul DriversMail-in Survey of Landstar Long-haul Drivers
• AudienceAudience– Commuters / Through Travelers – 920Commuters / Through Travelers – 920– Commercial Vehicle Operators – 131Commercial Vehicle Operators – 131– Long-haul CVO – 42Long-haul CVO – 42
• Conducted focus groups (November 2001)Conducted focus groups (November 2001)– PhiladelphiaPhiladelphia– Minneapolis / St. PaulMinneapolis / St. Paul– Lincoln, NELincoln, NE– Los AngelesLos Angeles

6
DemographicsDemographics
• South – 35%South – 35%• Midwest – 23%Midwest – 23%• West – 22%West – 22%• Northeast – 20%Northeast – 20%
• Suburban – 50%Suburban – 50%• Urban – 28%Urban – 28%• Rural – 22%Rural – 22%

7
ModesModes
• Motor Vehicle Only – 79%Motor Vehicle Only – 79%
• Transit 20%Transit 20%– Rail, No Bus – 7%Rail, No Bus – 7%– Bus & Rail – 7%Bus & Rail – 7%– Bus, No Rail – 6%Bus, No Rail – 6%
8
AwarenessAwareness
Awareness of Automated Telephone Traveler Information Awareness of Automated Telephone Traveler Information SystemsSystems
0%
10%
20%
30%
40%
50%
60%
70%
Northeast Midwest South West
ATIS Awareness 511 Awareness

9
Information SourcesInformation Sources
• Television – 72%Television – 72%• Radio – 70%Radio – 70%• Internet – 40%Internet – 40%
• Telephone System – 20%Telephone System – 20%– 34% of Bus Users Have Called34% of Bus Users Have Called– 34% of Those in the West Have 34% of Those in the West Have
CalledCalled

10
Likelihood of Using 511Likelihood of Using 511
• Extremely or Somewhat Likely to Extremely or Somewhat Likely to Use 511Use 511– Long-haul CVO – 74% Long-haul CVO – 74% – Telephone System User – 72%Telephone System User – 72%– Internet User – 71%Internet User – 71%– CVO – 68%CVO – 68%– Radio User – 63%Radio User – 63%– 5+ Trips of 50+ Miles – 63%5+ Trips of 50+ Miles – 63%– Television User – 62%Television User – 62%– Through Travelers – 61%Through Travelers – 61%– Commuters – 58%Commuters – 58%– 1 - 4 Trips of 50+ Miles – 56%1 - 4 Trips of 50+ Miles – 56%– No Trips of 50+ Miles – 45%No Trips of 50+ Miles – 45%

11
Estimated UseEstimated Use
• CVO – 61% Daily or WeeklyCVO – 61% Daily or Weekly• Long-haul CVO – 57% Daily or WeeklyLong-haul CVO – 57% Daily or Weekly• Daily or Weekly & Few Times a Month Daily or Weekly & Few Times a Month
– 54%– 54%– Daily or Weekly – 25% of TOTALDaily or Weekly – 25% of TOTAL– Few Times a Month – 29% of TOTALFew Times a Month – 29% of TOTAL
• Commute of 30+ Minutes – 43% Daily Commute of 30+ Minutes – 43% Daily or Weeklyor Weekly
• Northeast – 35% Daily or WeeklyNortheast – 35% Daily or Weekly• Commute of 16 - 30 Minutes – 29% Commute of 16 - 30 Minutes – 29%
Daily or WeeklyDaily or Weekly• Commute of 15 Minutes or Less – 24% Commute of 15 Minutes or Less – 24%
Daily or WeeklyDaily or Weekly

12
Desired FeaturesDesired Features
Public Transportation UsersPublic Transportation Users
• Public Transportation Delays – 70%Public Transportation Delays – 70%
25% Critical 45% Useful
• Travel Time Estimates – 65%Travel Time Estimates – 65%23% Critical 42% Useful
• Connection to Live Operator – 63%Connection to Live Operator – 63%17% Critical 46% Useful
• Crowded Trains or Buses – 51%Crowded Trains or Buses – 51%15% Critical 36% Useful
13
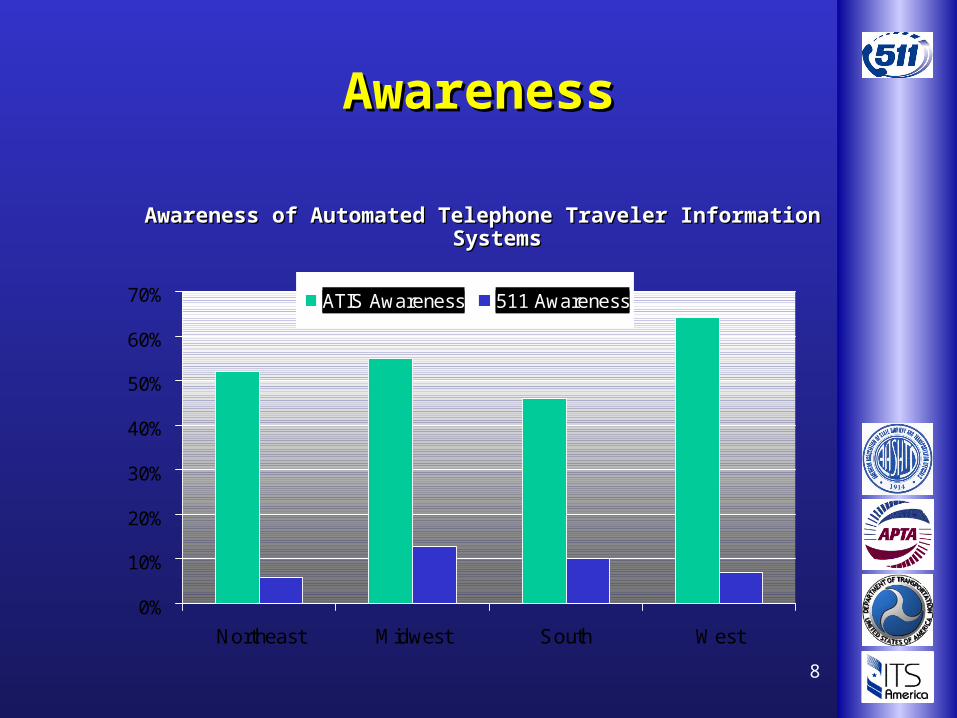
Desired FeaturesDesired Features
Motor Vehicle UsersMotor Vehicle Users
• Weather Related Road Surface Weather Related Road Surface Conditions – 78%Conditions – 78%40% Critical 38% Useful
• Accident or Road Incident Reports – 75%Accident or Road Incident Reports – 75%28% Critical 47% Useful
• Construction Updates – 74%Construction Updates – 74%26% Critical 48% Useful
• Traffic Congestion – Freeways – 69%Traffic Congestion – Freeways – 69%24% Critical 45% Useful
• Special Events – 69%Special Events – 69%19% Critical 50% Useful

14
Desired FeaturesDesired Features
Motor Vehicle UsersMotor Vehicle Users
• Traffic Congestion – Arterials – 64%Traffic Congestion – Arterials – 64%17% Critical 47% Useful
• Average Travel Time Estimates – 60%Average Travel Time Estimates – 60%11% Critical 49% Useful
• Average Speed Estimates – 50%Average Speed Estimates – 50%9% Critical 41% Useful
• Parking Information – 44%Parking Information – 44%8% Critical 36% Useful

15
Desired FeaturesDesired Features
• Consistency Critical forConsistency Critical for
– Long-haul CVO – 53% Long-haul CVO – 53%
– Extremely Likely Users – 51% Extremely Likely Users – 51%
• 68% of Extremely Likely 68% of Extremely Likely Users Want Speech Users Want Speech RecognitionRecognition
16
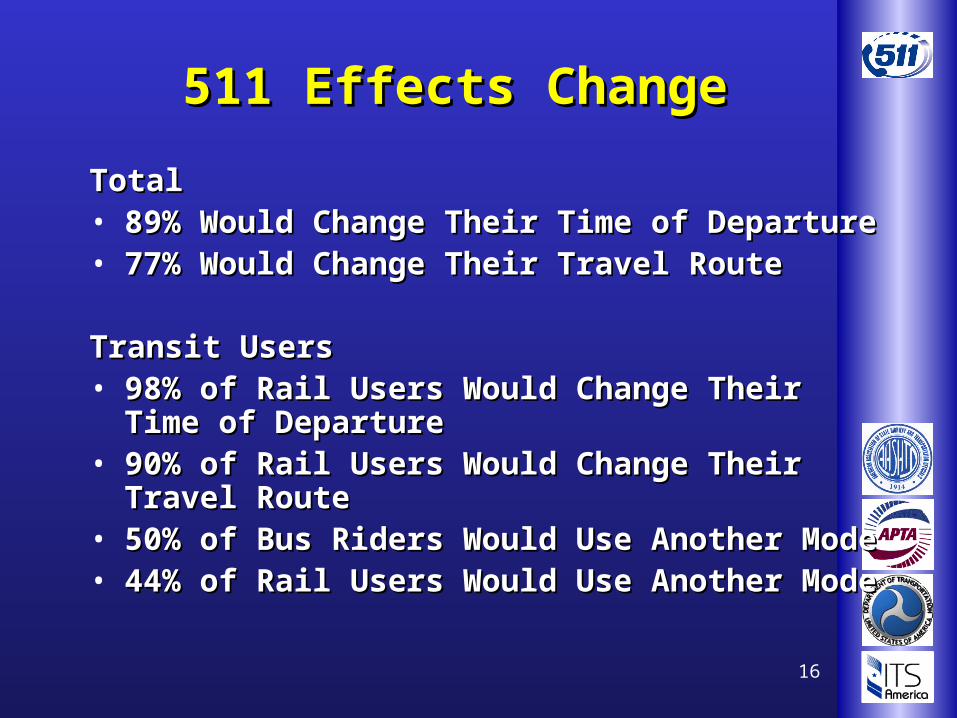
511 Effects Change511 Effects Change
TotalTotal• 89% Would Change Their Time of Departure89% Would Change Their Time of Departure• 77% Would Change Their Travel Route77% Would Change Their Travel Route
Transit UsersTransit Users• 98% of Rail Users Would Change Their Time 98% of Rail Users Would Change Their Time
of Departure of Departure • 90% of Rail Users Would Change Their 90% of Rail Users Would Change Their
Travel Route Travel Route • 50% of Bus Riders Would Use Another Mode50% of Bus Riders Would Use Another Mode• 44% of Rail Users Would Use Another Mode44% of Rail Users Would Use Another Mode

17
Focus Group Key Focus Group Key FindingsFindings
““We Do Not Have We Do Not Have Someone Who is Someone Who is Responsible for Responsible for
Gathering All That Gathering All That Information”Information”

18
Focus Group Key Focus Group Key FindingsFindings
• What if I Am Not Traveling What if I Am Not Traveling Out of My Area – It is Not Out of My Area – It is Not Traveler Information? Traveler Information?
• Traveler Information Does Traveler Information Does Not Equate With Your Own Not Equate With Your Own City – Think Traveling Down City – Think Traveling Down the Highway Like a Touristthe Highway Like a Tourist
• TRAVEL InformationTRAVEL Information

19
Red FlagRed Flag
• If They Used 511 and Found the If They Used 511 and Found the Information to be Inaccurate in Their Information to be Inaccurate in Their First Few Uses, They Would be Unlikely First Few Uses, They Would be Unlikely to Give the Service Another Chance. If to Give the Service Another Chance. If 511 is Deployed With Only Limited 511 is Deployed With Only Limited Features (Such as Weather / Road Features (Such as Weather / Road Conditions) When Users Also Want Conditions) When Users Also Want Accident and Congestion Reporting and Accident and Congestion Reporting and They Find the Service Lacking, it may be They Find the Service Lacking, it may be Difficult to Get These Users to Try the Difficult to Get These Users to Try the System Later Once Additional System Later Once Additional Information is Available.Information is Available.

20
BackgroundBackground
• 511 Deployment Coalition511 Deployment Coalition – Developed A Vision of a Mature 511 System and Developed A Vision of a Mature 511 System and
the Roles of Players to Make the Vision Realitythe Roles of Players to Make the Vision Reality• Examining two time periodsExamining two time periods
– 2005 & 20102005 & 2010
• Performance IndicatorsPerformance Indicators– Brand awarenessBrand awareness– Customer satisfactionCustomer satisfaction
» Information qualityInformation quality» Service qualityService quality» UsageUsage
– Population CoveragePopulation Coverage
• Roles to Achieve VisionRoles to Achieve Vision– National Level National Level – ImplementersImplementers– Private FirmsPrivate Firms

21
BackgroundBackground
• 511 Deployment Coalition511 Deployment Coalition– Objectives and OutcomesObjectives and Outcomes
• Continue to support and assist Continue to support and assist implementers and operators, planners and implementers and operators, planners and later adopters by:later adopters by:
– 511 Vision Model and Roadmap511 Vision Model and Roadmap– Issue Exploration and ResolutionIssue Exploration and Resolution– Deployers AssistanceDeployers Assistance– Guidelines UpdatesGuidelines Updates– Marketing and OutreachMarketing and Outreach
• Continue to ensure national interest is Continue to ensure national interest is served by:served by:
– 511 Vision Model and Roadmap511 Vision Model and Roadmap– Guidelines UpdatesGuidelines Updates– Marketing and OutreachMarketing and Outreach

22
BackgroundBackground
• 511 Deployment Coalition511 Deployment Coalition– Objectives and OutcomesObjectives and Outcomes
• Increase private sector participation by:Increase private sector participation by:– Including carriersIncluding carriers– Fall 2003 conference Fall 2003 conference
• Establish stable Coalition framework Establish stable Coalition framework through 2005 by:through 2005 by:
– Institutionalizing the Coalition into Institutionalizing the Coalition into Sponsoring OrganizationsSponsoring Organizations
• Set path for sponsoring organizations to Set path for sponsoring organizations to take more ownershiptake more ownership

23
511 Operational 511 Operational DeploymentsDeployments
• Cincinnati / Cincinnati / Northern KYNorthern KY
• NebraskaNebraska• UtahUtah• I-81 Corridor in I-81 Corridor in
VirginiaVirginia• ArizonaArizona• OrlandoOrlando• MinnesotaMinnesota
• SE FloridaSE Florida• Washington State (25%)Washington State (25%)• IowaIowa• South DakotaSouth Dakota• Kentucky StatewideKentucky Statewide• San FranciscoSan Francisco• Montana Montana • North DakotaNorth Dakota

24
511 Deployment Progress511 Deployment Progress
• 20032003
– Nevada Nevada – KansasKansas– New Mexico New Mexico – Maine Maine – New Hampshire New Hampshire – Boston Boston – AlaskaAlaska– IllinoisIllinois– North CarolinaNorth Carolina– TampaTampa– Washington State Washington State
(rest of the state)(rest of the state)
• 2004 2004 – Michigan Michigan – Florida Florida – VirginiaVirginia

25
Performance MeasuresPerformance Measuresfor 511for 511
• Tracked NationallyTracked Nationally– Population Coverage Population Coverage – UsageUsage
• Tracked Locally Tracked Locally – Brand AwarenessBrand Awareness– Customer SatisfactionCustomer Satisfaction
26
Performance MeasuresPerformance Measuresfor 511for 511
511 Population Coverage511 Population Coverage• As of February 28, 2003, 511 serves As of February 28, 2003, 511 serves
almost 41 M or 14% of the US almost 41 M or 14% of the US populationpopulation
• Total US Population 284.8MTotal US Population 284.8M
27
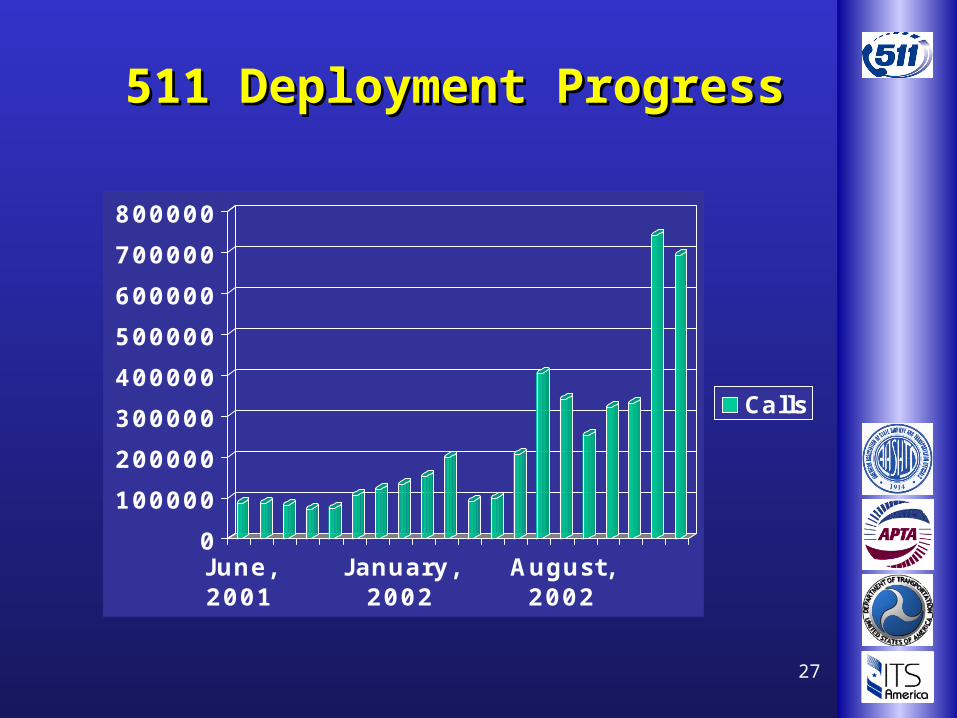
511 Deployment Progress511 Deployment Progress
0
100000
200000
300000
400000
500000
600000
700000
800000
June,2001
January,2002
August,2002
Calls

28
Total 511 Calls per Quarter Total 511 Calls per Quarter From June 2001 through December 2002From June 2001 through December 2002
0
300,000
600,000
900,000
1,200,000
1,500,000
1st
Qtr
2n
d
Qtr
3rd
Qtr
4th
Qtr
Call
s /
Qu
art
er
20012002

29
Usage for Systems Operational > 1 year Usage for Systems Operational > 1 year From June 2001 through December 2002From June 2001 through December 2002
0
100,000
200,000
300,000
400,000
1st
Qtr
2n
d
Qtr
3rd
Qtr
4th
Qtr
Call
s /
Qu
art
er
20012002

30
511’s Future511’s Future
• State of Arizona Model Deployment State of Arizona Model Deployment InitiativeInitiative– Announced July 11, 2002 for 2003 Announced July 11, 2002 for 2003
implementationimplementation
• Goal is to push the envelope in all Goal is to push the envelope in all areasareas– Information ContentInformation Content– Telephone System InterfaceTelephone System Interface– MarketingMarketing– Business ModelsBusiness Models– Quality ControlQuality Control– Evaluation: Evaluation: Underway with 511 Working Group Underway with 511 Working Group
participationparticipation

31
511’s Future511’s Future
• Border IssuesBorder Issues– How Areas Bordering Other 511 How Areas Bordering Other 511
Systems Will Be Served Systems Will Be Served
511 Coverage Area
Cell Sites
Cell Site
No 511 Coverage
MSC
Cell Site
Cell Site
Cell Site
New MexicoArizona
Cell Site
Cell Site
MSC

32
511’s Future511’s Future
• Regional Interoperability IssuesRegional Interoperability Issues
511 Coverage Area A 511 Coverage Area B 511 Coverage Area C
MSC
MSC
MSC
Cell Site
Cell Site
Cell Site
Cell Site
Cell Site
Cell Site
Cell Site
Cell Site
MSC

33
511’s Future511’s Future
• Capacity IssuesCapacity Issues– Managing Call Volume SpikesManaging Call Volume Spikes
Calls by Day of the Week in October 2002
0200400600800
100012001400160018002000
Mon
day
Tuesd
ay
Wed
nesd
ay
Thurs
day
Friday
Satur
day
Sunda
y
Calls by Hour in October 2002
0100200300400500600700800
12:0
0 AM
1:00
AM
2:00
AM
3:00
AM
4:00
AM
5:00
AM
6:00
AM
7:00
AM
8:00
AM
9:00
AM
10:0
0 AM
11:0
0 AM
12:0
0 PM
1:00
PM
2:00
PM
3:00
PM
4:00
PM
5:00
PM
6:00
PM
7:00
PM
8:00
PM
9:00
PM
10:0
0 PM
11:0
0 PM
October 2002 Daily Overview
811
467392 369382432
0100200300400500600700800900
1 2 3 4 5 6 7 8 9 10 11 12 13 14 15 16 17 18 19 20 21 22 23 24 25 26 27 28 29 30 31
Nu
mb
er o
f C
alls
Phone Web

34
Wrap-upWrap-up
• Near-term DeliverablesNear-term Deliverables– National Progress ReportNational Progress Report– National Performance Measures National Performance Measures – Deployment Assistance ReportsDeployment Assistance Reports
• Regional InteroperabilityRegional Interoperability• Transit ContentTransit Content• Weather ContentWeather Content• Roadway Content Quality Roadway Content Quality
– Guidelines version 2.0Guidelines version 2.0– February Policy Committee DirectionFebruary Policy Committee Direction
• Guidance on InteroperabilityGuidance on Interoperability• Performance MeasuresPerformance Measures• Funding SustainabilityFunding Sustainability• Private Sector RolePrivate Sector Role

35
Wrap-upWrap-up• Resources AvailableResources Available
– 511 Websites511 Websites• http://www.its.dot.gov/511/511.htm• http://www.fhwa.dot.gov/trafficinfo/511.htm • http://www.itsa.org/511.html • www.apta.com/news/511/
– ITS America E-mail AdvisoryITS America E-mail Advisory– Project WebsitesProject Websites– Association WebsitesAssociation Websites
36
511 Services Hit the Road511 Services Hit the Road
KentuckyKentucky FloridaFlorida
NebraskaNebraska
MinnesotaMinnesota
San FranciscoSan Francisco
IowaIowa
Related Documents