1 2006 Arlington County Resident Study Topline Report Prepared By Prepared For Arlington County Commuter Services Preliminary Report August 9, 2006

Welcome message from author
This document is posted to help you gain knowledge. Please leave a comment to let me know what you think about it! Share it to your friends and learn new things together.
Transcript
1
2006 Arlington County Resident Study Topline Report
Prepared By
Prepared For
Arlington County Commuter Services
Preliminary Report
August 9, 2006
Southeastern Institute of
Research2
2006 Arlington
County Resident Study
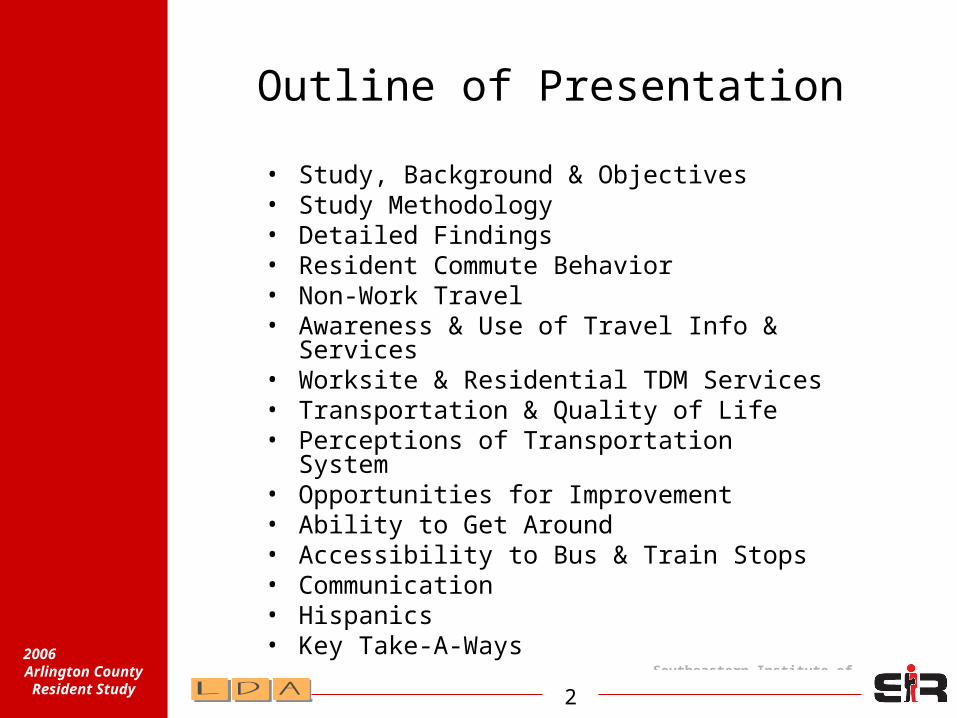
Outline of Presentation
• Study, Background & Objectives• Study Methodology• Detailed Findings• Resident Commute Behavior• Non-Work Travel• Awareness & Use of Travel Info &
Services• Worksite & Residential TDM Services• Transportation & Quality of Life• Perceptions of Transportation System• Opportunities for Improvement• Ability to Get Around• Accessibility to Bus & Train Stops• Communication• Hispanics• Key Take-A-Ways

Southeastern Institute of
Research3
2006 Arlington
County Resident Study
Study Background
&Objectives
Southeastern Institute of
Research4
2006 Arlington
County Resident Study
Study Background
• This project is a component of the 2006-2008 ACCS Program Research and Evaluation Plan.
• The purpose of this component is to collect and analyze information needed to assess the performance of Arlington County Commuter Services (ACCS) and to enhance ACCS’ effectiveness in providing travel assistance services in Arlington County.
Southeastern Institute of
Research5
2006 Arlington
County Resident Study
Study Objectives
• Measure Arlington County residents’ overall satisfaction with their mobility and the County’s transportation system.
• Establish benchmark measures on residents’ overall ratings of their mobility and the County’s transportation system across a number of key attributes.
• Identify residents’ overall transportation/mobility needs and unmet needs.
• Assess the role Arlington County residents believe mobility/transportation system plays in making the County a desirable place to live and work.
Southeastern Institute of
Research6
2006 Arlington
County Resident Study
Study Objectives (Continued)
• Measure how Arlington County residents perceive the County’s performance in delivering on their expectations.
• Assess residents’ awareness and familiarity of non-SOV travel options available in Arlington County.
• Measure usage and usage intent of non-SOV travel options available in Arlington County.
• Measure awareness, use and impact of County’s transportation support organizations and services.
• Assess awareness and rating of Arlington County’s transportation-related public information outreach efforts.

Southeastern Institute of
Research7
2006 Arlington
County Resident Study
Study Methodology
Southeastern Institute of
Research8
2006 Arlington
County Resident Study
Methodology
• In order to meet the objectives established for this research, a random digit dialing telephone survey was conducted among residents of Arlington County.
• The questionnaire was designed to meet the specific objectives established for this research and CATI (Computer Assisted Telephone Interviewing) programmed for ease and quality of interviewing.
• Core questions were asked of all respondents. Others were asked only of those who rideshare or do not, depending upon the relevancy of the issue for each individual respondent.
Southeastern Institute of
Research9
2006 Arlington
County Resident Study
Methodology (Continued)
• In order to qualify, respondents had to meet the following criteria:
– Resident of Arlington County– Age 18 and older
• In addition, quotas were established to ensure sufficient numbers of respondents in key categories:
– Residents who primarily use ridesharing modes
– Residents who primarily do not use ridesharing modes
– Hispanic respondents– Non-Hispanic Respondents
In order to ensure the
highest quality
data, the interview
was available in
both English
and Spanish –
for the respondent
’s preference
Southeastern Institute of
Research10
2006 Arlington
County Resident Study
Methodology (Continued)
• At the start of this study, it was hypothesized that Ridesharers and Non-Ridesharers would have different perspectives, needs, and experiences.
• In order to make relevant comparisons between Ridesharers and Non-Ridersharers, three (3) groups are compared in this analysis:
– Primary Ridesharers– Secondary Ridesharers– Non-Ridesharers
Southeastern Institute of
Research11
2006 Arlington
County Resident Study
Methodology (Continued)
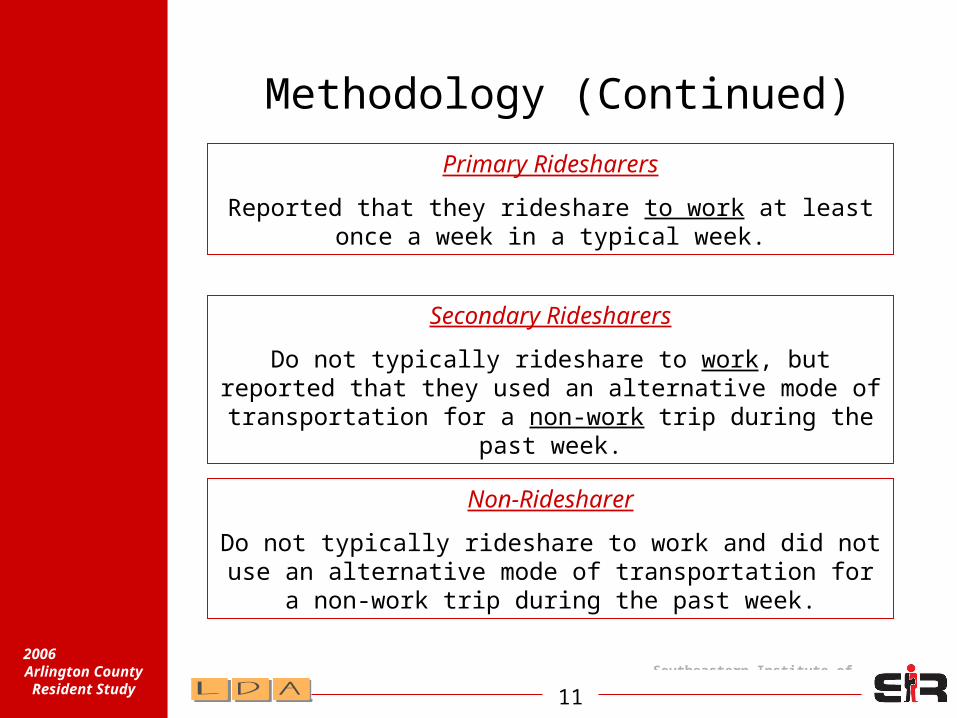
Primary Ridesharers
Reported that they rideshare to work at least once a week in a typical week.
Secondary Ridesharers
Do not typically rideshare to work, but reported that they used an alternative mode of transportation for a
non-work trip during the past week.
Non-Ridesharer
Do not typically rideshare to work and did not use an alternative mode of transportation for a non-work trip
during the past week.
Southeastern Institute of
Research12
2006 Arlington
County Resident Study
Methodology (Continued)
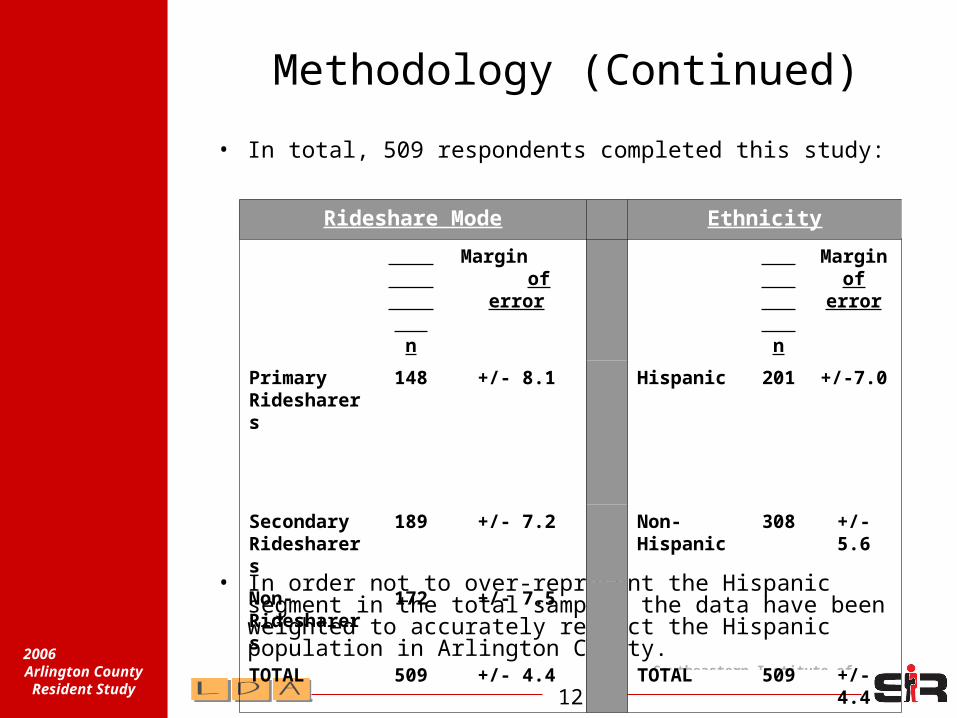
• In total, 509 respondents completed this study:
• In order not to over-represent the Hispanic segment in the total sample, the data have been weighted to accurately reflect the Hispanic population in Arlington County.
Rideshare Mode Ethnicity
n
Margin of error
n
Margin of
error
Primary Ridesharers
148 +/- 8.1 Hispanic 201
+/-7.0
Secondary Ridesharers
189 +/- 7.2 Non-Hispanic
308
+/- 5.6
Non-Ridesharers
172 +/- 7.5
TOTAL 509 +/- 4.4 TOTAL 509
+/- 4.4

Southeastern Institute of
Research13
2006 Arlington
County Resident Study
Detailed Findings

Southeastern Institute of
Research14
2006 Arlington
County Resident Study
Resident Commute
Behavior
Non-Work Travel
Awareness
& Use of Travel Info &
Services
Worksite & Residential
Services
Travel Patterns
& Choices
Southeastern Institute of
Research15
2006 Arlington
County Resident Study
Resident Commute Behavior
Southeastern Institute of
Research16
2006 Arlington
County Resident Study
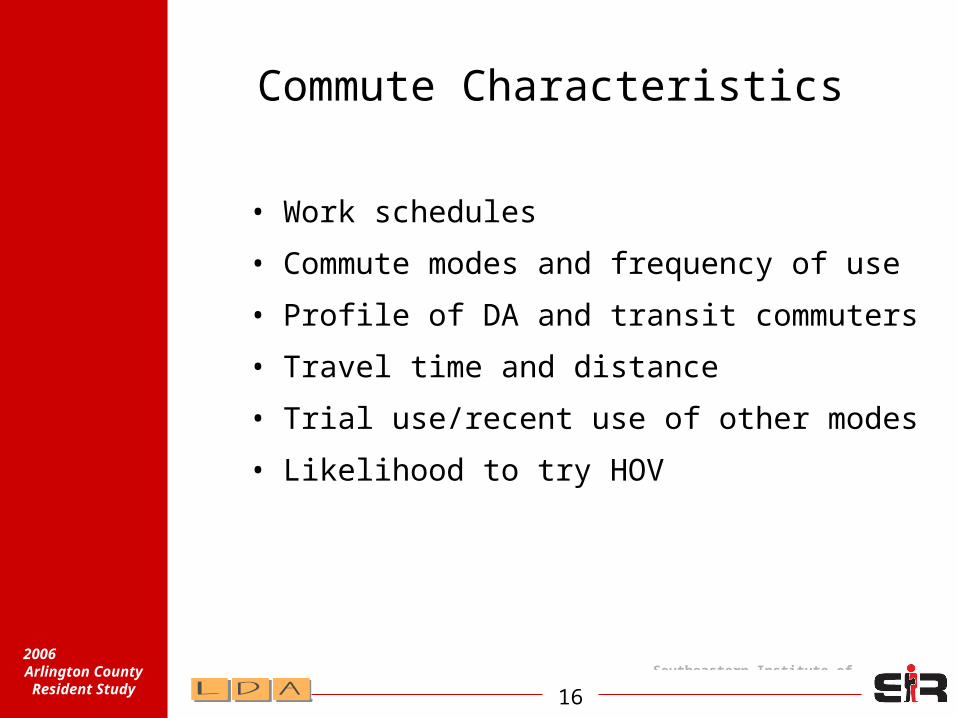
Commute Characteristics
• Work schedules
• Commute modes and frequency of use
• Profile of DA and transit commuters
• Travel time and distance
• Trial use/recent use of other modes
• Likelihood to try HOV
Southeastern Institute of
Research17
2006 Arlington
County Resident Study
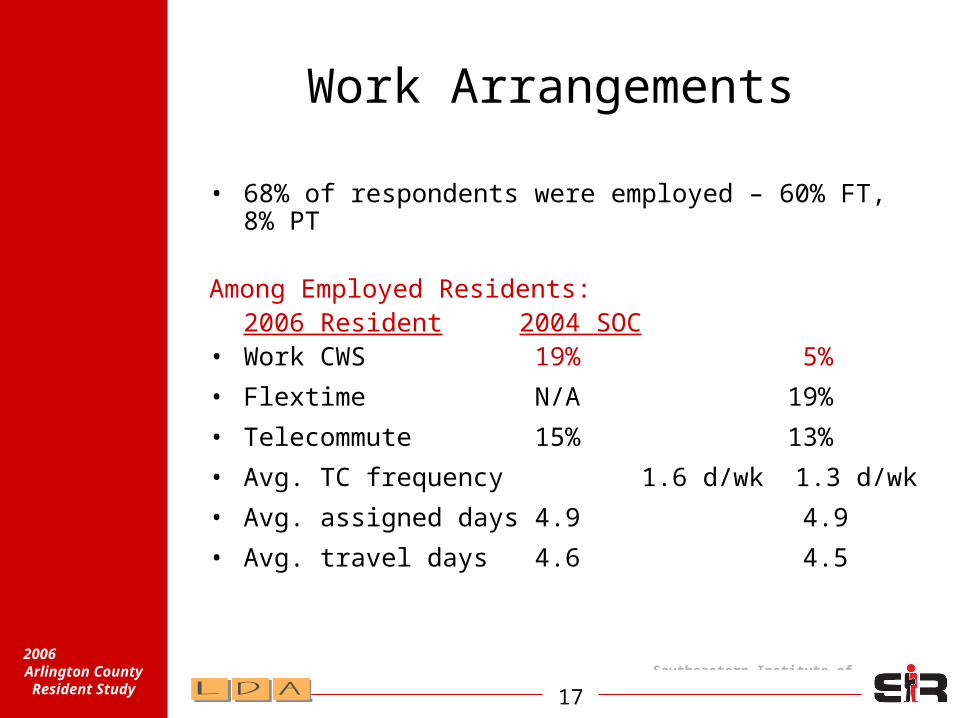
Work Arrangements
• 68% of respondents were employed – 60% FT, 8% PT
Among Employed Residents:2006 Resident 2004 SOC
• Work CWS 19% 5%
• Flextime N/A 19%
• Telecommute 15% 13%
• Avg. TC frequency 1.6 d/wk 1.3 d/wk
• Avg. assigned days 4.9 4.9
• Avg. travel days 4.6 4.5
Southeastern Institute of
Research18
2006 Arlington
County Resident Study
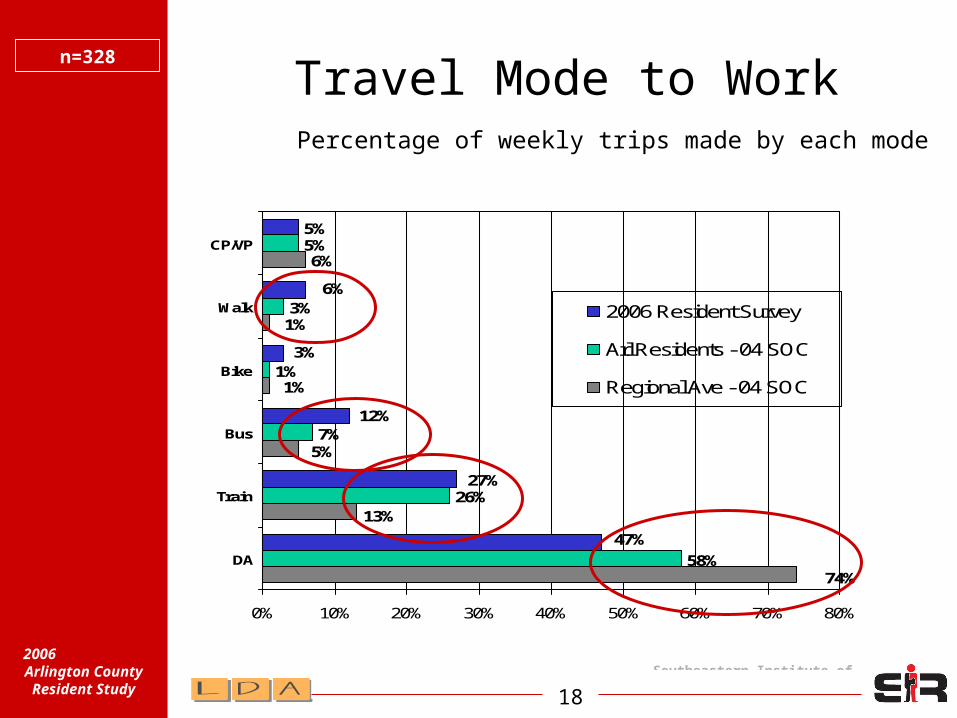
Travel Mode to Work
6%
58%
26%
7%
1%
3%
5%5%
74%
13%
5%
1%
1%
3%
12%
6%
27%
47%
0% 10% 20% 30% 40% 50% 60% 70% 80%
DA
Train
Bus
Bike
Walk
CP/VP
2006 Resident Survey
Arl Residents - 04 SOC
Regional Ave - 04 SOC
Percentage of weekly trips made by each mode
n=328

Southeastern Institute of
Research19
2006 Arlington
County Resident Study
Frequency of Mode Use
Modes Used for Travel to Work
Avg. Days per Week
Drive alone (n=136) 4.5
Metrorail/Commuter Rail (n=84)
4.2
Bus (n=44) 3.7
Carpool/vanpool (n=15) 3.7
Bike (n=10) 3.6
Walk (n=22) 4.0
81% of residents used one mode 4+ days per week for commuting. Thus, there is only modest potential for increasing HOV use among current HOV users.
n=328
Southeastern Institute of
Research20
2006 Arlington
County Resident Study
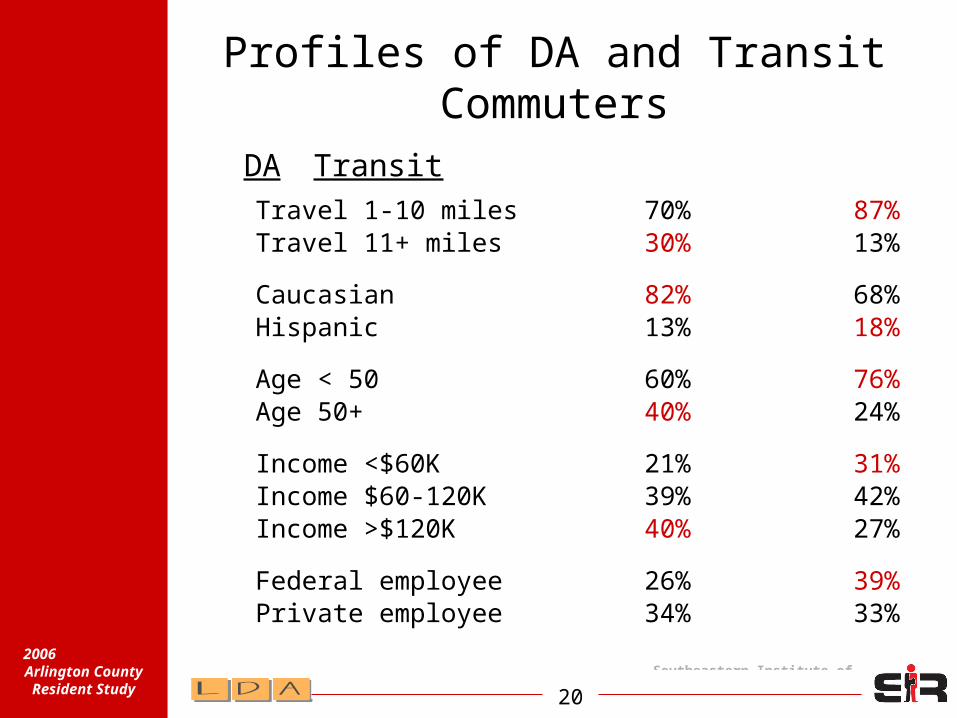
Profiles of DA and Transit Commuters
DA TransitTravel 1-10 miles 70% 87%Travel 11+ miles 30% 13%
Caucasian 82% 68%Hispanic 13% 18%
Age < 50 60% 76%Age 50+ 40% 24%
Income <$60K 21% 31%Income $60-120K 39% 42%Income >$120K 40% 27%
Federal employee 26% 39%Private employee 34% 33%

Southeastern Institute of
Research21
2006 Arlington
County Resident Study
Commute Distance (mi)
16.5
10.3
9.9
0.0 5.0 10.0 15.0 20.0
Arl Residents - 06 Survey
Arl Residents - 04 SOC
Regional Ave - 04 SOC
Arlington residents travel shorter distances to work (10.3 miles) than do other commuters in the region (16.5 miles):
- 41% travel 5 miles or less
- 80% travel 10 miles or less
Q H-13: How many miles do you travel from your home to your work?
n=278

Southeastern Institute of
Research22
2006 Arlington
County Resident Study
Commute Time (min)
34
28
27
0.0 10.0 20.0 30.0 40.0
Arl Residents - 06 Survey
Arl Residents - 04 SOC
Regional Ave - 04 SOC
But Arlington residents do not have proportionately shorter commute times (28 min) than the regional average (34 min):
- 48% travel 20 min or less, but- 26% travel 21–45 min and 26% travel 45+ min
This is primarily due to the large number of transit riders and walkers/bikers, who travel short distances, but take more time.
Q H-14: How many minutes does this trip usually take you?
n=320

Southeastern Institute of
Research23
2006 Arlington
County Resident Study
Try/Use HOV in Past Year
70%
12%
10%
4%3%
3%
No new HOV Metrorail Bus Bike Walk Other
Q H-24: In the past year, have you used or tried any other type of transportation that you’re not using now for your trip to work?
Within the past year, 30% of residents have tried or used an HOV mode that they are not using now.
n=328
30%

Southeastern Institute of
Research24
2006 Arlington
County Resident Study
DA Commuters Trial/Past Use of HOV
21%
35%
39%
0.0% 10.0% 20.0% 30.0% 40.0% 50.0%
Non-ridesharers
Secondary ridesharers
Primary ridesharers
DA commuters were more likely than current HOV commuters to have tried/used a different HOV mode in the past year. But is this because HOV users were satisfied with their travel mode and had less reason to change?
Primary RS n=144
Secondary RS n=99
Non-rideshare
n=86

Southeastern Institute of
Research25
2006 Arlington
County Resident Study
DA Commuters Likely to Try HOV
• Most DA commuters are long time users – 62% started DA 2+ years ago and 18% “always used” DA. The remaining 20% started DA in past two years.
• 28% of DA users said they were very likely (15%) or somewhat likely (13%) to try HOV mode within one year.
• DA residents would be most willing to try transit if:– Bus schedule matched work schedule (13%)– Bus stop closer to home or work (6%)– More frequent schedule (6%)– Buses were faster (4%)– Gas prices were higher (3%)– Other (30%)
Southeastern Institute of
Research26
2006 Arlington
County Resident Study
Non-Work
Travel
Southeastern Institute of
Research27
2006 Arlington
County Resident Study
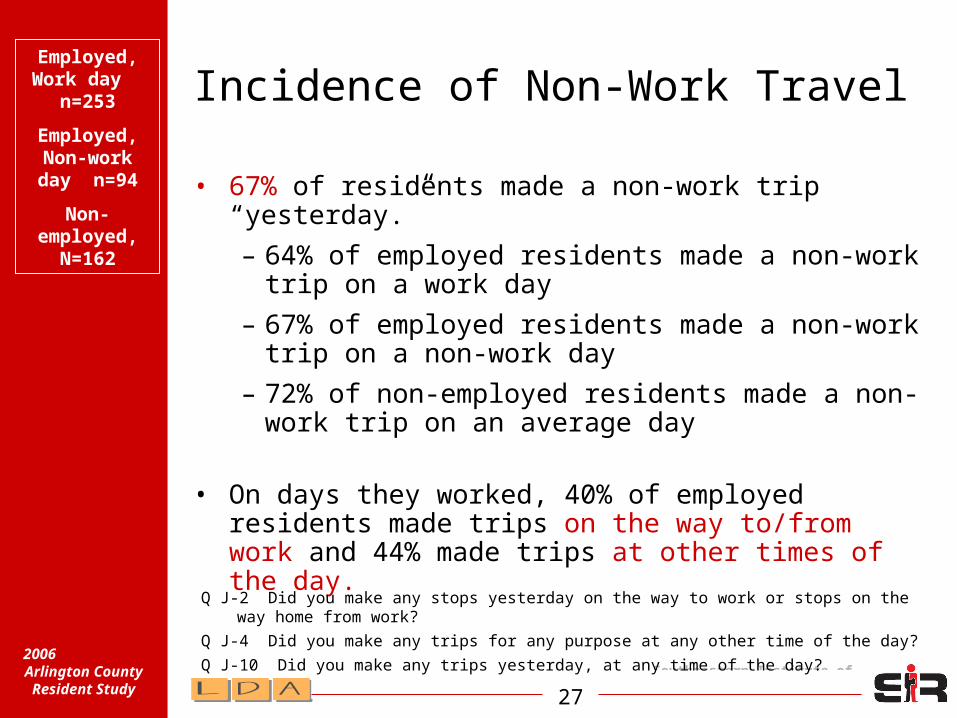
Incidence of Non-Work Travel
• 67% of residents made a non-work trip “yesterday.”
– 64% of employed residents made a non-work trip on a work day
– 67% of employed residents made a non-work trip on a non-work day
– 72% of non-employed residents made a non-work trip on an average day
• On days they worked, 40% of employed residents made trips on the way to/from work and 44% made trips at other times of the day.
Q J-2 Did you make any stops yesterday on the way to work or stops on the way home from work?
Q J-4 Did you make any trips for any purpose at any other time of the day?
Q J-10 Did you make any trips yesterday, at any time of the day?
Employed, Work day
n=253
Employed, Non-work day n=94
Non- employed,
N=162

Southeastern Institute of
Research28
2006 Arlington
County Resident Study
Number of Non-Work Trips
• Residents who made non-work trips yesterday made an average of 2.3 trips/stops:
– On work days, employed residents made 1.5 trips or stops on the way to/from work, plus 1.6 non-work trips at other times of the day
– On non-work days, employed residents made 2.4 non-work trips
– Non-employed residents made 2.6 non-work trips on an average day
Q J-3 About how many stops did you make on the way to work or on the way home from work?
Q J-5 About how many trips did you make?
Q J-11 About how many trips did you make?
Employed, Work day
n=163
Employed, Non-work day n=63
Non- employed,
N=116

Southeastern Institute of
Research29
2006 Arlington
County Resident Study
Weekly Trips for Work and Non-Work
0.0
9.8
13.1
7.5
0.0 5.0 10.0 15.0 20.0
EmployedResidents
Non-employedresidents
Work trips Non-work trips
13.1 weekly trips
17.3 weekly trips
Non-employed residents made more non-work trips (13.1) weekly than did employed residents (7.5), but employed residents made more trips overall. Employed residents also made 2.7 stops per week on the way to or from work.
Employed residents
n=226
Non- employed,
N=116

Southeastern Institute of
Research30
2006 Arlington
County Resident Study
Non-Work Travel Purpose
39%
23% 14%
11%
7%
6%
Shop / errands Social Appointment
Drop-off / Pick-up Work meeting Other
Two in ten non-work trips were for made for shopping or errands and a quarter were made for social purposes.
Social
Shop
Q J-6, J-12 For what purposes did you make these trips?
n=342, multiple response permitted
Trip n=459

Southeastern Institute of
Research31
2006 Arlington
County Resident Study
Non-Work Travel Mode
45%
33%
14%
6%
5%2%
4%
Drive alone Walk CP/VP Train Bus Bike Other
Nearly half of non-work trips are made by DA and one-third are made by walking. One in eight are made by riding or driving with another person.
Drive alone
WalkCP/VP
n=342, multiple response permitted
Trip n=459
Q J-7, J-8, J-13 What type or types of transportation did you use for <these trips>?
Southeastern Institute of
Research32
2006 Arlington
County Resident Study
Awareness and
Use ofTravel Info and
Services
Southeastern Institute of
Research33
2006 Arlington
County Resident Study
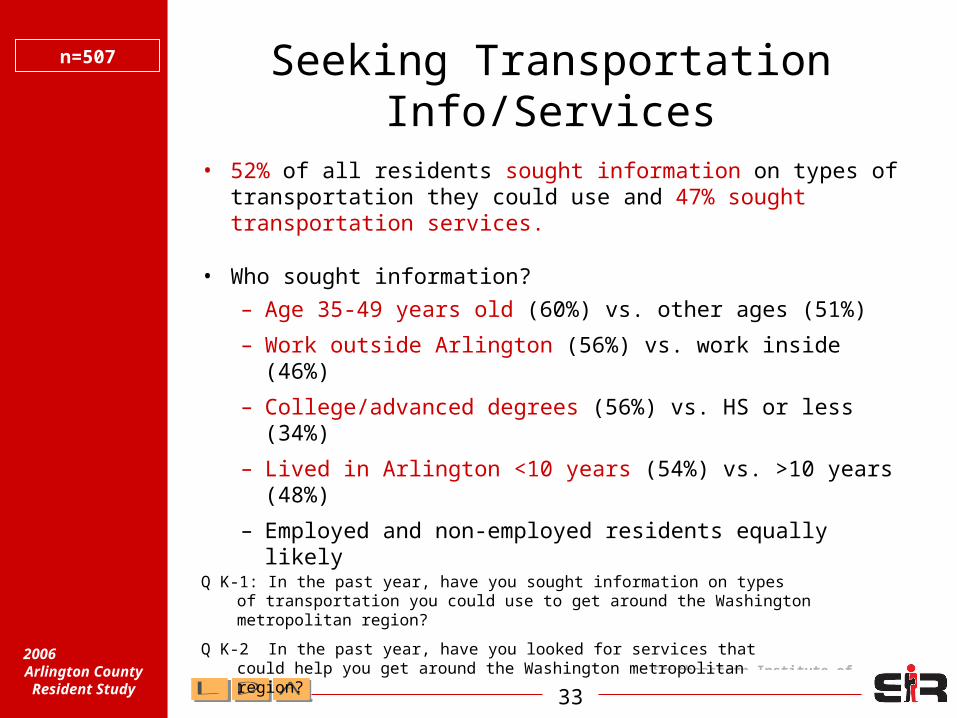
Seeking Transportation Info/Services
• 52% of all residents sought information on types of transportation they could use and 47% sought transportation services.
• Who sought information?
– Age 35-49 years old (60%) vs. other ages (51%)
– Work outside Arlington (56%) vs. work inside (46%)
– College/advanced degrees (56%) vs. HS or less (34%)
– Lived in Arlington <10 years (54%) vs. >10 years (48%)
– Employed and non-employed residents equally likely
n=507
Q K-1: In the past year, have you sought information on types of transportation you could use to get around the Washington metropolitan region?
Q K-2 In the past year, have you looked for services that could help you get around the Washington metropolitan region?

Southeastern Institute of
Research34
2006 Arlington
County Resident Study
Info/Service Sources Contacted n=283
Q K-3: What sources did you use or contact to obtain this information or service?
* = Commuter Store, ACCS, ATP, CommuterPage.com, ART, Arlington government
2%
2%
2%
2%
2%
3%
3%
6%
6%
7%
44%
0% 5% 10% 15% 20% 25% 30% 35% 40% 45% 50%
Yellow pages
Referral
Newspaper/magazine
Highway sign
Employer
Newspaper/magazine
Other orgs
Bus stop info
Arlington Orgs *
WMATA
Website
Southeastern Institute of
Research35
2006 Arlington
County Resident Study
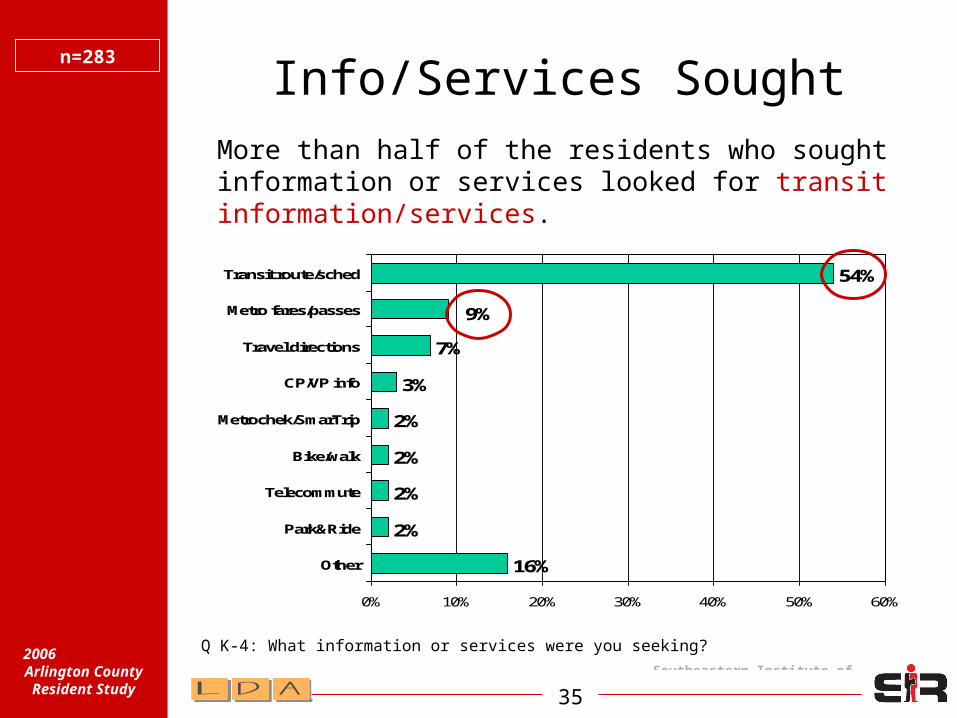
Info/Services Soughtn=283
Q K-4: What information or services were you seeking?
16%
2%
2%
2%
2%
3%
7%
54%
9%
0% 10% 20% 30% 40% 50% 60%
Other
Park&Ride
Telecommute
Bike/walk
Metrochek/SmarTrip
CP/VP info
Travel directions
Metro fares/passes
Transit route/sched
More than half of the residents who sought information or services looked for transit information/services.
Southeastern Institute of
Research36
2006 Arlington
County Resident Study
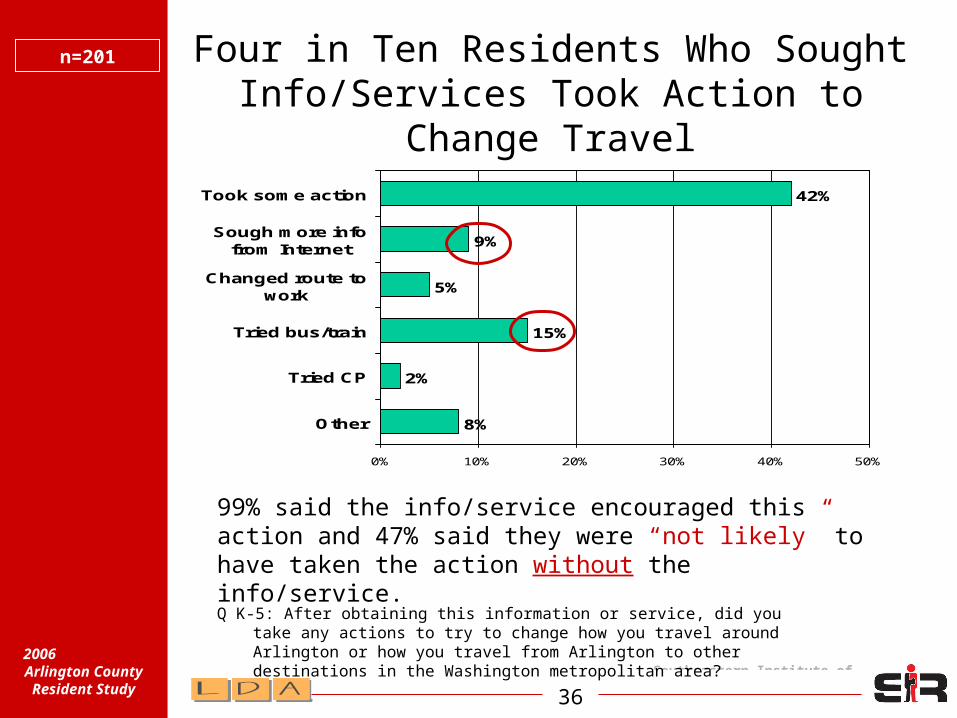
Four in Ten Residents Who Sought Info/Services Took Action to Change
Travel
n=201
Q K-5: After obtaining this information or service, did you take any actions to try to change how you travel around Arlington or how you travel from Arlington to other destinations in the Washington metropolitan area?
8%
2%
15%
5%
9%
42%
0% 10% 20% 30% 40% 50%
Other
Tried CP
Tried bus/train
Changed route towork
Sough more infofrom Internet
Took some action
99% said the info/service encouraged this action and 47% said they were “not likely” to have taken the action without the info/service.
Southeastern Institute of
Research37
2006 Arlington
County Resident Study
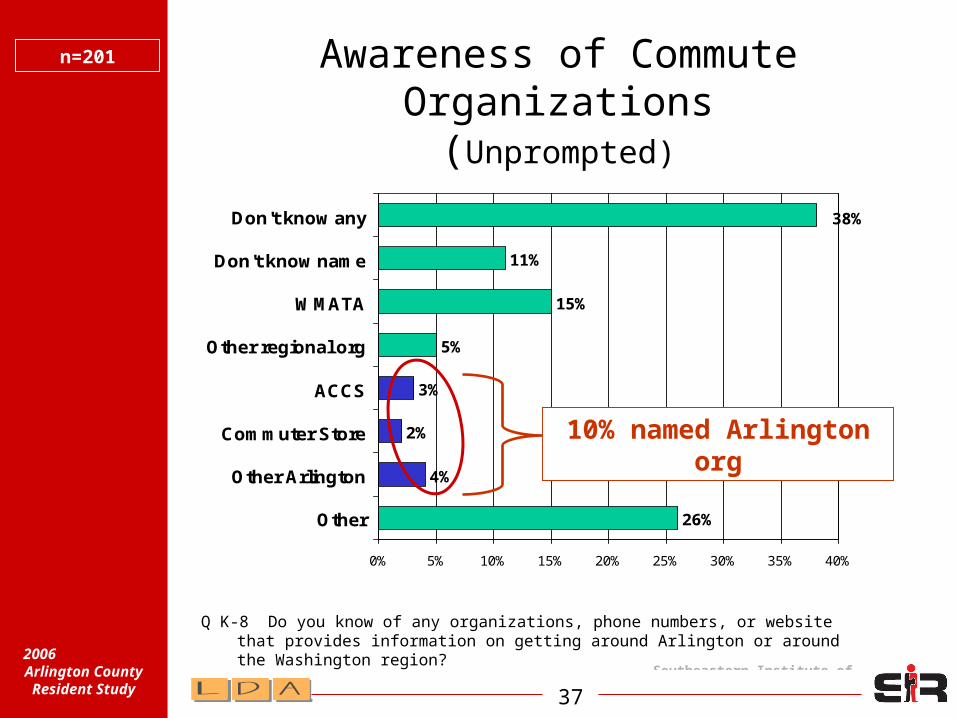
Awareness of Commute Organizations(Unprompted)
n=201
Q K-8 Do you know of any organizations, phone numbers, or website that provides information on getting around Arlington or around the Washington region?
26%
4%
2%
3%
5%
15%
11%
38%
0% 5% 10% 15% 20% 25% 30% 35% 40%
Other
Other Arlington
Commuter Store
ACCS
Other regional org
WMATA
Don't know name
Don't know any
10% named Arlington org
Southeastern Institute of
Research38
2006 Arlington
County Resident Study
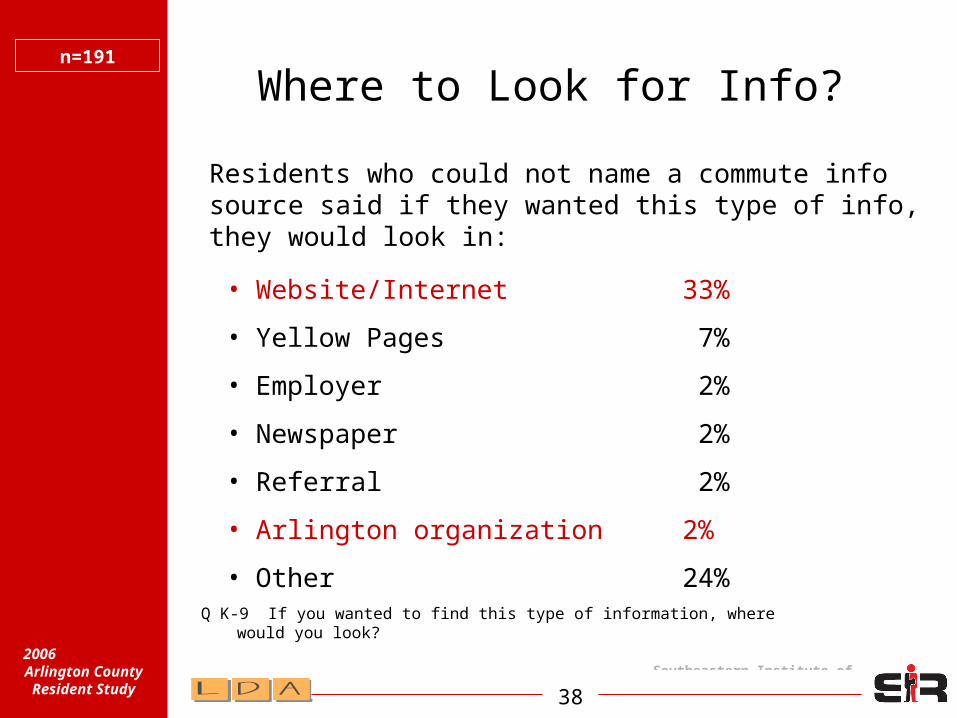
Where to Look for Info?n=191
Q K-9 If you wanted to find this type of information, where would you look?
Residents who could not name a commute info source said if they wanted this type of info, they would look in:
• Website/Internet 33%
• Yellow Pages 7%
• Employer 2%
• Newspaper 2%
• Referral 2%
• Arlington organization 2%
• Other 24%

Southeastern Institute of
Research39
2006 Arlington
County Resident Study
n=447
4%
13%
14%
16%
22%
32%
34%
44%
46%
80%
38%
0% 10% 20% 30% 40% 50% 60% 70% 80% 90%
CommuterDirect.com
CommuterPage.com
Way to Go
ATP
Walk Arlington
Bike Arlington
Commuter Connections
ACCS
Commuter Store
ART
WMATA
Awareness of Commute Orgs (prompted)
67% knew one or more Arlington commute organizations
Southeastern Institute of
Research40
2006 Arlington
County Resident Study
Who Knew Arlington Orgs?Commuter
Store n=198
ACCS n=169
Bike Arlington
n=144
Walk Arlington
n=99
ATP n=71
Commuter Page.com
n=59
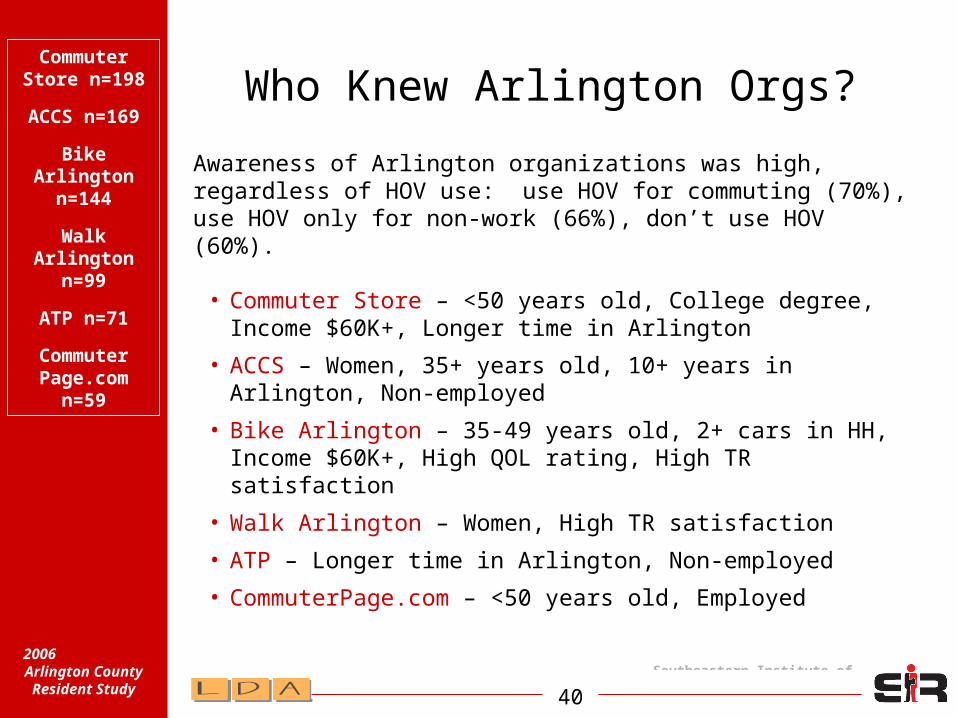
Awareness of Arlington organizations was high, regardless of HOV use: use HOV for commuting (70%), use HOV only for non-work (66%), don’t use HOV (60%).
• Commuter Store – <50 years old, College degree, Income $60K+, Longer time in Arlington
• ACCS – Women, 35+ years old, 10+ years in Arlington, Non-employed
• Bike Arlington – 35-49 years old, 2+ cars in HH, Income $60K+, High QOL rating, High TR satisfaction
• Walk Arlington – Women, High TR satisfaction
• ATP – Longer time in Arlington, Non-employed
• CommuterPage.com – <50 years old, Employed
Southeastern Institute of
Research41
2006 Arlington
County Resident Study
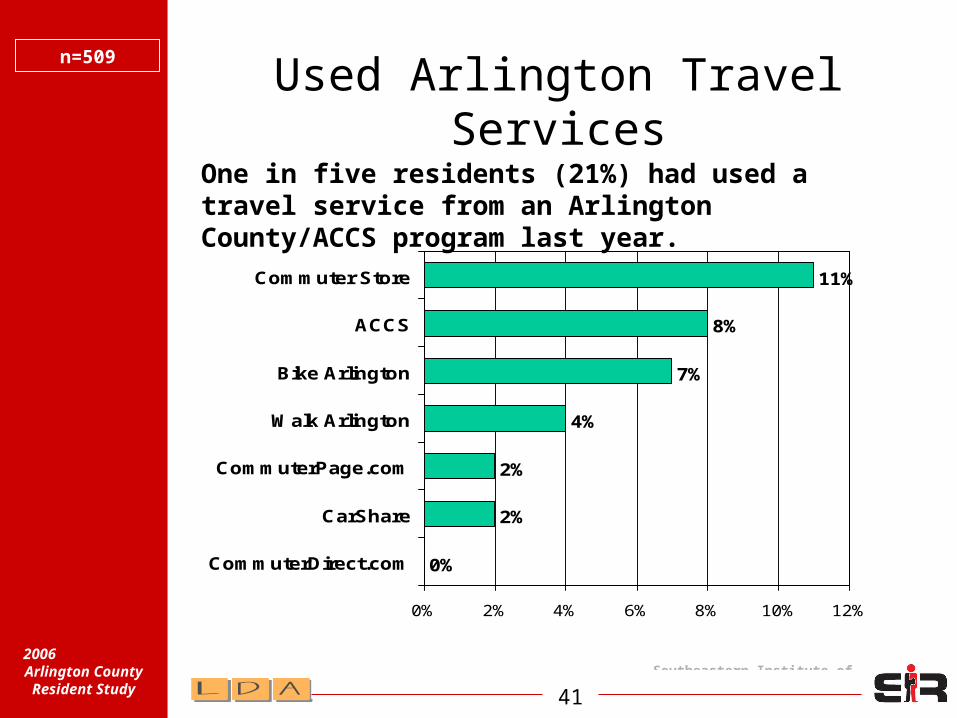
Used Arlington Travel Servicesn=509
0%
2%
2%
4%
7%
8%
11%
0% 2% 4% 6% 8% 10% 12%
CommuterDirect.com
CarShare
CommuterPage.com
Walk Arlington
Bike Arlington
ACCS
Commuter Store
One in five residents (21%) had used a travel service from an Arlington County/ACCS program last year.
Southeastern Institute of
Research42
2006 Arlington
County Resident Study
Who Used Arlington Services?Commuter
Store n=198
ACCS n=169
Bike Arlington
n=144
Walk Arlington
n=99
ATP n=71
Commuter Page.com
n=59
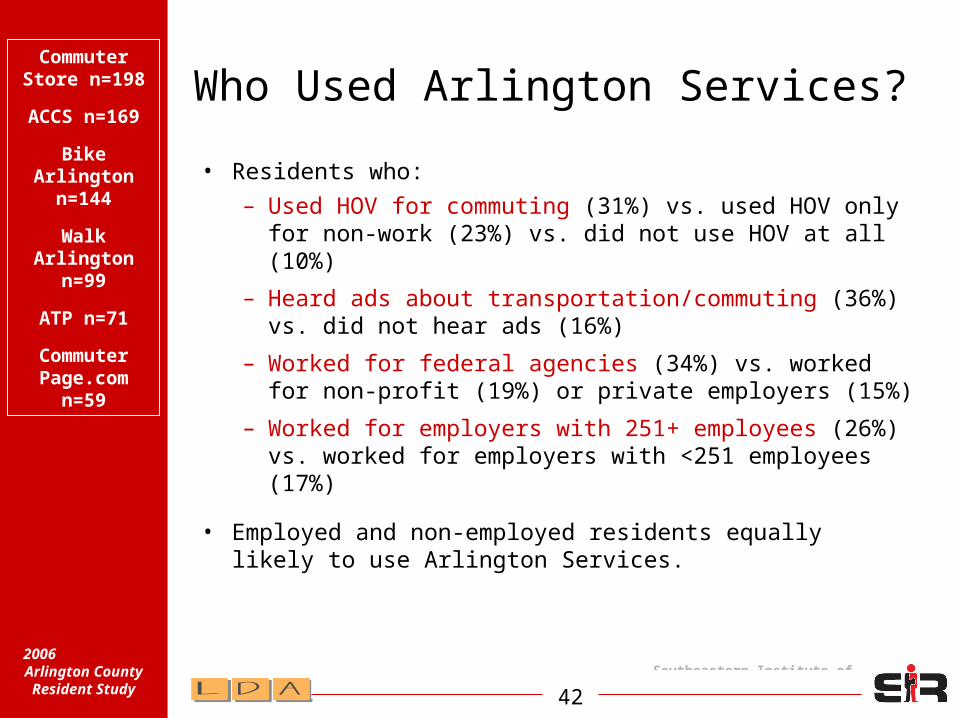
• Residents who:– Used HOV for commuting (31%) vs. used HOV only
for non-work (23%) vs. did not use HOV at all (10%)
– Heard ads about transportation/commuting (36%) vs. did not hear ads (16%)
– Worked for federal agencies (34%) vs. worked for non-profit (19%) or private employers (15%)
– Worked for employers with 251+ employees (26%) vs. worked for employers with <251 employees (17%)
• Employed and non-employed residents equally likely to use Arlington Services.
Southeastern Institute of
Research43
2006 Arlington
County Resident Study
Worksite and
Residential TDMServices

Southeastern Institute of
Research44
2006 Arlington
County Resident Study
Access to Employer TDM
64%
36%
53%
47%
69%
31%
0% 10% 20% 30% 40% 50% 60% 70% 80%
Yes
No/DK
Regional Ave - 04 SOC Arl Residents - 04 SOC 2006 Resident Survey
About a third of the employed residents said their employer offers commute assistance services/benefits. This was much lower than that noted in 2004 SOC, but the SOC asked the question differently.
n=344
Southeastern Institute of
Research45
2006 Arlington
County Resident Study
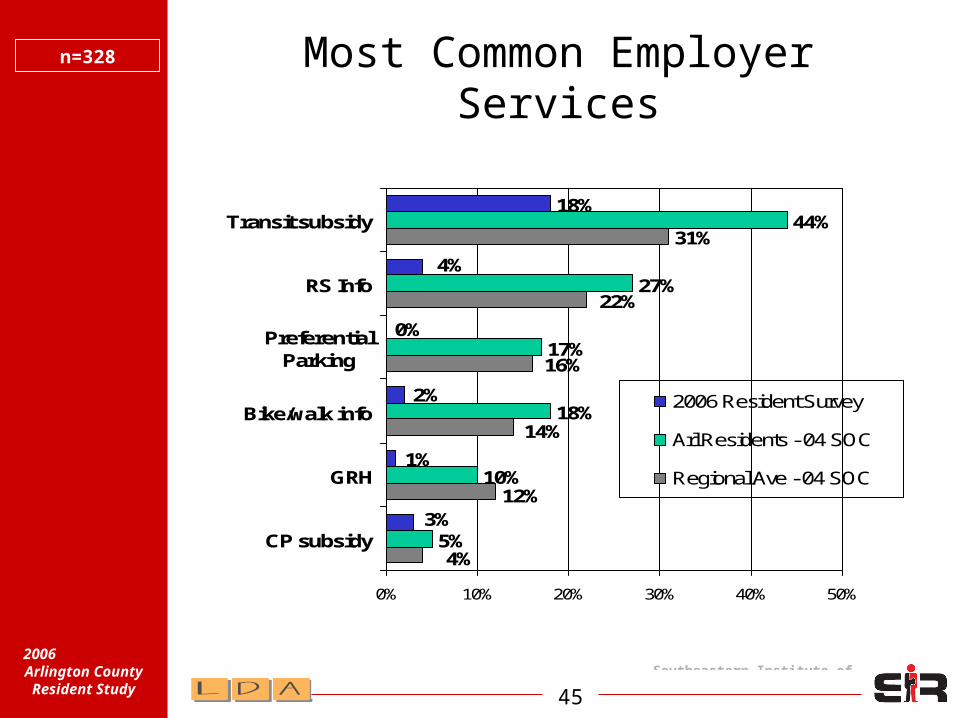
Most Common Employer Services
n=328
31%
5%
10%
18%
17%
27%
44%18%
4%
12%
14%
16%
22%
0%
2%
4%
1%
3%
0% 10% 20% 30% 40% 50%
CP subsidy
GRH
Bike/walk info
PreferentialParking
RS Info
Transit subsidy
2006 Resident Survey
Arl Residents - 04 SOC
Regional Ave - 04 SOC
Southeastern Institute of
Research46
2006 Arlington
County Resident Study
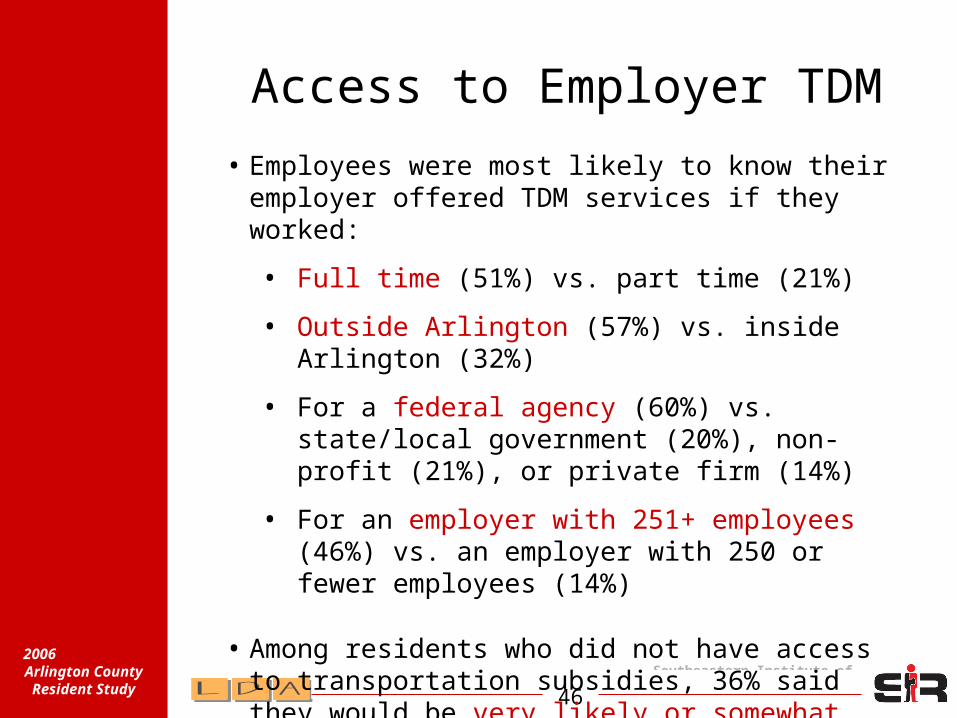
Access to Employer TDM
• Employees were most likely to know their employer offered TDM services if they worked:
• Full time (51%) vs. part time (21%)
• Outside Arlington (57%) vs. inside Arlington (32%)
• For a federal agency (60%) vs. state/local government (20%), non-profit (21%), or private firm (14%)
• For an employer with 251+ employees (46%) vs. an employer with 250 or fewer employees (14%)
• Among residents who did not have access to transportation subsidies, 36% said they would be very likely or somewhat likely to try HOV for work if their employers offered this benefit.
Southeastern Institute of
Research47
2006 Arlington
County Resident Study
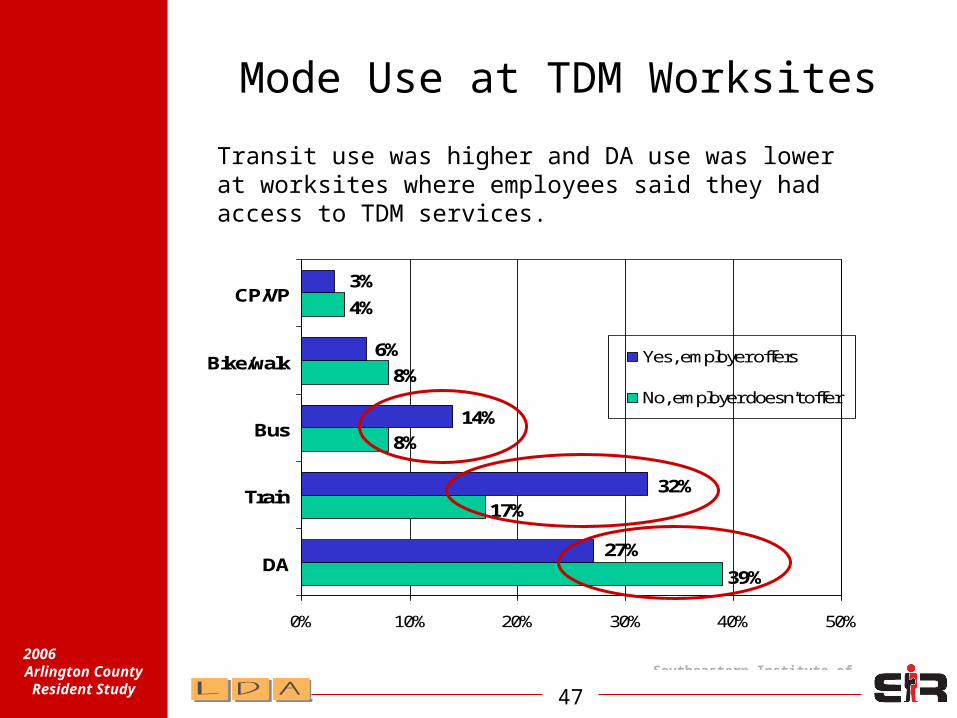
Mode Use at TDM Worksites
39%
17%
8%
8%
4%
6%
14%
3%
32%
27%
0% 10% 20% 30% 40% 50%
DA
Train
Bus
Bike/walk
CP/VP
Yes, employer offers
No, employer doesn't offer
Transit use was higher and DA use was lower at worksites where employees said they had access to TDM services.

Southeastern Institute of
Research48
2006 Arlington
County Resident Study
Residential TDM ServicesResident
base n=285
Service base n=67
3%
3%
10%
14%
36%
0% 5% 10% 15% 20% 25% 30% 35% 40%
Bike racks
SmarTrip cards
Metrotickets/tokens
Transportationinfo/seminar
Transit Info
• One in four (24%) residents who lived in a condominium, townhouse, or apartment said they had access to transportation information at home: On-site concierge (19%), Self-service take-one display (13%).
Southeastern Institute of
Research49
2006 Arlington
County Resident Study
Used Residential TDM Services
Service use n=42
4%
12%
27%
12%
25%
0% 5% 10% 15% 20% 25% 30%
Bike racks
SmarTrip cards
Metrotickets/tokens
Transportationinfo/seminar
Transit Info
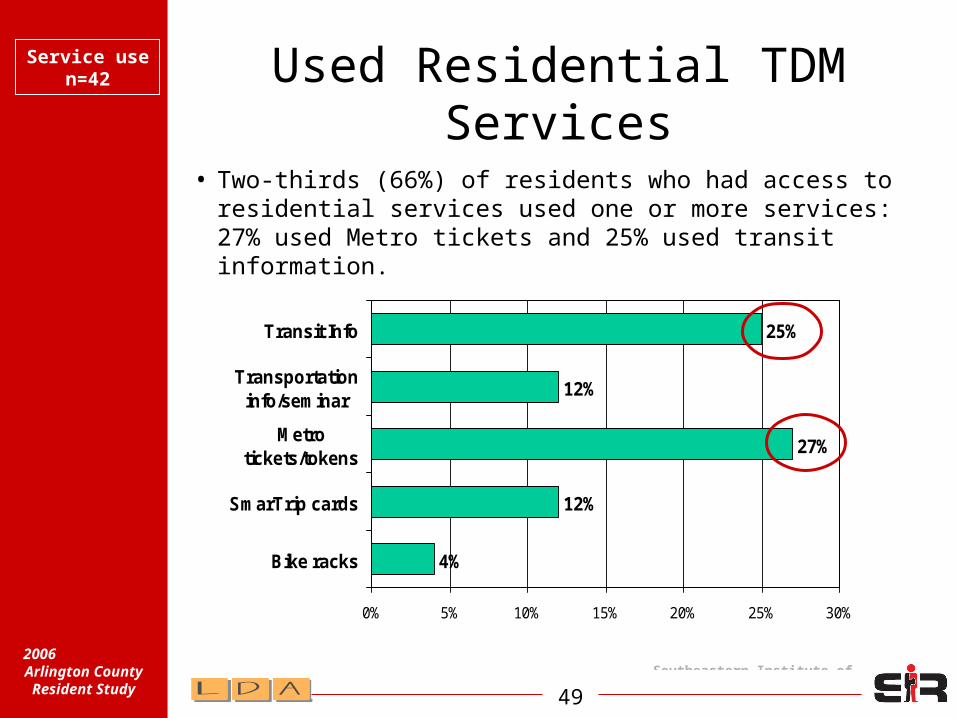
• Two-thirds (66%) of residents who had access to residential services used one or more services: 27% used Metro tickets and 25% used transit information.
Southeastern Institute of
Research50
2006 Arlington
County Resident Study
Actions Taken After Using Residential TDM Services
Travel change n=28
5%
21%
41%
27%
4%
18%
27%
20%
32%
29%
0% 10% 20% 30% 40% 50%
Bike
Walk
Metrorail
Metrobus
ART bus
Use more Start using
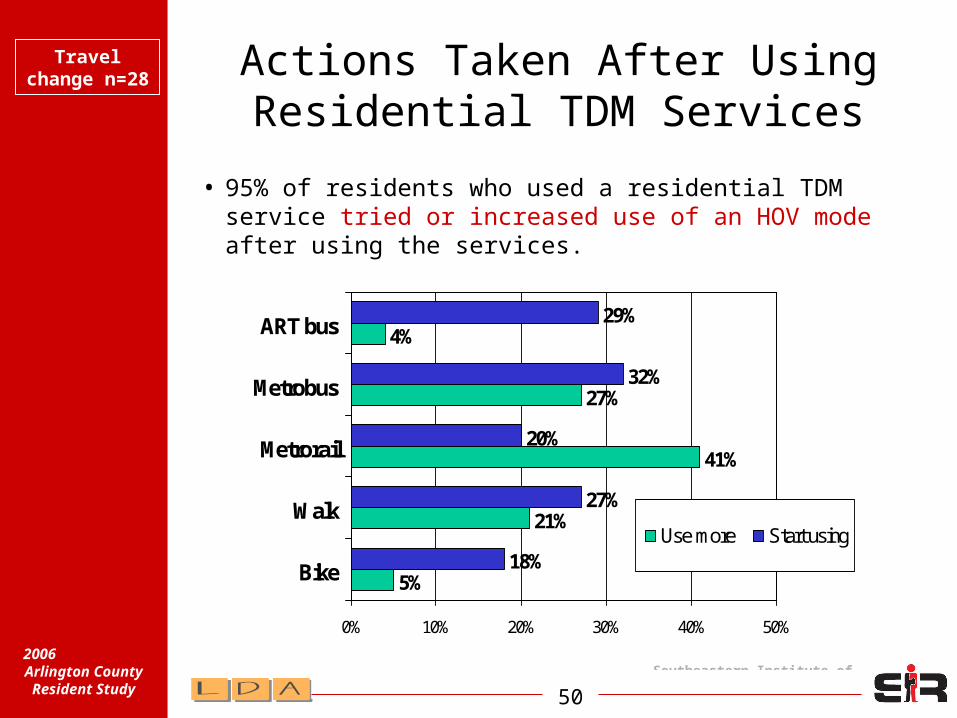
• 95% of residents who used a residential TDM service tried or increased use of an HOV mode after using the services.
Southeastern Institute of
Research51
2006 Arlington
County Resident Study
Transportation &
Quality of Life
Perceptions of Transportation
System
Opportunities for
Improvement
Ability to Get
Around
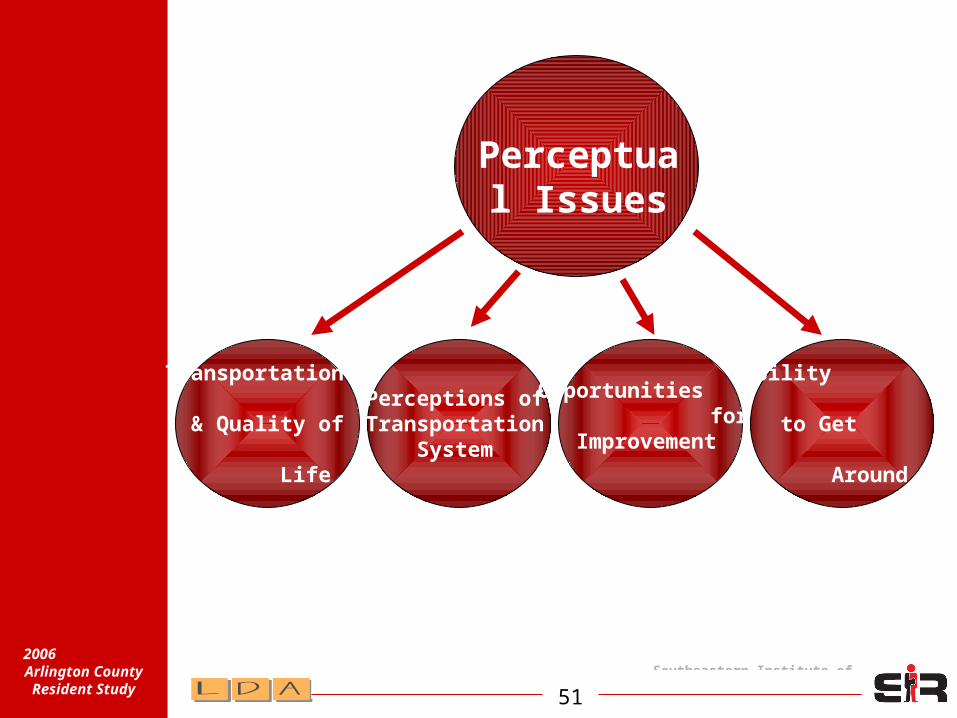
Perceptual Issues
Southeastern Institute of
Research52
2006 Arlington
County Resident Study
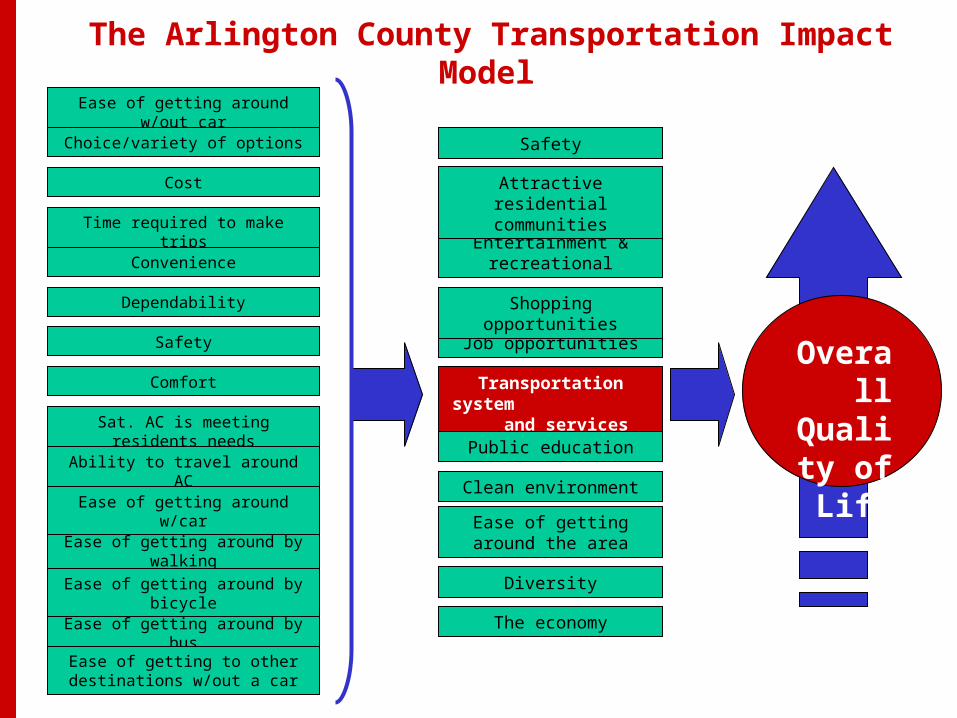
The Arlington County Transportation Impact Model
The economy
Transportation system
and services
Entertainment & recreational
Job opportunities
Clean environment
Public education
Attractive residential communities
Safety
Shopping opportunities
Ease of getting around the area
Diversity
Overall
Quality of Life
Safety
Ease of getting around by bus
Ease of getting around w/out car
Ease of getting around by walking
Ease of getting around by bicycle
Sat. AC is meeting residents needs
Ability to travel around AC
Ease of getting around w/car
Choice/variety of options
Cost
Time required to make trips
Convenience
Dependability
Comfort
Ease of getting to other destinations w/out a car
Southeastern Institute of
Research53
2006 Arlington
County Resident Study
Transportation &
Quality of Life
Southeastern Institute of
Research54
2006 Arlington
County Resident Study
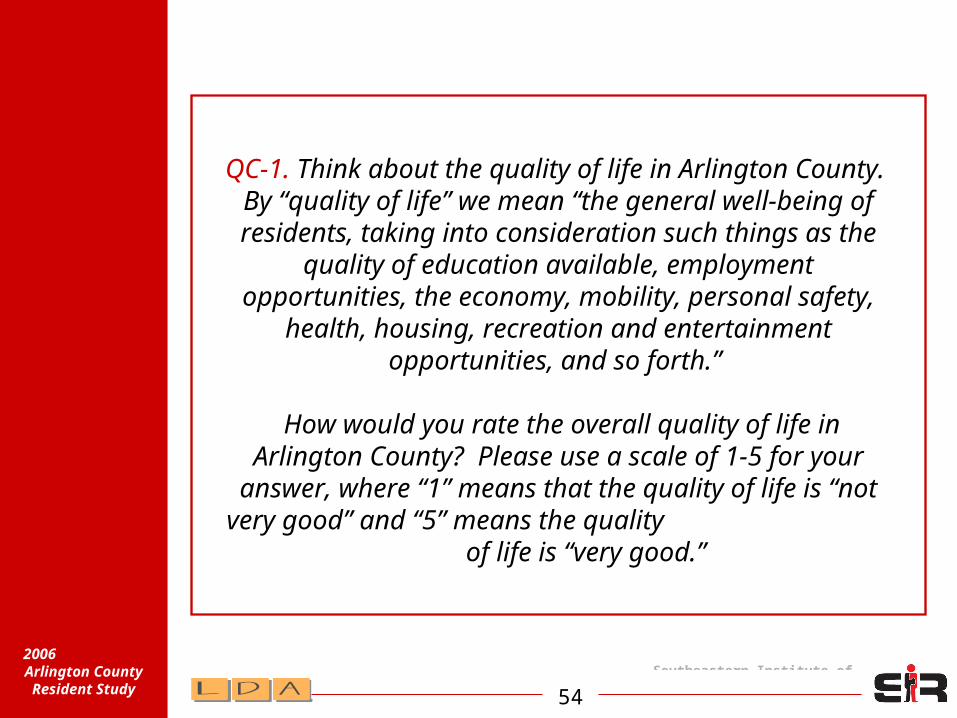
QC-1. Think about the quality of life in Arlington County. By “quality of life” we mean “the general well-being of residents, taking into consideration such things as the quality of
education available, employment opportunities, the economy, mobility, personal safety, health,
housing, recreation and entertainment opportunities, and so forth.”
How would you rate the overall quality of life in Arlington County? Please use a scale of 1-5 for
your answer, where “1” means that the quality of life is “not very good” and “5” means the quality
of life is “very good.”

Southeastern Institute of
Research55
2006 Arlington
County Resident Study
Citizens of Arlington County Rate Their Overall Quality of Life Quite
FavorablyAlmost 9 in 10 Give It a Favorable Rating
53%
35%
9%
1%
1%
0% 20% 40% 60% 80% 100%
5-Very Good
4
3
2
1-Not Very Good
C-1: How would you rate the overall quality of life in Arlington County?
88%

Southeastern Institute of
Research56
2006 Arlington
County Resident Study
Primary Ridesharers View Their Quality of Life Favorably
50%
41%
6%
0%
2%
0% 20% 40% 60% 80% 100%
5-Very Good
4
3
2
1-Not Very Good
C-1: How would you rate the overall quality of life in Arlington County?
91%
Based to Primary Ridesharers
Southeastern Institute of
Research57
2006 Arlington
County Resident Study
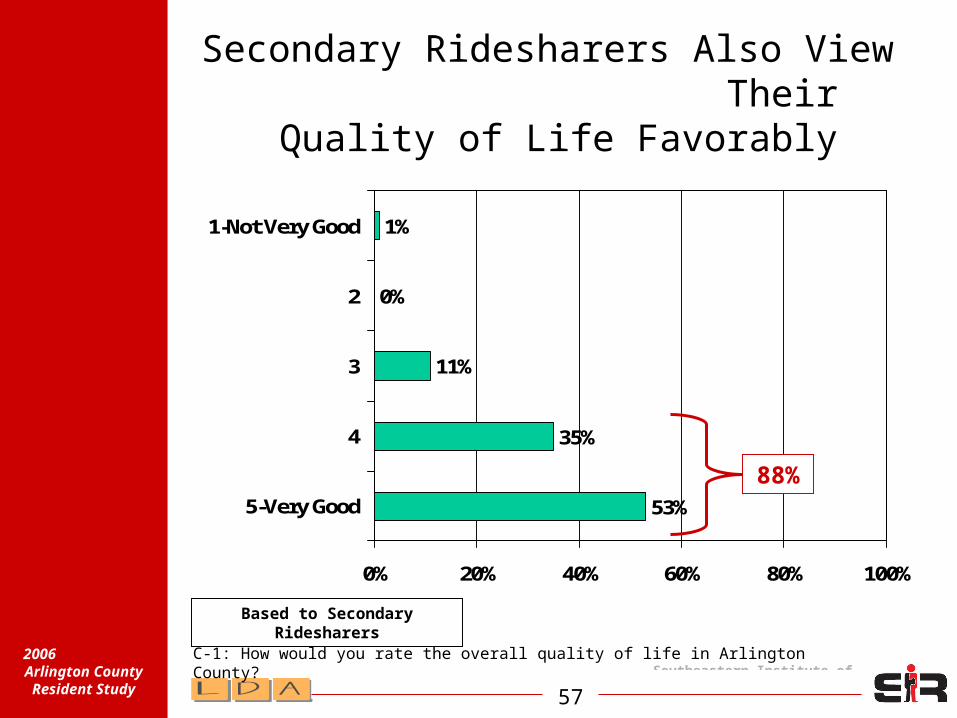
Secondary Ridesharers Also View Their Quality of Life Favorably
53%
35%
11%
0%
1%
0% 20% 40% 60% 80% 100%
5-Very Good
4
3
2
1-Not Very Good
C-1: How would you rate the overall quality of life in Arlington County?
88%
Based to Secondary Ridesharers
Southeastern Institute of
Research58
2006 Arlington
County Resident Study
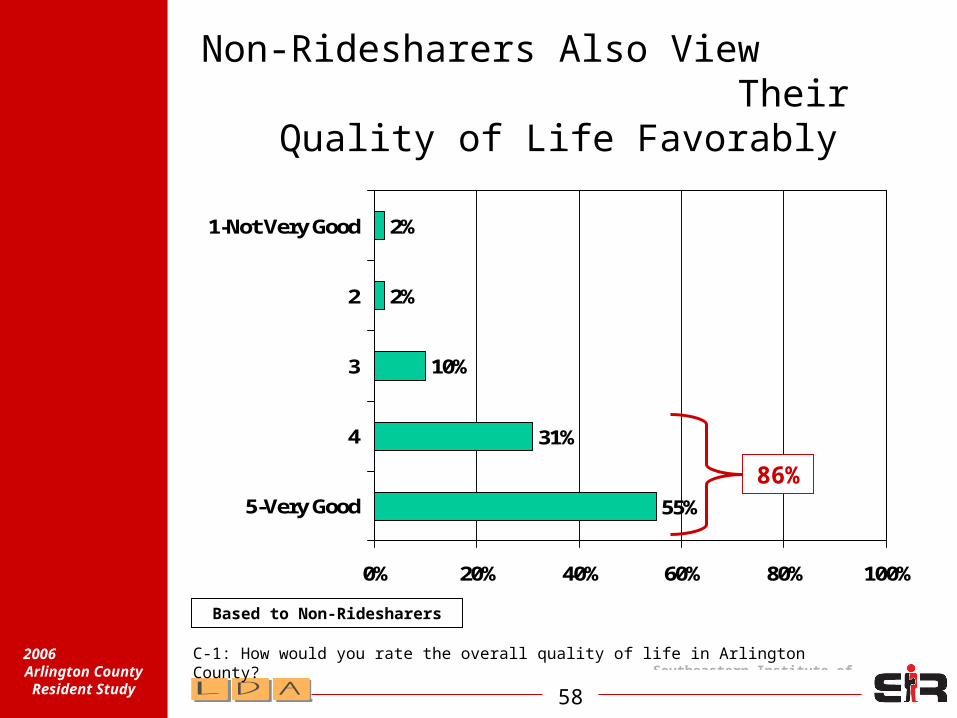
Non-Ridesharers Also View Their Quality of Life Favorably
55%
31%
10%
2%
2%
0% 20% 40% 60% 80% 100%
5-Very Good
4
3
2
1-Not Very Good
C-1: How would you rate the overall quality of life in Arlington County?
86%
Based to Non-Ridesharers

Southeastern Institute of
Research59
2006 Arlington
County Resident Study
Ratings of Quality of Life Vary Across Key Demographic
Groups
• Although ratings of the quality of life do not vary significantly across the three transportation groups, some differences across demographic groups are posted, including:
– Those with higher incomes tend to rate the quality of life more favorably
– Older respondents tend to rate the quality of life more favorably
– Those who have lived in Arlington County longer (more than five years) tend to rate the quality of life more favorably
Southeastern Institute of
Research60
2006 Arlington
County Resident Study
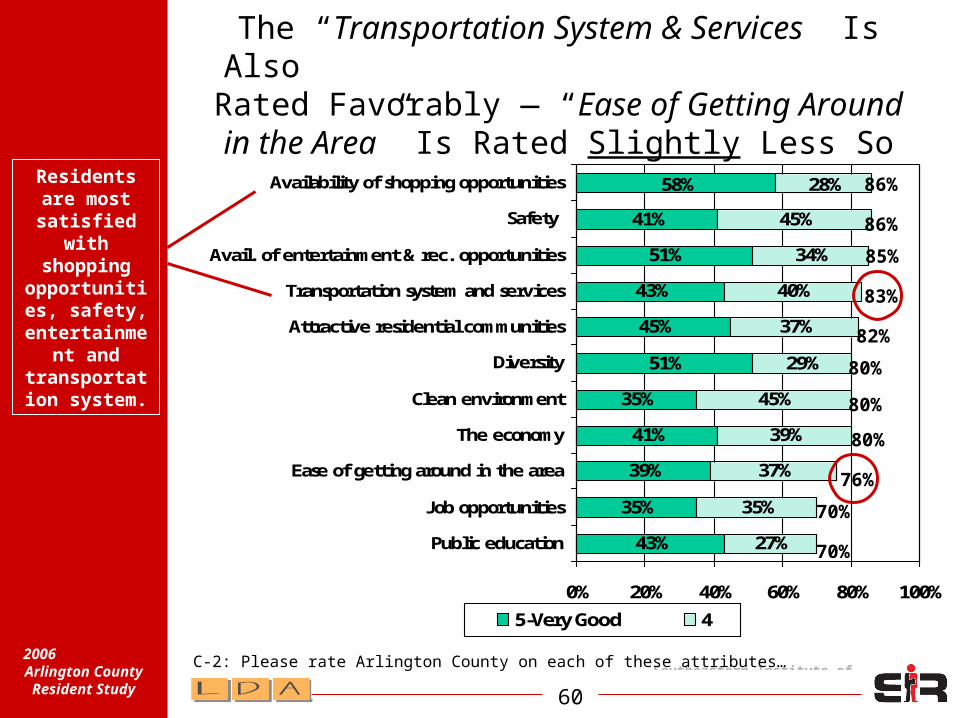
The “Transportation System & Services” Is Also Rated Favorably —
“Ease of Getting Around in the Area” Is Rated Slightly Less So
43%
35%
39%
41%
35%
51%
45%
43%
51%
41%
58%
27%
35%
37%
39%
45%
29%
37%
40%
34%
45%
28%
0% 20% 40% 60% 80% 100%
Public education
Job opportunities
Ease of getting around in the area
The economy
Clean environment
Diversity
Attractive residential communities
Transportation system and services
Avail. of entertainment & rec. opportunities
Safety
Availability of shopping opportunities
5-Very Good 4
C-2: Please rate Arlington County on each of these attributes…
86%
86%
85%
83%
82%
80%
80%
80%
76%
70%
70%
Residents are most satisfied
with shopping
opportunities, safety, entertainm
ent and transportation system.
Southeastern Institute of
Research61
2006 Arlington
County Resident Study
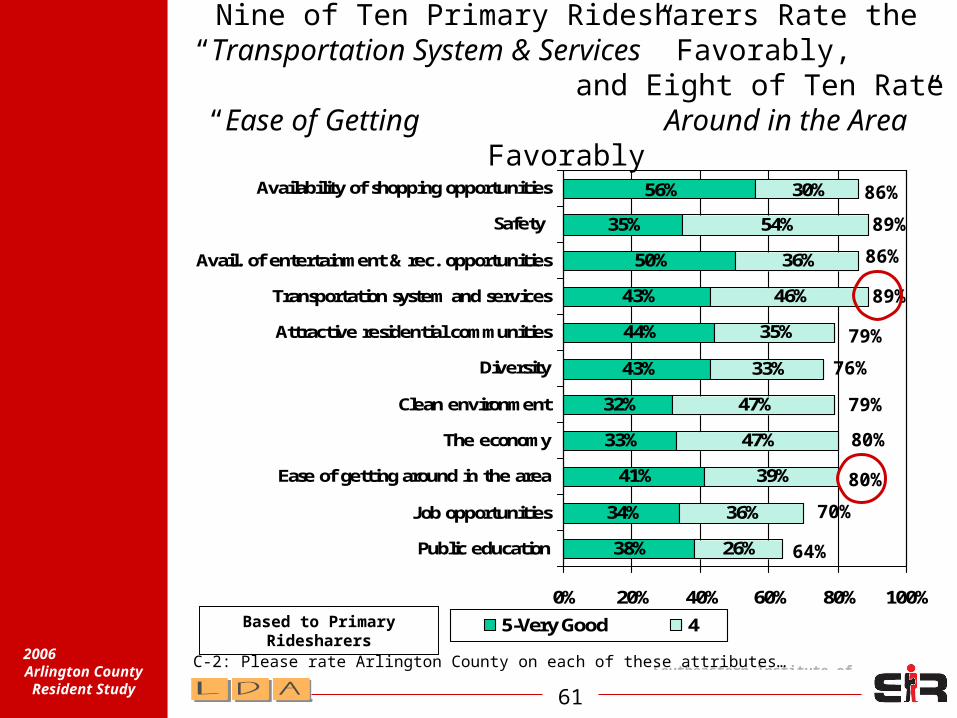
Nine of Ten Primary Ridesharers Rate the “Transportation System & Services” Favorably, and Eight of Ten Rate “Ease of Getting
Around in the Area” Favorably
38%
34%
41%
33%
32%
43%
44%
43%
50%
35%
56%
26%
36%
39%
47%
47%
33%
35%
46%
36%
54%
30%
0% 20% 40% 60% 80% 100%
Public education
Job opportunities
Ease of getting around in the area
The economy
Clean environment
Diversity
Attractive residential communities
Transportation system and services
Avail. of entertainment & rec. opportunities
Safety
Availability of shopping opportunities
5-Very Good 4
C-2: Please rate Arlington County on each of these attributes…
86%
89%
86%89%
79%
76%79%
80%
80%
70%
64%
Based to Primary Ridesharers
Southeastern Institute of
Research62
2006 Arlington
County Resident Study
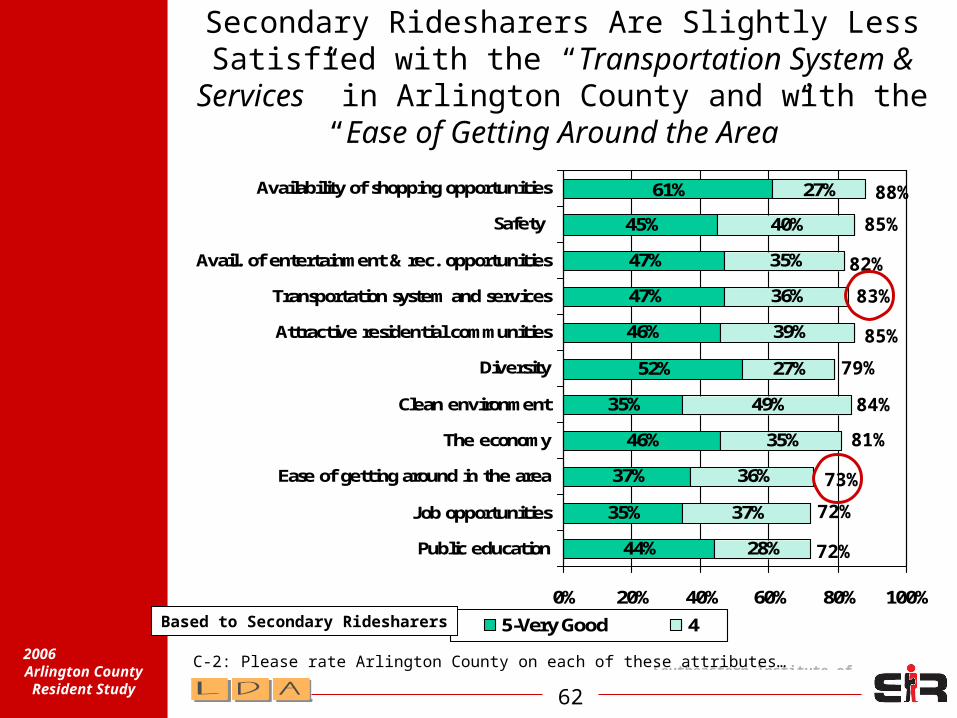
Secondary Ridesharers Are Slightly Less Satisfied with the “Transportation System & Services” in Arlington County and with the “Ease of Getting
Around the Area”
44%
35%
37%
46%
35%
52%
46%
47%
47%
45%
61%
28%
37%
36%
35%
49%
27%
39%
36%
35%
40%
27%
0% 20% 40% 60% 80% 100%
Public education
Job opportunities
Ease of getting around in the area
The economy
Clean environment
Diversity
Attractive residential communities
Transportation system and services
Avail. of entertainment & rec. opportunities
Safety
Availability of shopping opportunities
5-Very Good 4
C-2: Please rate Arlington County on each of these attributes…
88%85%
82%83%
85%
79%84%
81%
73%
72%
72%
Based to Secondary Ridesharers
Southeastern Institute of
Research63
2006 Arlington
County Resident Study
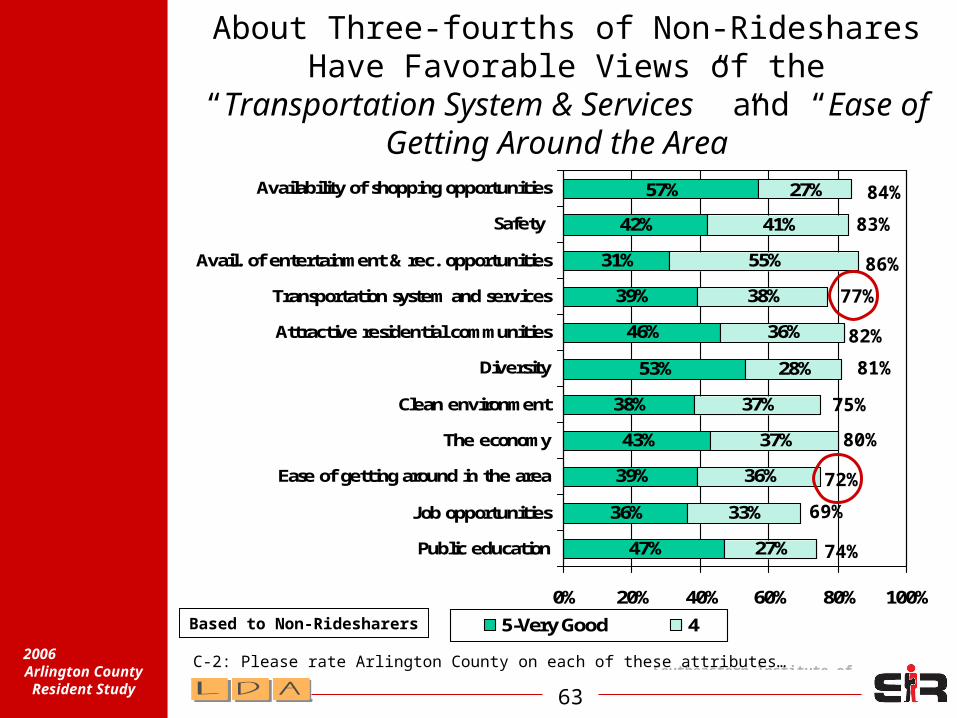
About Three-fourths of Non-Rideshares Have Favorable Views of the “Transportation System & Services” and “Ease of Getting Around the
Area”
47%
36%
39%
43%
38%
53%
46%
39%
31%
42%
57%
27%
33%
36%
37%
37%
28%
36%
38%
55%
41%
27%
0% 20% 40% 60% 80% 100%
Public education
Job opportunities
Ease of getting around in the area
The economy
Clean environment
Diversity
Attractive residential communities
Transportation system and services
Avail. of entertainment & rec. opportunities
Safety
Availability of shopping opportunities
5-Very Good 4
C-2: Please rate Arlington County on each of these attributes…
84%83%
86%77%
82%
81%
75%
80%
72%
69%74%
Based to Non-Ridesharers

Southeastern Institute of
Research64
2006 Arlington
County Resident Study
How is satisfaction with
mobility issues related to
perceptions of overall
quality of life?

Southeastern Institute of
Research65
2006 Arlington
County Resident Study
Predictive Modeling
• Helps us to identify cause and effect relationships:– It models the impact or effect of
causal factors on a specific outcome
• Multiple regression used to identify the relationship and the magnitude of the impact
Southeastern Institute of
Research66
2006 Arlington
County Resident Study
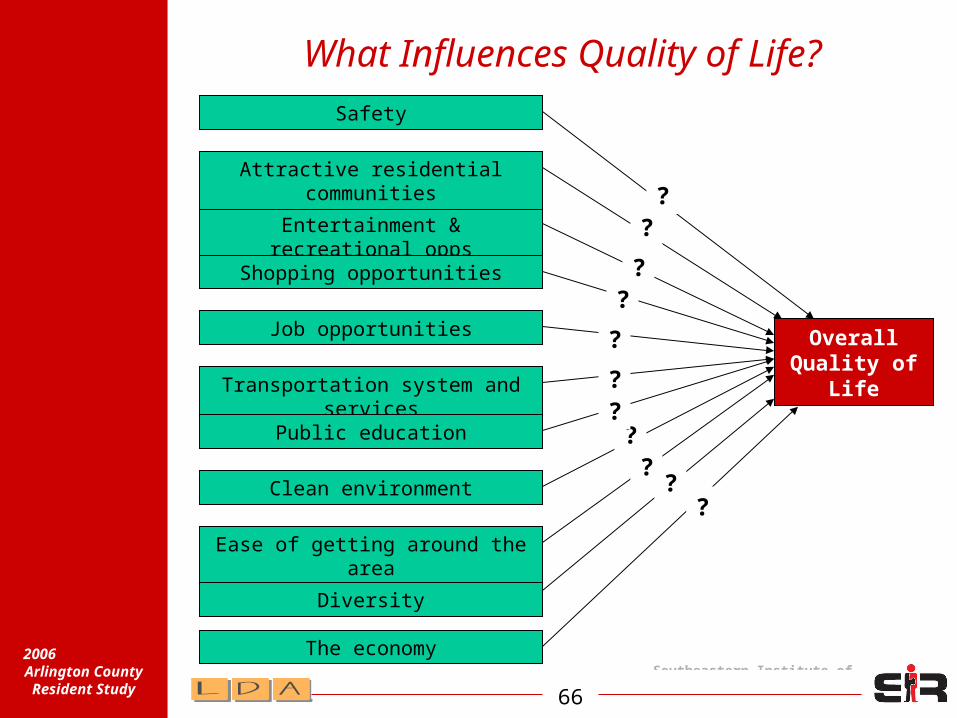
What Influences Quality of Life?
OverallQuality of
Life
The economy
Transportation system and services
Entertainment & recreational opps
Job opportunities
Clean environment
Public education
Attractive residential communities
Safety
Shopping opportunities
Ease of getting around the area
Diversity
?
?
?
??
?
??
??
?
Southeastern Institute of
Research67
2006 Arlington
County Resident Study
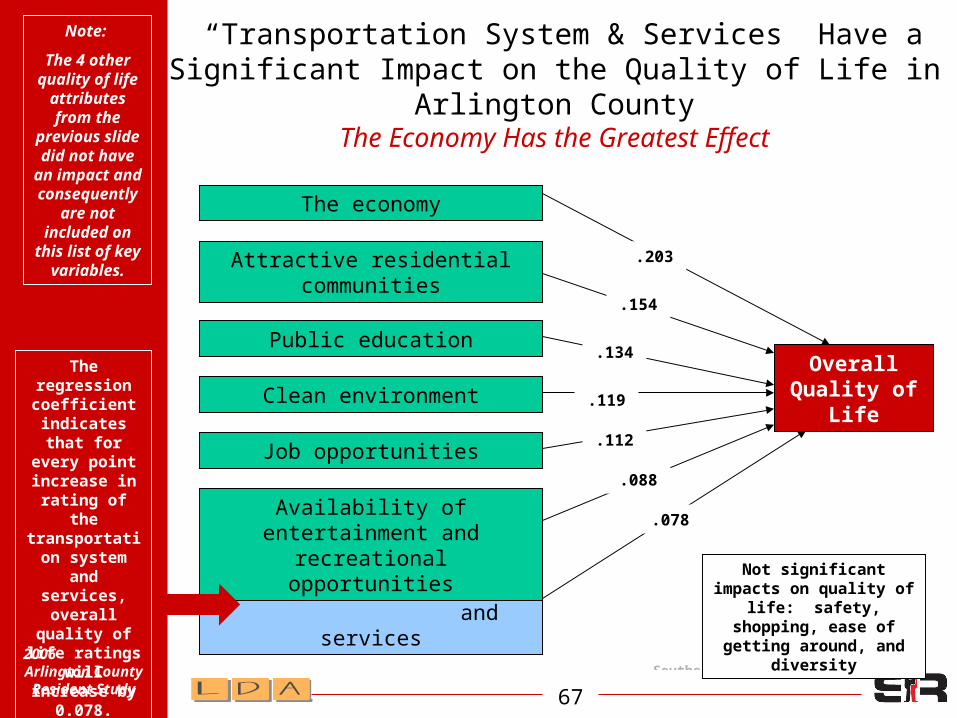
“Transportation System & Services” Have a Significant Impact on the Quality of Life in Arlington
CountyThe Economy Has the Greatest Effect
The regression coefficient indicates that for
every point increase in
rating of the transportation system
and services, overall
quality of life ratings
will increase by 0.078.
OverallQuality of
Life
The economy
Transportation system and services
Availability of entertainment and recreational opportunities
Job opportunities
Clean environment
Public education
Attractive residential communities
.078
.134
.119
.154
.112
.088
.203
Note:
The 4 other quality of
life attributes from the previous slide did
not have an impact and consequently are not
included on this list of
key variables.
Not significant impacts on quality of
life: safety, shopping, ease of getting
around, and diversity

Southeastern Institute of
Research68
2006 Arlington
County Resident Study
Satisfaction with the “Transportation System & Services” in Arlington
County Improves Residents’ Quality of Life Ratings
85%94%
0%
20%
40%
60%
80%
100%
Less than very satisfied withtransportation system
Very satisfied with transportationsystem
C-1: How would you rate the overall quality of life in Arlington County?
9-point lift
The trans-portation system in Arlington County
makes it a better
place to live.
How to Read This
Chart:Proportions
reported are those rating the quality of
life favorably.
Example: 85% of
those less than very
satisfied w/ trans.
system rate quality of
life favorably.
Southeastern Institute of
Research69
2006 Arlington
County Resident Study
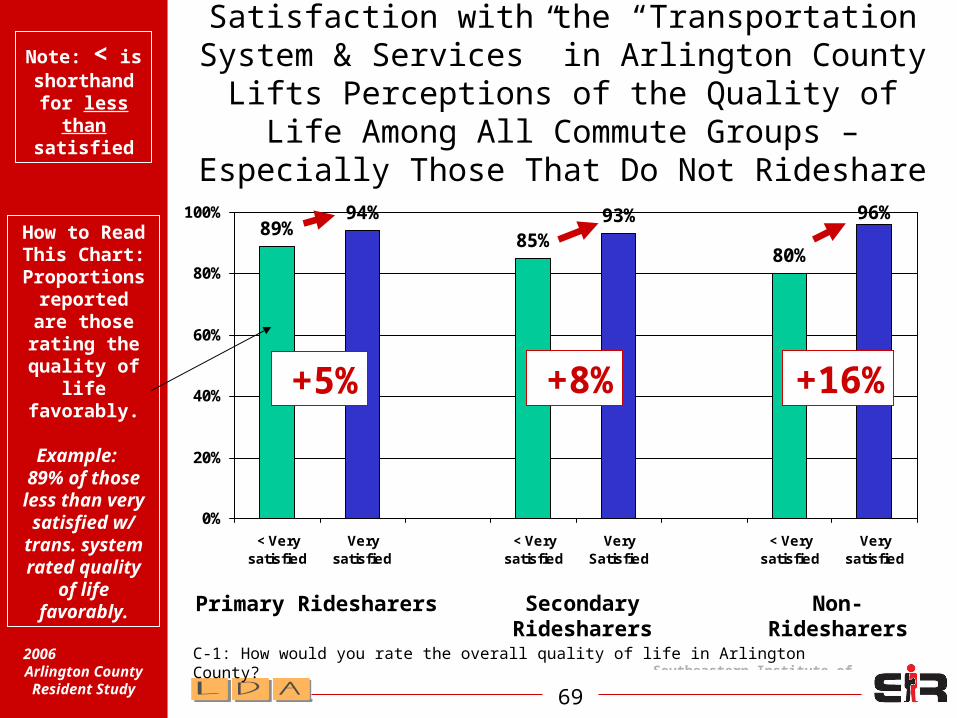
Satisfaction with the “Transportation System & Services” in Arlington County Lifts
Perceptions of the Quality of Life Among All Commute Groups – Especially Those That Do
Not Rideshare
89%94%
85%93%
80%
96%
0%
20%
40%
60%
80%
100%
< Verysatisfied
Verysatisfied
< Verysatisfied
VerySatisfied
< Verysatisfied
Verysatisfied
C-1: How would you rate the overall quality of life in Arlington County?
Primary Ridesharers Secondary Ridesharers
Non-Ridesharers
+5%
+16%
+8%
Note: < is shorthand
for less than
satisfied
How to Read This
Chart:Proportions
reported are those rating the quality of
life favorably.
Example: 89% of
those less than very
satisfied w/ trans.
system rated
quality of life
favorably.
Southeastern Institute of
Research70
2006 Arlington
County Resident Study
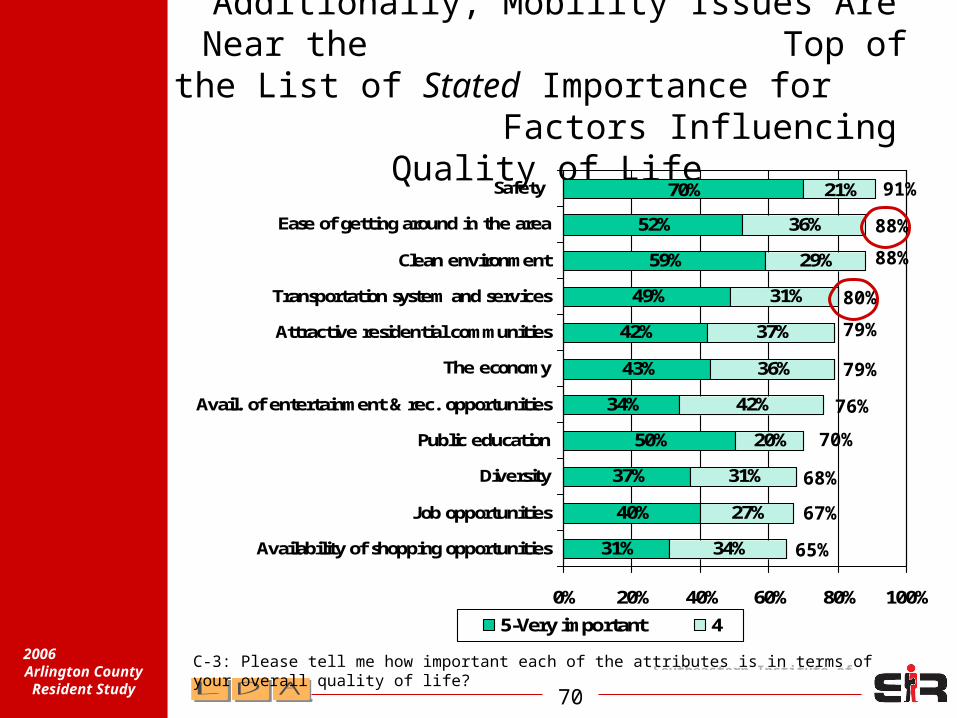
Additionally, Mobility Issues Are Near the Top of the List of Stated
Importance for Factors Influencing Quality of Life
31%
40%
37%
50%
34%
43%
42%
49%
59%
52%
70%
34%
27%
31%
20%
42%
36%
37%
31%
29%
36%
21%
0% 20% 40% 60% 80% 100%
Availability of shopping opportunities
Job opportunities
Diversity
Public education
Avail. of entertainment & rec. opportunities
The economy
Attractive residential communities
Transportation system and services
Clean environment
Ease of getting around in the area
Safety
5-Very important 4
C-3: Please tell me how important each of the attributes is in terms of your overall quality of life?
91%
88%88%
80%79%
79%
76%
70%
68%
67%
65%

Southeastern Institute of
Research71
2006 Arlington
County Resident Study
Nearly Nine out of Ten Primary Ridesharers Say That “Ease of Getting Around the Area” Is Important to Their Overall Quality of Life; Similarly, Nine out of Ten Primary
Ridesharers Say “Transportation System & Services” Are Important
26%
42%
34%
51%
24%
40%
31%
60%
56%
54%
73%
33%
32%
34%
19%
46%
47%
46%
27%
34%
35%
21%
0% 20% 40% 60% 80% 100%
Availability of shopping opportunities
Job opportunities
Diversity
Public education
Avail. of entertainment & rec. opportunities
The economy
Attractive residential communities
Transportation system and services
Clean environment
Ease of getting around in the area
Safety
5-Very important 4
C-3: Please tell me how important each of the attributes is in terms of your overall quality of life?
94%
89%
90%
87%
77%87%
70%
70%
68%
74%
59%
Based to Primary Ridesharers

Southeastern Institute of
Research72
2006 Arlington
County Resident Study
The “Transportation System & Services” Are Less Important to Secondary Ridesharers, but “Ease of
Getting Around” Is Just As Important for This Group As for Primary Ridesharers
34%
38%
41%
46%
37%
43%
47%
47%
61%
51%
73%
34%
26%
27%
22%
42%
33%
33%
34%
29%
39%
18%
0% 20% 40% 60% 80% 100%
Availability of shopping opportunities
Job opportunities
Diversity
Public education
Avail. of entertainment & rec. opportunities
The economy
Attractive residential communities
Transportation system and services
Clean environment
Ease of getting around in the area
Safety
5-Very important 4
C-3: Please tell me how important each of the attributes is in terms of your overall quality of life?
91%
90%
90%
81%
80%
76%
79%
68%
68%
64%
68%
Based to Secondary Ridesharers

Southeastern Institute of
Research73
2006 Arlington
County Resident Study
Both the “Transportation System & Services” and “Ease of Getting Around” Are Less
Important to Non-Ridesharers
33%
41%
35%
53%
38%
47%
49%
40%
59%
50%
64%
36%
23%
32%
20%
37%
31%
35%
32%
26%
33%
25%
0% 20% 40% 60% 80% 100%
Availability of shopping opportunities
Job opportunities
Diversity
Public education
Avail. of entertainment & rec. opportunities
The economy
Attractive residential communities
Transportation system and services
Clean environment
Ease of getting around in the area
Safety
5-Very important 4
C-3: Please tell me how important each of the attributes is in terms of your overall quality of life?
89%
83%85%
72%
84%
78%
75%
73%
67%
64%
69%
Based to Non-Ridesharers

Southeastern Institute of
Research74
2006 Arlington
County Resident Study
Key Finding:Arlington County residents are quite satisfied with their quality of life. And, the transportation system in Arlington County improves their quality of life.
When explicitly asked how important certain attributes are in their overall quality of life, both transportation services and ease of getting around in the area were rated near the top — even higher than education and job opportunities.
Higher level statistical modeling of the survey data confirmed residents’ explicit or stated feelings. The transportation system has a statistically significant impact on perceptions of quality of life. While education, job opportunities, and other attributes may have a greater impact, the fact is transportation is in the set of attributes that have a measurable impact on how Arlington County residents rate their quality of life!
Strategic Implication:The transportation system in Arlington County improves the quality of life in Arlington County. This fact can be stated unequivocally in marketing materials.
Southeastern Institute of
Research75
2006 Arlington
County Resident Study
Key Finding:Perceptions of the impact of transportation and mobility on overall quality of life differ for Ridesharers and Non-Ridesharers. On some measures, the relationship between transportation and quality of life is evident for Ridesharers but not for Non-Ridesharers. On other measures, the relationship is stronger for Non-Ridesharers.
Strategic Implication: The relationship between transportation and quality of life is complex. Do not expect residents to “figure it out” for themselves. Use communications to continue to develop a greater appreciation of the important role transportation has in residents’ quality of life. Inform and educate residents about this direct relationship to grow awareness, familiarity, and desired behavior of a fully-integrated transportation system.
Southeastern Institute of
Research76
2006 Arlington
County Resident Study
Perceptions ofTransportation
System
Southeastern Institute of
Research77
2006 Arlington
County Resident Study
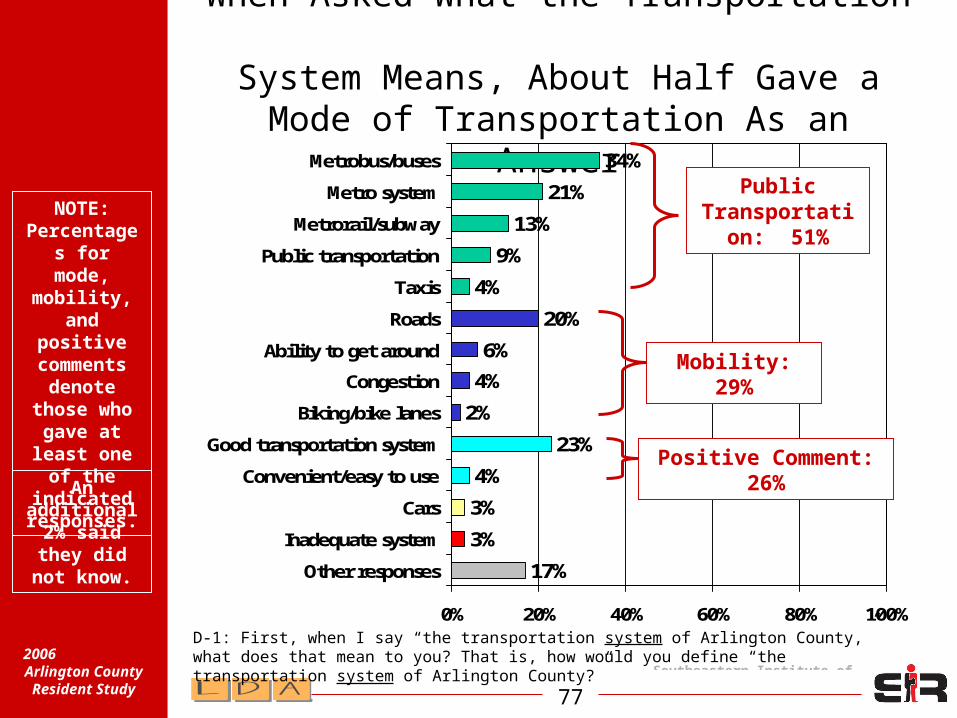
When Asked What the Transportation System Means, About Half Gave a Mode
of Transportation As an Answer
17%
3%
3%
4%
23%
2%
4%
6%
20%
4%
9%
13%
21%
34%
0% 20% 40% 60% 80% 100%
Other responses
Inadequate system
Cars
Convenient/easy to use
Good transportation system
Biking/bike lanes
Congestion
Ability to get around
Roads
Taxis
Public transportation
Metrorail/subway
Metro system
Metrobus/buses
D-1: First, when I say “the transportation system of Arlington County,” what does that mean to you? That is, how would you define “the transportation system of Arlington County?”
An additional 2% said they did
not know.
Public Transportatio
n: 51%
Mobility: 29%
Positive Comment: 26%
NOTE: Percentages for mode,
mobility, and
positive comments
denote those who
gave at least one
of the indicated
responses.
Southeastern Institute of
Research78
2006 Arlington
County Resident Study
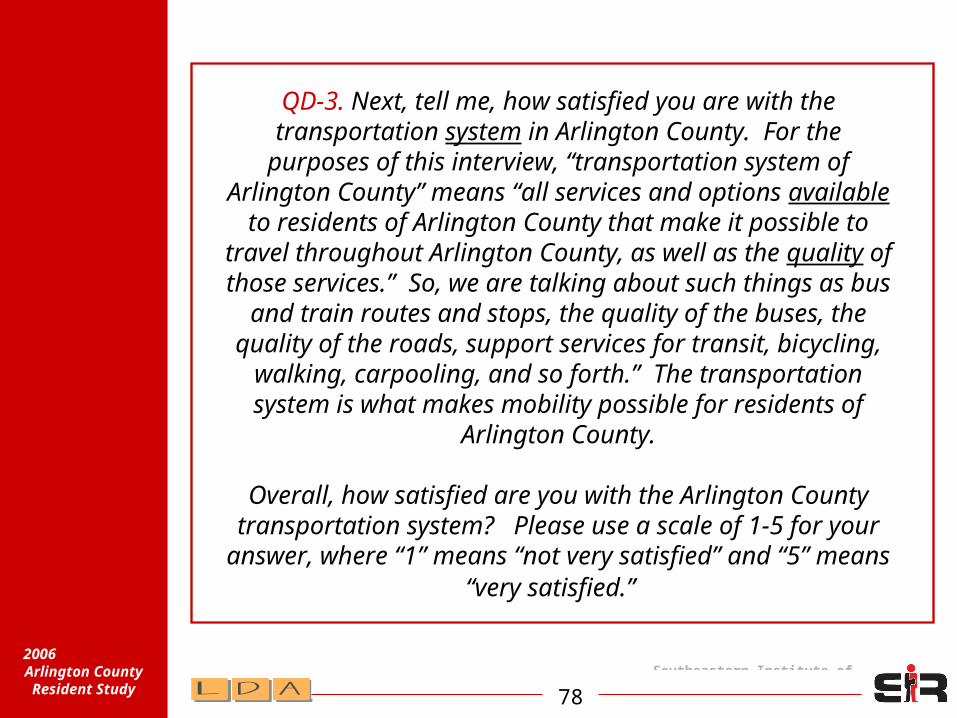
QD-3. Next, tell me, how satisfied you are with the transportation system in Arlington County. For the purposes of this interview, “transportation system
of Arlington County” means “all services and options available to residents of Arlington County
that make it possible to travel throughout Arlington County, as well as the quality of those services.” So, we are talking about such things as bus and
train routes and stops, the quality of the buses, the quality of the roads, support services for transit, bicycling, walking, carpooling, and so forth.” The
transportation system is what makes mobility possible for residents of Arlington County.
Overall, how satisfied are you with the Arlington
County transportation system? Please use a scale of 1-5 for your answer, where “1” means “not very
satisfied” and “5” means “very satisfied.”
Southeastern Institute of
Research79
2006 Arlington
County Resident Study
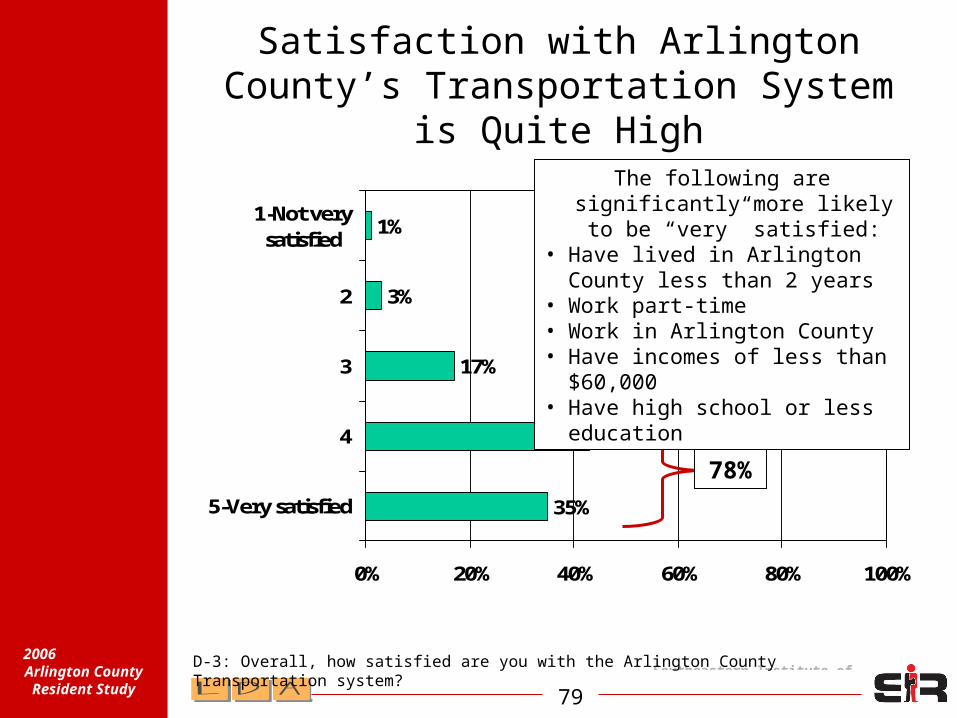
Satisfaction with Arlington County’s Transportation System is Quite High
35%
43%
17%
3%
1%
0% 20% 40% 60% 80% 100%
5-Very satisfied
4
3
2
1-Not verysatisfied
D-3: Overall, how satisfied are you with the Arlington County Transportation system?
78%
The following are significantly more likely to be “very”
satisfied:• Have lived in Arlington County
less than 2 years• Work part-time• Work in Arlington County• Have incomes of less than
$60,000• Have high school or less
education
Southeastern Institute of
Research80
2006 Arlington
County Resident Study
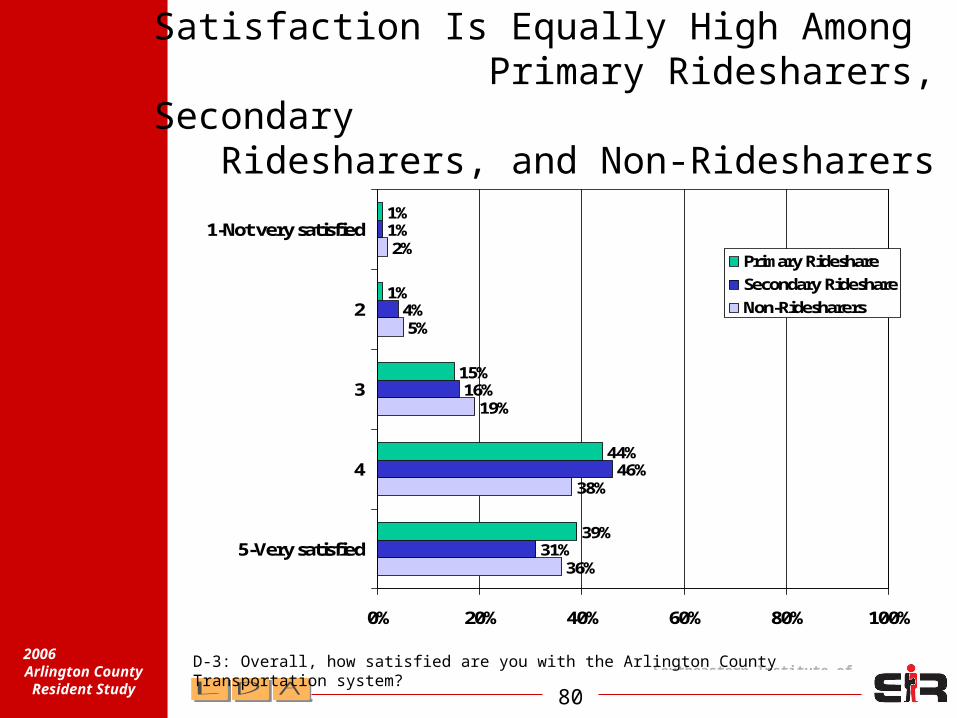
Satisfaction Is Equally High Among Primary Ridesharers, Secondary
Ridesharers, and Non-Ridesharers
D-3: Overall, how satisfied are you with the Arlington County Transportation system?
36%
38%
19%
5%
2%
31%
46%
16%
4%
1%
39%
44%
15%
1%
1%
0% 20% 40% 60% 80% 100%
5-Very satisfied
4
3
2
1-Not very satisfied
Primary Rideshare
Secondary Rideshare
Non-Ridesharers
Southeastern Institute of
Research81
2006 Arlington
County Resident Study
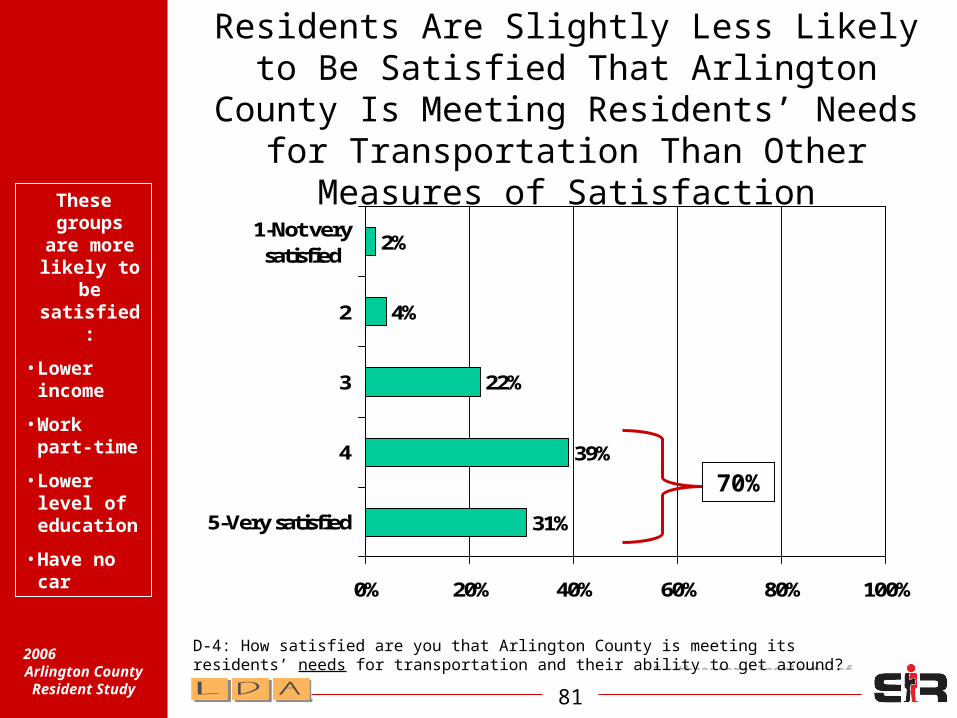
Residents Are Slightly Less Likely to Be Satisfied That Arlington County Is
Meeting Residents’ Needs for Transportation Than Other Measures of
Satisfaction
31%
39%
22%
4%
2%
0% 20% 40% 60% 80% 100%
5-Very satisfied
4
3
2
1-Not verysatisfied
D-4: How satisfied are you that Arlington County is meeting its residents’ needs for transportation and their ability to get around?
70%
These groups
are more likely to
be satisfied:
•Lower income
•Work part-time
•Lower level of education
•Have no car
Southeastern Institute of
Research82
2006 Arlington
County Resident Study
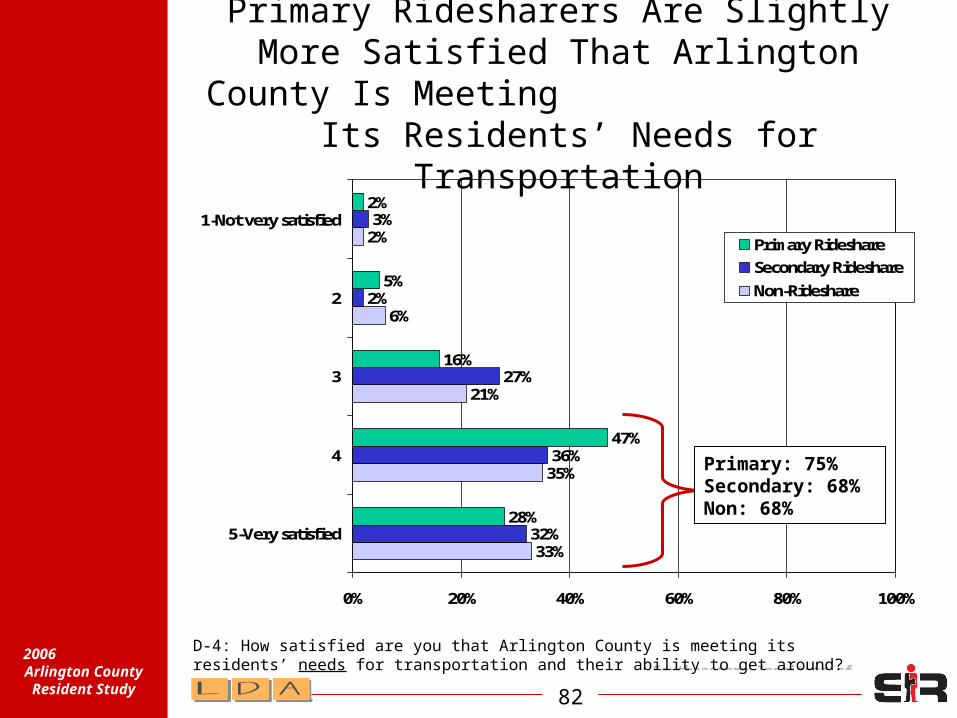
33%
35%
21%
6%
2%
32%
36%
27%
2%
3%
28%
47%
16%
5%
2%
0% 20% 40% 60% 80% 100%
5-Very satisfied
4
3
2
1-Not very satisfied
Primary Rideshare
Secondary Rideshare
Non-Rideshare
Primary Ridesharers Are Slightly More Satisfied That Arlington County Is
Meeting Its Residents’ Needs for Transportation
D-4: How satisfied are you that Arlington County is meeting its residents’ needs for transportation and their ability to get around?
Primary: 75%Secondary: 68%Non: 68%
Southeastern Institute of
Research83
2006 Arlington
County Resident Study
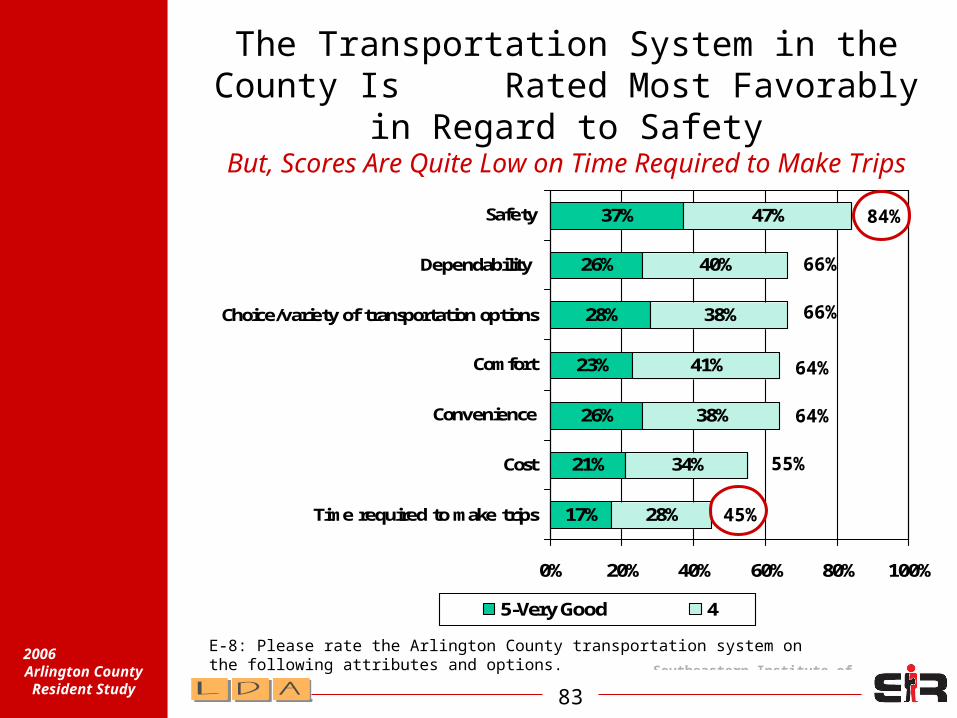
The Transportation System in the County Is Rated Most Favorably in
Regard to SafetyBut, Scores Are Quite Low on Time Required to Make
Trips
17%
21%
26%
23%
28%
26%
37%
28%
34%
38%
41%
38%
40%
47%
0% 20% 40% 60% 80% 100%
Time required to make trips
Cost
Convenience
Comfort
Choice/variety of transportation options
Dependability
Safety
5-Very Good 4
E-8: Please rate the Arlington County transportation system on the following attributes and options.
84%
66%
66%
64%
64%
55%
45%
Southeastern Institute of
Research84
2006 Arlington
County Resident Study
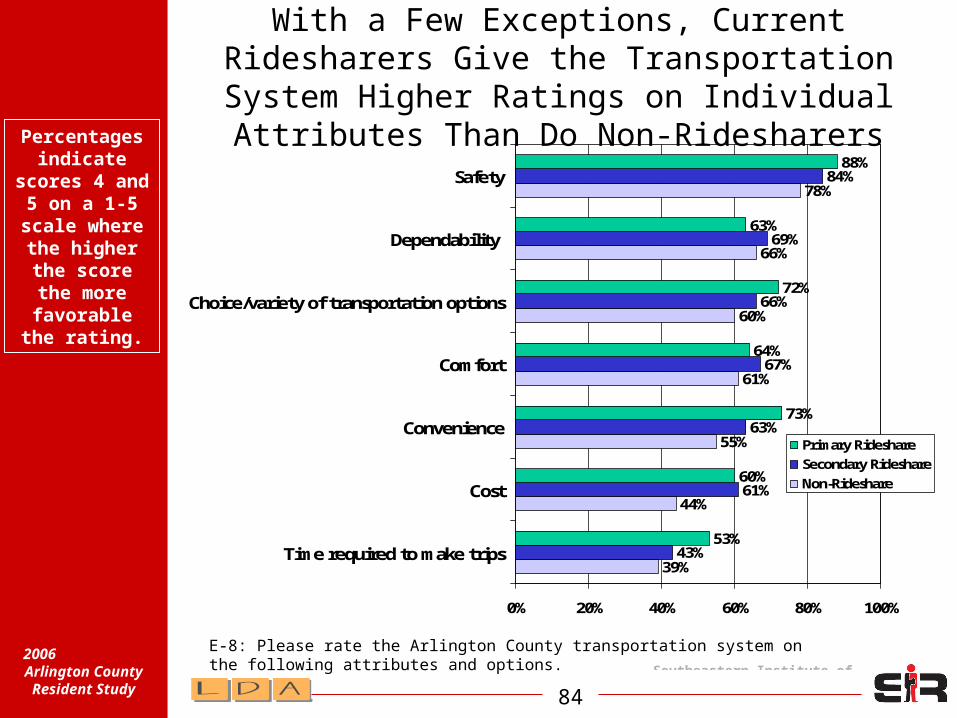
With a Few Exceptions, Current Ridesharers Give the Transportation System Higher
Ratings on Individual Attributes Than Do Non-Ridesharers
E-8: Please rate the Arlington County transportation system on the following attributes and options.
39%
44%
55%
61%
60%
66%
78%
43%
61%
63%
67%
66%
69%
84%
53%
60%
73%
64%
72%
63%
88%
0% 20% 40% 60% 80% 100%
Time required to make trips
Cost
Convenience
Comfort
Choice/variety of transportation options
Dependability
Safety
Primary Rideshare
Secondary Rideshare
Non-Rideshare
Percentages indicate
scores 4 and 5 on a 1-5
scale where the higher the score the more favorable the rating.
Southeastern Institute of
Research85
2006 Arlington
County Resident Study
Key Finding:Satisfaction with Arlington County’s transportation system is quite high – both for Ridesharers and Non-Ridesharers. Overall, however, residents tend to give slightly lower scores to the County in terms of meeting its residents’ transportation needs than on other measures of satisfaction in this research. Are citizens failing to recognize the County’s role in providing those services? Perhaps the County is not getting all the credit it deserves for its transportation initiatives.
Strategic Implication #1:Create a stronger “link’ or association between the County’s brand and Arlington County’s transportation system. Communicate more thoroughly the role of the County in providing transportation services. Consider a move to a more unified “brand sponsor” rather than three separate entities – ACCS, ATP, and Arlington Transportation.
Strategic Implication #2:It may be that residents have unmet needs in regard to transportation in Arlington County. Explore the extent to which “something is missing” in regard to transportation services, features, and attributes via upcoming planned studies.
Southeastern Institute of
Research86
2006 Arlington
County Resident Study
Key Finding:Residents give the most favorable ratings to the safety of the transportation system. They are least satisfied with the time it takes to make trips. With few exceptions, current ridesharers give the transportation system higher ratings than do those who do not rideshare. Those who do not rideshare give the lowest rating to the time it takes to make trips.
Strategic Implication:“Time” is an issue. If credible promises can be made in regard to ridesharing and saving time, then, it can be used to promote ridesharing. If credible promises cannot be made, it should be avoided as a message idea.
Southeastern Institute of
Research87
2006 Arlington
County Resident Study
What’s driving
satisfaction with the
transportation system?

Southeastern Institute of
Research88
2006 Arlington
County Resident Study
Possible Drivers of Satisfaction with Transportation System
Satisfaction with
Transportation System
Safety
Ease of getting around by bus
Ease of getting around w/out car
Ease of getting around by walking
Ease of getting to other destinations w/out a car
Ease of getting around by bicycle
Sat. AC is meeting residents needs
Ability to travel around Arlington County
Ease of getting around w/car
Choice/variety of options
Cost
Time required to make trips
Convenience
Dependability
Comfort
?
??
???
?
??
? ??
?
??
Southeastern Institute of
Research89
2006 Arlington
County Resident Study
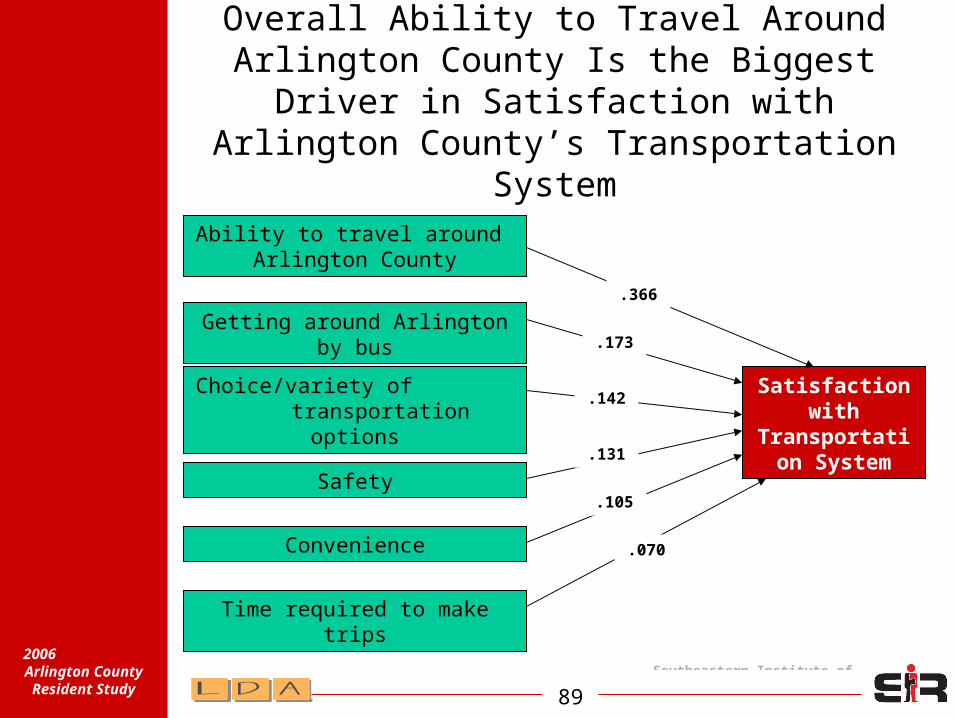
Overall Ability to Travel Around Arlington County Is the Biggest Driver in
Satisfaction with Arlington County’s Transportation System
Satisfaction with
Transportation System
Getting around Arlington by bus
Ability to travel around Arlington County
Choice/variety of transportation options
Convenience
Time required to make trips
Safety
.070
.105
.131
.142
.173
.366

Southeastern Institute of
Research90
2006 Arlington
County Resident Study
Primary Ridesharers Follow a Similar Model, Yet Convenience and Time Required to Make
Trips Are Not Major Drivers of Their Satisfaction
Satisfaction with
Transportation System
Getting around Arlington by bus
Ability to travel around Arlington County
Safety
Choice/variety of transportation options .117
.155
.286
.291
Southeastern Institute of
Research91
2006 Arlington
County Resident Study
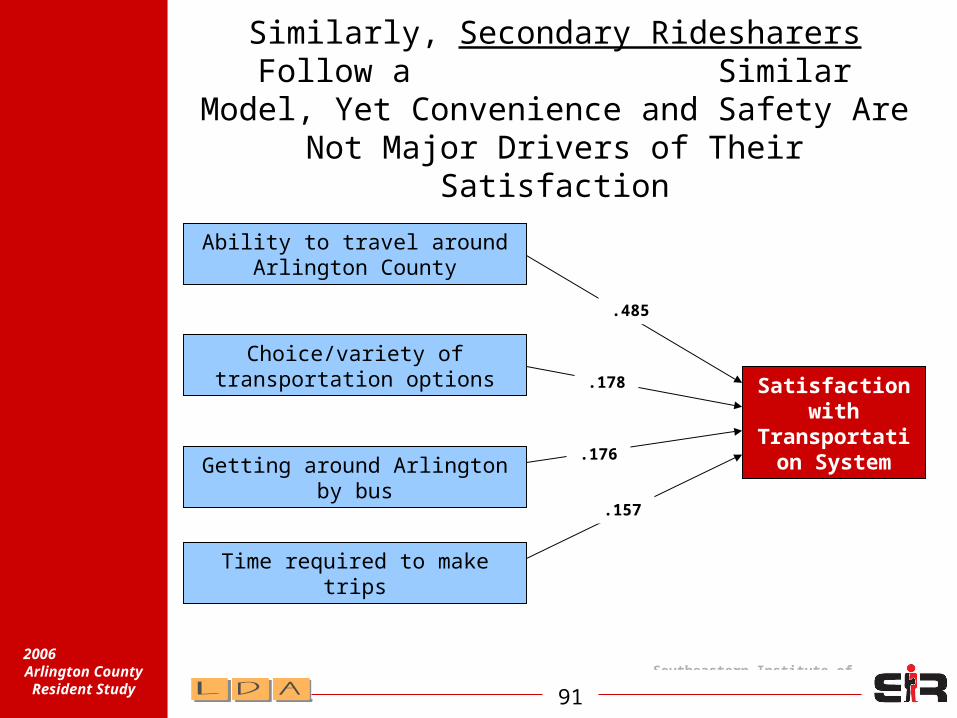
Similarly, Secondary Ridesharers Follow a Similar Model, Yet Convenience and
Safety Are Not Major Drivers of Their Satisfaction
Satisfaction with
Transportation SystemGetting around Arlington by
bus
Ability to travel around Arlington County
Time required to make trips
Choice/variety of transportation options
.485
.176
.178
.157
Southeastern Institute of
Research92
2006 Arlington
County Resident Study
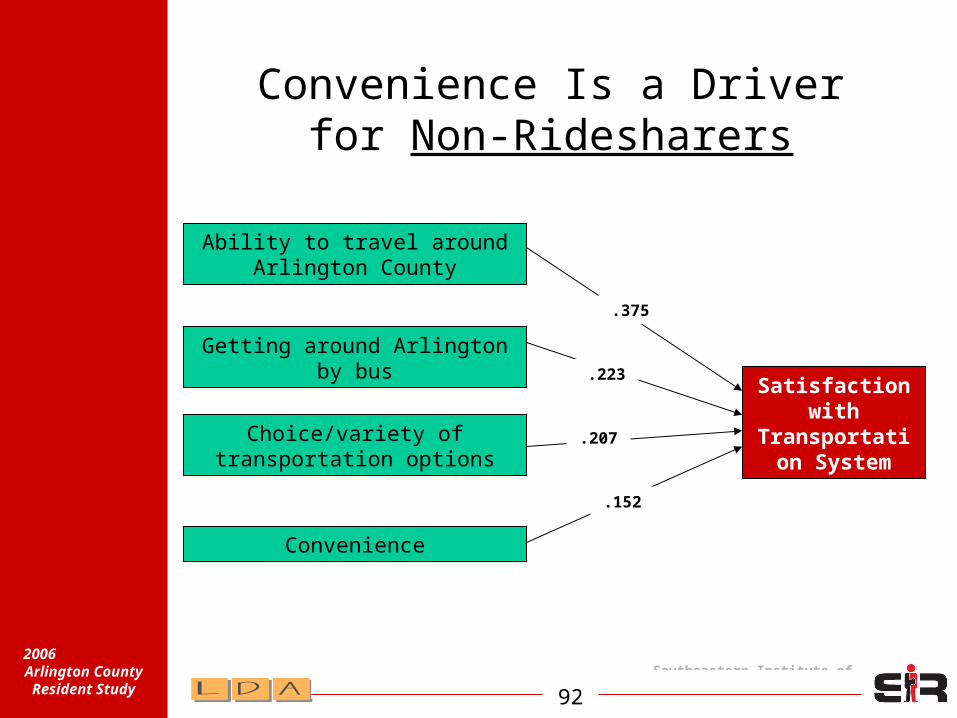
Convenience Is a Driver for Non-Ridesharers
Satisfaction with
Transportation System
Getting around Arlington by bus
Ability to travel around Arlington County
Convenience
Choice/variety of transportation options
.152
.207
.223
.375

Southeastern Institute of
Research93
2006 Arlington
County Resident Study
Ridesharing Status Affects What Drives Satisfaction with the Transportation
SystemPrimary
RideshareSecondary Rideshare
Non-Rideshare
Ability to travel around Arlington
County
Ability to travel around Arlington
County
Ability to travel around Arlington
County
SafetyChoice/variety of transportation
options
Getting around Arlington by bus
Choice/variety of transportation
options
Getting around Arlington by bus
Choice/variety of transportation
options
Getting around Arlington by bus
Time required to make trips
Convenience
Southeastern Institute of
Research94
2006 Arlington
County Resident Study
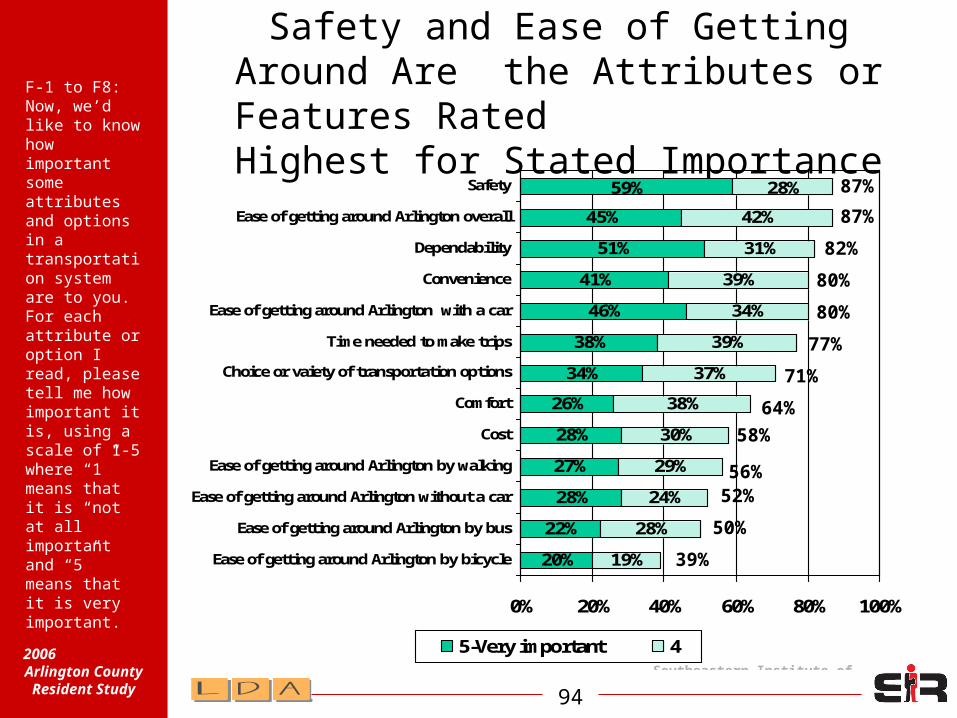
Safety and Ease of Getting Around Are the Attributes or Features Rated
Highest for Stated Importance
20%
22%
28%
27%
28%
26%
34%
38%
46%
41%
51%
45%
59%
19%
28%
24%
29%
30%
38%
37%
39%
34%
39%
31%
42%
28%
0% 20% 40% 60% 80% 100%
Ease of getting around Arlington by bicycle
Ease of getting around Arlington by bus
Ease of getting around Arlington without a car
Ease of getting around Arlington by walking
Cost
Comfort
Choice or vaiety of transportation options
Time needed to make trips
Ease of getting around Arlington with a car
Convenience
Dependability
Ease of getting around Arlington overall
Safety
5-Very important 4
F-1 to F8: Now, we’d like to know how important some attributes and options in a transportation system are to you. For each attribute or option I read, please tell me how important it is, using a scale of 1-5 where “1” means that it is “not at all important and “5” means that it is very important.
87%
87%
82%
80%
80%
77%
71%
64%58%
56%52%
50%
39%
Southeastern Institute of
Research95
2006 Arlington
County Resident Study
Key Finding:Overall ease of traveling around Arlington County, choice/variety of transportation options, and getting around by bus are the biggest drivers of satisfaction with the transportation system. Safety is also a major factor for primary ridesharers, as is time required to make trips and convenience for Secondary Ridesharers and Non-Ridesharers respectively.
Strategic Implication:In order to increase overall satisfaction with the transportation system, make sure that residents are aware of and familiar with the wide variety of transportation options available to them—particularly buses. Do not ignore the role of time and convenience, however. These are important needs among those who are not Primary Ridesharers and can influence their transportation choices.

Southeastern Institute of
Research96
2006 Arlington
County Resident Study
The Arlington County Transportation Impact Model
Overall
Quality of Life

Southeastern Institute of
Research97
2006 Arlington
County Resident Study
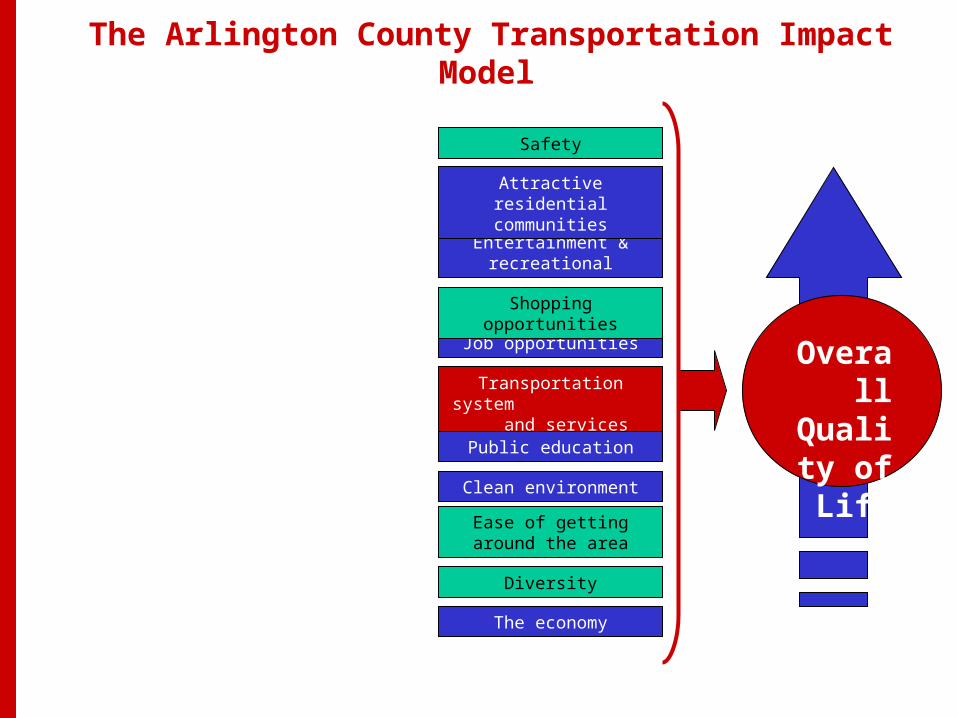
The Arlington County Transportation Impact Model
The economy
Transportation system and services
Entertainment & recreational
Job opportunities
Clean environment
Public education
Attractive residential communities
Safety
Shopping opportunities
Ease of getting around the area
Diversity
Overall
Quality of Life

Southeastern Institute of
Research98
2006 Arlington
County Resident Study
The Arlington County Transportation Impact Model
The economy
Transportation system and services
Entertainment & recreational
Job opportunities
Clean environment
Public education
Attractive residential communities
Safety
Shopping opportunities
Ease of getting around the area
Diversity
Overall
Quality of Life
Southeastern Institute of
Research99
2006 Arlington
County Resident Study
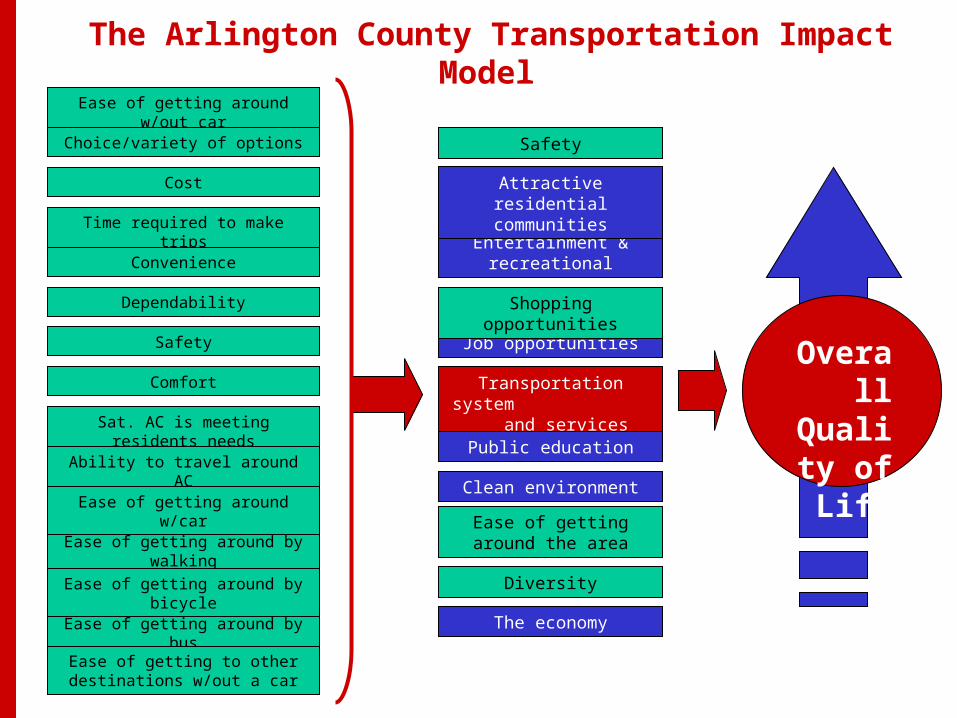
The Arlington County Transportation Impact Model
The economy
Transportation system and services
Entertainment & recreational
Job opportunities
Clean environment
Public education
Attractive residential communities
Safety
Shopping opportunities
Ease of getting around the area
Diversity
Overall
Quality of Life
Southeastern Institute of
Research100
2006 Arlington
County Resident Study
The Arlington County Transportation Impact Model
The economy
Transportation system and services
Entertainment & recreational
Job opportunities
Clean environment
Public education
Attractive residential communities
Safety
Shopping opportunities
Ease of getting around the area
Diversity
Overall
Quality of Life
Safety
Ease of getting around by bus
Ease of getting around w/out car
Ease of getting around by walking
Ease of getting around by bicycle
Sat. AC is meeting residents needs
Ability to travel around AC
Ease of getting around w/car
Choice/variety of options
Cost
Time required to make trips
Convenience
Dependability
Comfort
Ease of getting to other destinations w/out a car

Southeastern Institute of
Research101
2006 Arlington
County Resident Study
The Arlington County Transportation Impact Model
The economy
Transportation system and services
Entertainment & recreational
Job opportunities
Clean environment
Public education
Attractive residential communities
Safety
Shopping opportunities
Ease of getting around the area
Diversity
Overall
Quality of Life
Safety
Ease of getting around by bus
Ease of getting around w/out car
Ease of getting around by walking
Ease of getting around by bicycle
Sat. AC is meeting residents needs
Ability to travel around AC
Ease of getting around w/car
Choice/variety of options
Cost
Time required to make trips
Convenience
Dependability
Comfort
Ease of getting to other destinations w/out a car

Southeastern Institute of
Research102
2006 Arlington
County Resident Study
Opportunities forImprovement

Southeastern Institute of
Research103
2006 Arlington
County Resident Study
There Are Some Noticeable Gaps Between Importance and
Performance Ratings
39%
50%
52%
56%
58%
64%
71%
77%
80%
80%
82%
87%
87%
49%
50%
44%
49%
55%
64%
66%
45%
64%
78%
66%
80%
84%
0% 20% 40% 60% 80% 100%
Ease of getting around Arlington by bicycle
Ease of getting around Arlington by bus
Ease of getting around Arlington without a car
Ease of getting around Arlington by walking
Cost
Comfort
Choice or variety of transportation options
Time needed to make trips
Convenience
Ease of getting around Arlington with a car
Dependability
Ease of getting around Arlington overall
Safety
Performance
Importance
Methodology note: All of
the “performanc
e” ratings are on 1-5 scales, yet
are anchored by a variety of
different items (i.e.,
satisfaction, difficulty/ea
se, or poor/good).

Southeastern Institute of
Research104
2006 Arlington
County Resident Study
SIR Opportunity Index
• Calculated based on the factor’s importance to the respondents, the gap between this importance, and your performance on that factor:
Performance Gap = Max. Mean Rating – Performance Level
3.8 mean1.2 = 5.0 mean –
Opportunity Index = Performance Gap X Importance level X Indexing factor of 5
22 = 1.2 3.7 meanX X 5
The higher the number, the greater the opportunity you have to make a
difference.
Southeastern Institute of
Research105
2006 Arlington
County Resident Study
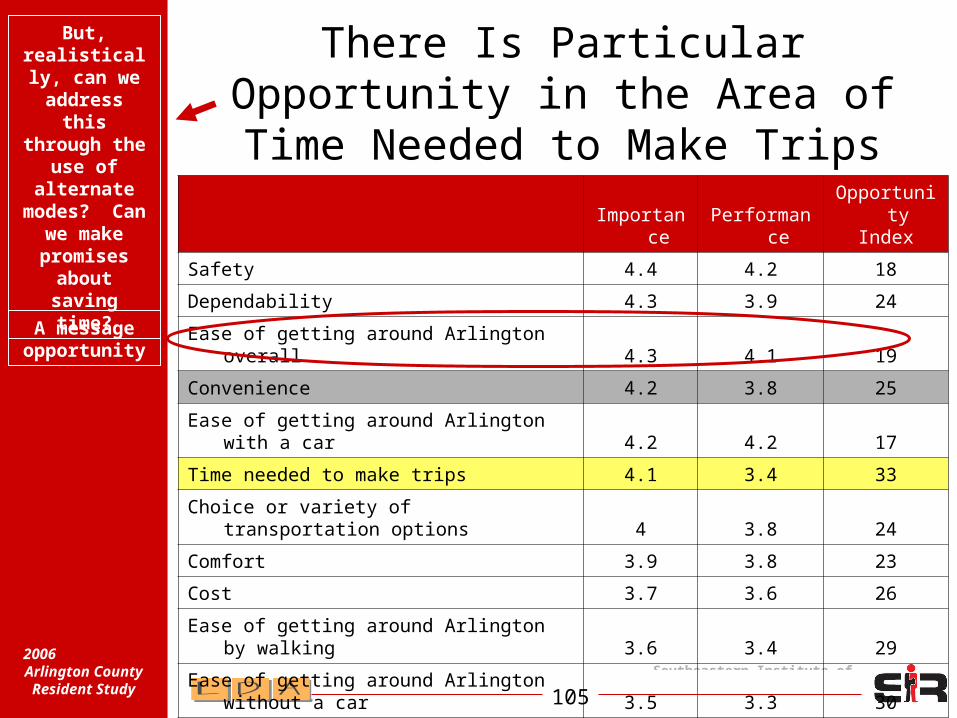
There Is Particular Opportunity in the Area of Time Needed to Make
TripsImportan
cePerforman
ce
Opportunity
Index
Safety 4.4 4.2 18
Dependability 4.3 3.9 24
Ease of getting around Arlington overall 4.3 4.1 19
Convenience 4.2 3.8 25
Ease of getting around Arlington with a car 4.2 4.2 17
Time needed to make trips 4.1 3.4 33
Choice or variety of transportation options 4 3.8 24
Comfort 3.9 3.8 23
Cost 3.7 3.6 26
Ease of getting around Arlington by walking 3.6 3.4 29
Ease of getting around Arlington without a car 3.5 3.3 30
Ease of getting around Arlington by bus 3.4 3.6 24
Ease of getting around Arlington by bicycle 3.1 3.6 22
But, realistically,
can we address this through the
use of alternate modes? Can we make
promises about saving time?A message
opportunity
Southeastern Institute of
Research106
2006 Arlington
County Resident Study
Key Finding:There are a few gaps between importance of transportation system attributes and perceived performance on these items. Notably, there is particular opportunity in the time needed to make trips. This is especially important because this is one of the driving factors for Non-Ridesharers in terms of satisfaction with the ability to get around the County.
Strategic Implication: Promote that ridesharing trips can be fast—or at least do not take additional time—if this is true. An alternative message with strong potential is “convenience” (of the SOV alternatives).

Southeastern Institute of
Research107
2006 Arlington
County Resident Study
Ability to Get Around
Southeastern Institute of
Research108
2006 Arlington
County Resident Study
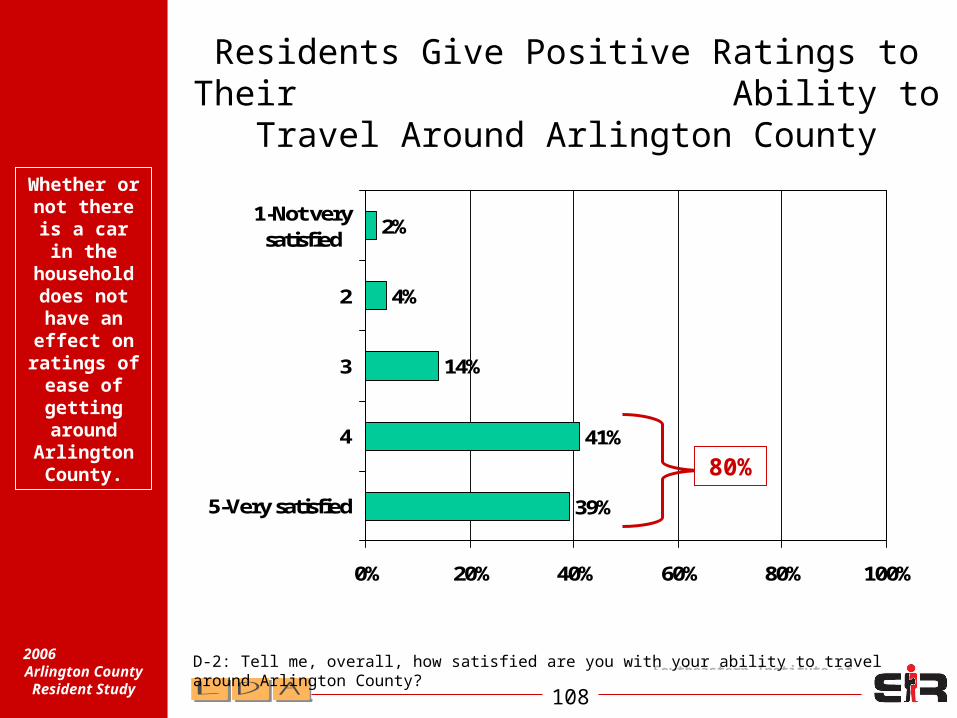
Residents Give Positive Ratings to Their Ability to Travel Around Arlington
County
39%
41%
14%
4%
2%
0% 20% 40% 60% 80% 100%
5-Very satisfied
4
3
2
1-Not verysatisfied
D-2: Tell me, overall, how satisfied are you with your ability to travel around Arlington County?
80%
Whether or not
there is a car in the household does not have an effect on ratings of
ease of getting around
Arlington County.
Southeastern Institute of
Research109
2006 Arlington
County Resident Study
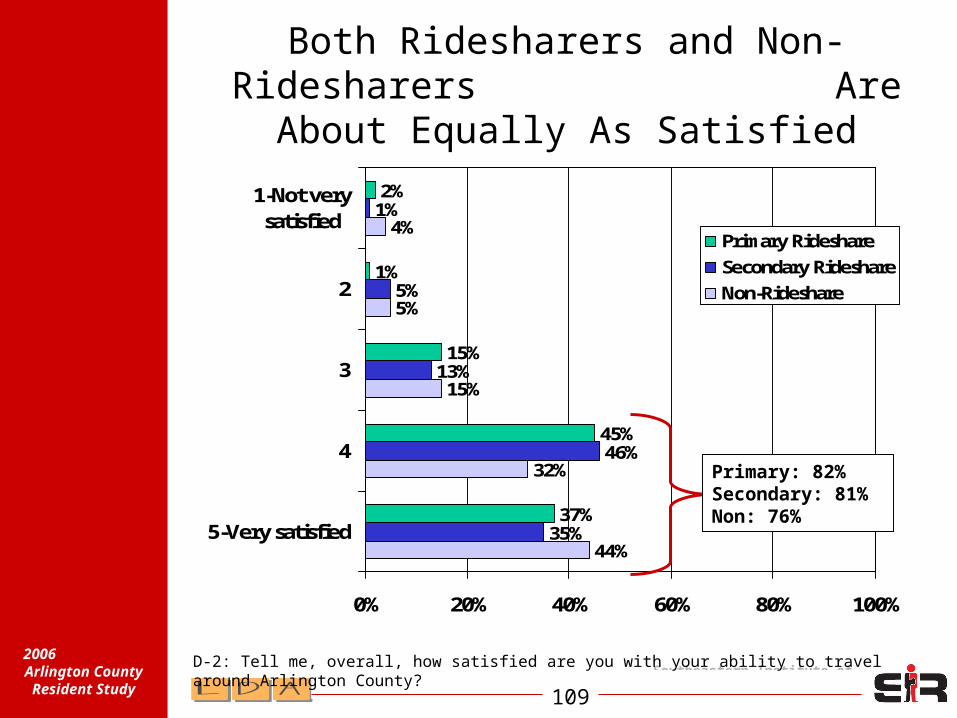
Both Ridesharers and Non-Ridesharers Are About Equally As
Satisfied
44%
32%
15%
5%
4%
35%
46%
13%
5%
1%
37%
45%
15%
1%
2%
0% 20% 40% 60% 80% 100%
5-Very satisfied
4
3
2
1-Not verysatisfied
Primary Rideshare
Secondary Rideshare
Non-Rideshare
D-2: Tell me, overall, how satisfied are you with your ability to travel around Arlington County?
Primary: 82%Secondary: 81%Non: 76%

Southeastern Institute of
Research110
2006 Arlington
County Resident Study
Some Differences Across Demographic Groups Are Posted for Satisfaction with the Ability to Travel Around Arlington
County
• Residents who work in Arlington County are significantly more likely to be satisfied with the ability to travel around Arlington County than are those who work outside Arlington County.
• Those who work part-time are more likely to be satisfied with the ability to travel around Arlington County than are those who work full-time or who do not work.
Southeastern Institute of
Research111
2006 Arlington
County Resident Study
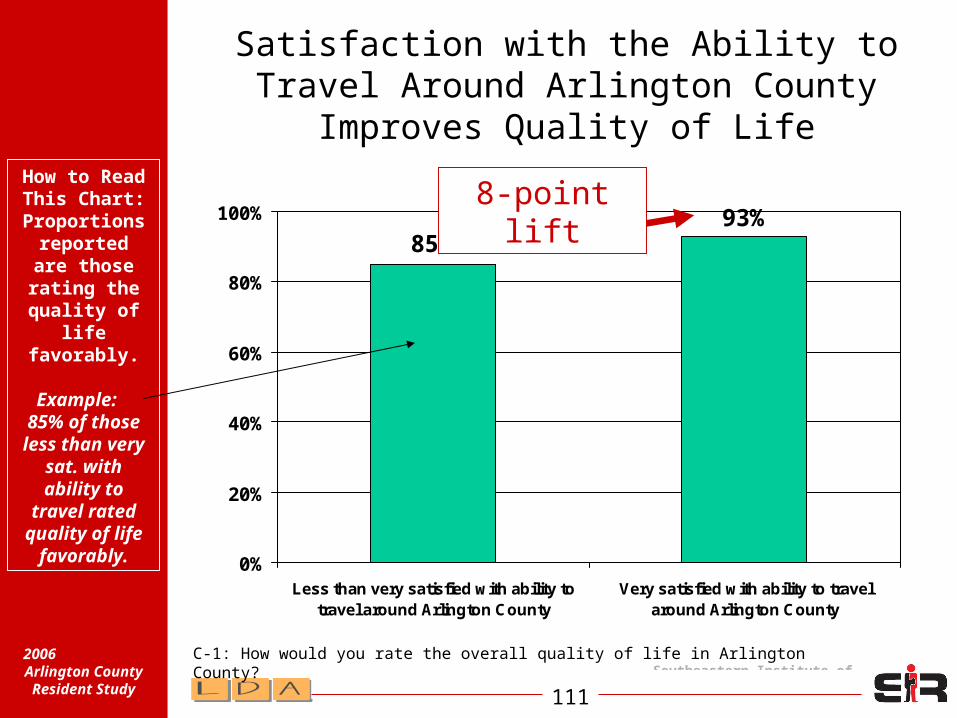
Satisfaction with the Ability to Travel Around Arlington County Improves
Quality of Life
85%93%
0%
20%
40%
60%
80%
100%
Less than very satisfied with ability totravel around Arlington County
Very satisfied with ability to travelaround Arlington County
C-1: How would you rate the overall quality of life in Arlington County?
8-point liftHow to
Read This Chart:
Proportions reported are those rating the quality of
life favorably.
Example: 85% of
those less than very sat. with ability to
travel rated quality of
life favorably.
Southeastern Institute of
Research112
2006 Arlington
County Resident Study
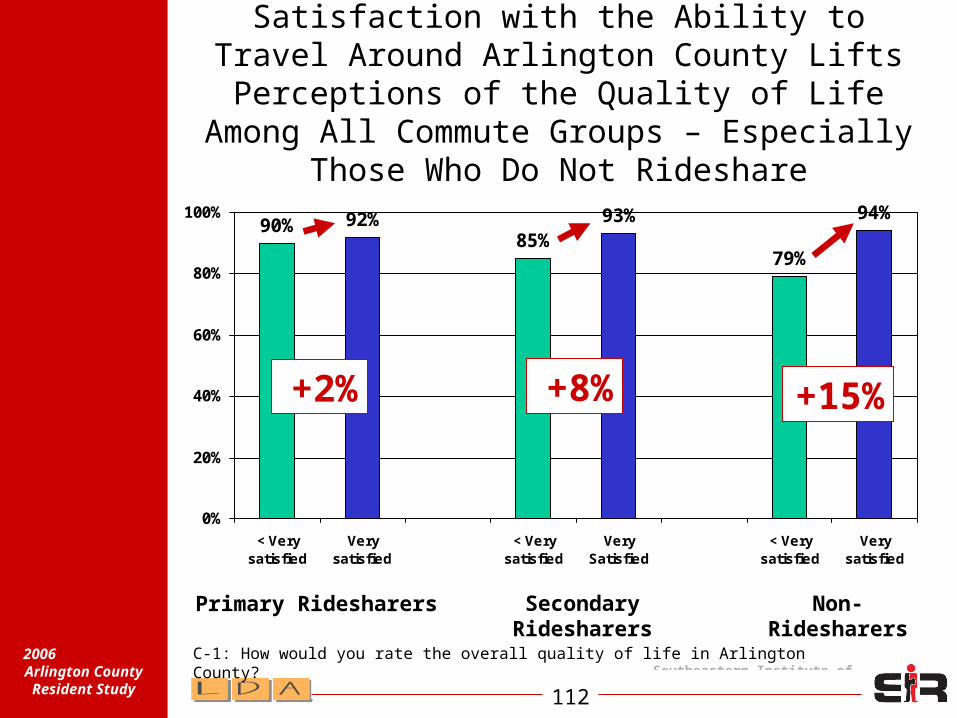
Satisfaction with the Ability to Travel Around Arlington County Lifts Perceptions of
the Quality of Life Among All Commute Groups – Especially Those Who Do Not
Rideshare
90% 92%85%
93%
79%
94%
0%
20%
40%
60%
80%
100%
< Verysatisfied
Verysatisfied
< Verysatisfied
VerySatisfied
< Verysatisfied
Verysatisfied
C-1: How would you rate the overall quality of life in Arlington County?
Primary Ridesharers Secondary Ridesharers
Non-Ridesharers
+2%
+15%
+8%
Southeastern Institute of
Research113
2006 Arlington
County Resident Study
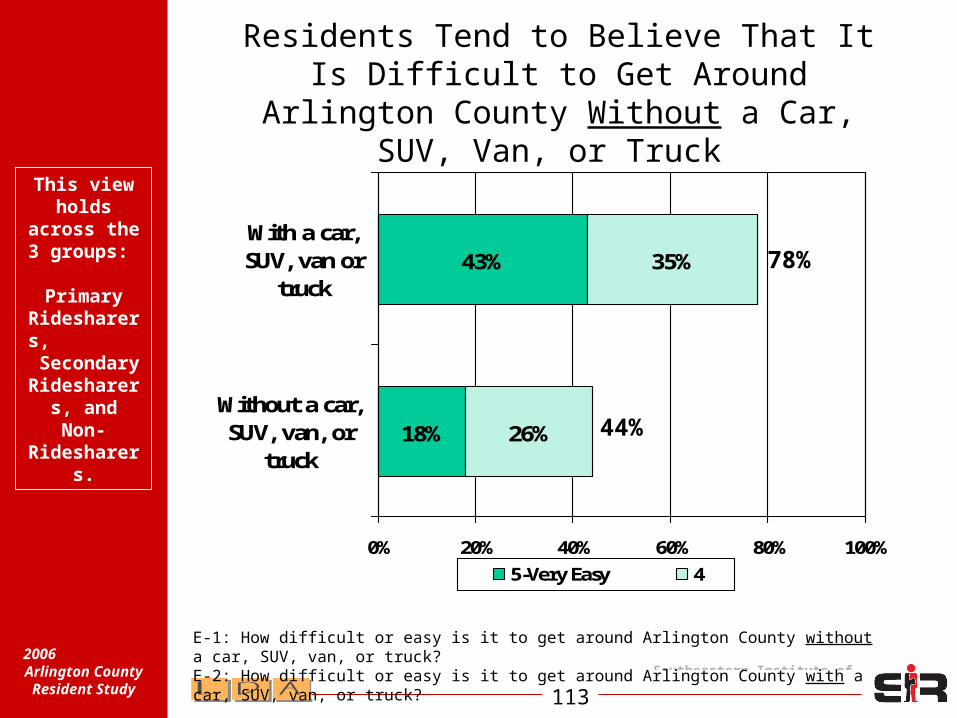
Residents Tend to Believe That It Is Difficult to Get Around Arlington County
Without a Car, SUV, Van, or Truck
18%
43%
26%
35%
0% 20% 40% 60% 80% 100%
Without a car,SUV, van, or
truck
With a car,SUV, van or
truck
5-Very Easy 4
78%
44%
E-1: How difficult or easy is it to get around Arlington County without a car, SUV, van, or truck?E-2: How difficult or easy is it to get around Arlington County with a car, SUV, van, or truck?
This view holds
across the 3 groups:
Primary
Ridesharers,
Secondary Ridesharer
s, and Non-
Ridesharers.

Southeastern Institute of
Research114
2006 Arlington
County Resident Study
Those Who Do Not Actually Own a Car, However, Find It Easier to Get Around
Without a Car Than Those with Cars
16%
24%
33%
17%
7%
17%
27%
31%
15%
7%
25%
29%
26%
9%
10%
0% 20% 40% 60% 80% 100%
5-Very Easy
4
3
2
1-Very Difficult
No cars
One car
More than one car
E-1: How difficult or easy is it to get around Arlington County without a car, SUV, van, or truck?
54% of those with no car say it
is easy to get around Arlington
County.
Southeastern Institute of
Research115
2006 Arlington
County Resident Study
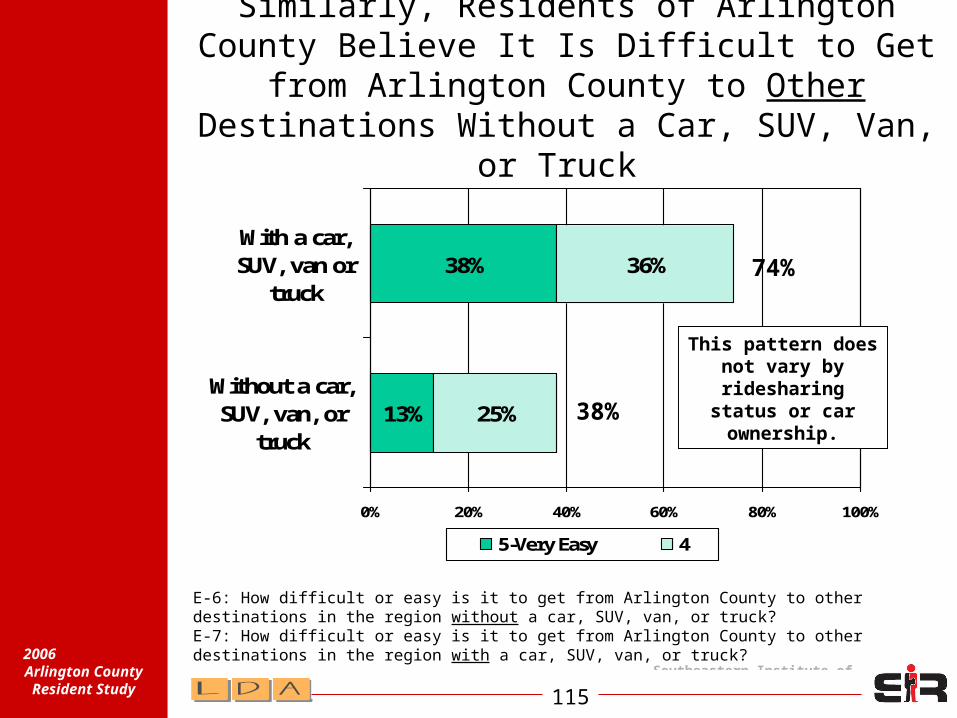
Similarly, Residents of Arlington County Believe It Is Difficult to Get from Arlington
County to Other Destinations Without a Car, SUV, Van, or Truck
25%
36%
13%
38%
0% 20% 40% 60% 80% 100%
Without a car,SUV, van, or
truck
With a car,SUV, van or
truck
5-Very Easy 4
74%
38%
E-6: How difficult or easy is it to get from Arlington County to other destinations in the region without a car, SUV, van, or truck?E-7: How difficult or easy is it to get from Arlington County to other destinations in the region with a car, SUV, van, or truck?
This pattern does not vary by ridesharing
status or car ownership.
Southeastern Institute of
Research116
2006 Arlington
County Resident Study
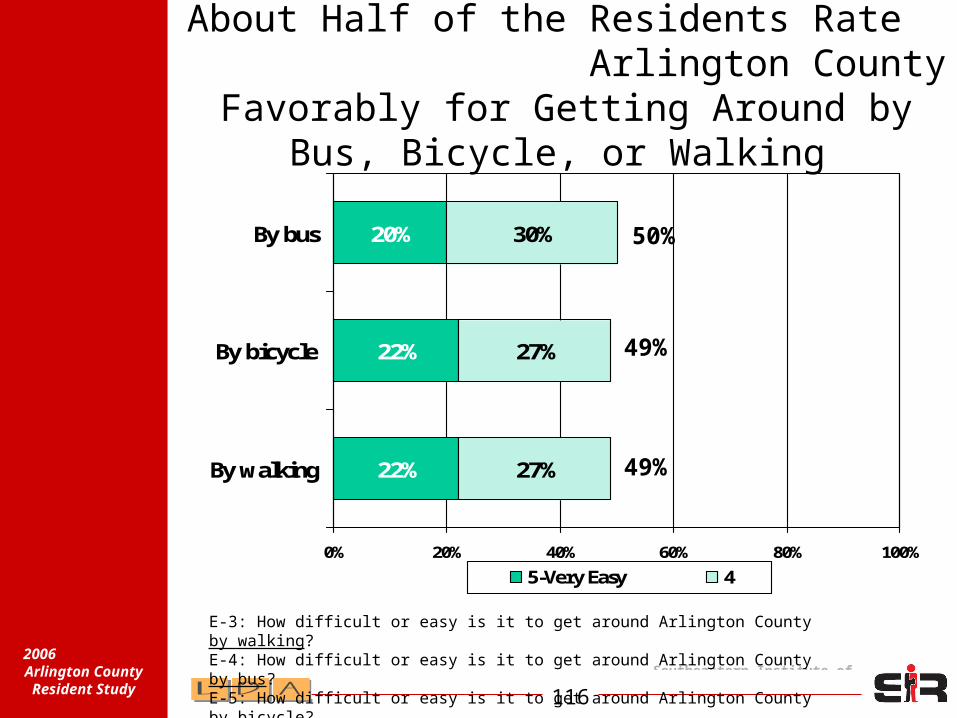
About Half of the Residents Rate Arlington County Favorably for Getting Around by Bus, Bicycle, or
Walking
22%
22%
20%
27%
27%
30%
0% 20% 40% 60% 80% 100%
By walking
By bicycle
By bus
5-Very Easy 4
E-3: How difficult or easy is it to get around Arlington County by walking?E-4: How difficult or easy is it to get around Arlington County by bus?E-5: How difficult or easy is it to get around Arlington County by bicycle?
50%
49%
49%
Southeastern Institute of
Research117
2006 Arlington
County Resident Study
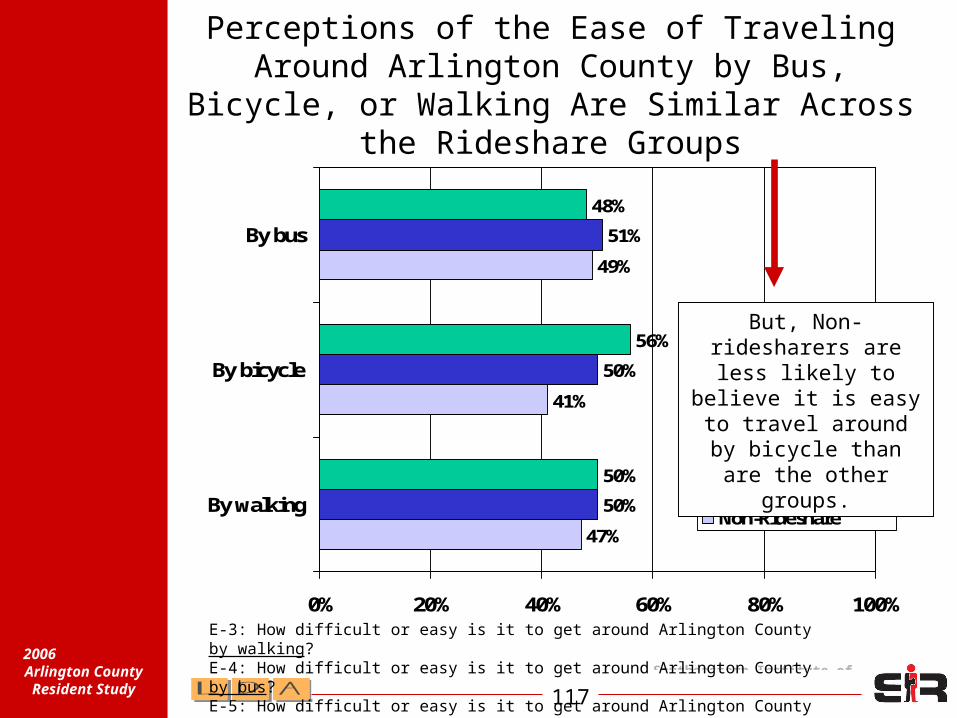
Perceptions of the Ease of Traveling Around Arlington County by Bus, Bicycle, or Walking
Are Similar Across the Rideshare Groups
47%
41%
49%
50%
50%
51%
50%
56%
48%
0% 20% 40% 60% 80% 100%
By walking
By bicycle
By bus
Primary Rideshare
Secondary Rideshare
Non-Rideshare
But, Non-ridesharers are less likely to
believe it is easy to travel around by
bicycle than are the other groups.
E-3: How difficult or easy is it to get around Arlington County by walking?E-4: How difficult or easy is it to get around Arlington County by bus?E-5: How difficult or easy is it to get around Arlington County by bicycle?
Southeastern Institute of
Research118
2006 Arlington
County Resident Study
Key Finding:Both Ridesharers and Non-Ridesharers give favorable ratings to their ability to travel around Arlington County. They believe, however, that it is easier to get around with a car than without. But, those who do not own a car believe that it’s easier to get around without a car than those who do.
Strategic Implication:It will be difficult to convert Non-Ridesharers to an alternative mode of transportation if they perceive that it is difficult to get around without a car. Work on changing this perception - especially among those who own cars. Explore message development around the idea that it is “easy” to get around Arlington County without a car.
Southeastern Institute of
Research119
2006 Arlington
County Resident Study
Key Finding:Residents of Arlington County are less likely to believe it is easy to get around by bus, bicycle, or walking than by car. About half of the residents give Arlington County favorable scores for ease of getting around by bus, bicycle, or walking.
Strategic Implication:The idea of “ease” of traveling about the area by bus, bicycle, or walking has reached about half the residents. Now, focus on the half who have not yet realized the ease of using these alternative modes of transportation. Continue to develop and market programs that support travel by bus, bicycle, and walking. Take advantage of the core of residents who already believe it is easy to travel using these alternative modes of transportation. Explore the extent to which “believers” can be apostles to “non-believers” via testimonials in the communication materials.

Southeastern Institute of
Research120
2006 Arlington
County Resident Study
Accessibility to Bus and
Train Stops
Southeastern Institute of
Research121
2006 Arlington
County Resident Study
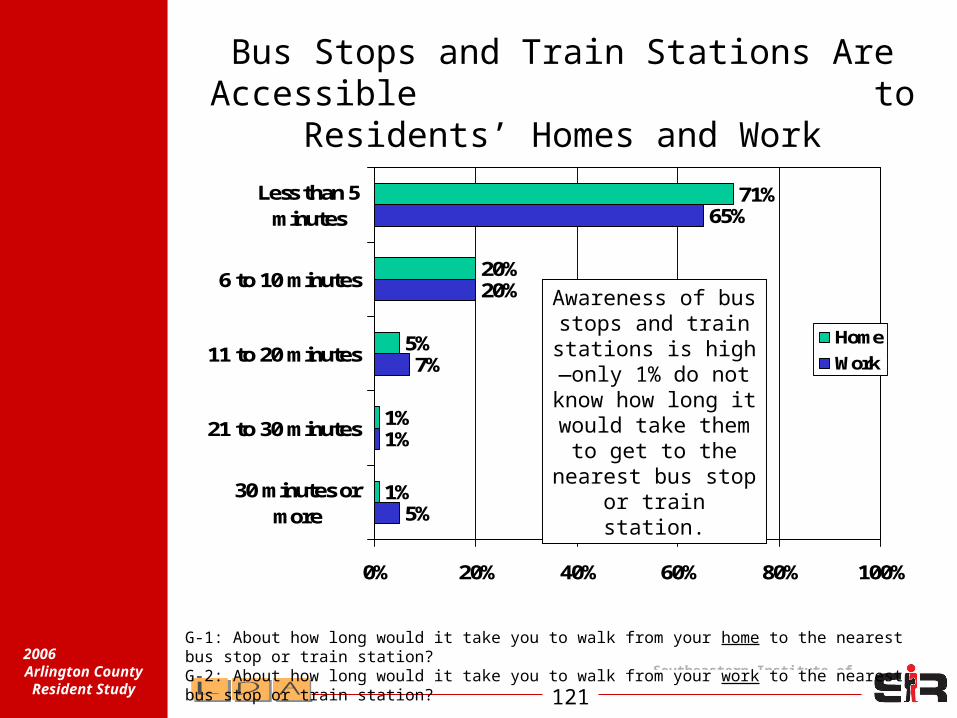
Bus Stops and Train Stations Are Accessible to Residents’ Homes and Work
5%
1%
7%
20%
65%
1%
1%
5%
20%
71%
0% 20% 40% 60% 80% 100%
30 minutes ormore
21 to 30 minutes
11 to 20 minutes
6 to 10 minutes
Less than 5minutes
Home
Work
G-1: About how long would it take you to walk from your home to the nearest bus stop or train station?G-2: About how long would it take you to walk from your work to the nearest bus stop or train station?
Awareness of bus stops and train
stations is high—only 1% do not
know how long it would take them
to get to the nearest bus stop or train station.

Southeastern Institute of
Research122
2006 Arlington
County Resident Study
Communication
Southeastern Institute of
Research123
2006 Arlington
County Resident Study
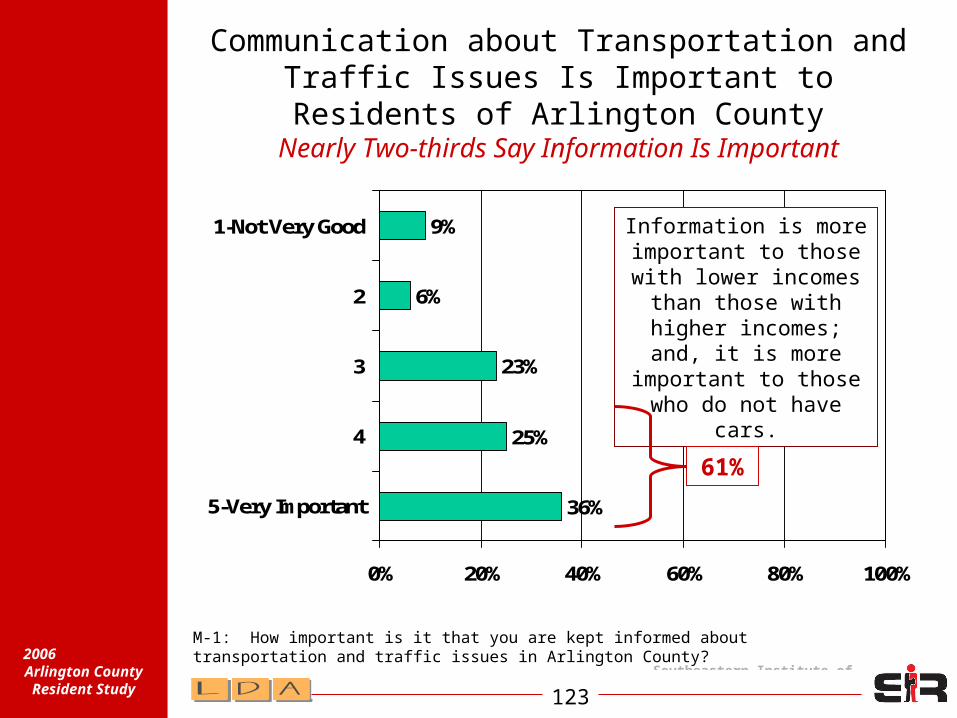
Communication about Transportation and Traffic Issues Is Important to Residents of
Arlington CountyNearly Two-thirds Say Information Is Important
36%
25%
23%
6%
9%
0% 20% 40% 60% 80% 100%
5-Very Important
4
3
2
1-Not Very Good
M-1: How important is it that you are kept informed about transportation and traffic issues in Arlington County?
Information is more important to those with lower incomes
than those with higher incomes; and, it is more important to
those who do not have cars.
61%
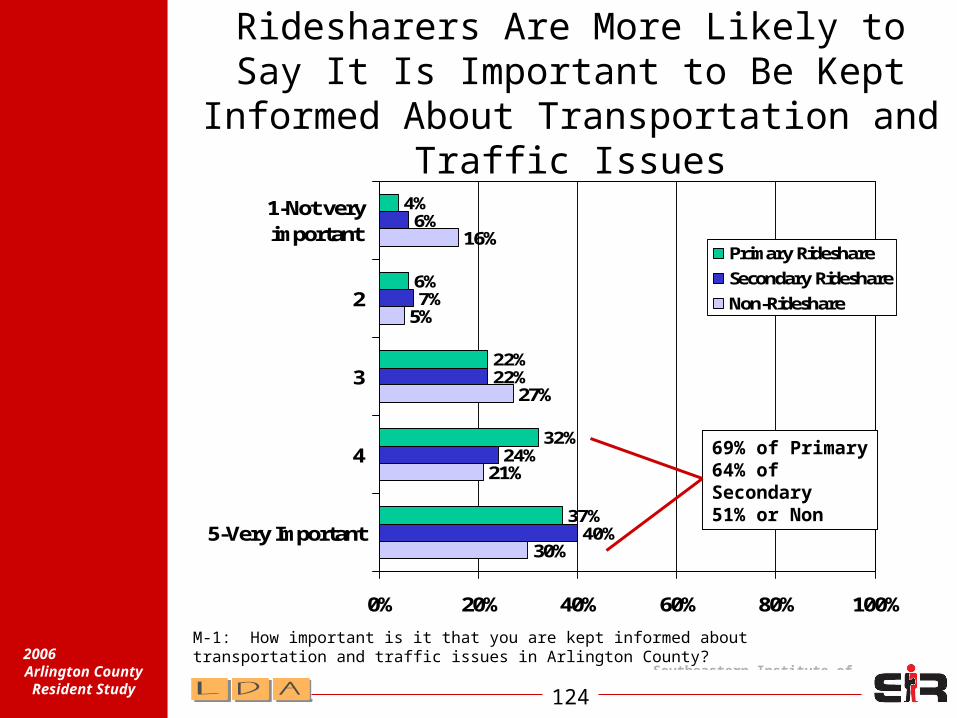
Southeastern Institute of
Research124
2006 Arlington
County Resident Study
Ridesharers Are More Likely to Say It Is Important to Be Kept Informed About
Transportation and Traffic Issues
30%
21%
27%
5%
16%
40%
24%
22%
7%
6%
37%
32%
22%
6%
4%
0% 20% 40% 60% 80% 100%
5-Very Important
4
3
2
1-Not veryimportant
Primary Rideshare
Secondary Rideshare
Non-Rideshare
M-1: How important is it that you are kept informed about transportation and traffic issues in Arlington County?
69% of Primary64% of Secondary51% or Non

Southeastern Institute of
Research125
2006 Arlington
County Resident Study
Communication Is Equally Important to Those Who Are and Are Not Satisfied
with Travel Around Arlington County
33%41%
22%28%
0%
20%
40%
60%
80%
100%
Less than very satisfied with ability to travelaround Arlington County
Very satisfied with ability to travel aroundArlington County
4
5-Very Important
M-1: How important is it that you are kept informed about transportation and traffic issues in Arlington County?
61% 63%
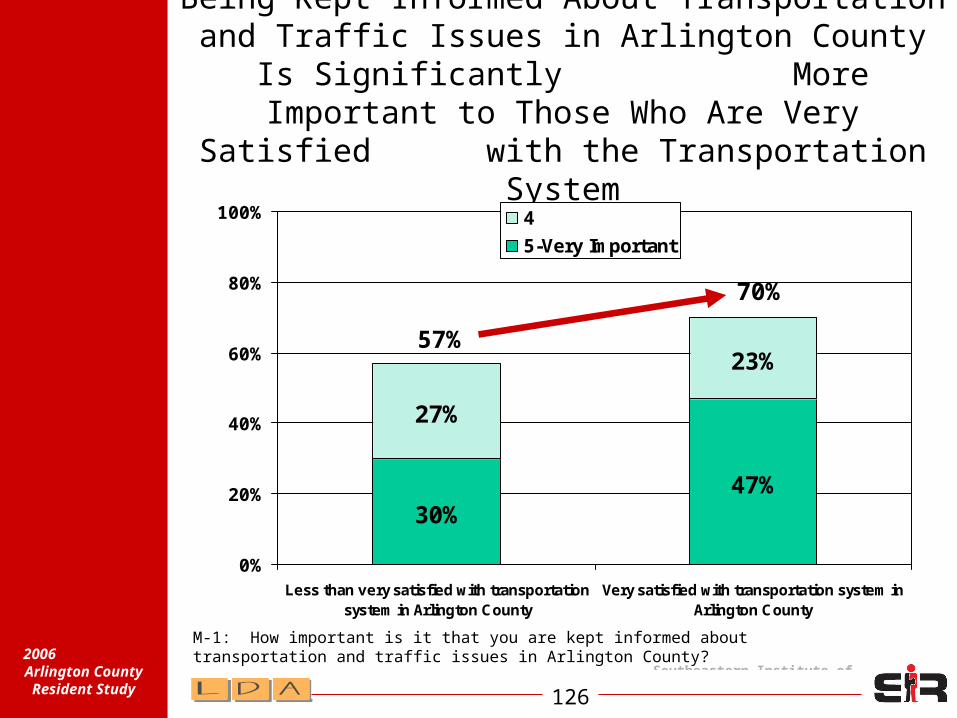
Southeastern Institute of
Research126
2006 Arlington
County Resident Study
Being Kept Informed About Transportation and Traffic Issues in Arlington County Is
Significantly More Important to Those Who Are Very Satisfied with the
Transportation System
30%47%
23%
27%
0%
20%
40%
60%
80%
100%
Less than very satisfied with transportationsystem in Arlington County
Very satisfied with transportation system inArlington County
4
5-Very Important
M-1: How important is it that you are kept informed about transportation and traffic issues in Arlington County?
57%
70%
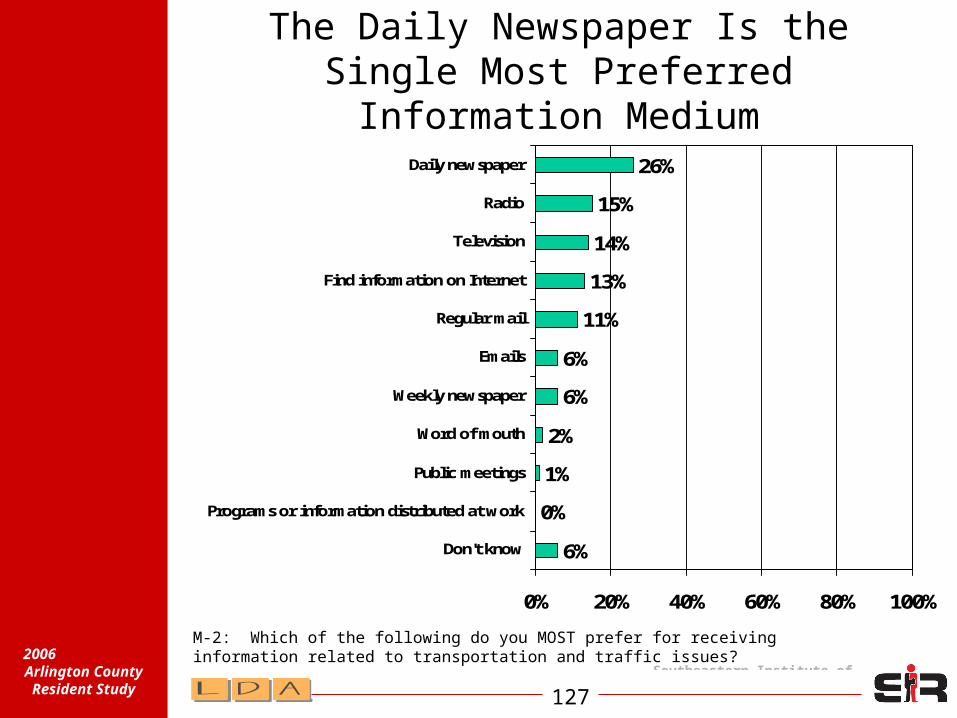
Southeastern Institute of
Research127
2006 Arlington
County Resident Study
The Daily Newspaper Is the Single Most Preferred Information Medium
6%
0%
1%
2%
6%
6%
11%
13%
14%
15%
26%
0% 20% 40% 60% 80% 100%
Don't know
Programs or information distributed at work
Public meetings
Word of mouth
Weekly newspaper
Emails
Regular mail
Find information on Internet
Television
Radio
Daily newspaper
M-2: Which of the following do you MOST prefer for receiving information related to transportation and traffic issues?

Southeastern Institute of
Research128
2006 Arlington
County Resident Study
There Is Little Variation in Preferred Medium Across
Rideshare Modes
7%
0%
0%
2%
6%
3%
13%
11%
17%
16%
25%
4%
0%
1%
1%
6%
9%
10%
12%
14%
16%
27%
6%
1%
0%
3%
5%
6%
10%
18%
12%
12%
27%
0% 20% 40% 60% 80% 100%
Don't know
Programs or information distributed at work
Public meetings
Word of mouth
Weekly newspaper
Emails
Regular mail
Find information on Internet
Television
Radio
Daily newspaper
Primary Rideshare
Secondary Rideshare
Non-Rideshare
M-2: Which of the following do you MOST prefer for receiving information related to transportation and traffic issues?
Southeastern Institute of
Research129
2006 Arlington
County Resident Study
Preferred Source of Information Varies Across Demographic
Groups• Older residents (50 and over) are more likely to
prefer the daily paper. Younger residents (under 35) are more likely to prefer the Internet.
• While all education levels prefer the daily newspaper, those with a high school or less education are more likely to prefer television. Higher levels of education are more likely to prefer the radio and the Internet.
• Lower income levels (under $60,000) are more likely to prefer television than are those with higher income levels who more often prefer the Internet or email.
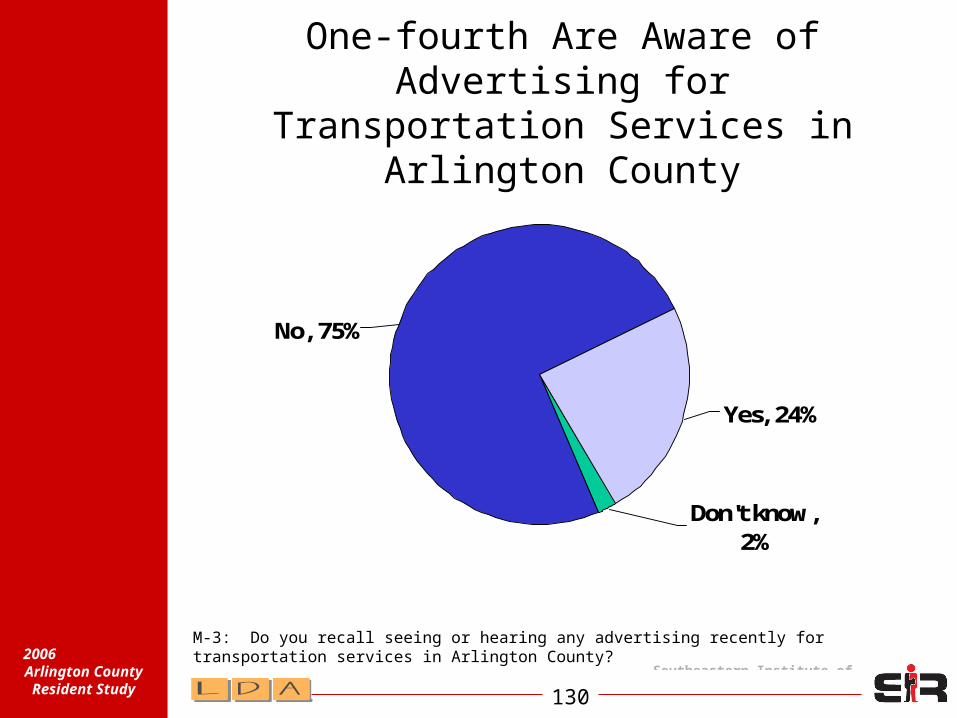
Southeastern Institute of
Research130
2006 Arlington
County Resident Study
One-fourth Are Aware of Advertising for Transportation Services in Arlington County
Don't know, 2%
Yes, 24%
No, 75%
M-3: Do you recall seeing or hearing any advertising recently for transportation services in Arlington County?
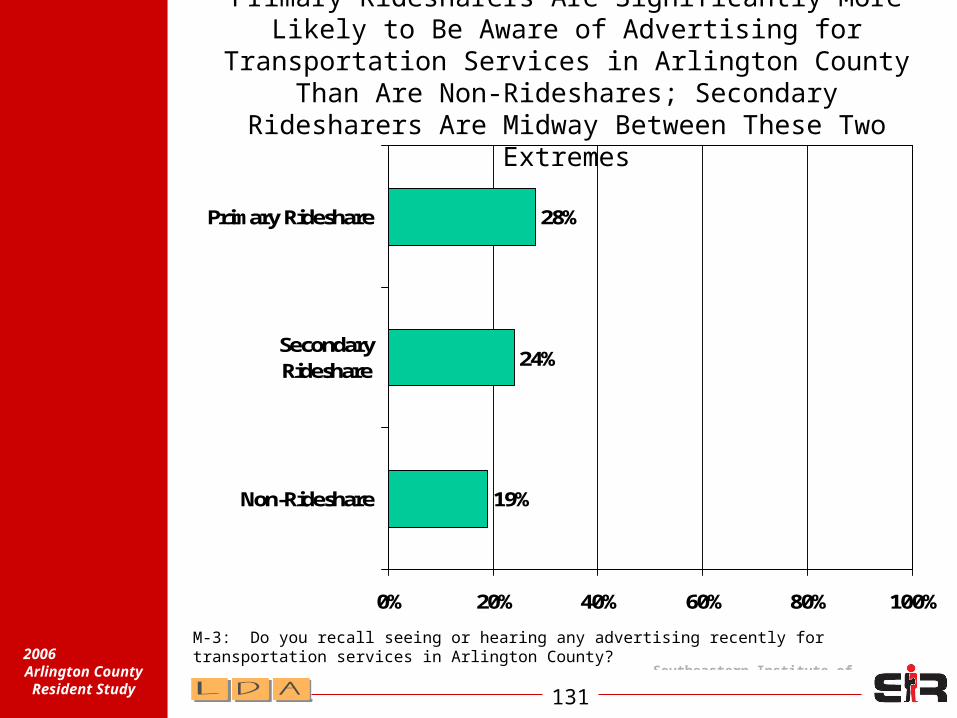
Southeastern Institute of
Research131
2006 Arlington
County Resident Study
Primary Ridesharers Are Significantly More Likely to Be Aware of Advertising for Transportation Services in Arlington County Than Are Non-Rideshares; Secondary
Ridesharers Are Midway Between These Two Extremes
19%
24%
28%
0% 20% 40% 60% 80% 100%
Non-Rideshare
SecondaryRideshare
Primary Rideshare
M-3: Do you recall seeing or hearing any advertising recently for transportation services in Arlington County?
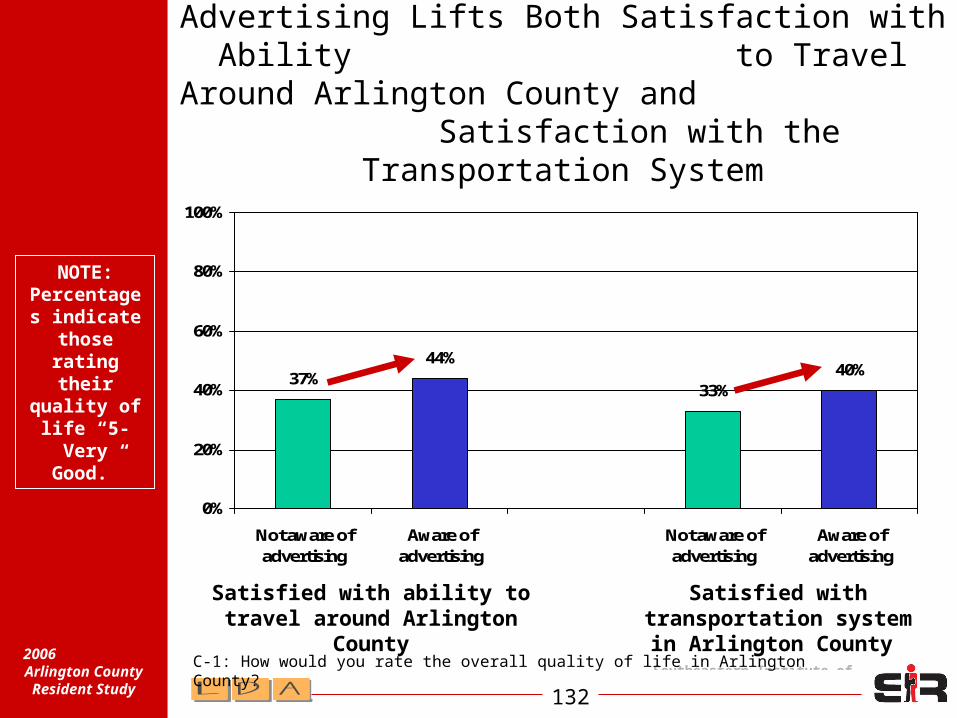
Southeastern Institute of
Research132
2006 Arlington
County Resident Study
Advertising Lifts Both Satisfaction with Ability to Travel Around Arlington County and
Satisfaction with the Transportation System
37%44%
33%40%
0%
20%
40%
60%
80%
100%
Not aware ofadvertising
Aware ofadvertising
Not aware ofadvertising
Aware ofadvertising
C-1: How would you rate the overall quality of life in Arlington County?
Satisfied with ability to travel around Arlington
County
Satisfied with transportation system in Arlington County
NOTE: Percentages indicate
those rating their
quality of life “5-Very
Good.”
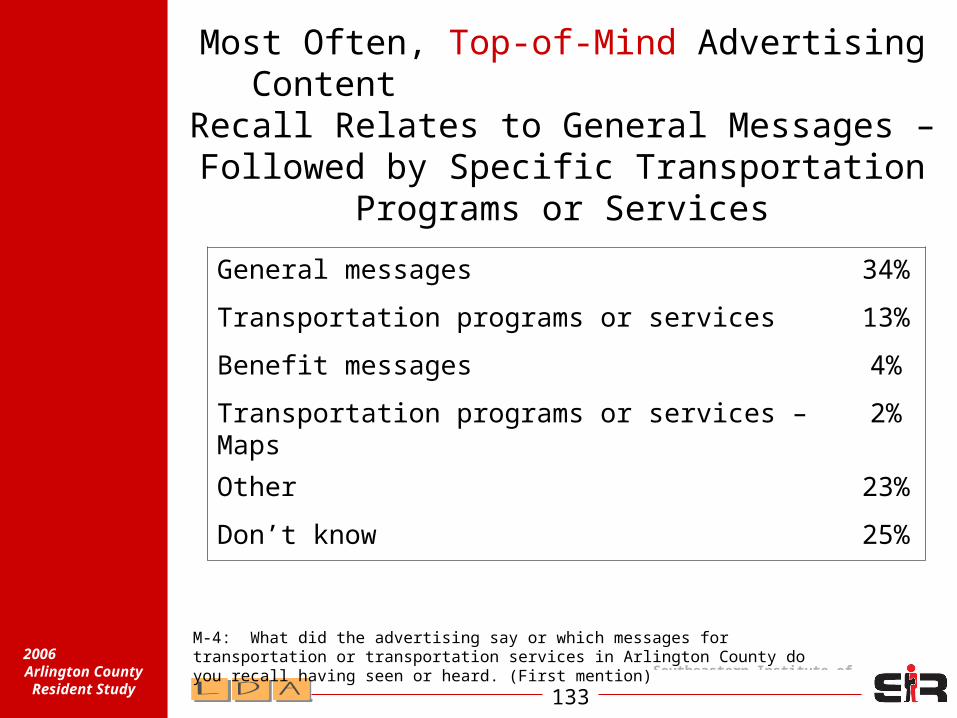
Southeastern Institute of
Research133
2006 Arlington
County Resident Study
Most Often, Top-of-Mind Advertising Content Recall Relates to General Messages – Followed by Specific
Transportation Programs or Services
General messages 34%
Transportation programs or services 13%
Benefit messages 4%
Transportation programs or services – Maps 2%
Other 23%
Don’t know 25%
M-4: What did the advertising say or which messages for transportation or transportation services in Arlington County do you recall having seen or heard. (First mention)

Southeastern Institute of
Research134
2006 Arlington
County Resident Study
Considering Total Mentions, Many Don’t Recall the Content of the
Message They Have Seen or Heard
General messages 42%
Transportation programs or services II 16%
Benefit messages 4%
Transportation programs or services I – Maps 8%
Other 33%
Don’t know 73%
M-4: What did the advertising say or which messages for transportation or transportation services in Arlington County do you recall having seen or heard? (First mention) Probe: Any other advertising? What did the advertising say or which messages for transportation or transportation services in Arlington County do you recall having seen or heard?
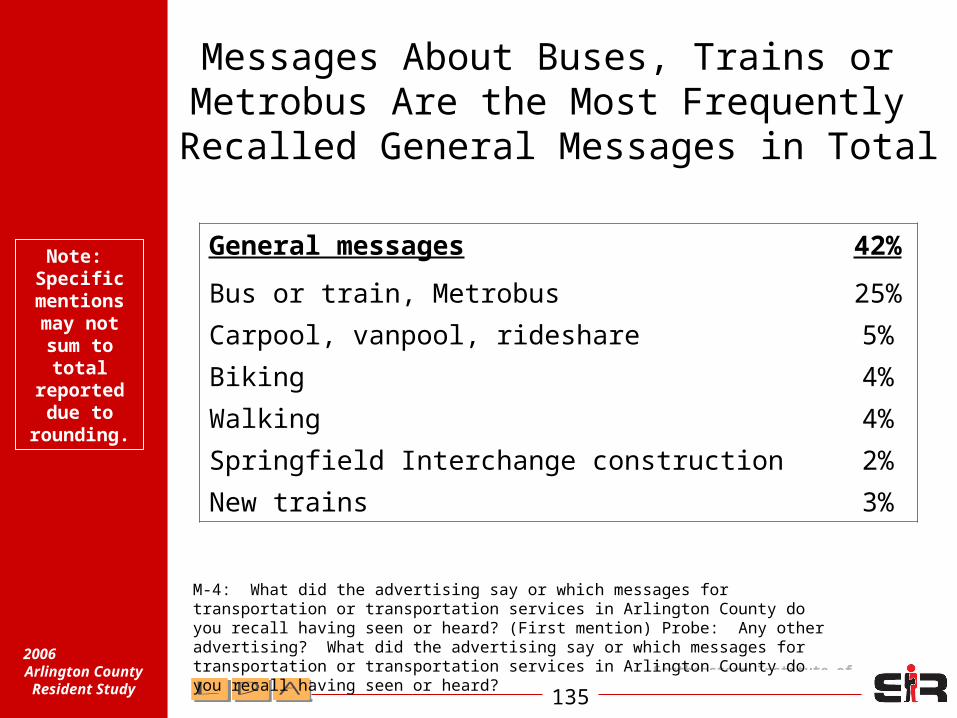
Southeastern Institute of
Research135
2006 Arlington
County Resident Study
Messages About Buses, Trains or Metrobus Are the Most Frequently Recalled General Messages in Total
General messages 42%
Bus or train, Metrobus 25%
Carpool, vanpool, rideshare 5%
Biking 4%
Walking 4%
Springfield Interchange construction 2%
New trains 3%
M-4: What did the advertising say or which messages for transportation or transportation services in Arlington County do you recall having seen or heard? (First mention) Probe: Any other advertising? What did the advertising say or which messages for transportation or transportation services in Arlington County do you recall having seen or heard?
Note: Specific
mentions may not sum to total
reported due to
rounding.
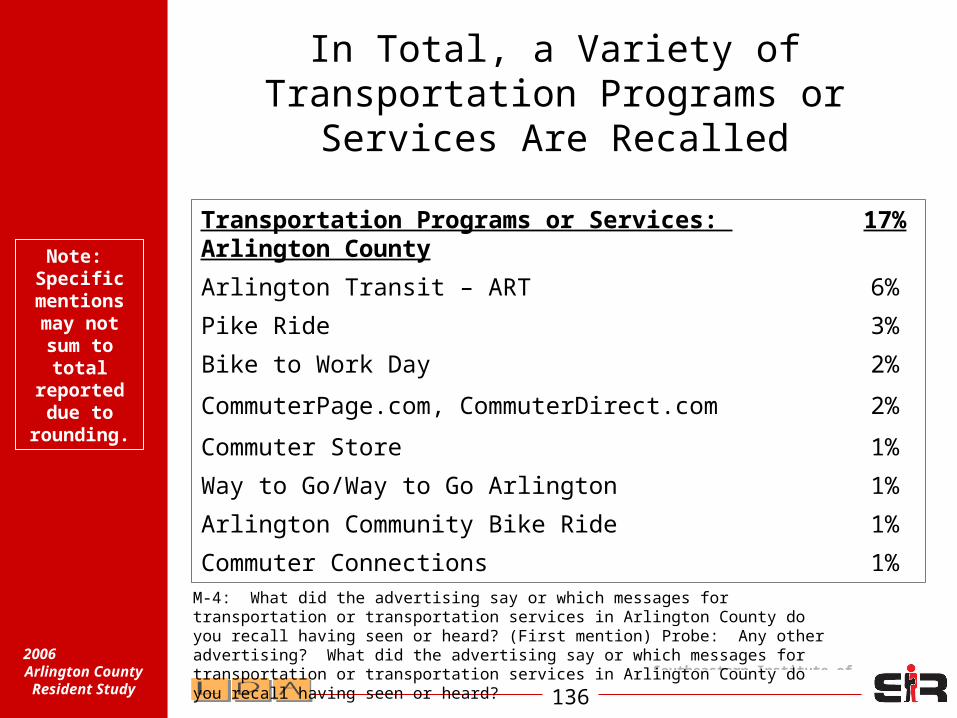
Southeastern Institute of
Research136
2006 Arlington
County Resident Study
In Total, a Variety of Transportation Programs or Services Are Recalled
Transportation Programs or Services: Arlington County
17%
Arlington Transit – ART 6%
Pike Ride 3%
Bike to Work Day 2%
CommuterPage.com, CommuterDirect.com 2%
Commuter Store 1%
Way to Go/Way to Go Arlington 1%
Arlington Community Bike Ride 1%
Commuter Connections 1%
M-4: What did the advertising say or which messages for transportation or transportation services in Arlington County do you recall having seen or heard? (First mention) Probe: Any other advertising? What did the advertising say or which messages for transportation or transportation services in Arlington County do you recall having seen or heard?
Note: Specific
mentions may not sum to total
reported due to
rounding.
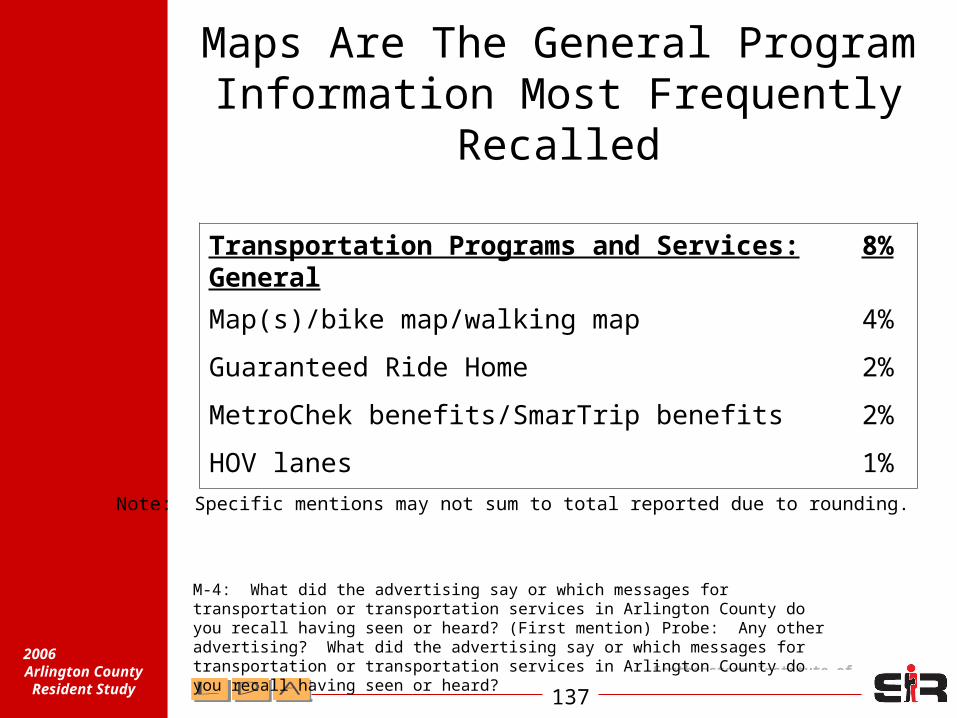
Southeastern Institute of
Research137
2006 Arlington
County Resident Study
Maps Are The General Program Information Most Frequently
Recalled
Transportation Programs and Services: General
8%
Map(s)/bike map/walking map 4%
Guaranteed Ride Home 2%
MetroChek benefits/SmarTrip benefits 2%
HOV lanes 1%
M-4: What did the advertising say or which messages for transportation or transportation services in Arlington County do you recall having seen or heard? (First mention) Probe: Any other advertising? What did the advertising say or which messages for transportation or transportation services in Arlington County do you recall having seen or heard?
Note: Specific mentions may not sum to total reported due to rounding.
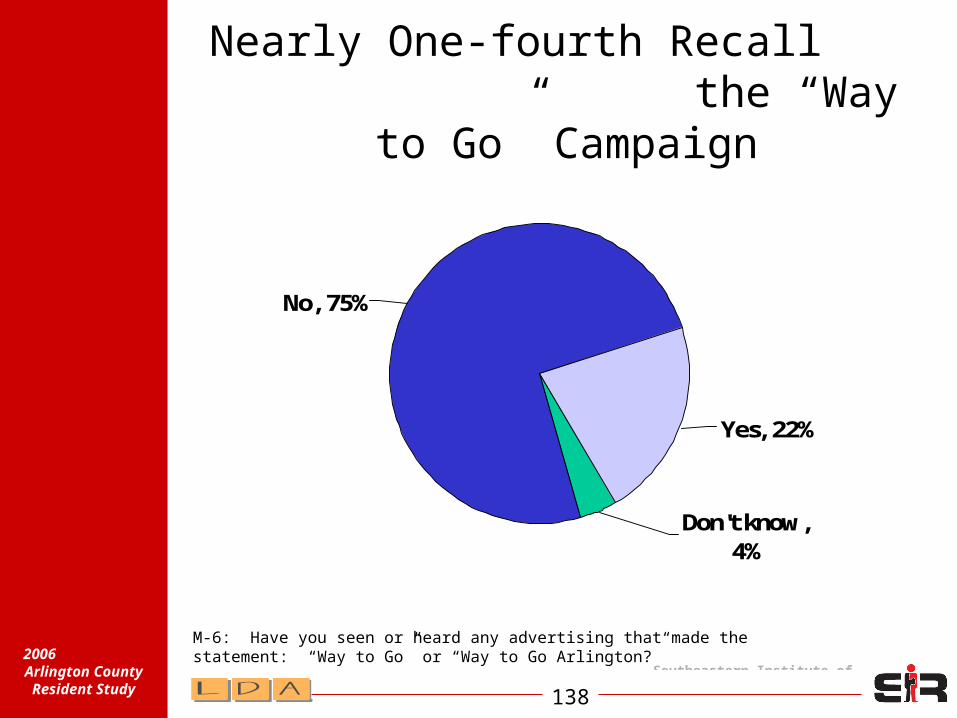
Southeastern Institute of
Research138
2006 Arlington
County Resident Study
Nearly One-fourth Recall the “Way to Go” Campaign
Don't know, 4%
Yes, 22%
No, 75%
M-6: Have you seen or heard any advertising that made the statement: “Way to Go” or “Way to Go Arlington?”
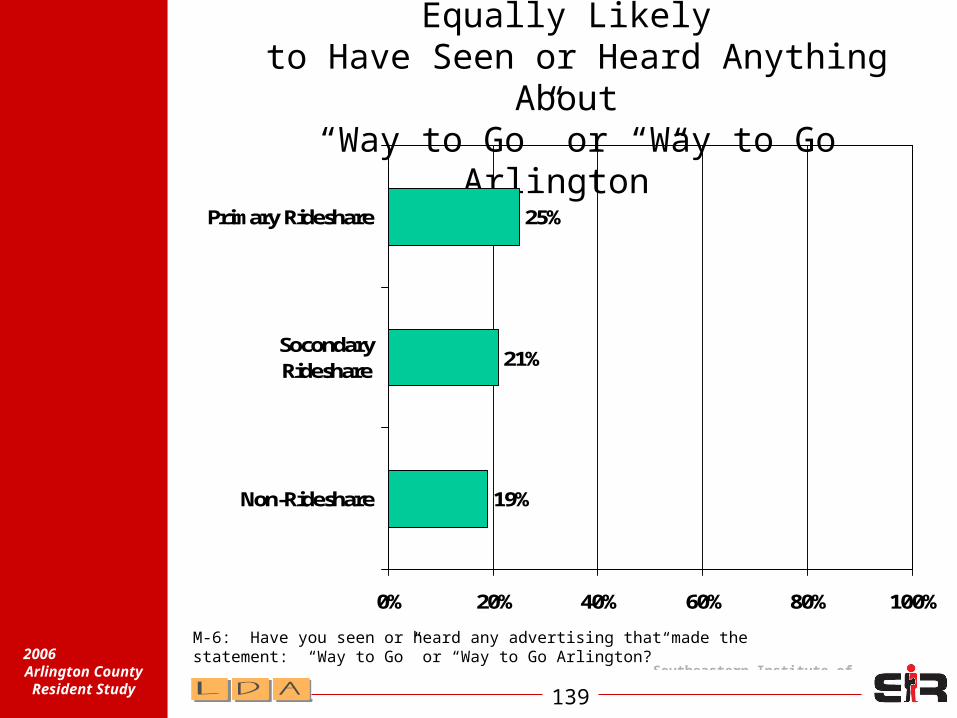
Southeastern Institute of
Research139
2006 Arlington
County Resident Study
All Three Rideshare Groups Are Equally Likely
to Have Seen or Heard Anything About “Way to Go” or “Way to Go Arlington”
19%
21%
25%
0% 20% 40% 60% 80% 100%
Non-Rideshare
SocondaryRideshare
Primary Rideshare
M-6: Have you seen or heard any advertising that made the statement: “Way to Go” or “Way to Go Arlington?”
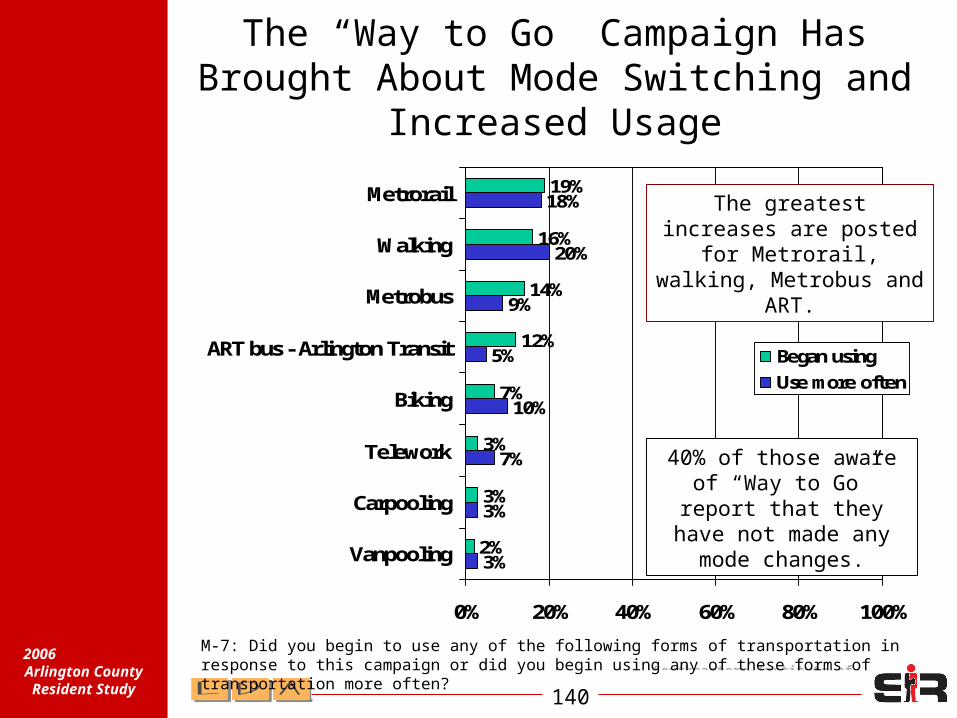
Southeastern Institute of
Research140
2006 Arlington
County Resident Study
The “Way to Go” Campaign Has Brought About Mode Switching and
Increased Usage
3%
3%
7%
10%
5%
9%
20%
18%
2%
3%
3%
7%
12%
14%
16%
19%
0% 20% 40% 60% 80% 100%
Vanpooling
Carpooling
Telework
Biking
ART bus - Arlington Transit
Metrobus
Walking
Metrorail
Began using
Use more often
M-7: Did you begin to use any of the following forms of transportation in response to this campaign or did you begin using any of these forms of transportation more often?
The greatest increases are posted for Metrorail, walking, Metrobus and
ART.
40% of those aware of “Way to Go” report that they have not made any mode
changes.

Southeastern Institute of
Research141
2006 Arlington
County Resident Study
Hispanics
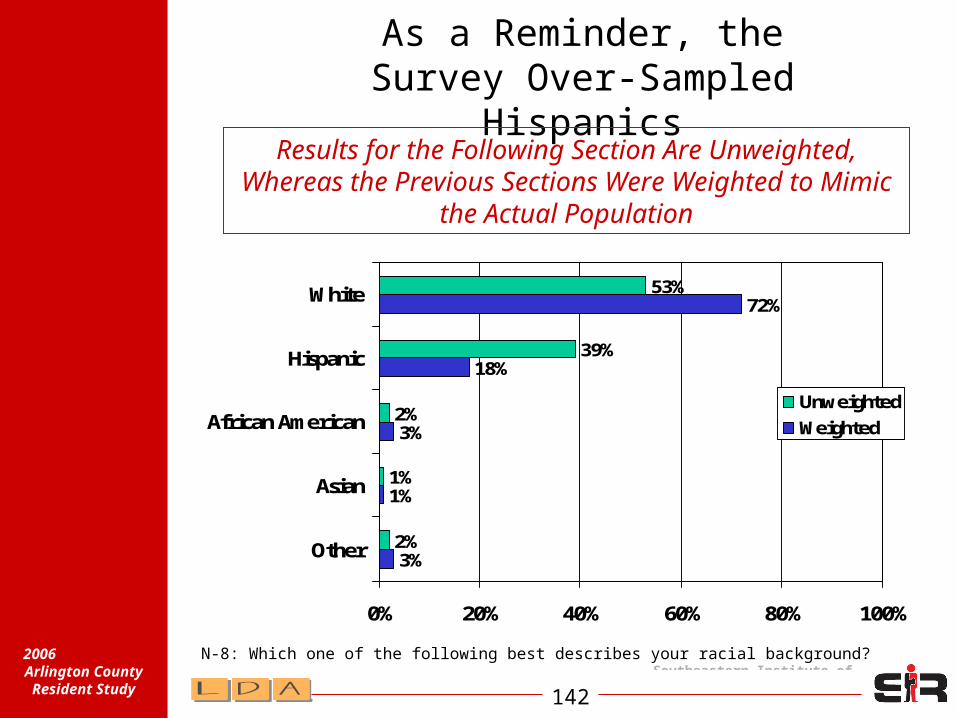
Southeastern Institute of
Research142
2006 Arlington
County Resident Study
As a Reminder, the Survey Over-Sampled Hispanics
3%
1%
3%
18%
72%
2%
1%
2%
39%
53%
0% 20% 40% 60% 80% 100%
Other
Asian
African American
Hispanic
White
Unweighted
Weighted
N-8: Which one of the following best describes your racial background?
Results for the Following Section Are Unweighted, Whereas the Previous Sections Were Weighted to
Mimic the Actual Population
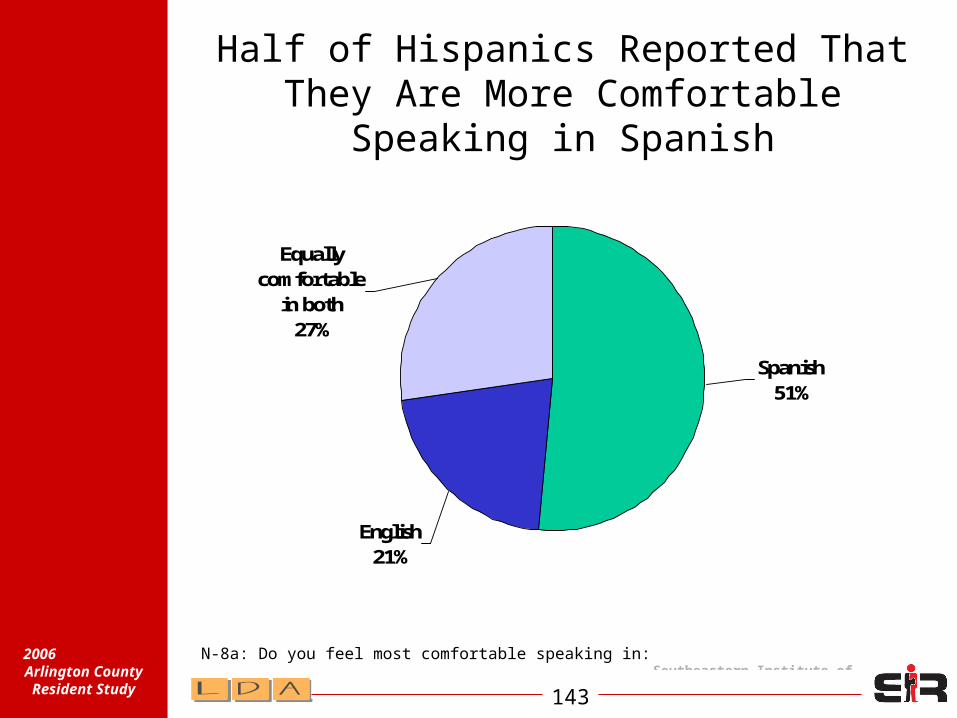
Southeastern Institute of
Research143
2006 Arlington
County Resident Study
Half of Hispanics Reported That They Are More Comfortable Speaking in
Spanish
N-8a: Do you feel most comfortable speaking in:
Equally comfortable
in both27%
English21%
Spanish51%
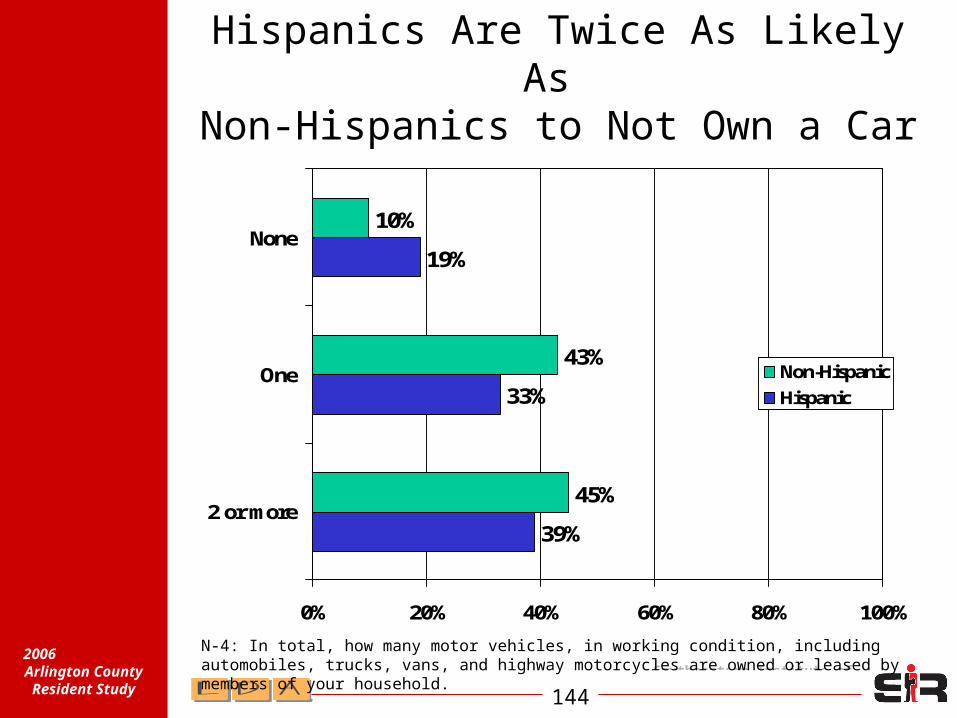
Southeastern Institute of
Research144
2006 Arlington
County Resident Study
Hispanics Are Twice As Likely As Non-Hispanics to Not Own a Car
39%
33%
19%
45%
43%
10%
0% 20% 40% 60% 80% 100%
2 or more
One
None
Non-Hispanic
Hispanic
N-4: In total, how many motor vehicles, in working condition, including automobiles, trucks, vans, and highway motorcycles are owned or leased by members of your household.
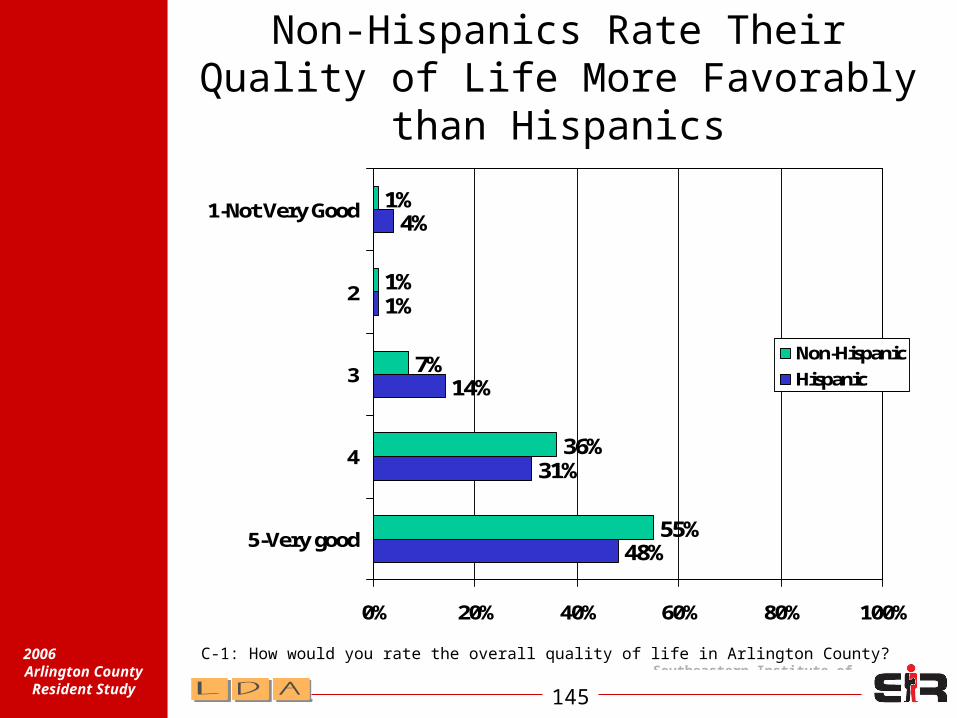
Southeastern Institute of
Research145
2006 Arlington
County Resident Study
Non-Hispanics Rate Their Quality of Life More Favorably than Hispanics
48%
31%
14%
1%
4%
55%
36%
7%
1%
1%
0% 20% 40% 60% 80% 100%
5-Very good
4
3
2
1-Not Very Good
Non-Hispanic
Hispanic
C-1: How would you rate the overall quality of life in Arlington County?
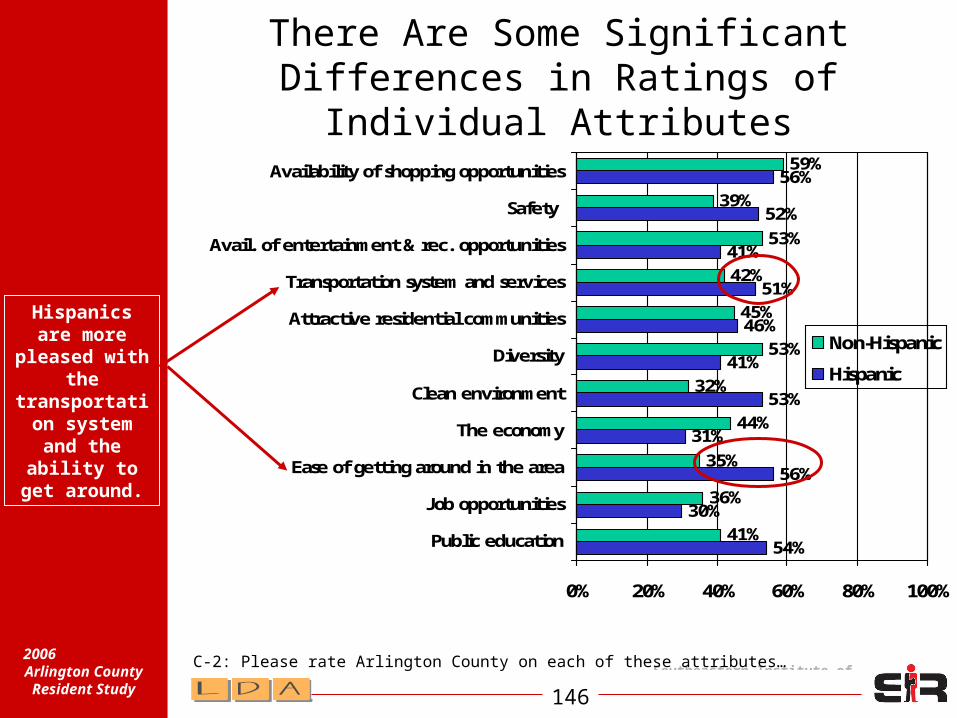
Southeastern Institute of
Research146
2006 Arlington
County Resident Study
There Are Some Significant Differences in Ratings of Individual
Attributes
54%
30%
56%
31%
53%
41%
46%
51%
41%
52%
56%
41%
36%
35%
44%
32%
53%
45%
42%
53%
39%
59%
0% 20% 40% 60% 80% 100%
Public education
Job opportunities
Ease of getting around in the area
The economy
Clean environment
Diversity
Attractive residential communities
Transportation system and services
Avail. of entertainment & rec. opportunities
Safety
Availability of shopping opportunities
Non-Hispanic
Hispanic
C-2: Please rate Arlington County on each of these attributes…
Hispanics are more
pleased with the
transportation system
and the ability to get
around.
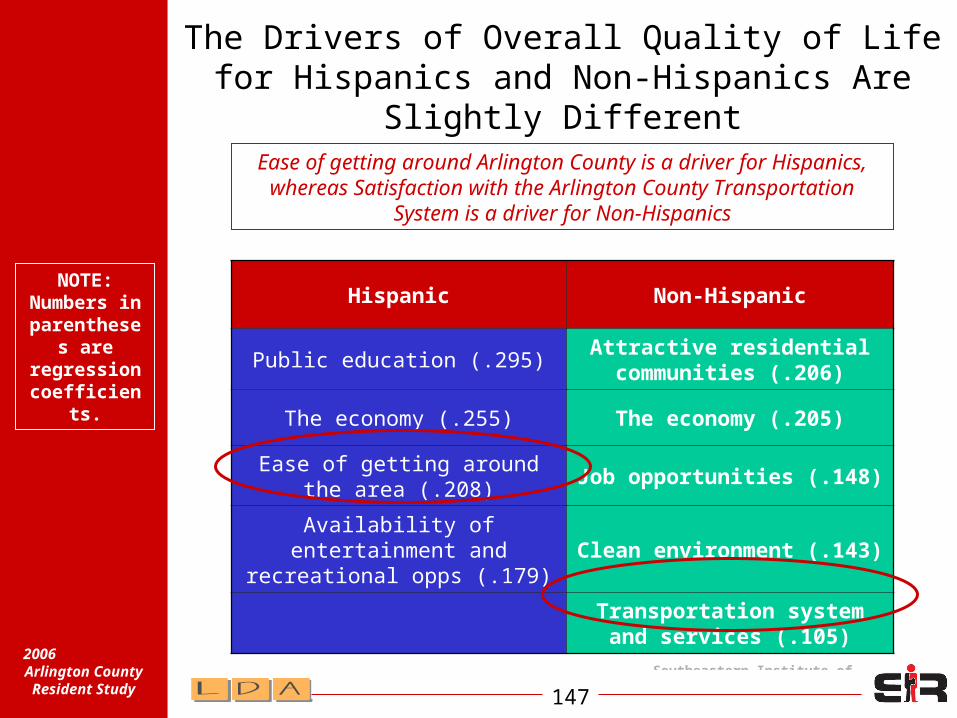
Southeastern Institute of
Research147
2006 Arlington
County Resident Study
The Drivers of Overall Quality of Life for Hispanics and Non-Hispanics Are Slightly
Different
Hispanic Non-Hispanic
Public education (.295)Attractive residential communities (.206)
The economy (.255) The economy (.205)
Ease of getting around the area (.208)
Job opportunities (.148)
Availability of entertainment and recreational opps (.179)
Clean environment (.143)
Transportation system and services (.105)
Ease of getting around Arlington County is a driver for Hispanics, whereas Satisfaction with the Arlington County
Transportation System is a driver for Non-Hispanics
NOTE: Numbers
in parenthese
s are regression coefficient
s.
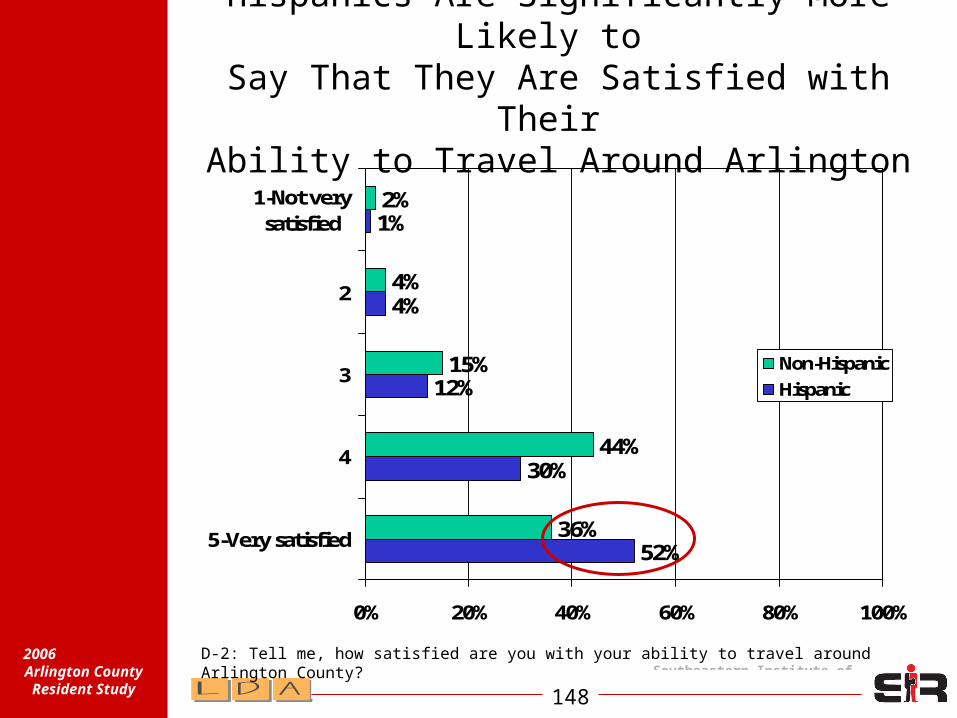
Southeastern Institute of
Research148
2006 Arlington
County Resident Study
Hispanics Are Significantly More Likely to Say That They Are Satisfied with Their
Ability to Travel Around Arlington
52%
30%
12%
4%
1%
36%
44%
15%
4%
2%
0% 20% 40% 60% 80% 100%
5-Very satisfied
4
3
2
1-Not verysatisfied
Non-Hispanic
Hispanic
D-2: Tell me, how satisfied are you with your ability to travel around Arlington County?
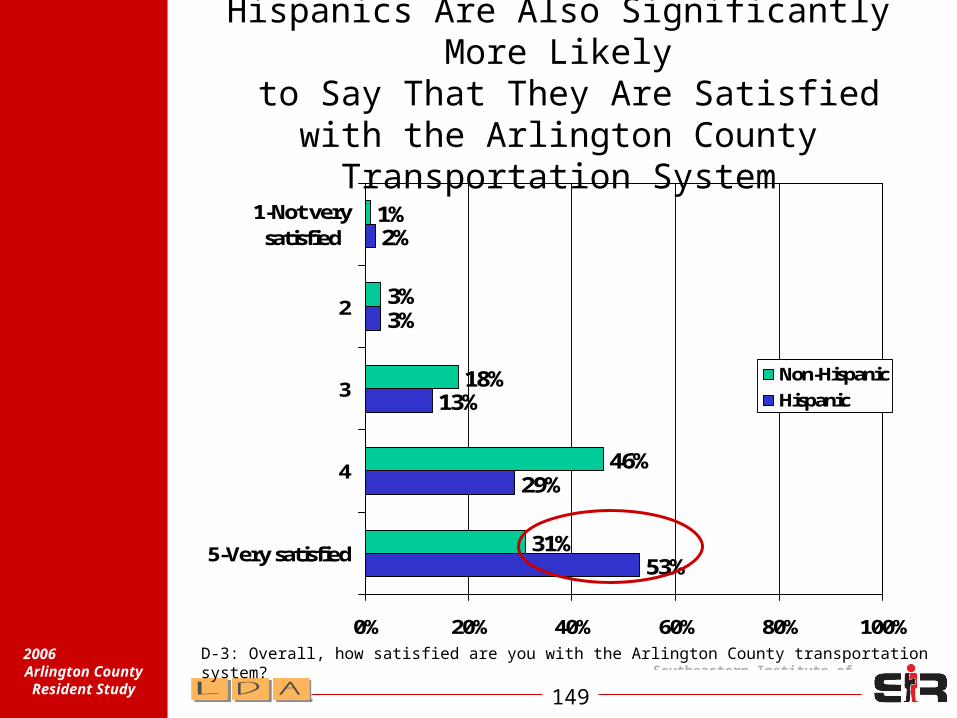
Southeastern Institute of
Research149
2006 Arlington
County Resident Study
Hispanics Are Also Significantly More Likely
to Say That They Are Satisfied with the Arlington County Transportation System
53%
29%
13%
3%
2%
31%
46%
18%
3%
1%
0% 20% 40% 60% 80% 100%
5-Very satisfied
4
3
2
1-Not verysatisfied
Non-Hispanic
Hispanic
D-3: Overall, how satisfied are you with the Arlington County transportation system?
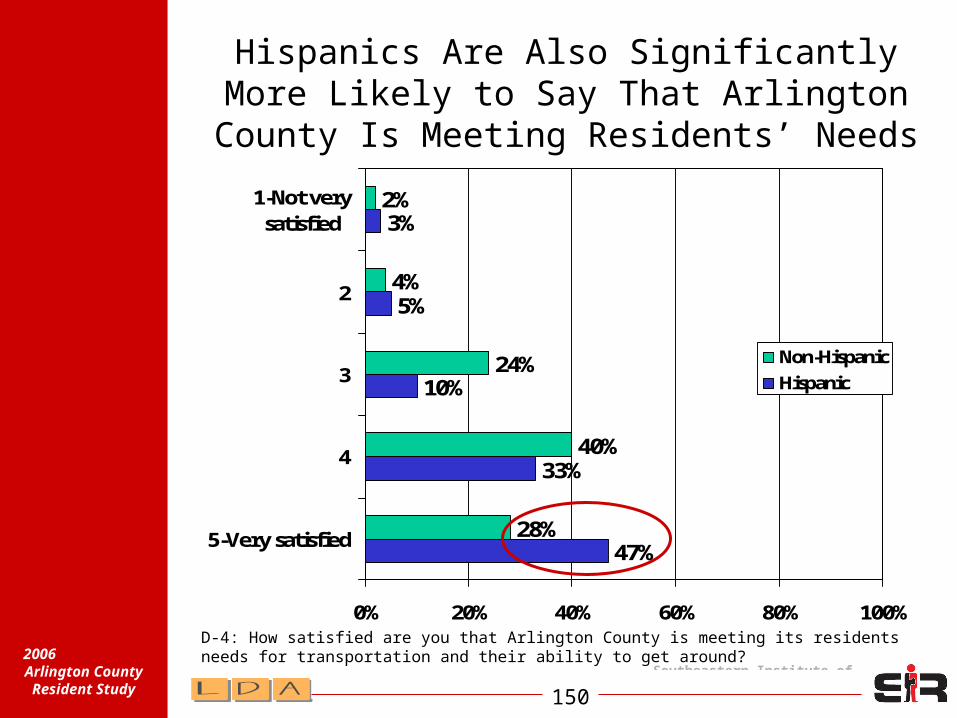
Southeastern Institute of
Research150
2006 Arlington
County Resident Study
Hispanics Are Also Significantly More Likely to Say That Arlington County Is
Meeting Residents’ Needs
47%
33%
10%
5%
3%
28%
40%
24%
4%
2%
0% 20% 40% 60% 80% 100%
5-Very satisfied
4
3
2
1-Not verysatisfied
Non-Hispanic
Hispanic
D-4: How satisfied are you that Arlington County is meeting its residents needs for transportation and their ability to get around?
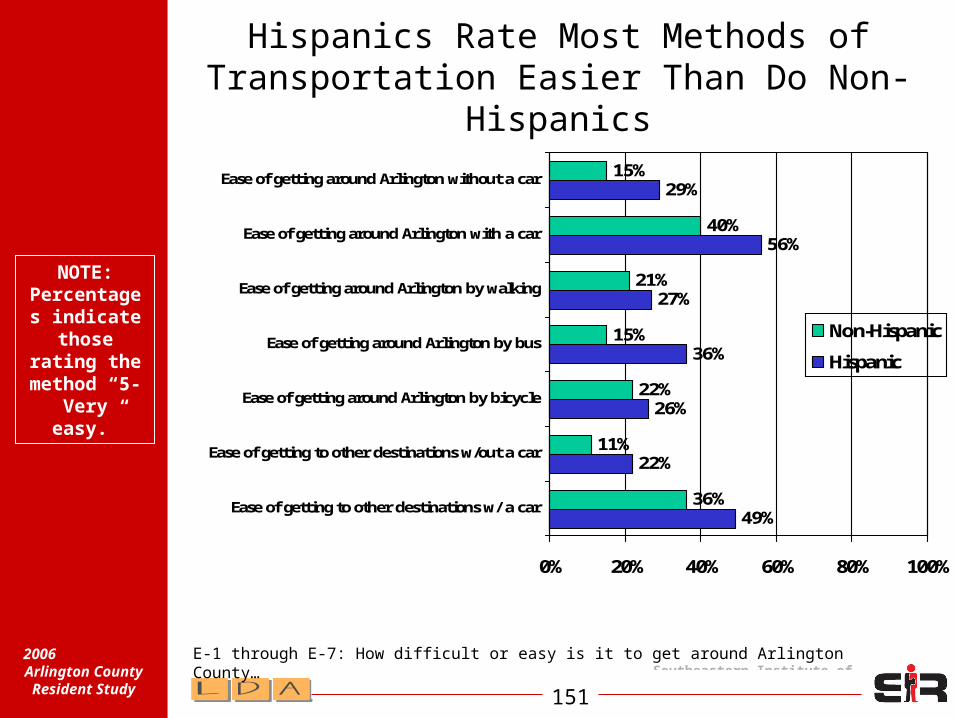
Southeastern Institute of
Research151
2006 Arlington
County Resident Study
Hispanics Rate Most Methods of Transportation Easier Than Do Non-
Hispanics
49%
22%
26%
36%
27%
56%
29%
36%
11%
22%
15%
21%
40%
15%
0% 20% 40% 60% 80% 100%
Ease of getting to other destinations w/ a car
Ease of getting to other destinations w/out a car
Ease of getting around Arlington by bicycle
Ease of getting around Arlington by bus
Ease of getting around Arlington by walking
Ease of getting around Arlington with a car
Ease of getting around Arlington without a car
Non-Hispanic
Hispanic
E-1 through E-7: How difficult or easy is it to get around Arlington County…
NOTE: Percentages indicate
those rating the
method “5-Very
easy.”
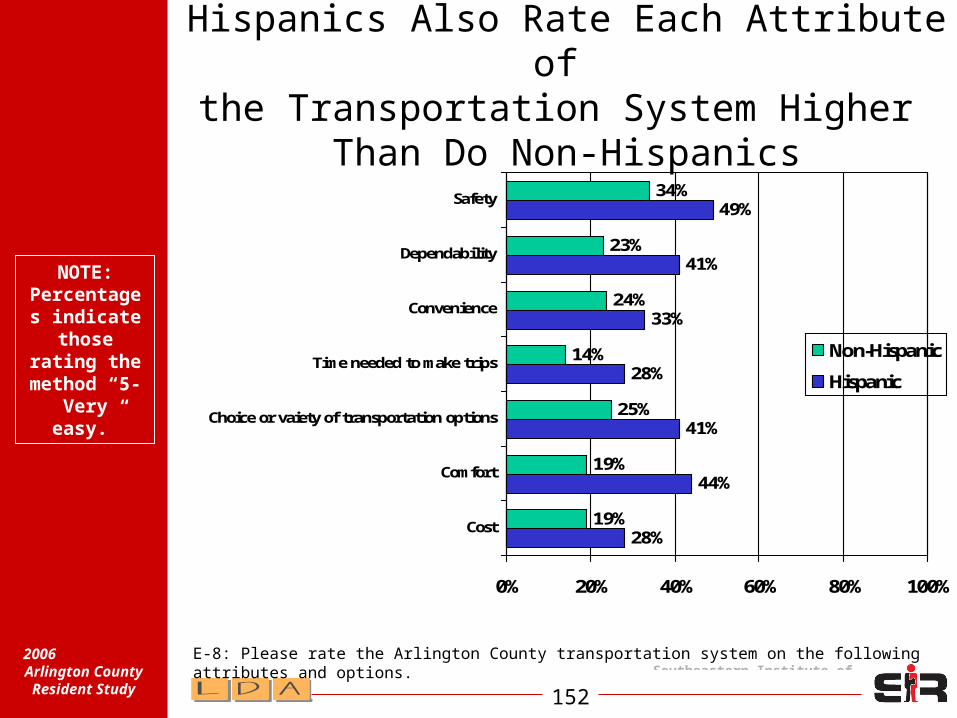
Southeastern Institute of
Research152
2006 Arlington
County Resident Study
Hispanics Also Rate Each Attribute of the Transportation System Higher
Than Do Non-Hispanics
28%
44%
41%
28%
33%
41%
49%
19%
19%
25%
14%
24%
23%
34%
0% 20% 40% 60% 80% 100%
Cost
Comfort
Choice or vaiety of transportation options
Time needed to make trips
Convenience
Dependability
Safety
Non-Hispanic
Hispanic
E-8: Please rate the Arlington County transportation system on the following attributes and options.
NOTE: Percentages indicate
those rating the
method “5-Very
easy.”

Southeastern Institute of
Research153
2006 Arlington
County Resident Study
Many Attributes Are Also More Important for Hispanics
25%
41%
39%
34%
46%
49%
46%
44%
61%
47%
51%
54%
68%
19%
17%
26%
25%
24%
22%
31%
37%
42%
41%
52%
44%
58%
0% 20% 40% 60% 80% 100%
Ease of getting around Arlington by bicycle
Ease of getting around Arlington by bus
Ease of getting around Arlington without a car
Ease of getting around Arlington by walking
Cost
Comfort
Choice or vaiety of transportation options
Time needed to make trips
Ease of getting around Arlington with a car
Convenience
Dependability
Ease of getting around Arlington overall
Safety
Non-Hispanic
Hispanic
F-1 through F-13: Now, we’d like to know how important some attributes and options in a transportation system are to you.
NOTE: Percentages indicate
those rating the
method “5-Very
easy.”

Southeastern Institute of
Research154
2006 Arlington
County Resident Study
The Top Few Drivers of Satisfaction with Transportation System Are the Same for Both
Hispanics and Non-Hispanics
Hispanic Non-Hispanic
Ability to travel around Arlington (.401)
Ability to travel around Arlington (.356)
Ease of getting around Arlington by bus (.166)
Ease of getting around Arlington by bus (.168)
Choice/variety of transportation options (.164)
Choice/variety of transportation options
(.157)
Ease of getting around without
a car (.097)Safety (.157)
Convenience (.151)
Ease of getting around without a car is also a driver for Hispanics; Safety and Convenience are
also drivers for Non-Hispanics.
Recall, Hispanics are much less likely to own a
car.
NOTE: Numbers
in parenthese
s are regression coefficient
s.

Southeastern Institute of
Research155
2006 Arlington
County Resident Study
Key Take-A-Ways
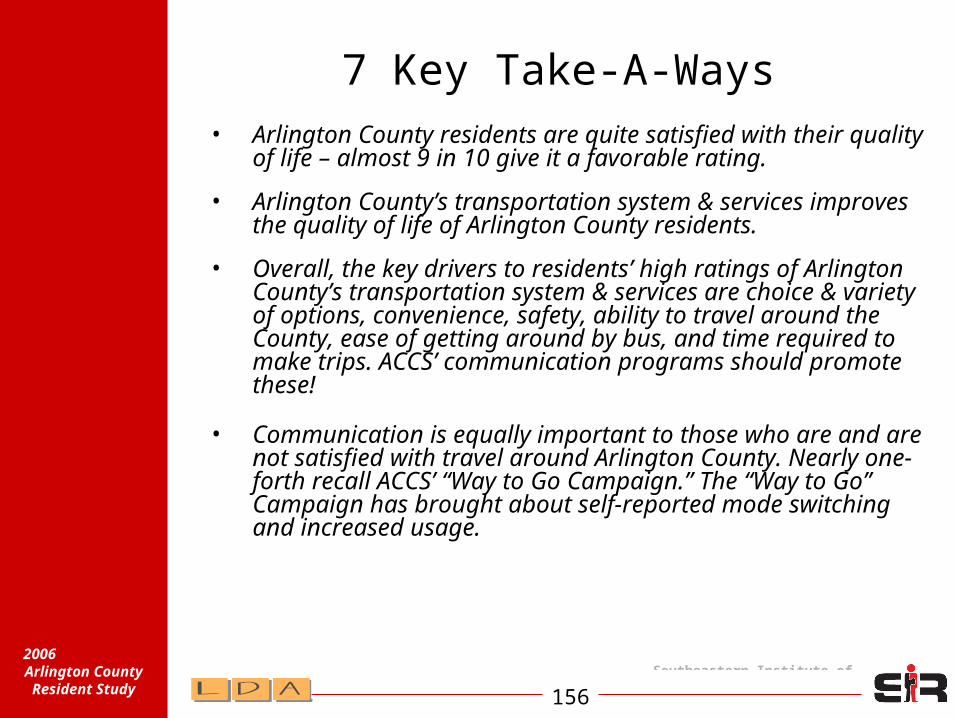
Southeastern Institute of
Research156
2006 Arlington
County Resident Study
7 Key Take-A-Ways• Arlington County residents are quite satisfied with their
quality of life – almost 9 in 10 give it a favorable rating.
• Arlington County’s transportation system & services improves the quality of life of Arlington County residents.
• Overall, the key drivers to residents’ high ratings of Arlington County’s transportation system & services are choice & variety of options, convenience, safety, ability to travel around the County, ease of getting around by bus, and time required to make trips. ACCS’ communication programs should promote these!
• Communication is equally important to those who are and are not satisfied with travel around Arlington County. Nearly one-forth recall ACCS’ “Way to Go Campaign.” The “Way to Go” Campaign has brought about self-reported mode switching and increased usage.
Southeastern Institute of
Research157
2006 Arlington
County Resident Study
7 Key Take-A-Ways
• Advertising lifts both satisfaction with ability to travel around Arlington County and satisfaction with the transportation system.
• The County may not be getting all the credit it deserves for its transportation initiatives. Look for ways to unify the different County messages under one brand communication platform.
• As there is a direct relationship between transportation and quality of life, create an easy to understand model that brings it to life. Use this model to marshal greater resources for communications to advance the transportation system as this will ultimately drive Arlington County residents’ quality of life ratings.
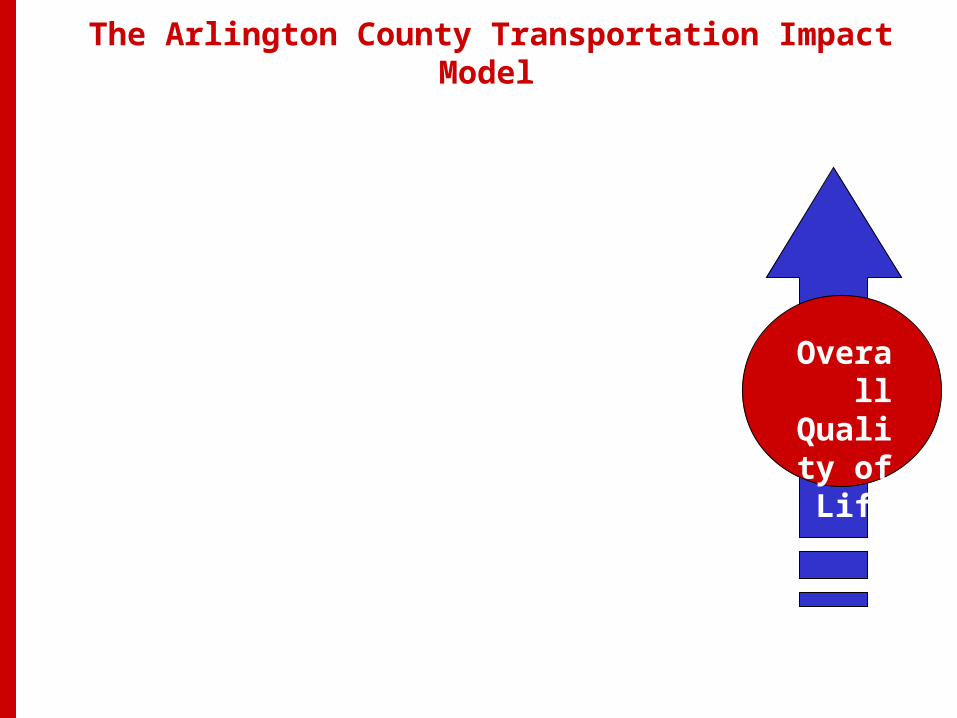
Southeastern Institute of
Research158
2006 Arlington
County Resident Study
The Arlington County Transportation Impact Model
Overall
Quality of Life
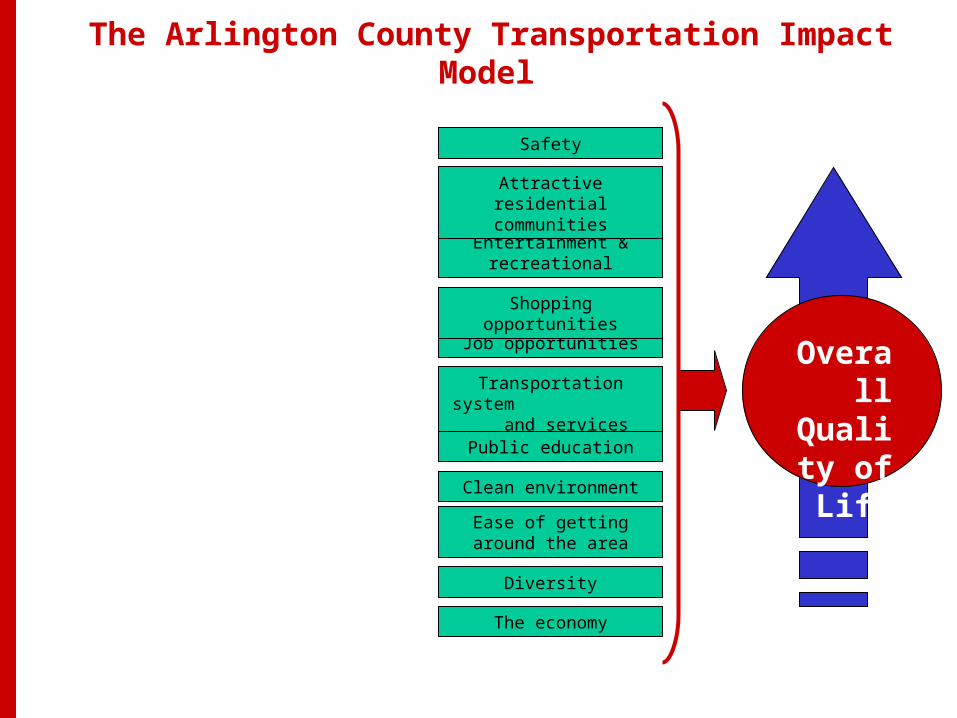
Southeastern Institute of
Research159
2006 Arlington
County Resident Study
The Arlington County Transportation Impact Model
The economy
Transportation system and services
Entertainment & recreational
Job opportunities
Clean environment
Public education
Attractive residential communities
Safety
Shopping opportunities
Ease of getting around the area
Diversity
Overall
Quality of Life

Southeastern Institute of
Research160
2006 Arlington
County Resident Study
The Arlington County Transportation Impact Model
The economy
Transportation system and services
Entertainment & recreational
Job opportunities
Clean environment
Public education
Attractive residential communities
Safety
Shopping opportunities
Ease of getting around the area
Diversity
Overall
Quality of Life

Southeastern Institute of
Research161
2006 Arlington
County Resident Study
The Arlington County Transportation Impact Model
The economy
Transportation system and services
Entertainment & recreational
Job opportunities
Clean environment
Public education
Attractive residential communities
Safety
Shopping opportunities
Ease of getting around the area
Diversity
Overall
Quality of Life

Southeastern Institute of
Research162
2006 Arlington
County Resident Study
The Arlington County Transportation Impact Model
The economy
Transportation system and services
Entertainment & recreational
Job opportunities
Clean environment
Public education
Attractive residential communities
Safety
Shopping opportunities
Ease of getting around the area
Diversity
Overall
Quality of Life
Safety
Ease of getting around by bus
Ease of getting around w/out car
Ease of getting around by walking
Ease of getting around by bicycle
Sat. AC is meeting residents needs
Ability to travel around AC
Ease of getting around w/car
Choice/variety of options
Cost
Time required to make trips
Convenience
Dependability
Comfort
Ease of getting to other destinations w/out a car
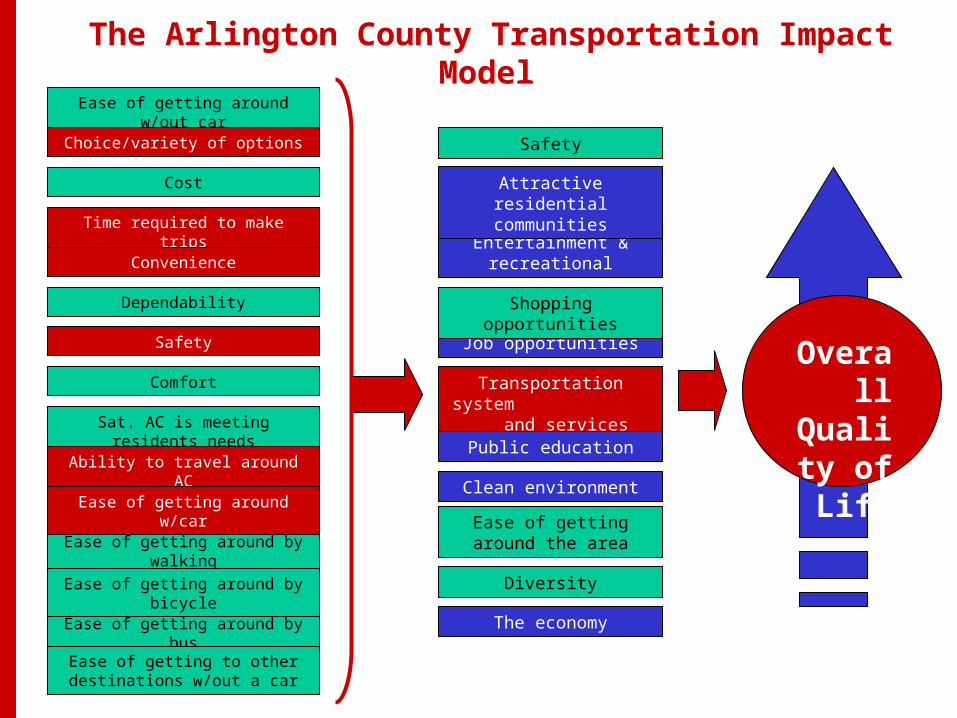
Southeastern Institute of
Research163
2006 Arlington
County Resident Study
The Arlington County Transportation Impact Model
The economy
Transportation system and services
Entertainment & recreational
Job opportunities
Clean environment
Public education
Attractive residential communities
Safety
Shopping opportunities
Ease of getting around the area
Diversity
Overall
Quality of Life
Safety
Ease of getting around by bus
Ease of getting around w/out car
Ease of getting around by walking
Ease of getting around by bicycle
Sat. AC is meeting residents needs
Ability to travel around AC
Ease of getting around w/car
Choice/variety of options
Cost
Time required to make trips
Convenience
Dependability
Comfort
Ease of getting to other destinations w/out a car
Related Documents