1

1. 2 PROJECT MANAGEMENT TECHNIQUES Basic Systems (Historically) 4 GANNT Charts Circa 1917 –Graphically represents activities across a time scale 4 PERT.
Dec 19, 2015
Welcome message from author
This document is posted to help you gain knowledge. Please leave a comment to let me know what you think about it! Share it to your friends and learn new things together.
Transcript

1
2
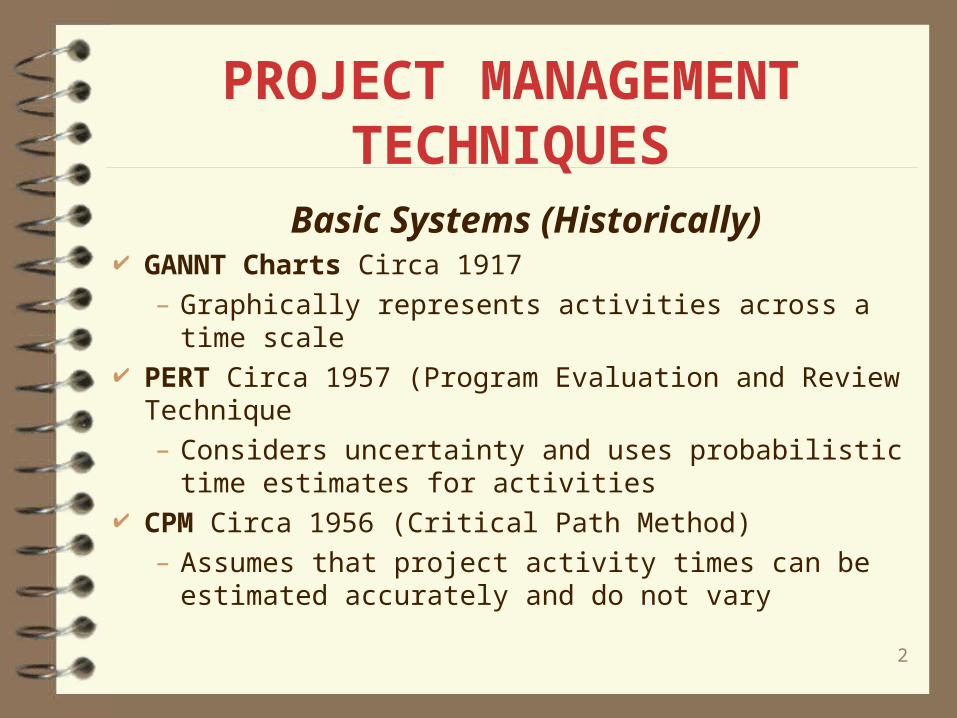
PROJECT MANAGEMENT TECHNIQUES
Basic Systems (Historically) GANNT Charts Circa 1917
– Graphically represents activities across a time scale PERT Circa 1957 (Program Evaluation and Review
Technique
– Considers uncertainty and uses probabilistic time estimates for activities
CPM Circa 1956 (Critical Path Method)
– Assumes that project activity times can be estimated accurately and do not vary

3
NEED FOR & USE OF PERT/CPM
When on-time success for large projects is essential
When projects are not performed frequently, or perhaps only once
When several people/parties need to be involved to complete the project
When one needs to estimate the chance of completing a project by a scheduled date
4
TYPICAL APPLICATIONS OF PERT/CPM
Facilities expansion and construction New equipment installation and use Major layout changes New systems and procedures Major organizational changes Research and development projects

5
EXAMPLES OF PERT/CPM
BAY COMMUNITY HOSPITAL The staff of the Bay Community Hospital had committed itself to
introduce a new diagnostic procedure in the clinic. This procedure required the acquisition, installation, and introduction of a new medical instrument. Dr. Ed Windsor was assigned the responsibility for assuring that the introduction be performed as quickly and smoothly as possible.
Source: W. E. Sasser, R.P. Olsen, D.D. Wyckoff, Management Service Operations, Boston: Allyn and Bacon, 1978, PP. 97-98.
6
KEY QUESTIONS
What are the activities that must be done? What is the sequence of these activities? What are the times required to do each activity? Who will do the activity? What is the shortest time period to complete the
project? What activities require the most attention? What happens if the work isn’t completed on time? What is the chance of getting the project done by a
given scheduled date?

7
PHASES OF PERT/CPM
Planning the project & creating a schedule
Communicating project information
Managing changes in the schedule (track, adjust)

8
SOME DEFINITIONS
PROJECT– Interrelated set of activities that have a definite starting and ending
point and that results in an intended final outcome
ACTIVITY– A time consuming element in a project; representative of work or
descriptive of a relationship between two events– Represented on a network by a line segment (arrow) connecting
one event to the next event.
tp, tm, to
A

9
SOME DEFINITIONS Continued
PESSIMISTIC TIME (tp)– Maximum time (estimated in weeks and tenths of weeks)
to complete an activity if unusually bad luck is experienced or if the activity proves more difficult to solve than anticipated
– No more than one chance in 100 of being realized
MOST LIKELY TIME (tm)– The probable time to complete an activity assuming no
unexpected problems will develop
10
SOME DEFINITIONS Continued
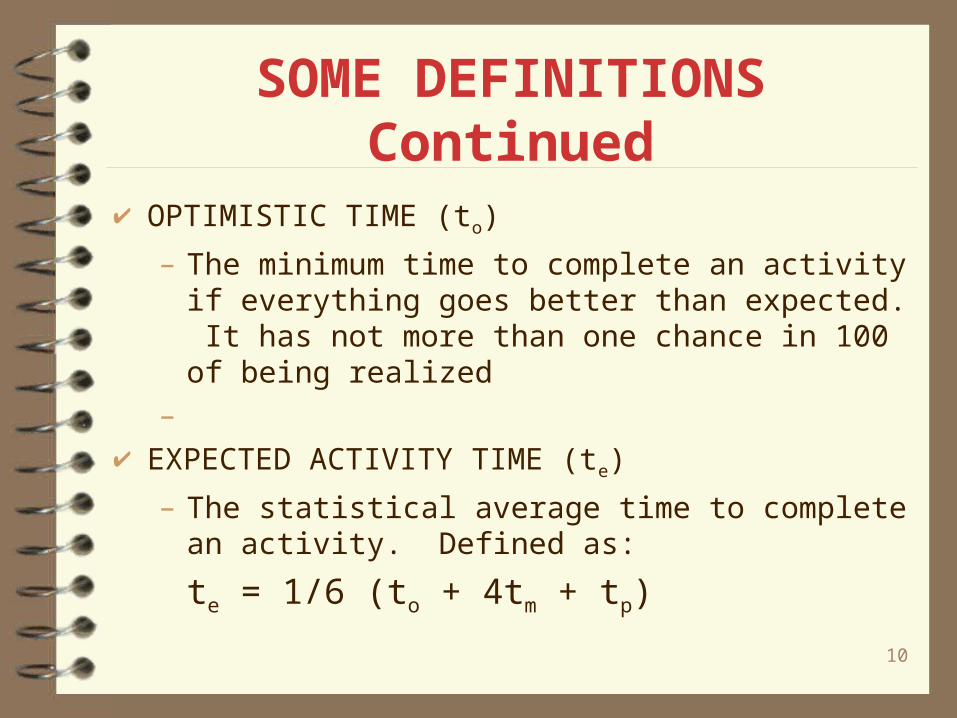
OPTIMISTIC TIME (to)
– The minimum time to complete an activity if everything goes better than expected. It has not more than one chance in 100 of being realized
–
EXPECTED ACTIVITY TIME (te)
– The statistical average time to complete an activity. Defined as:
te = 1/6 (to + 4tm + tp)
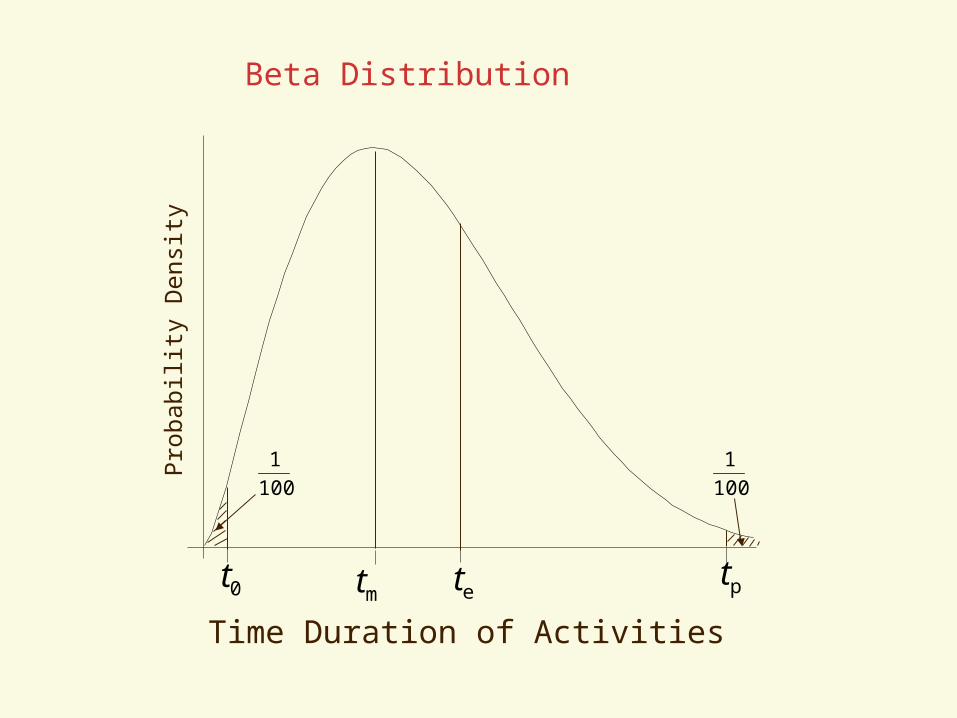
Time Duration of Activities
Beta Distribution
0t mt et pt
Prob
abil
ity
Den
sity
100
1
100
1
12
SOME DEFINITIONS Continued
ACTIVITY VARIANCE– A measure of uncertainty of the three time estimates. 2te = (1/6 (tp - to))2

13
SOME DEFINITIONS Continued
EVENT– A milestone of progress or accomplishment in the program plan
depicting the start or completion of an activity or activities which precede or succeed it
– Represented on a network by a circle
– Is not time consuming
11 22
A
14
DEFINITIONS Continued
EXPECTED EVENT TIME (TE)– The earliest or expected time in which an event will be completed;
– An accumulation of the expected activity time (te) along the longest path to that event
LATEST ALLLOWABLE EVENT TIME (TL)– The latest time an event can be completed without causing the expected
time of the objective event to exceed the scheduled time assigned to it
EVENT SLACK TIME (SE)– The maximum time that an event may be delayed before it delays the
over-all project completion date, defined as:
(SE=TL-TE)
15
BASIC STEPS IN PERT/CPM
Assemble the right team
Define all activities required to complete the project, along with the precedence relationships
Get estimates of the activity times (to tm tp)
Calculate the activity and event times (Note: computers should do this).

16
BASIC STEPS IN PERT/CPM
Analyze the network model, determining those activities with slack and the critical path of activities
Develop a feasible project plan considering availability of resources
Use the model to communicate and manage the project (team approach)
Periodically assess the progress/status of the project and update the plan if necessary (steps 2-8) based upon team consensus
17
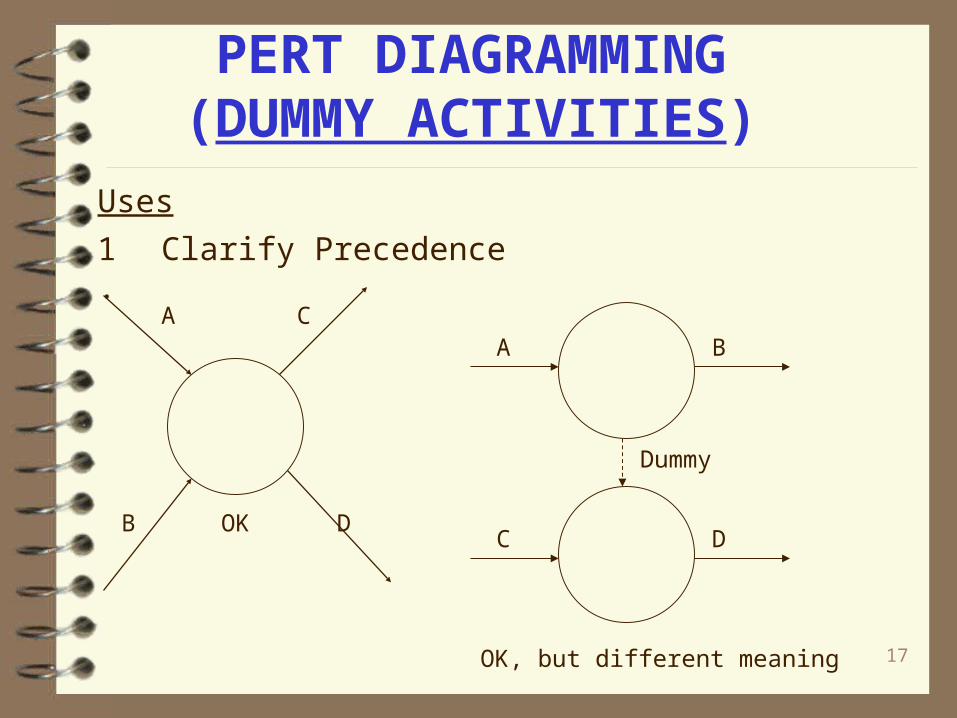
PERT DIAGRAMMING(DUMMY ACTIVITIES)
Uses
Dummy
BA
DCB
A
D
C
OK
1. Clarify Precedence
OK, but different meaning

18
PERT DIAGRAMMING(DUMMY ACTIVITIES)
Uses
DummyB
A
B
A
C
Not correct,OK in concept
2. Clarify Event Numbers
C
19
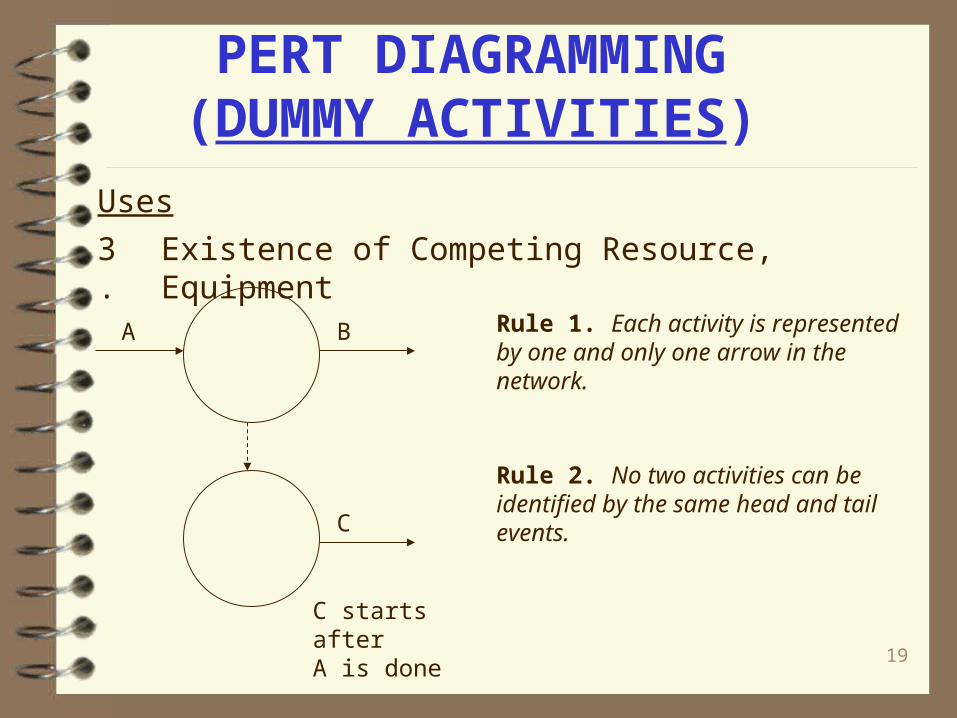
PERT DIAGRAMMING(DUMMY ACTIVITIES)
Uses
C starts afterA is done
BA
C
3. Existence of Competing Resource, Equipment
Rule 1. Each activity is represented by one and only one arrow in the network.
Rule 2. No two activities can be identified by the same head and tail events.
20
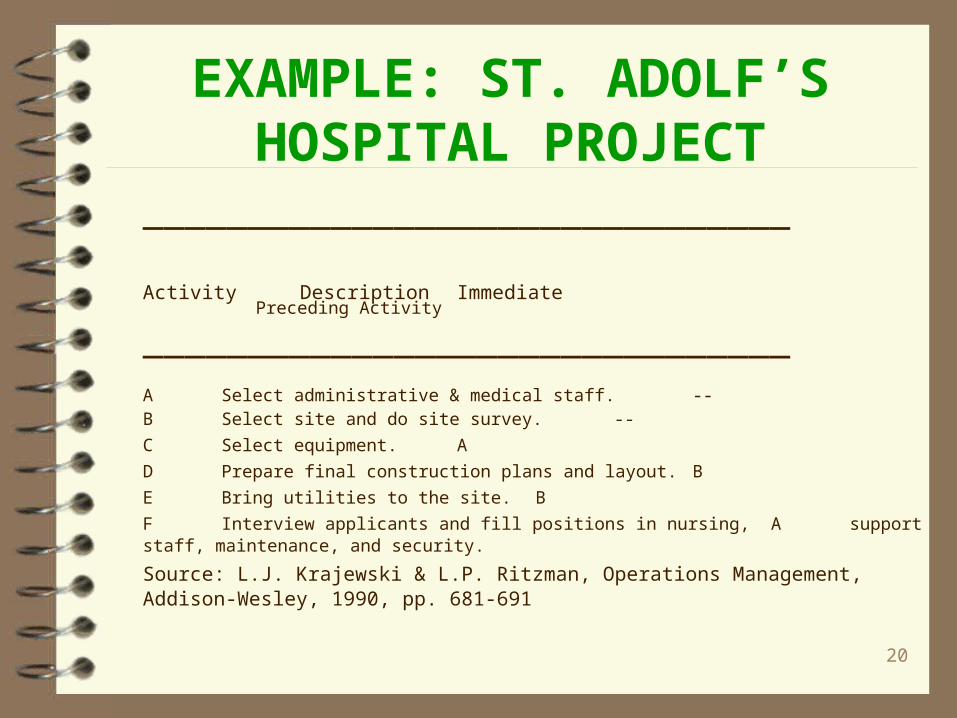
EXAMPLE: ST. ADOLF’S HOSPITAL PROJECT
_______________________________
Activity Description Immediate Preceding Activity
_______________________________ A Select administrative & medical staff. -- B Select site and do site survey. -- C Select equipment. A D Prepare final construction plans and layout. B E Bring utilities to the site. B F Interview applicants and fill positions in nursing, A
support staff, maintenance, and security.
Source: L.J. Krajewski & L.P. Ritzman, Operations Management, Addison-Wesley, 1990, pp. 681-691

21
ST. ADOLF’S HOSPITAL PROJECT Continued
_______________________________
Activity Description Immediate Preceding Activity
_______________________________
G Purchase and take delivery of the equipment.C H Construct the hospital D I Develop an information system. A J Install the equipment. E,G,H K Train the nurses and staff. F,I,J
22
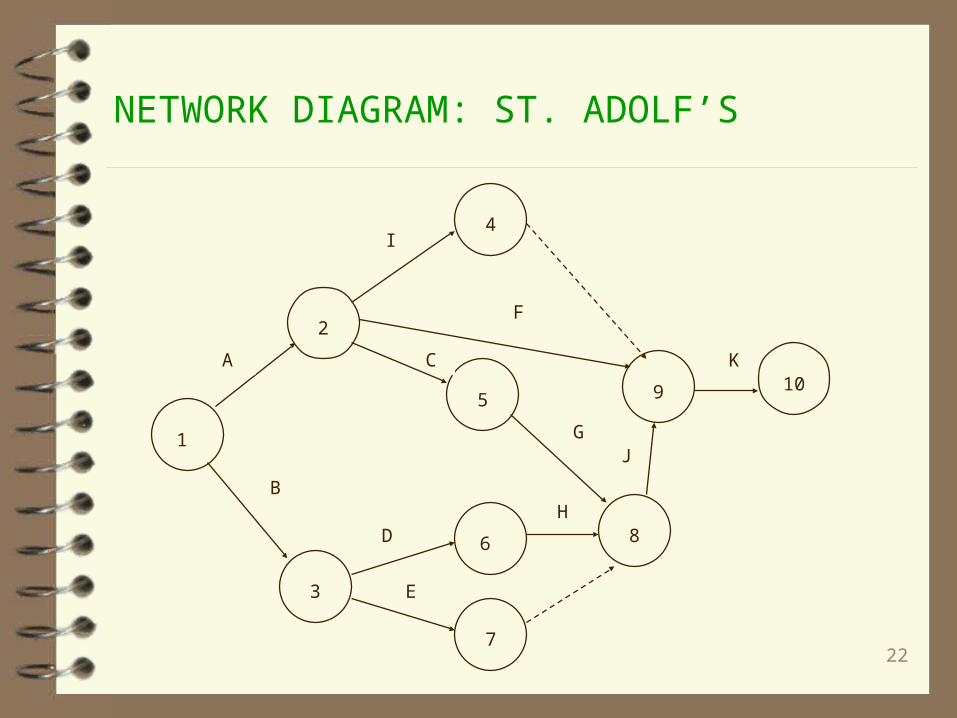
NETWORK DIAGRAM: ST. ADOLF’S
11
3
7
61
5
8
109
4
2
A
B
D
E
H
G
C
F
I
K
J
23
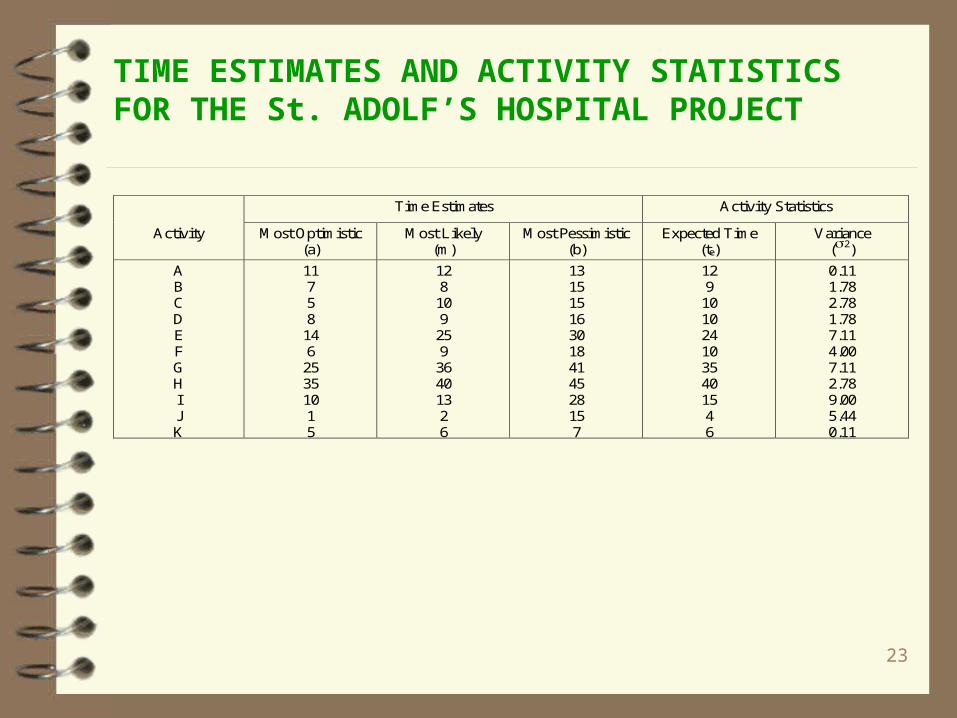
TIME ESTIMATES AND ACTIVITY STATISTICS FOR THE St. ADOLF’S HOSPITAL PROJECT
Time Estimates Activity Statistics
Activity Most Optimistic(a)
Most Likely(m)
Most Pessimistic(b)
Expected Time(te)
Variance(2)
ABCDEFGHIJK
1175814625351015
12810925936401326
131515163018414528157
1291010241035401546
0.111.782.781.787.114.007.112.789.005.440.11
24
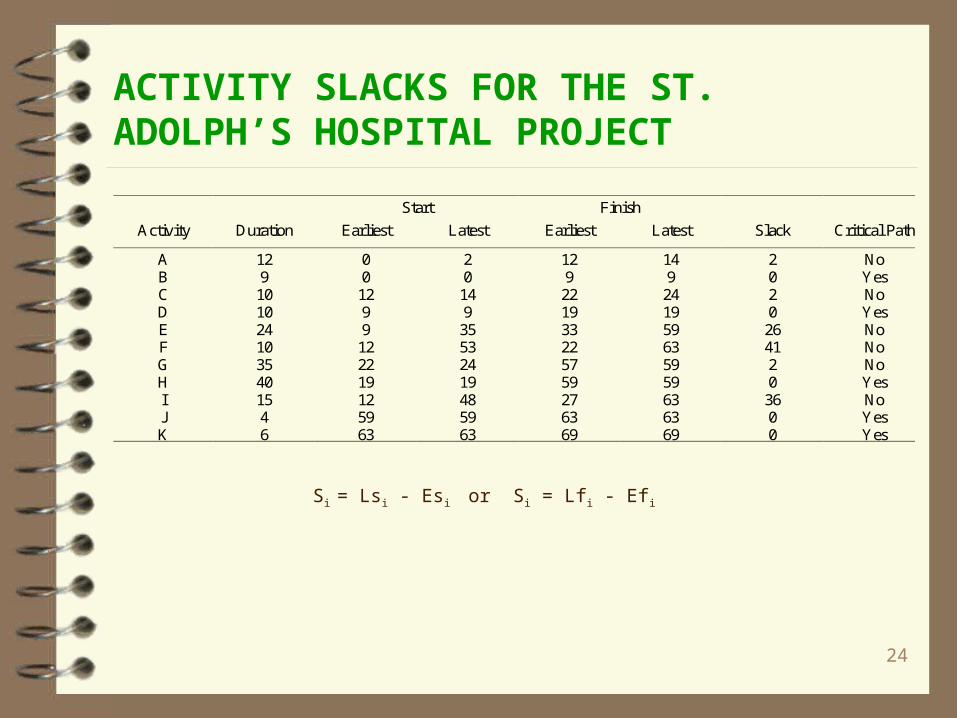
ACTIVITY SLACKS FOR THE ST. ADOLPH’S HOSPITAL PROJECT
Start Finish
Activity Duration Earliest Latest Earliest Latest Slack Critical Path
ABCDEFGHIJK
129
1010241035401546
00
1299
122219125963
20
149
35532419485963
129
221933225759276369
149
241959635959636369
2020
264120
3600
NoYesNoYesNoNoNoYesNoYesYes
Si = Lsi - Esi or Si = Lfi - Efi
25
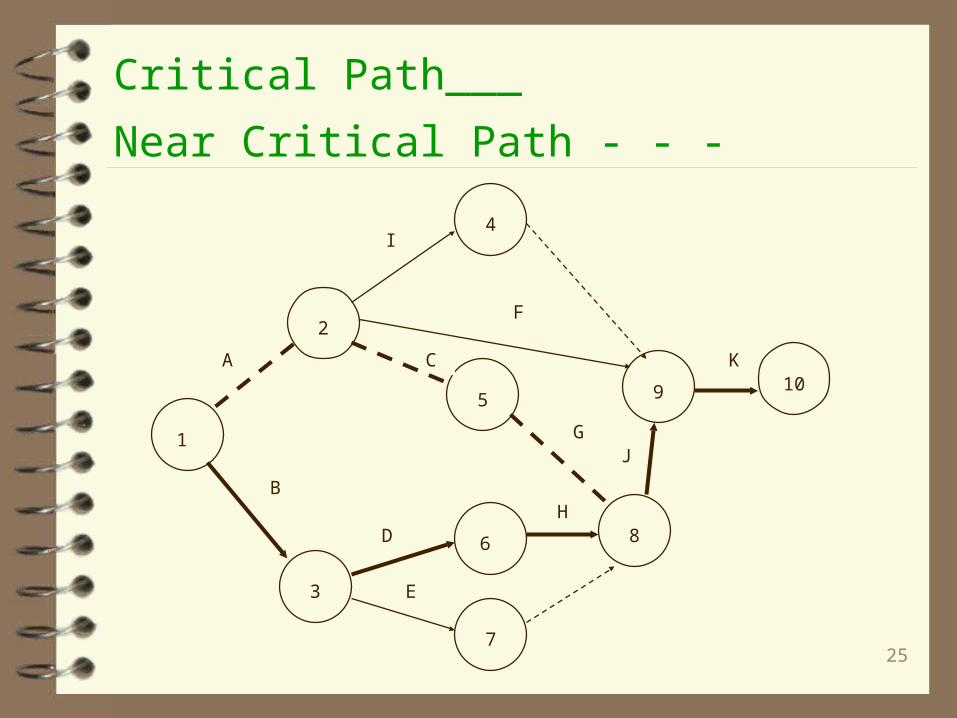
Critical Path___
Near Critical Path - - -
11
3
7
61
5
8
109
4
2
A
B
D
E
H
G
C
F
I
K
J
26
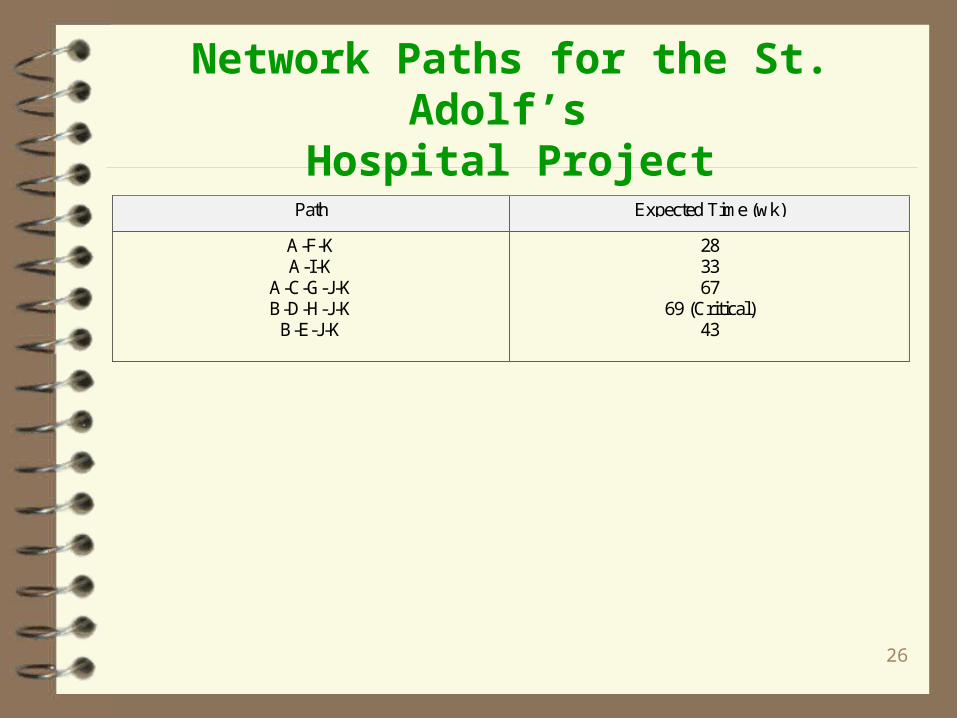
Network Paths for the St. Adolf’s Hospital Project
Path Expected Time (wk)
A-F-KA-I-K
A-C-G-J-KB-D-H-J-K
B-E-J-K
283367
69 (Critical)43

27
PROBABILITY OF MEETING THE PROJECT DUE DATE
The central limit theorem allows us to use the normal probability distribution to find the probability of achieving a particular due date for the project. We can use the z-transformation formula as follows:
Where T’ = due date for the project TE = earliest expected completion date for the project 2
cp = sum of the variances on the critical path
Z =
2cp
T’ - TE
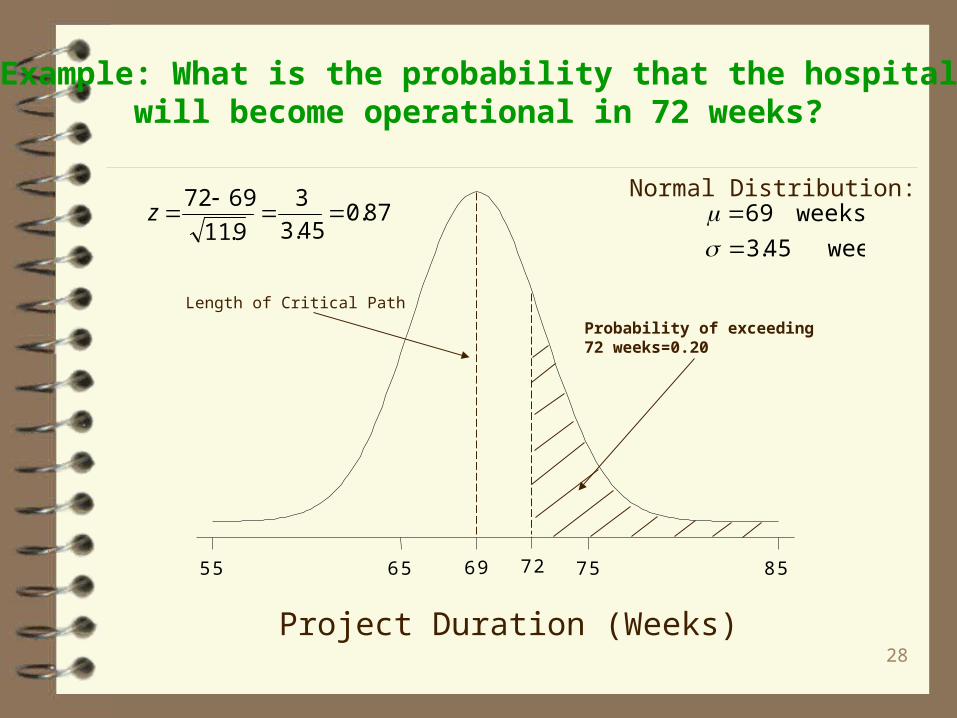
28
85756555 69 72
Length of Critical Path
Probability of exceeding 72 weeks=0.20
Project Duration (Weeks)
Example: What is the probability that the hospitalwill become operational in 72 weeks?
87.045.3
3
9.11
6972
z
Normal Distribution:
weeks45.3
weeks69
29
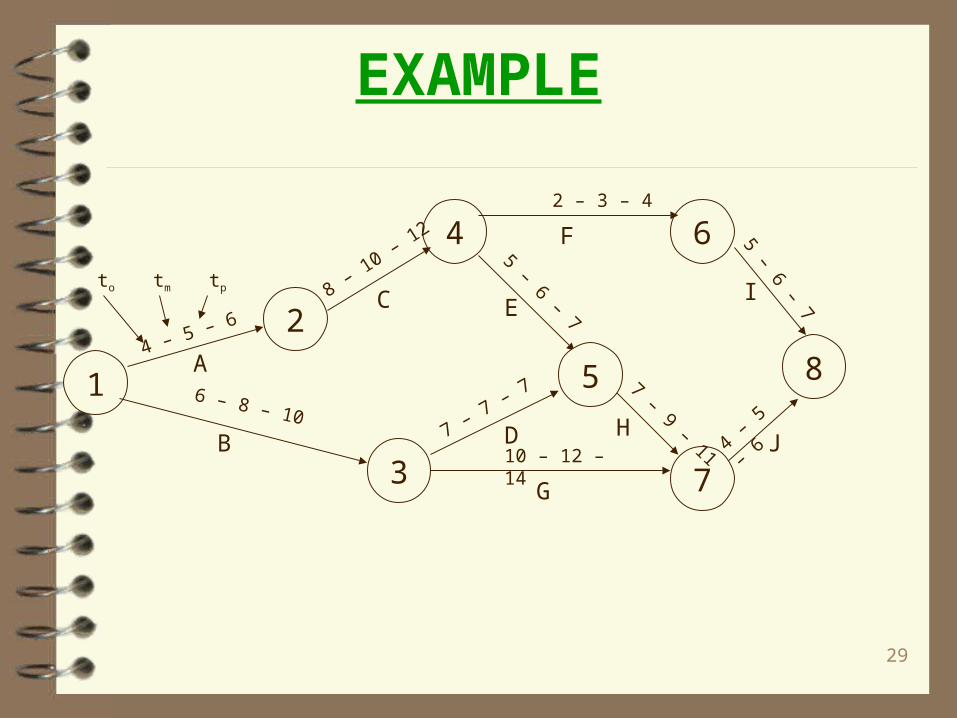
EXAMPLE
1
4 6
8
3
2
5
7G
J
I
F
E
HD
C
B
A6 – 8 – 10
10 – 12 – 14 4 – 5 – 6
4 – 5 – 6
8 – 10 – 12
2 – 3 – 4
5 – 6 – 7
7 – 9 – 11
5 – 6 – 7
7 – 7 – 7
to tm tp

30
PERT Table
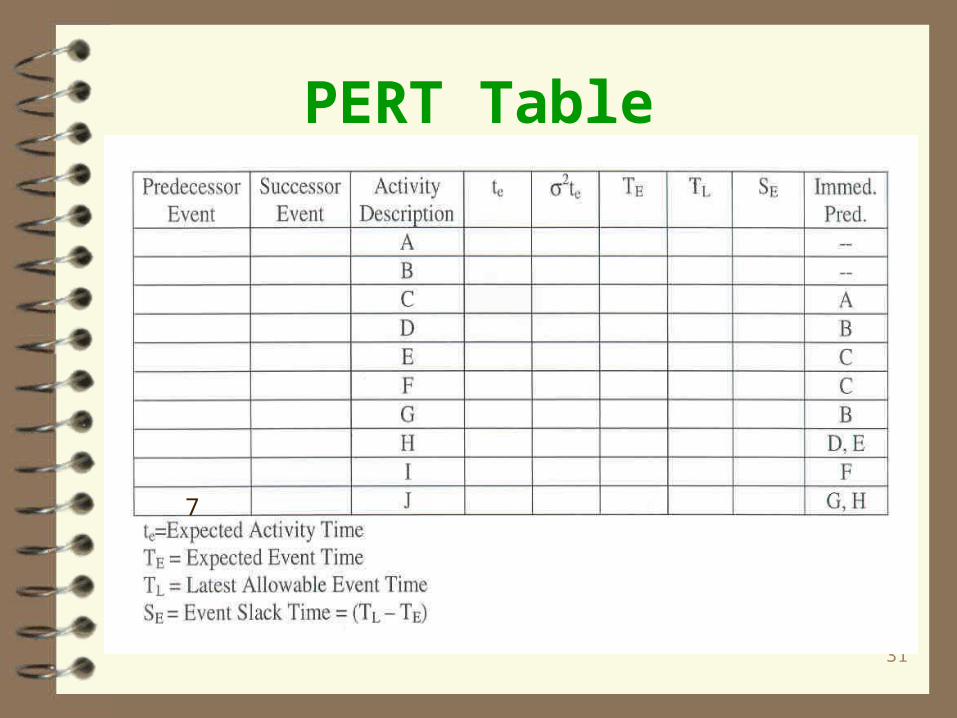
31
PERT Table
7
32
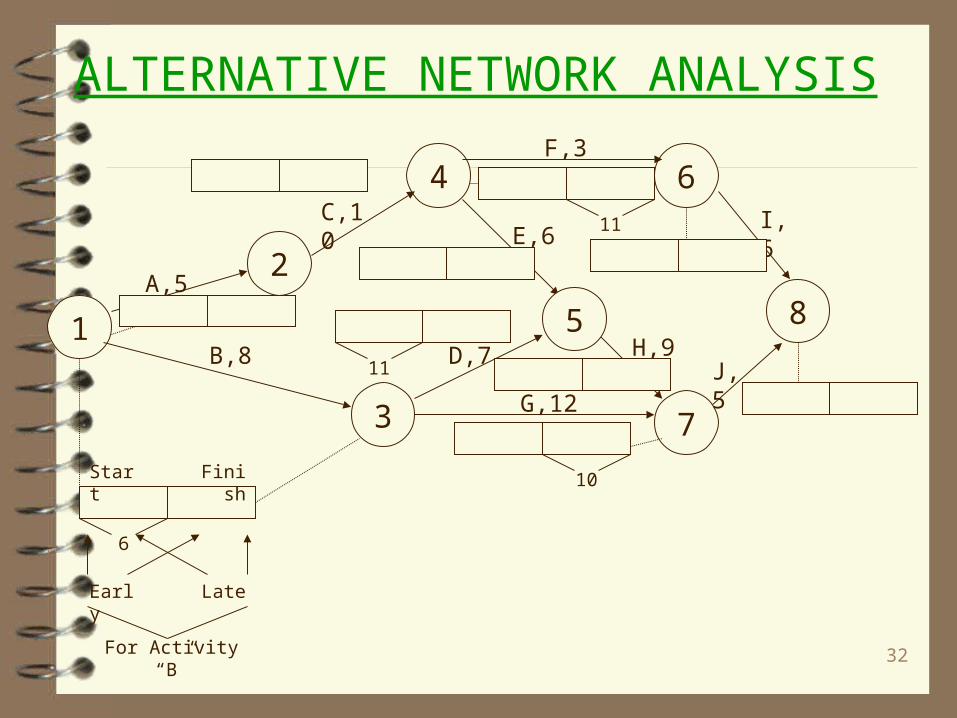
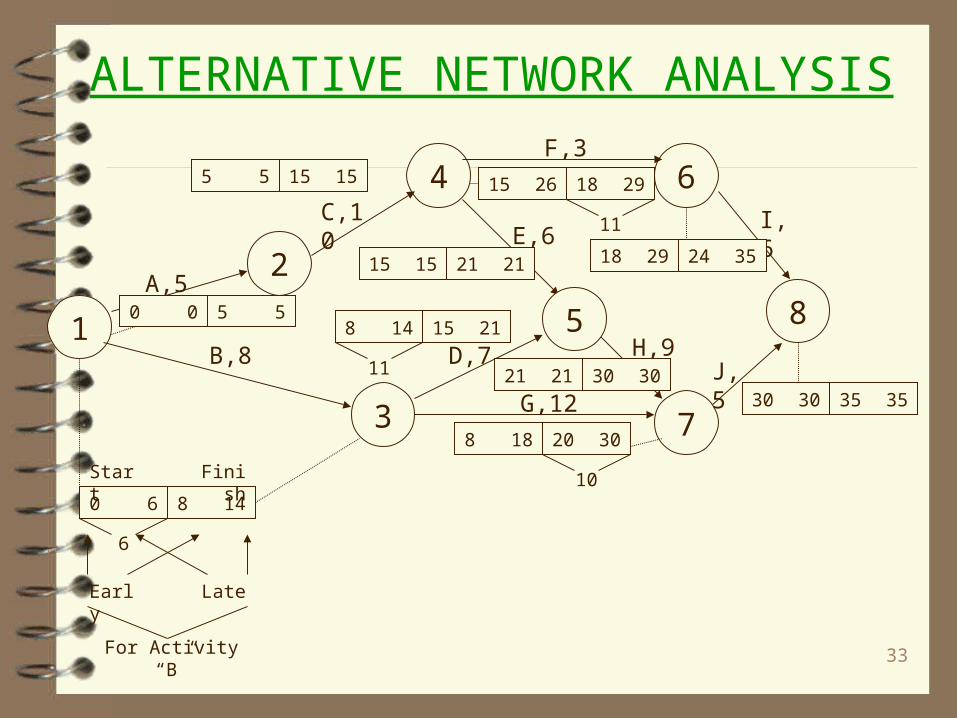
ALTERNATIVE NETWORK ANALYSIS
1
4 6
8
3
2
5
7G,12
J,5
I,6
F,3
E,6
H,9D,7
C,10
B,8
A,5
11
10
11
6
Start Finish
Early Late
For Activity “B”
33
ALTERNATIVE NETWORK ANALYSIS
1
4 6
8
3
2
5
7G,12
J,5
I,6
F,3
E,6
H,9D,7
C,10
B,8
A,5
8 18 20 30
0 6 8 14
0 0 5 5
5 5 15 15
15 15 21 21
15 26 18 29
18 29 24 35
30 30 35 3521 21 30 30
8 14 15 21
11
10
11
6
Start Finish
Early Late
For Activity “B”

34
ADVANTAGES OF PERT/CPM
Shows relationship of project activities
Facilitates more effective planning
Pinpoints problem areas early
Improve communications and understanding of roles/responsibilities
35
ADVANTAGES OF PERT/CPM continued
Determines best allocations of personnel, equipment, and other resources
Identifies alternate courses of action
Focuses attention on those activities that control the overall completion time
36
CRITICISMS OF PERT/CPM
TIME ESTIMATES Task Times (t0,, tm, tp) are unknown (imperfect data).
Not all activity times follow a Beta distribution (arbitrary choice).
Pessimistic time estimates are often inflated.

37
CRITICISMS OF PERT/CPM
NETWORK DIAGRAMS All precedences are not really hard requirements
– Some are “soft precedence relationships” or good ideas. (Like course prerequisites.)
– Some activities can be overlapped and worked on simultaneously.
– Some precedence relationships cannot be specified, but depend on the results of previous activities.
Project content changes require updated input data & analysis.
38
REQUIREMENTS OF PERT/CPM
PERT/CPM itself only furnishes information. It takes prompt, effective action by people to keep the project on schedule and to compensate for changes and delays.
PERT/CPM is not a substitute for thinking or planning. To be successful, it requires precise planning, and demands that every step of the project be thought out most carefully.

39
REQUIREMENTS OF PERT/CPM
PERT/CPM also requires the whole hearted support of management and the people who will direct the work.
PERT/CPM also requires a focus of “near-critical” path activities to ensure on-time project completions.
Related Documents


