1

1. 2 3 $79.3 81.6 83.4 84.2 86.7 101.2 120.4 139.7 110.9 ? 2001 2002 2003 2004 2005 2006 2007 2008 2009 2010.
Dec 16, 2015
Welcome message from author
This document is posted to help you gain knowledge. Please leave a comment to let me know what you think about it! Share it to your friends and learn new things together.
Transcript

1

2
Total State Appropriations 2001-2010
$60
$80
$100
$120
$140
2001 2002 2003 2004 2005 2006 2007 2008 2009 2010
?
In Millions

3
$79.3 81.6 83.4 84.2 86.7 101.2 120.4 139.7 110.9 ?
2001200220032004200520062007200820092010
4
Initial Decrease from 2008 $17.8 million
Recent Proration 11.0
_____
Total 2009 Decrease $ 28.8 million
Down 20.6% from 1 year ago.
Current Year Appropriation

5
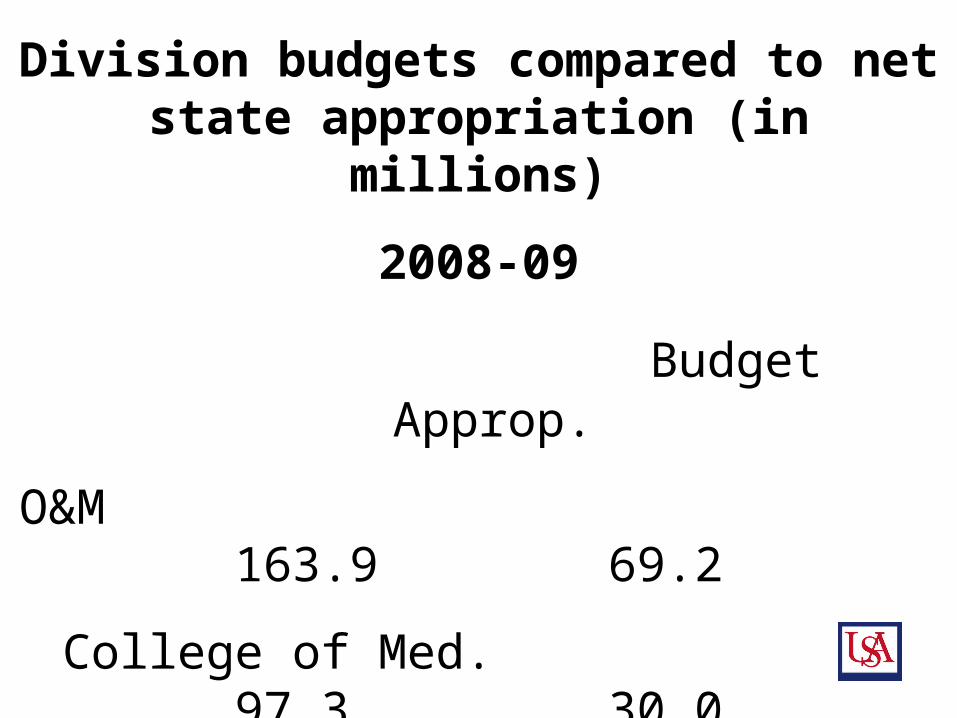
Division budgets compared to net state appropriation (in millions)
2008-09
Budget Approp.
O&M 163.9 69.2
College of Med. 97.3 30.0
Hospitals 317.0 9.6
6
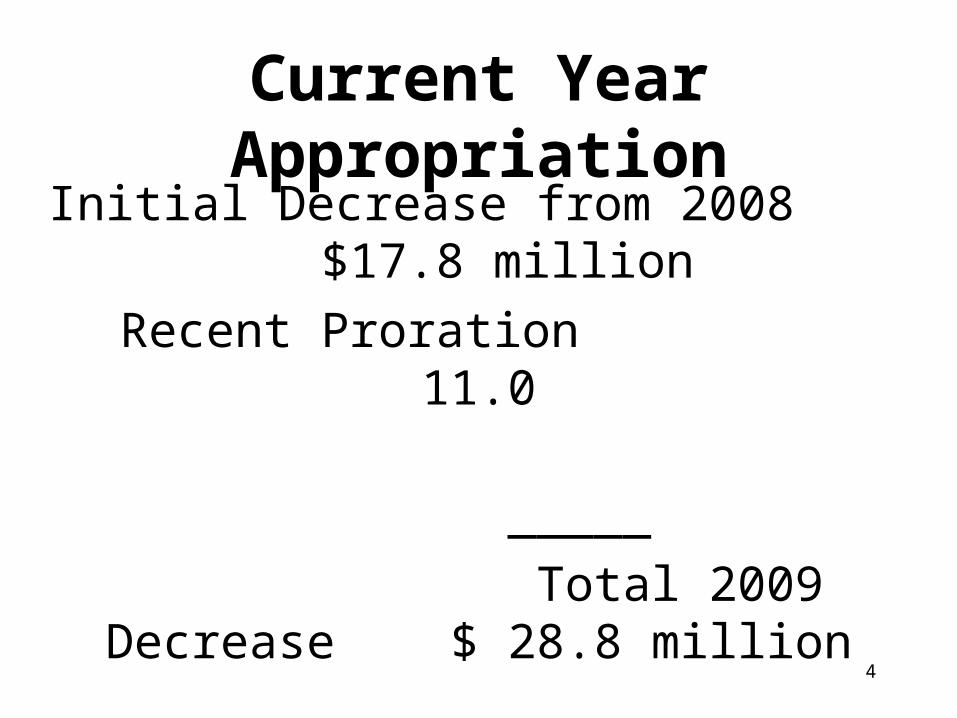
Total Budget by Division - 2009
O&M29%
Auxiliaries3%
College of Medicine17%
MCI3%
Hospitals48%
7
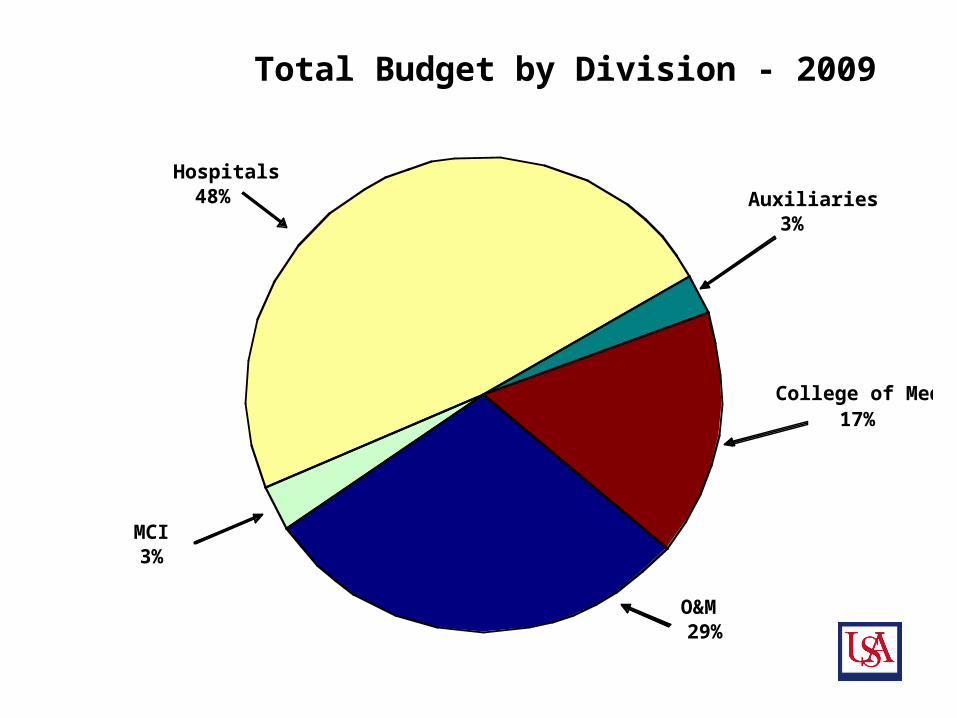
State Appropriations by Division - 2009
O&M62%
MCI2%
Hospitals9%
College of Medicine27%

8
0%
10%
20%
30%
40%
50%
60%
2001 2009
Composition of Revenues - O&M2001 and 2009
State Appropriations Tuition and Fees Other
56%
39%
5%
45%47%
8%
9
Division budgets compared to net state appropriation (in millions)
2008-09
Budget Approp.
O&M 163.9 69.2
College of Med. 97.3 30.0
Hospitals 317.0 9.6
10
Operations and Maintenance Budget, 2008-09

11
Operations and Maintenance Net Cut in State Funds from 2008:
$16.4 million
Increased revenue (tuition, etc.):$5.7 million
Internal budget cuts: $1.9 million
Net shortfall: $8.8 million

12
COSTS:(“fixed” costs)
Benefits: $8.9 millionHealth insurance: 6.9 millionUtilities: 10.8 millionRetiree pension: 9.8 million
Peehip for retirees: 2.4 million Debt service: $9.9 million
TOTAL fixed costs: $48.7 million

13
Others: Supplies/travel/operating $16.6 million Other 1.3 million Scholarships 4.8 millionSubtotal: $22.7 million
Salaries: $92.5 million
TOTAL: $163.9 million

14
Fixed Costs: $48.7 million
Others: $22.7 million
Salaries: $92.5 million
TOTAL: $163.9 million

15
REVENUES:
State Appropriations: $69.2 millionTuition and Fees: 72.7 millionOther: 13.1 million
(Sales of educational services,
interest income, grants overhead,and misc.)
TOTAL: $155.1 million

16
Total Operations and Maintenance Budget Shortfall, 2008-09:
Costs: $163.9 millionRevenues: 155.1 million________________________Shortfall: $ 8.8 million

17
Budget Reduction Measures

18
1) Equipment & Personal Computers (2008 O&M total = $5 million)
2) Travel (2008 O&M total = $3 million)
3) Cell Phones ($350,000 saved)
4) No Across-Board Salary Increases
19
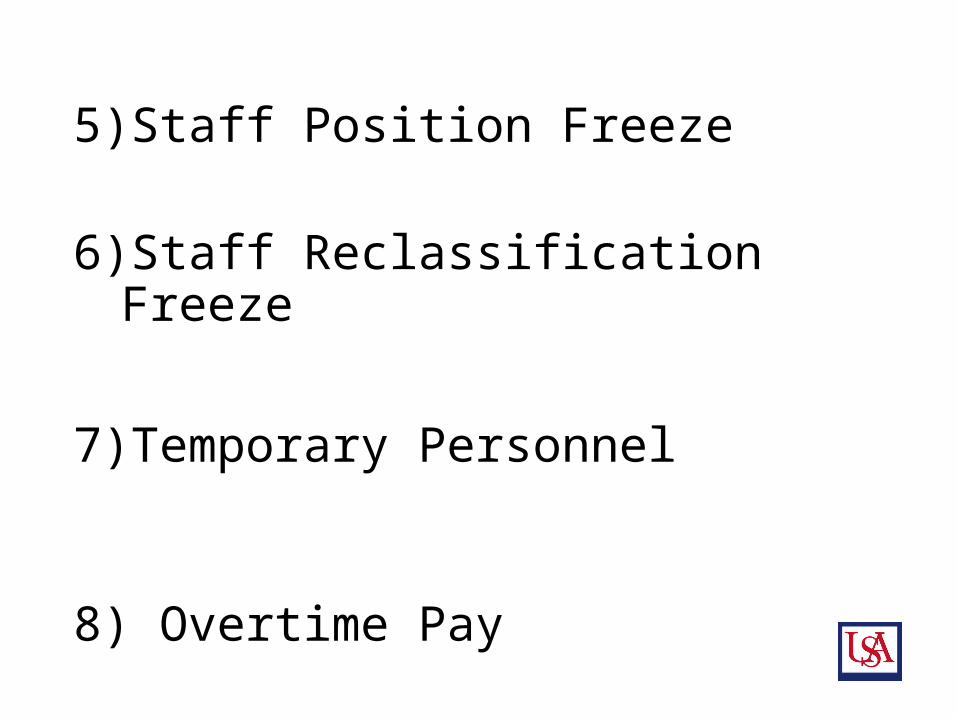
5) Staff Position Freeze
6) Staff Reclassification Freeze
7) Temporary Personnel
8) Overtime Pay

20
Revenue Measures
1) Increased enrollment
2) Increased tuition
3) Control personnel costs

21
USA compared to other organizations affected by the economic downturn:
1. Demand for USA’s products is going up, not down.
2. USA needs to retain employees to address this demand.

22
Cost/savings per 1 percent of payroll (University-wide): $3.1 million
(O&M only): $1 million
Revenue generated per 1 percent of tuition increase:
$573,000

23
Related Documents