Demography - I Maj Syed Fawad Mashhadi 1

1. 2 3 4 5 DEMOGRAPHY LITERACYINFLATION UnemploymentEnergy Hunger & poverty Environment & sustainability Individual freedom Income.
Dec 26, 2015
Welcome message from author
This document is posted to help you gain knowledge. Please leave a comment to let me know what you think about it! Share it to your friends and learn new things together.
Transcript

1
Demography - I
Maj Syed Fawad Mashhadi

2
Definition
• Greek word–Demos–Graphy

3
Definition…
Demography is the scientific study of human populations, primarily with
respect to their size,
Structure &Changes therein

4
• Population size effected by– Fertility– Mortality– Migration

5
Demography and its linkages with other disciplines
DEMOGRAPHY
LITERACY INFLATION
Unemployment Energy
Hunger & poverty Environment &sustainability
Individual freedom
Income

6
Sources of Population Data
• Population censuses– Defacto– Dejure
• Demographic sample surveys• Registration system and administrative statistics
including:• Vital registration (birth, deaths and marriage)• Population registers• Service statistics (from health and family planning programs)• International migration statistics
• Qualitative data

7
THE TOOLS OF DEMOGRAPHY

8
The tools of Demography
1. Count
The absolute number of a population or any demographic event occurring in a specified area in a specified time period. For example, 190,291,129 was the total population of Pakistan in 2012.

9
2. Rate : • The frequency of demographic events in population
during a specified time period (usually a year ) divided by the population “at risk” of the event occurring during that time period.
• Rates tell how common it is for a given event to occur. For example, in 2011 in Pakistan there were -------- births / 1000 population
– 27.2 births /1,000 population – Crude rates– Specific Rates– Standardized rates
10
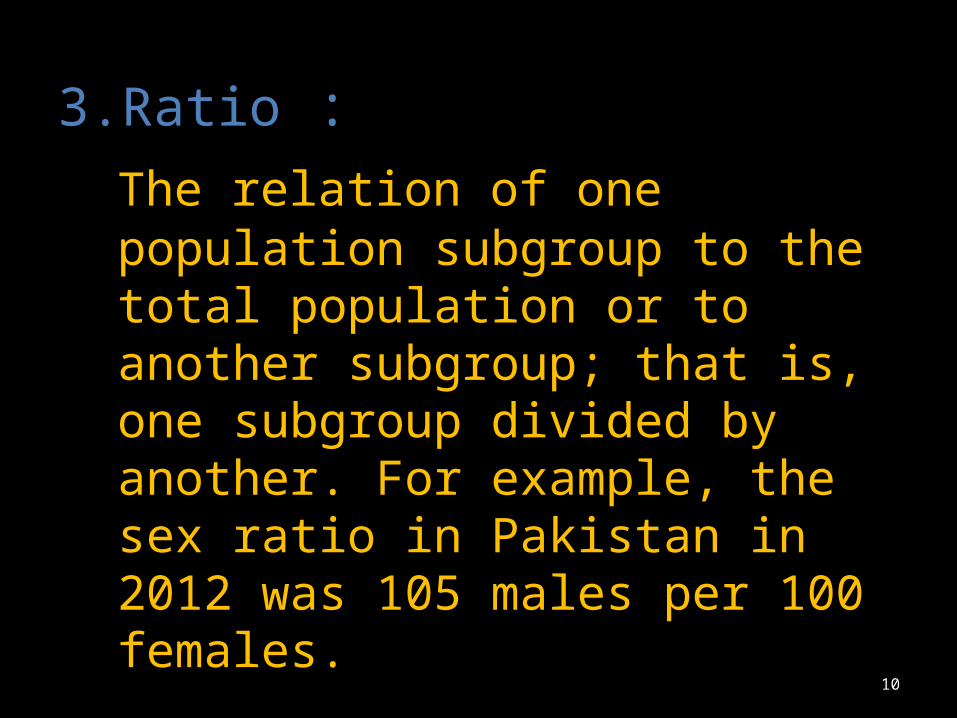
3. Ratio : The relation of one population subgroup to the total population or to another subgroup; that is, one subgroup divided by another. For example, the sex ratio in Pakistan in 2012 was 105 males per 100 females.

11
4. Proportion : The relation of a population subgroup to the entire population; that is, a population subgroup divided by the entire population. For example, the proportion of Pakistan’s population in 2010 classified as urban was .36 or 36 percent.

12
5. Constant
• An unchanging, arbitrary number (for example, 100 or 1000 or 100000) by which rates, ratios, or proportions can be multiplied to express these measures in a more understandable fashion. (K or Constant)
13
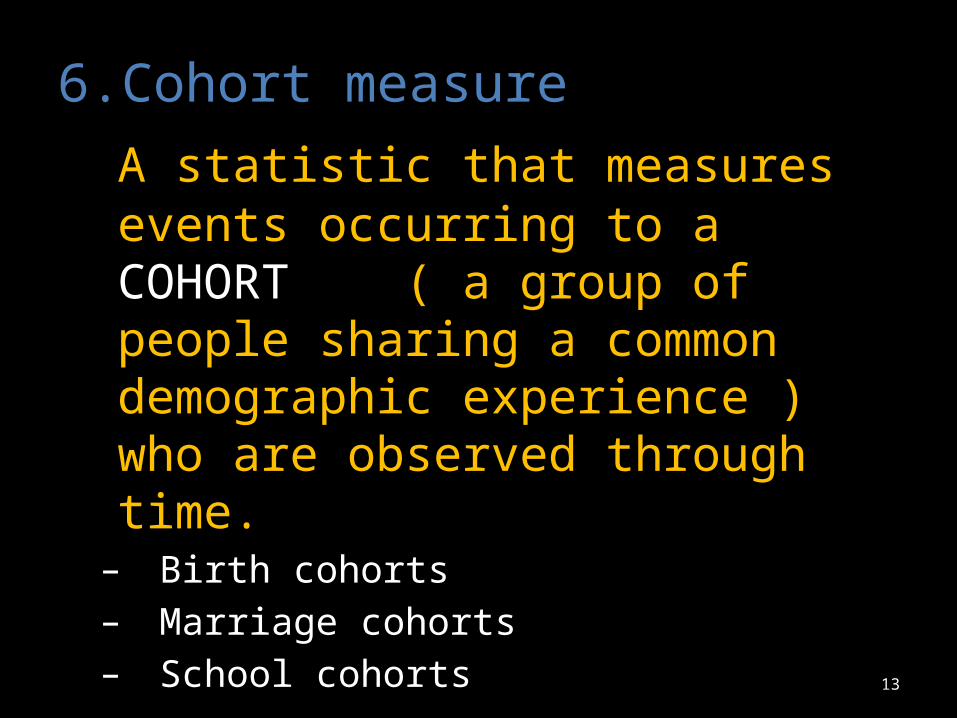
6. Cohort measure A statistic that measures events occurring to a COHORT ( a group of people sharing a common demographic experience ) who are observed through time.
– Birth cohorts– Marriage cohorts– School cohorts

14
7. Period Measure : • A statistic that measures events
occurring to all or part of a population during one period of time
• “ Takes a snapshot” of a population, in effect.
• for example, the death rate of the entire Pakistani population in 2011 was 7.2 per 1000

15
AGE AND SEX COMPOSITION

16
1. Median Age
The median age is the age at which exactly
half the population is older and half is younger.
• Median Age of Pakistan – 21.6 years

17
2. Sex Ratio
No of males X K = 61,574,398 X 100 = 96.2No of females 63,995,848
The sex ratio is the ratio of males to females in a given population, usually expressed as
the number of males for every 100 females.
• Sex ratio of Pakistan in 2012 is • 105 Males/100 females

18
3. Age Dependency RatioThe age-dependency ratio is the ratio of persons in the “dependent”
ages (generally under age 15 and over age 64) to those in the “economically productive” ages (15-64 years) in a population.)
Population under age 15 + Population over age 64 X K = Population ages 15-64
Age dependency ratio of Pakistan 201268.4

19
4. Life Expectancy
• Or expectation of life• At a given age is the number of years which a person of
that age may expect to live according to the mortality pattern prevalent in the country
• One of the best indicators of a country’s level of development and of the overall health status of the population
• Life expectancy of Pakistan in 2012 – Total population: 66.35 years
• Males: 64.52 years • Females: 68.28 years

20
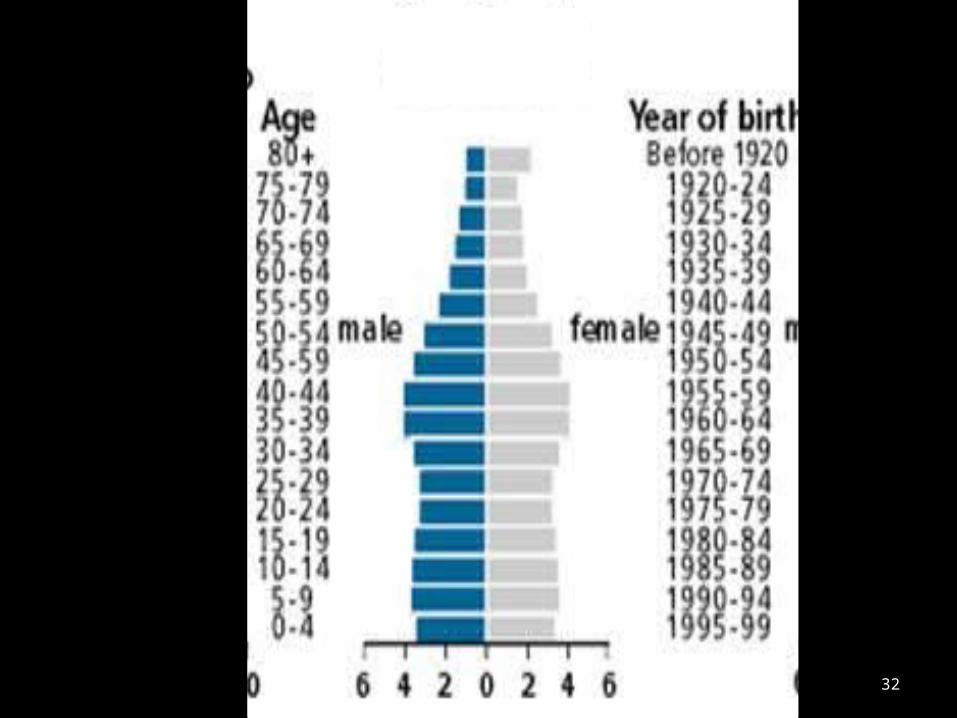
POPULATION PYRAMID
• A population pyramid graphically displays a population’s age and sex composition.
• Horizontal bars present the numbers or proportions of males and females in each age group.
• The sum of all the age sex groups in the population pyramid equals 100% of the population.
• Pyramid may show single years of age or show data in age groups.

22

23
Profiles of Population Pyramid
• Rapid Growth• Slow Growth• Zero / Negative Growth

25
1. Rapid Growth
A large percentage of people in the younger ages.

26

27
2. Slow Growth
A pyramid with a smaller proportion of the population in the younger ages

28

29
3. Zero or Declining Growth
Shown by roughly equal numbers of people in all age ranges, tapering off
gradually at the older ages.

30

31
In migration
32

33

34
Out migration

35

36
FERTILITY

FERTILITY
Fertility refers to the number of live births women have.

38
Terms used in connection with fertility
• FECUNDITY:Which refers to the physiological capability of women to reproduce.

39
• LIVE BIRTH:The outcome of expulsion of conception form its mother and detachment of placenta after which the baby shows some signs of life such as movement of umbilical cord, pulse, breathing or movement of heart etc.

40
• STILL BIRTH:
An outcome of expulsion of conception from its mother and detachment of placenta after which the baby dose not show any sign of life such as movement of umbilical cord or movement of heart etc.

41
• PARITY:Parity is the number of children born alive to a woman.

42
• EFFECTIVE FERTILITY:The term is sometimes used when late foetal deaths (including miscarriages, abortions and stillbirths), and in some cases the deaths of infants or children are excluded from consideration.

43
• TOTAL FERTILITY
It refers to live births miscarriages abortions and still births.

44
• PREMATURE DELIVERY:Premature delivery or premature confinement or premature birth means an end of the pregnancy before the normal period but after six months premature babies normally weigh less than 5.5 pounds or 2.5 kilograms.

45
• BIRTH AT TERM:
when the birth takes place not before six months of pregnancy and at around nine months.

46
• REPRODUCTIVE PERIOD:This period begins from the menarche or appearance of the first period or menses in women, and ends at menopause, that is the ceasing of menses.

47
• STERILITYSterility means incapability of a woman to produce a child. A sterile couple can not produce a child. The sterility may be due to either or both partners

48
• PRIMARY STERILITY:A woman who has never been able to produce a child.

49
• SECONDARY STERILITY:Means a woman unable to produce a child after giving birth to at least one child. It could be permanent or temporary in nature.

50
• TEMPORARY STERILITY:A woman has a sterile period in each menstrual cycle because generally conception can occur only during a few days around the time of ovulation days and during puerperium period that is, the period of six weeks after delivery during which the uterus usually regains its normal size and in which the probability of conception is very low.

51
Fun time
1. Name different demographic tools
2. Name and draw three general profiles of a population pyramid?

52
Assignment
• Draw Population pyramid of Pakistan alongwith percentages of either gender in different age groups
• Date of submission– Before CBL on 9th Jan 2013

53
THANK YOU
Related Documents