1 12-13 EOY Reading 3D NC Comparison Templates The following slides contain a combination of state- level 12-13 EOY mCLASS reports paired with blank templates that you can use to compare your school/district Reading 3D data to state outcomes. You can populate the blank templates with your own data by running your mCLASS “Comparing Populations” and “Correlation/Effectiveness” reports where applicable. For reference, please note that our data analysis indicates that NC state performance tracks relatively close to national mCLASS performance. If you have questions, please contact us at

1 12-13 EOY Reading 3D NC Comparison Templates The following slides contain a combination of state-level 12-13 EOY mCLASS reports paired with blank templates.
Dec 23, 2015
Welcome message from author
This document is posted to help you gain knowledge. Please leave a comment to let me know what you think about it! Share it to your friends and learn new things together.
Transcript
1
12-13 EOY Reading 3D NC Comparison Templates
The following slides contain a combination of state-level 12-13
EOY mCLASS reports paired with blank templates that you can
use to compare your school/district Reading 3D data to state
outcomes. You can populate the blank templates with your own
data by running your mCLASS “Comparing Populations” and
“Correlation/Effectiveness” reports where applicable. For
reference, please note that our data analysis indicates that NC
state performance tracks relatively close to national mCLASS
performance.
If you have questions, please contact us at [email protected]
2
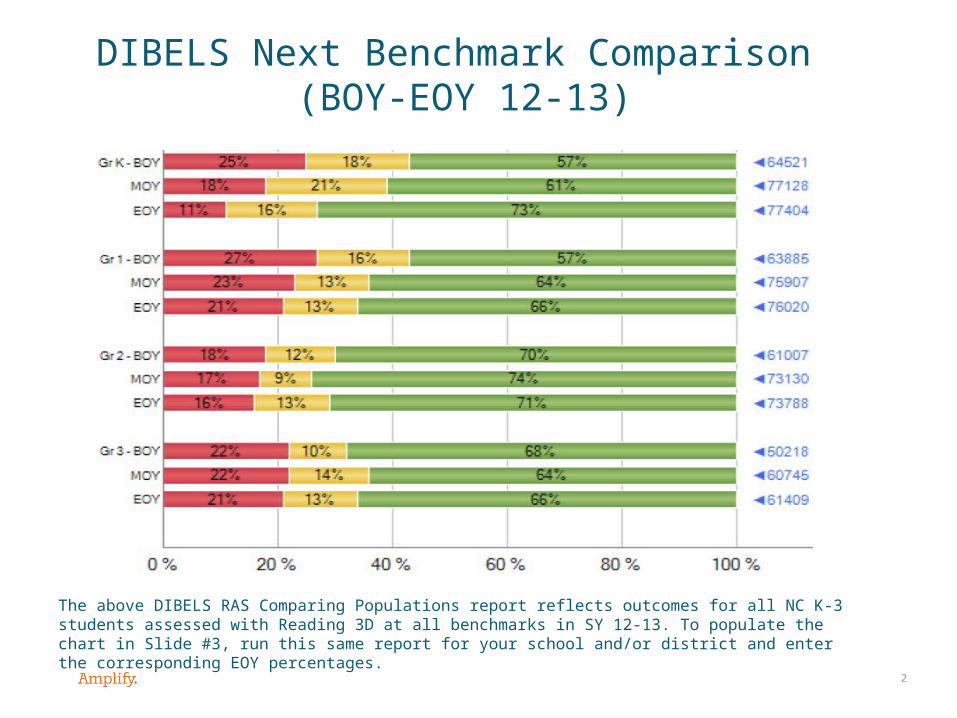
DIBELS Next Benchmark Comparison (BOY-EOY 12-13)
The above DIBELS RAS Comparing Populations report reflects outcomes for all NC K-3 students assessed with Reading 3D at all benchmarks in SY 12-13. To populate the chart in Slide #3, run this same report for your school and/or district and enter the corresponding EOY percentages.

3
DIBELS Next Benchmark Comparison (EOY 12-13)*
• * “State” percentages reflect all NC K-3 students assessed with mCLASS:Reading 3D at EOY 12-13
Grade
Percent of students in each DIBELS instructional category(End of Year 2012-13)
Students at benchmark level
Students below benchmark level
Students well below benchmark level
School/District
State School/District
State School/District
State
Kindergarten 73% 16% 11%
1st Grade 66% 13% 21%
2nd Grade 71% 13% 16%
3rd Grade 66% 13% 21%

4
DIBELS Next Growth Comparison (BOY>EOY 12-13)
The above DIBELS RAS Correlation/Effectiveness report reflects growth outcomes for all NC K-3
students assessed with Reading 3D at BOY and EOY 12-13. To populate the chart in Slides 5-7, run
this same report for your school and/or district and enter the corresponding percentages.
5
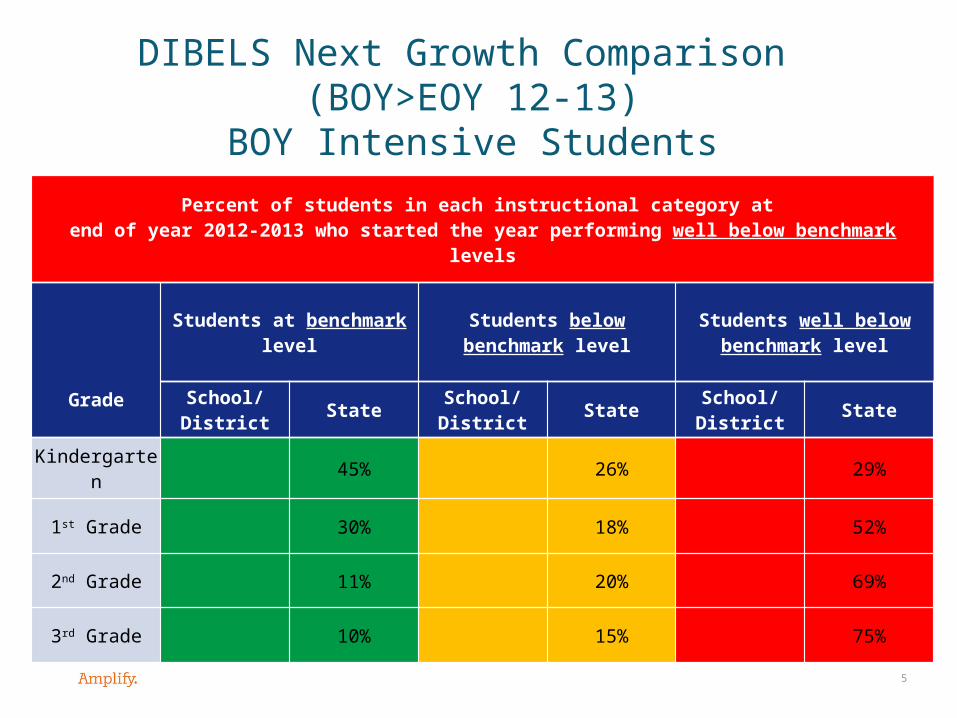
DIBELS Next Growth Comparison (BOY>EOY 12-13)
BOY Intensive Students
Percent of students in each instructional category at end of year 2012-2013 who started the year performing well below benchmark levels
Grade
Students at benchmark level
Students below benchmark level
Students well below benchmark level
School/District
StateSchool/District
StateSchool/District
State
Kindergarten 45% 26% 29%
1st Grade 30% 18% 52%
2nd Grade 11% 20% 69%
3rd Grade 10% 15% 75%
6
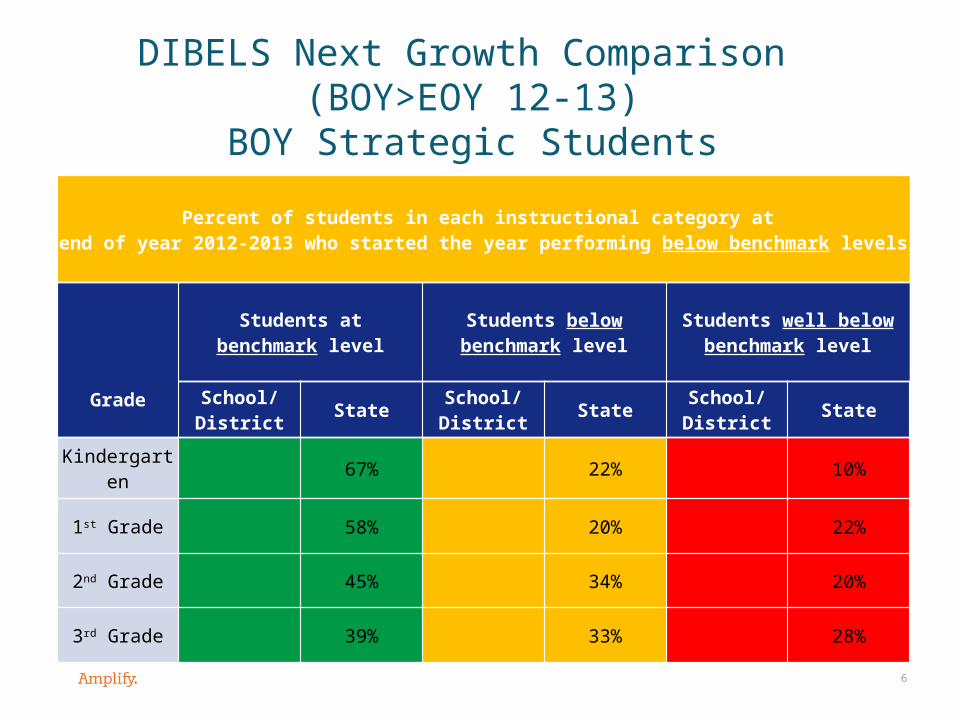
DIBELS Next Growth Comparison (BOY>EOY 12-13)
BOY Strategic Students
Percent of students in each instructional category at end of year 2012-2013 who started the year performing below benchmark levels
Grade
Students at benchmark level
Students below benchmark level
Students well below benchmark level
School/District
StateSchool/District
StateSchool/District
State
Kindergarten 67% 22% 10%
1st Grade 58% 20% 22%
2nd Grade 45% 34% 20%
3rd Grade 39% 33% 28%

7
DIBELS Next Growth Comparison (BOY>EOY 12-13)
BOY Benchmark Students
Percent of students in each instructional category at end of year 2012-2013 who started the year performing at benchmark levels
Grade
Students at benchmark level
Students below benchmark level
Students well below benchmark level
School/District
StateSchool/District
StateSchool/District
State
Kindergarten 89% 9% 2%
1st Grade 84% 10% 6%
2nd Grade 90% 6% 4%
3rd Grade 87% 10% 3%

8
TRC Benchmark Comparison (EOY 12-13)
The above TRC RAS Comparing Populations report reflects outcomes for all NC K-3 students assessed with Reading 3D at EOY 12-13. To populate the chart in Slide 9, run this same report for your school and/or district and enter the corresponding percentages.

9
TRC Benchmark Comparison (EOY 12-13)
Grade
Percent of students in each TRC instructional category(End of Year 2012-13)
Students above proficient
Students proficient
Students below proficient
Students far below proficient
School/District
State School/District
State School/District
State School/District
State
Kindergarten 45% 20% 11% 24%
1st Grade 27% 32% 16% 25%
2nd Grade 34% 30% 9% 27%
3rd Grade 41% 18% 15% 26%

10
TRC Growth Comparison (BOY>EOY 12-13)
The above TRC RAS Correlation/Effectiveness report reflects growth outcomes for all NC K-3 students assessed with Reading 3D at BOY and EOY 12-13. To populate the chart in Slides 11-13, run this same report for your school and/or district and enter the corresponding percentages.

11
TRC Growth Comparison (BOY>EOY 12-13)
BOY Students Far Below Proficient
Percent of students in each instructional category at end of year 2012-2013 who started the year performing far below proficient
Grade
Students above proficient
Students proficient
Students below proficient
Students far below proficient
School/District
StateSchool/District
StateSchool/District
StateSchool/District
State
Kindergarten 12% 18% 15% 55%
1st Grade 5% 20% 19% 56%
2nd Grade 1% 12% 9% 78%
3rd Grade 4% 9% 17% 70%
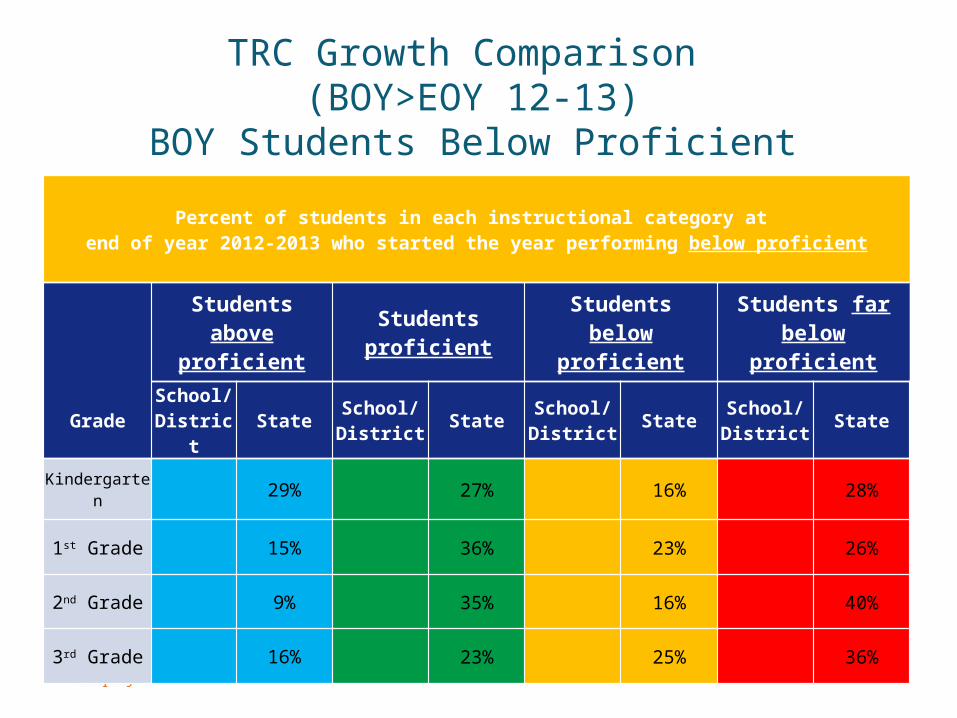
12
TRC Growth Comparison (BOY>EOY 12-13)
BOY Students Below Proficient
Percent of students in each instructional category at end of year 2012-2013 who started the year performing below proficient
Grade
Students above proficient
Students proficient
Students below proficient
Students far below proficient
School/District
StateSchool/District
StateSchool/District
StateSchool/District
State
Kindergarten 29% 27% 16% 28%
1st Grade 15% 36% 23% 26%
2nd Grade 9% 35% 16% 40%
3rd Grade 16% 23% 25% 36%
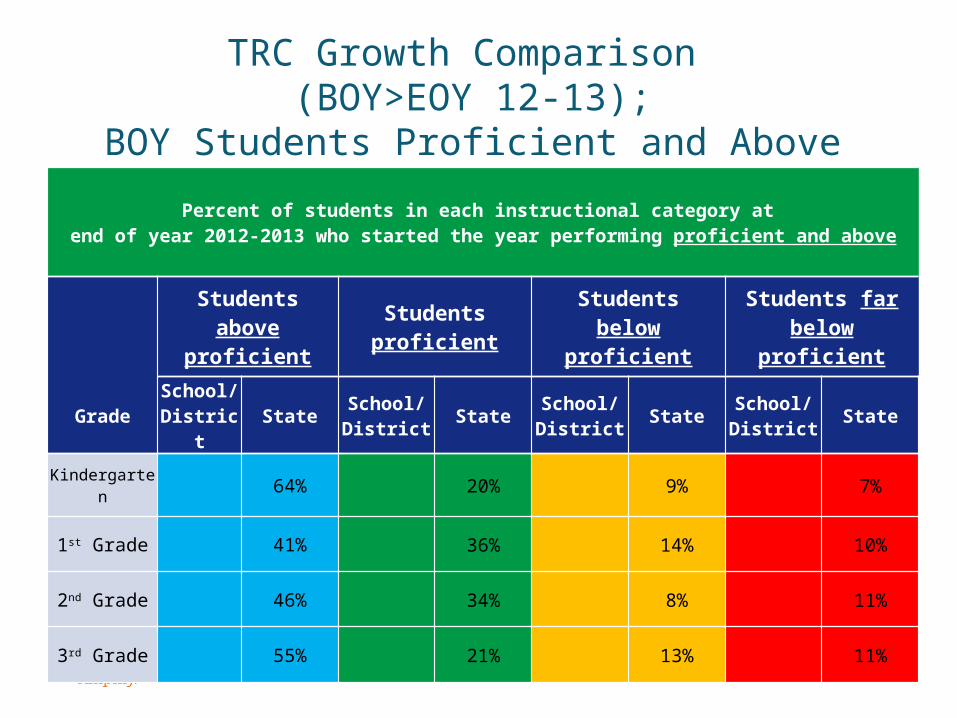
13
TRC Growth Comparison (BOY>EOY 12-13);
BOY Students Proficient and Above
Percent of students in each instructional category at end of year 2012-2013 who started the year performing proficient and above
Grade
Students above proficient
Students proficient
Students below proficient
Students far below proficient
School/District
StateSchool/District
StateSchool/District
StateSchool/District
State
Kindergarten 64% 20% 9% 7%
1st Grade 41% 36% 14% 10%
2nd Grade 46% 34% 8% 11%
3rd Grade 55% 21% 13% 11%
Related Documents