1 N ew Perspectives on Job Satisfaction and W ell-B eing D TI’S FO URTH LABO UR M ARKET RESEARCH CO NFERENCE O RG ANISER:EM PLO YM ENT M ARKET ANALYSIS & RESEARCH (EM AR) 11th December 2006

1 11th December 2006. 2 Happiness and Well-Being Across Nations Prof. David G. Blanchflower Bruce V. Rauner Professor of Economics Dartmouth College,
Dec 25, 2015
Welcome message from author
This document is posted to help you gain knowledge. Please leave a comment to let me know what you think about it! Share it to your friends and learn new things together.
Transcript

1
New Perspectives on Job Satisfaction and Well-Being DTI’S FOURTH LABOUR MARKET RESEARCH CONFERENCE
ORGANISER: EMPLOYMENT MARKET ANALYSIS & RESEARCH (EMAR)
11th December 2006

2
Happiness and Well-Being Across Nations
Prof. David G. Blanchflower
Bruce V. Rauner Professor of EconomicsDartmouth College, NBER and
Bank of England

3
U.S. Declaration of Independence
"We hold these truths to be self-evident, that all men are created equal, that they are endowed by their Creator with certain unalienable rights, that among these are life, liberty and the pursuit of happiness."
July 4, 1776.

4
The dismal science.. no longer
“…I should say, like some we have heard of, no, a dreary, desolate, and indeed, quite abject and distressing one, what we might call, by way of eminence, the dismal science”
Thomas Carlyle, 1849

5
Using random samples of individualsa) Happiness (e.g. the US General Social Survey)
“Taken all together how would you say things are these days – would you say that you are very happy, pretty happy or not too happy?”
b) Life satisfaction (e.g. Eurobarometers)
“On the whole, are you very satisfied, fairly satisfied, not very satisfied, or not at all satisfied with the life you lead?”

6
Reported happiness is correlated with…(1)
• Objective characteristics such as unemployment
• Person’s assessment of happiness by friends and family
• Person’s assessment of happiness by spouse

7
Reported happiness is correlated with…(2)
• Heart rate and blood pressure measures response to stress
• The risk of getting coronary heart disease
• Duration of authentic or Duchenne smiles

8
Reported happiness is correlated with…(3)
• Skin-resistance measures of response to stress
• Electroencephelogram measures of prefrontal brain activity.
9
Some cheery news:
When asked ‘how dissatisfied or satisfied are you with your life overall’, most people say they are happy with their lives

10
The distribution of life satisfaction levels among British people
Source: BHPS, 1997-2003
1=not satisfied at all…7=completely satisfied
0
5
10
15
20
25
30
35
Pe
rce
nta
ge
of
Po
pu
lati
on
1 2 3 4 5 6 7
Self-rated Life Satisfaction
11
Happiness findings
Happiness is high among:
12
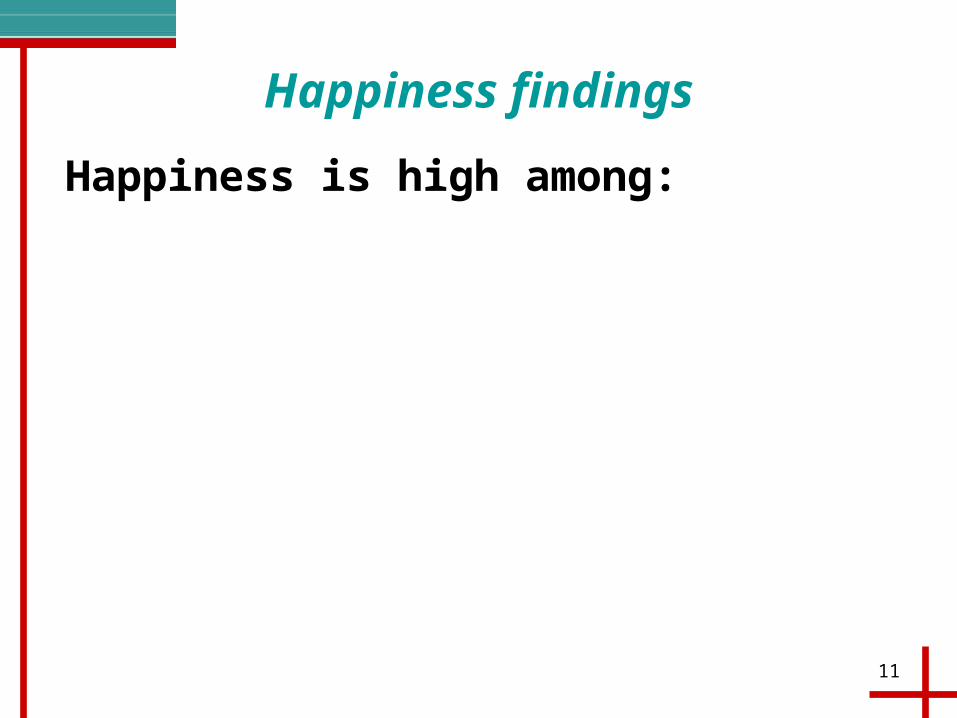
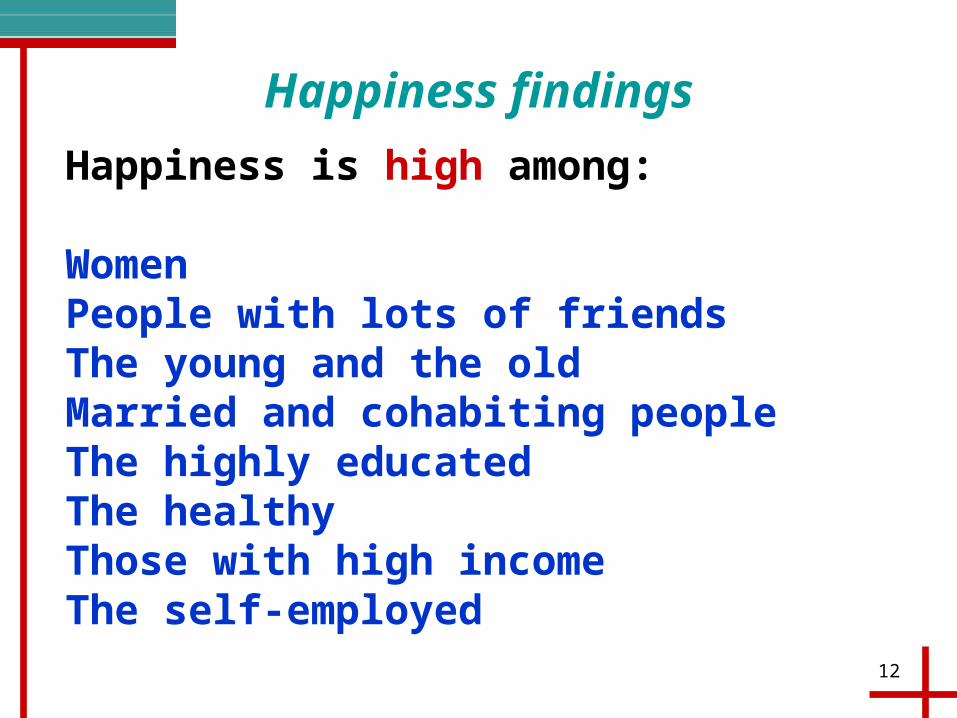
Happiness findings
Happiness is high among:
WomenPeople with lots of friendsThe young and the oldMarried and cohabiting peopleThe highly educatedThe healthyThose with high incomeThe self-employed

13
Happiness findings
Happiness is low among:

14
Happiness findings Happiness is low among:
MenThe unemployedDivorced and separated peopleAdults in their mid to late 40s Minorities and immigrantsThose in poor healthCommuters
15
Statistically, wellbeing is strongly correlated with life
events

16
Two examples
Source: BHPS, 1997-2003. N = 74,481
A) By Employment Status
B) By Marital Status
4.20
4.40
4.60
4.80
5.00
5.20
5.40
Employed Unemployed
Av
era
ge
Lif
e S
ati
sfa
cti
on
4.95
5.00
5.05
5.10
5.15
5.20
5.25
5.30
5.35
5.40
Not Married Married
Av
era
ge
Lif
e S
ati
sfa
cti
on
17
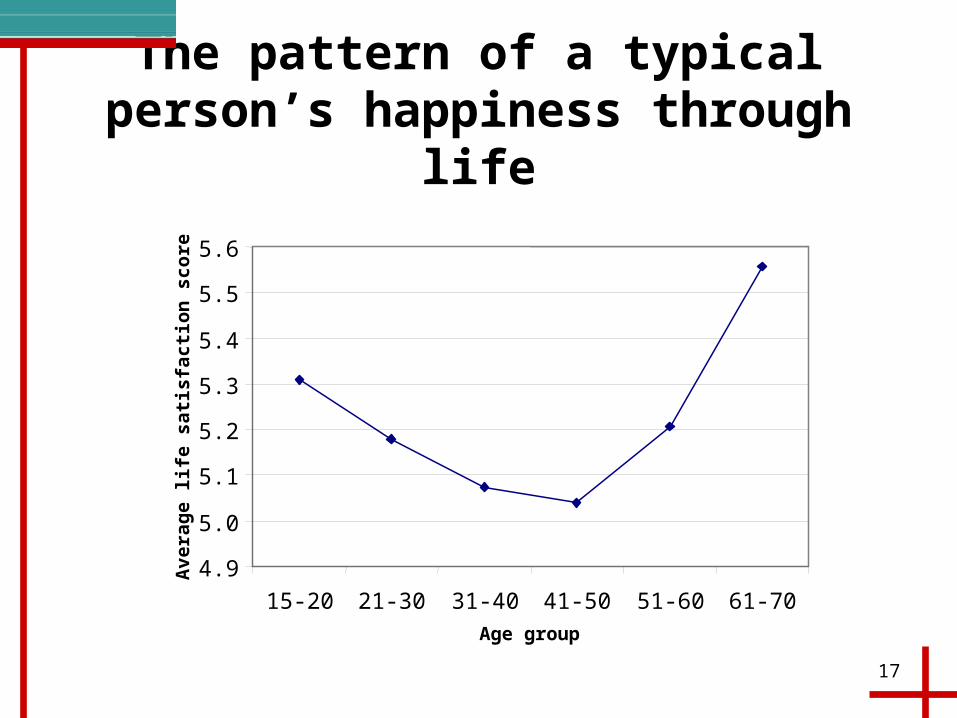
The pattern of a typical person’s happiness through life
4.9
5.0
5.1
5.2
5.3
5.4
5.5
5.6
15-20 21-30 31-40 41-50 51-60 61-70Age group
Ave
rag
e l
ife
sati
sfac
tio
n s
core
18
What about money?

19
What about money?
The data show that richer people are happier and healthier.
But…individuals are less happy if their incomes are far above those of the poorest people
Relative income matters

20
What about money?
It would take a lot of money to ‘compensate’ for unemployment, or a lasting marriage
The money value of events like unemployment and divorce are large.

21
I would like to spend more time with my family (% workers)?
USA 46% New Zealand 26%
Great Britain 36% Switzerland 23%
Sweden 32% Italy 21%
Norway 27% Netherlands 18%
Denmark 26% Japan 9%
Canada 26% Spain 8%
Source: Blanchflower and Oswald (2000a) and International Social Survey Programme, 1997
22
What about happiness in whole countries?
23
Macro-correlates
Happiness is negatively correlated with unemployment

24
Life satisfaction and unemployment
Figure 1. Life satisfaction and Unemployment rate (2003)
Croatia
Turkey
Slovenia
Bulgaria
Poland
Malta
LatviaEstonia
HungarySlovakia
Czech RepublicCyprus
Romania
Austria
PortugalLithuania
Italy FranceBelgium
NetherlandsLuxembourg
Denmark
IrelandUK
Greece
SpainFinland
Sweden
2
2.2
2.4
2.6
2.8
3
3.2
3.4
3.6
3.8
3 4 5 6 7 8 9 10 11 12 13 14 15 16 17 18 19 20
25
Macro-correlates
Happiness is also negatively correlated with inflation

26
Life satisfaction and inflationFigure 2. Life satisfaction and Inflation (HICP, 12-month average, Dec 2003)
Croatia
Turkey
Slovenia
Bulgaria
Poland
Malta
LatviaEstonia
HungarySlovakia
Czech RepublicCyprus
Romania
Austria
PortugalLithuania
ItalyFranceBelgium
NetherlandsLuxembourg
Denmark
IrelandUK
Greece
SpainFinland
Sweden
2
2.2
2.4
2.6
2.8
3
3.2
3.4
3.6
3.8
0 1 2 3 4 5 6 7 8 9 10 11 12 13 14 15 16 17 18 19 20 21 22 23 24 25 26 27 28

27
Happiness and Growth
When a nation is poor, extra riches do raise happiness.
28
When a nation is poor, extra riches do raise happiness.
Say we look at a scatter plot across many countries:

29
TZA
NGA
UGA
MDA
BGD
PAKGEO
VNM
ZWE
IND
ARM
IDN
AZE
MAR
EGY
PHL
JOR
ALB
CHN
UKR
SLV
PER
VEN
BLR
BIHDZA
COL
TUR
MKD
IRN
DOM
ROMBGR
URYBRA
RUS
MEX
LVA
CHL
ZAF
HRV
LTU
POL
ARG
ESTSVK
HUN
CZE
KOR
MLT
PRTSVN
GRC
ISRESP
NZL
SGP
SWEGBRITA
FIN
JPN
FRA
DEUBEL
NLDAUTISLCAN
CHEDNK
USA
IRL
NORLUX
Australia
4
5
6
7
8
Life
Sat
isfa
ctio
n, W
VS
Ave
rage
Sco
re (
1='D
issa
tisfie
d' to
10=
'Sat
isfie
d')
2000 5000 10000 20000 35000 60000
GDP per capita in US$ at PPP (log scale)
Life Satisfaction = -0.9 + 0.8 * Log GDP (t=8.3)World Values Survey
Figure 3. Life Satisfaction and GDP Per Capita

30
Poor countries
• Growth in income in poorer countries is correlated with growth in happiness
• Evidence is particularly strong in South America since 1997.

31
South America life satisfaction - 4 point scale
1997 2004
Argentina 2.14 2.92Bolivia 1.97 2.40Brazil 2.38 2.67Chile 2.32 2.80Columbia 2.50 3.14Mexico 2.61 2.96Uruguay 2.40 2.73Venezuela 2.45 3.26Source: World Database of Happiness http://www1.eur.nl/fsw/happiness/hap_nat/nat_fp.htm

32
Eastern Europe life satisfaction - 4 point scale
2001 2004
Czech Republic 2.14 2.92Hungary 2.54 2.52Latvia 2.54 2.64Lithuania 2.29 2.52Poland 2.65 2.78Romania 2.12 2.38 Slovakia 2.48 2.65Slovenia 3.04 3.10 Source: World Database of Happiness http://www1.eur.nl/fsw/happiness/hap_nat/nat_fp.htm

33
Yet
• Growth in income in richer countries is not correlated with growth in happiness
• This is the “Easterlin paradox”

34
Figure 4. 1995/2000 World Values Survey results
Life Satisfaction World Values Survey
Tanz
Nig
Uga
MOL
BAN
PAK
ZIM
Vietnam
India
MOR
ARM
ALB
SALV Ven
Ukr
AlgMacBela
Bosn
Colombia
Dom
Iran
Bulgaria
Bra
Rom
Uru
Mexico
Rus
S.AFR
Chile
Lat
CROA
Arg
Lit
ESTSloHun
MALT
CzePORTSlovenia GRE
New Zealand
IsrSpaSINGerItaly FRA
SWEFinAustralia UKBelgCan
DenNetherlands Austria ICESwi
NorUSIrl
0
1
2
3
4
5
6
7
8
9
0 5,000 10,000 15,000 20,000 25,000 30,000 35,000 40,000GDP per capita, PPP (constant 2000 international $)
IND
EX
the western countries

35
Figure 5. Average Happiness and Real GDP per Capita for repeated cross-sections of Americans.
1.8
22.
22.
42.
6M
ean
Ha
ppin
ess
150
0018
000
210
0024
000
Rea
l GD
P p
er C
apita
1975 1980 1985 1990 1995Year
Real GDP per Capita Mean Happiness

36
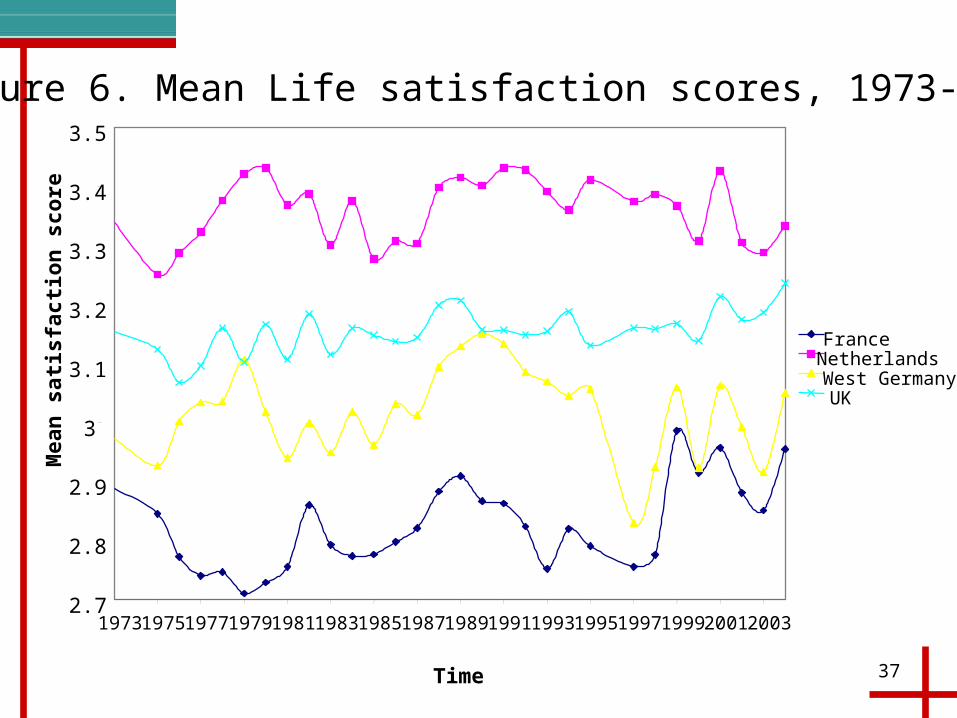
Wellbeing is flat through time in the other rich countries
37
Figure 6. Mean Life satisfaction scores, 1973-2004
2.7
2.8
2.9
3
3.1
3.2
3.3
3.4
3.5
1973197519771979198119831985198719891991199319951997199920012003
Time
Mea
n s
atis
fact
ion
sco
re
FranceNetherlandsWest GermanyUK

38
and
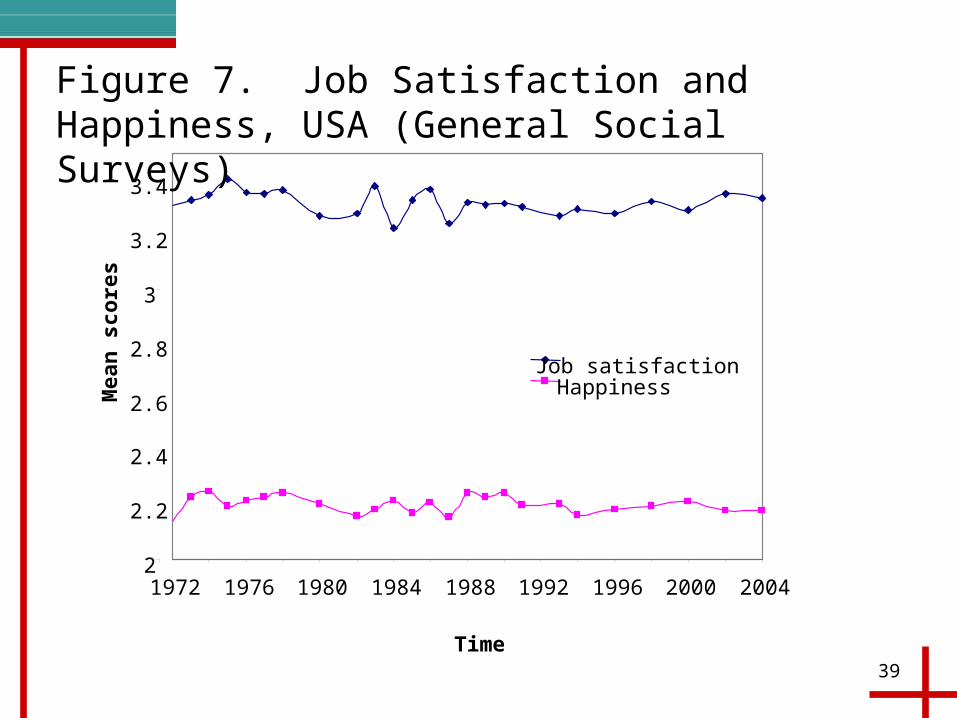
In the USA both job satisfaction (scale 1-4) and happiness (scale 1-3) have been flat since 1972
39
Figure 7. Job Satisfaction and Happiness, USA (General Social Surveys)
2
2.2
2.4
2.6
2.8
3
3.2
3.4
1972 1976 1980 1984 1988 1992 1996 2000 2004
Time
Mea
n s
core
s
Job satisfactionHappiness
40
Are there diminishing returns to real income?

41
Are there diminishing returns to real income?
Very probably yes.

42
What, exactly, goes wrong when a wealthy country gets richer?
We are not certain, but..

43
Some clues…
• Social comparison (you compare your 3 BMWs to people with 3 BMWs)
• Habituation: people adapt to money
• Mistaken choices (long commutes and working hours)

44
Social Comparisons

45
‘Happy’ countries
Denmark Ireland
Austria Norway
Sweden United States
Chile Switzerland
Mexico Netherlands

46
‘Unhappy’ countries
Lithuania Poland
Latvia Hungary
Slovakia Russia
Czech Republic Italy
Turkey Bulgaria

47
Blood pressure
• Denmark has the lowest reported levels of high blood pressure in our data
• Denmark also has the highest happiness levels
• Portugal has the highest reported blood pressure levels and the lowest levels of life satisfaction and happiness
Source: Blanchflower, D.G. and A.J. Oswald (2006d), "Hypertension and happiness across nations", working paper.

48
What is the evidence then for the UK?
• Happiness and life satisfaction
• Job satisfaction
• General health
• Depression and anxiety
• Suicide
49
UK happiness ranking
UK usually ranks below
Denmark SwedenNetherlands IrelandLuxembourg United StatesAustria New ZealandJapan Switzerland
50
UK happiness ranking
UK usually ranks above
Former Soviet bloc countriesBelgiumFrancePortugalSpainItalyGermany
51
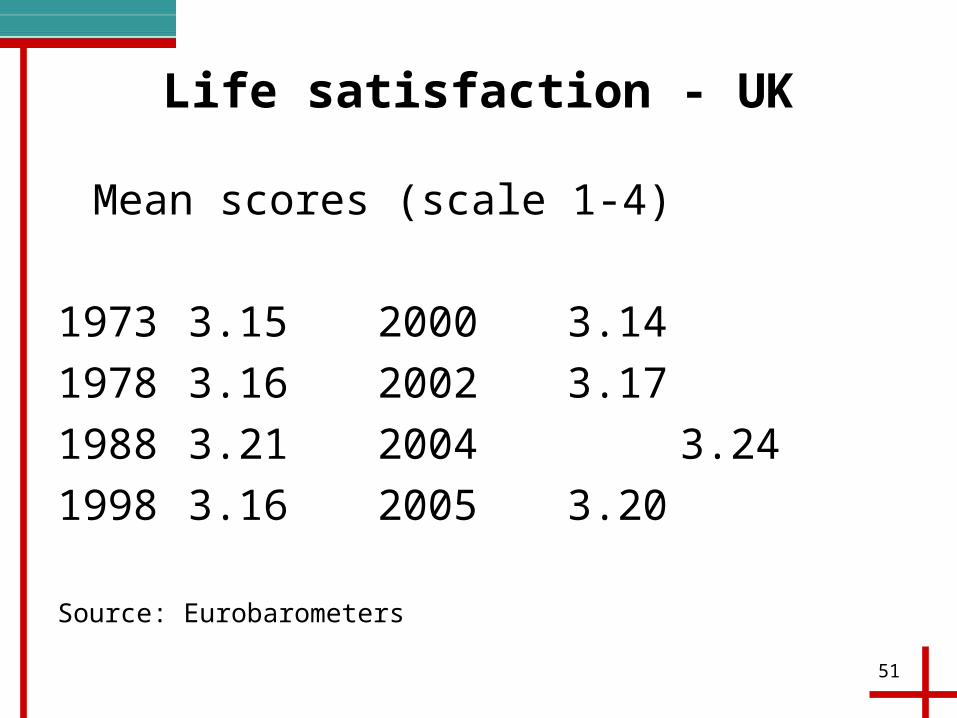
Life satisfaction - UK
Mean scores (scale 1-4)
1973 3.15 2000 3.14
1978 3.16 2002 3.17
1988 3.21 2004 3.24
1998 3.16 2005 3.20
Source: Eurobarometers
52
and
• Job satisfaction in the UK (and Germany) has fallen over time
• Job satisfaction trends in the Netherlands, Finland, Belgium, Austria, Denmark, France, Spain, Italy, Portugal and Greece are all approximately flat
*Francis Green and Nicholas Tsitsianis ‘Can the changing nature of jobs account for national trends in job satisfaction’,
53
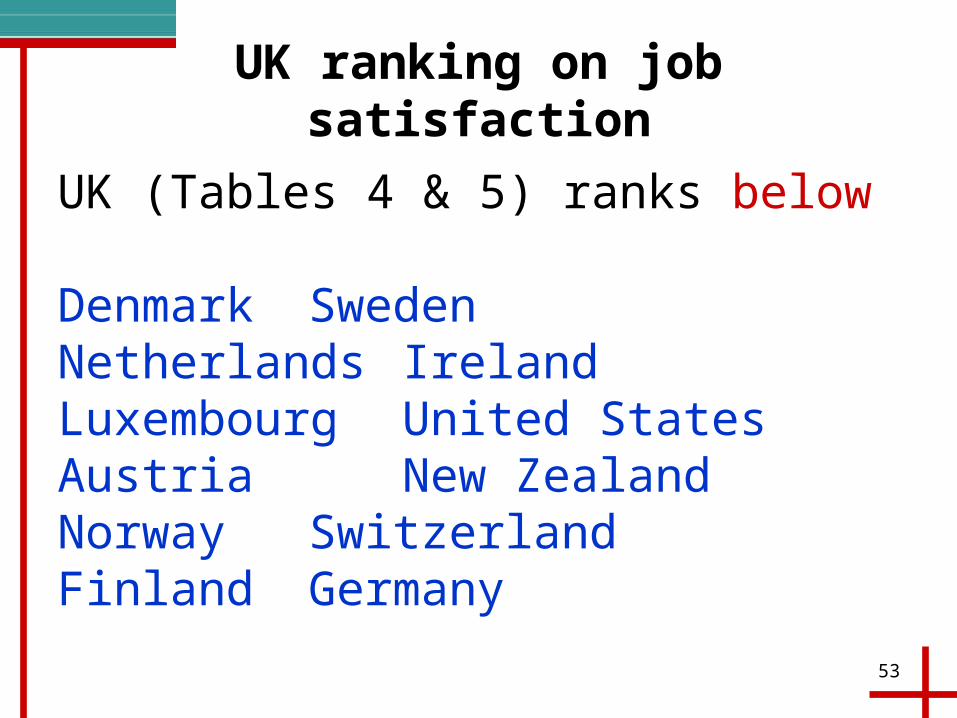
UK ranking on job satisfaction
UK (Tables 4 & 5) ranks below
Denmark SwedenNetherlands IrelandLuxembourg United StatesAustria New ZealandNorway SwitzerlandFinland Germany

54
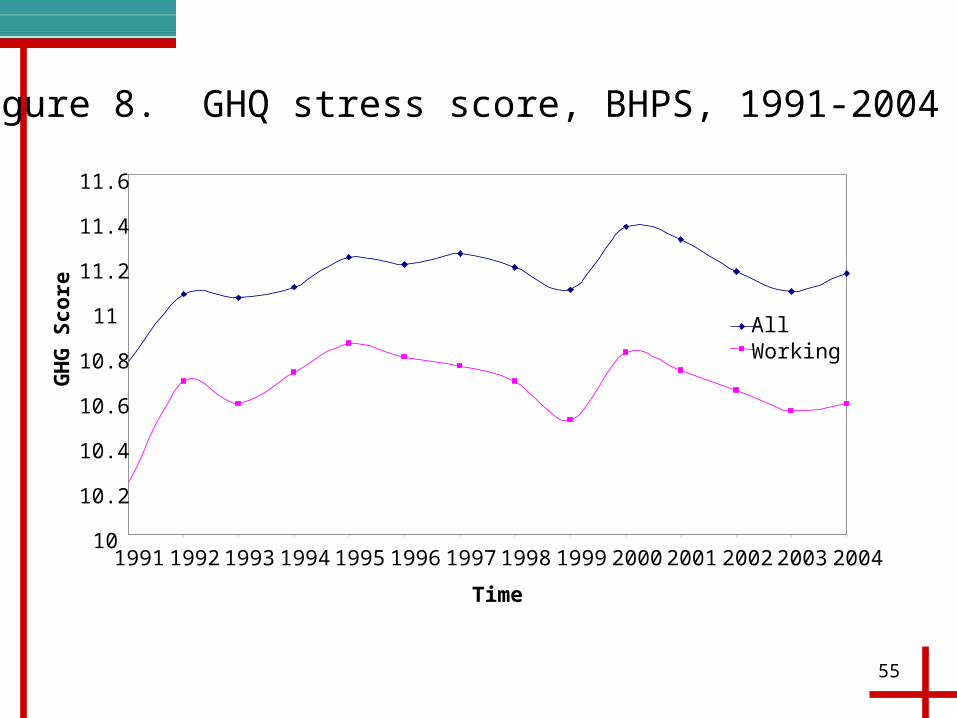
GHQ Scores - UK
• Stress as measured by the GHQ score has increased over time
• 199110.77 2001 11.31
• 199711.25 2002 11.17
• 200011.37 2004 11.16
Source: BHPS
55
Figure 8. GHQ stress score, BHPS, 1991-2004
10
10.2
10.4
10.6
10.8
11
11.2
11.4
11.6
1991 1992 1993 1994 1995 1996 1997 1998 1999 2000 2001 2002 2003 2004
Time
GH
G S
core
AllWorking

56
Self-reported health - UK
Self-perceptions of health have been roughly constant since 1977 (GHS)
Good Fairly Good Not good• 1977 58 30 12• 1987 60 28 12• 1995 60 26 14• 1998 60 27 14• 2001 59 27 14• 2003 59 27 14
Source: General Household Survey, 1977-2003 and www.statistics.gov.uk/StatBase/Expodata/Spreadsheet/D8779.xls

57
Figure 9. Health problems lasting more than 12 months
Source:
% of all employees
17
18
19
20
21
22
23
2000 2001 2002 2003 2004 2005 2006
Health problems lasting
more than 12 months

58
Prevalence of neurotic disorders
1993 2000• Sleep problems 25 29*• Depression 10 12*• Concentration & forgetfulness 8 10*• Depressive ideas 9 10*• Worry about physical health 5 7*• Obsessions 9 6*• Compulsions 6 3*
• Source: Singleton et al (2001), Psychiatric Morbidity among Adults living in Private Households, 2000, Table 3.1. * implies difference is significant at 95% level.

59
Figure 10. Trends in health problems and disability amongst employees
Source:
Percentage of all employees
(LFS, spring quarters)
0%
4%
8%
12%
16%
20%
24%
1998 2000 2002 2004 2006
0.0%
0.2%
0.4%
0.6%
0.8%
1.0%Health problems (lhs)
A current disability (lhs)
Depression, nerves, mental illness, etc (rhs)

60
Treatment/diagnosis of mental ill-health have increased
• Number of prescription items for anti-depressant drugs has increased from 9 million in 1991 to 27.7 million in 2003 (Social Trends, 36)
• Out of 407,000 receiving Disability Living Allowance in Feb 2005 15.2% were due to ‘mental health causes’
• But…23.2% of new awards of DLA in year to Feb 2005
Source: Disability Living Allowance Quarterly Statistics, Table 1, February 2005. Department of Work and Pensions

61
Treatments for mental disorders increased in the 1990s
Depression Anxiety Men Women Men Women
1994 19.9 50.5 17.8 41.71996 25.0 60.8 20.9 47.41998 29.0 70.1 23.8 54.4
(rates/1000 patients)
Source: Bajekal, M. V. Osborne, M. Yar and H. Meltzer (2006), Focus on health, Palgrave, Macmillan, ONS

62
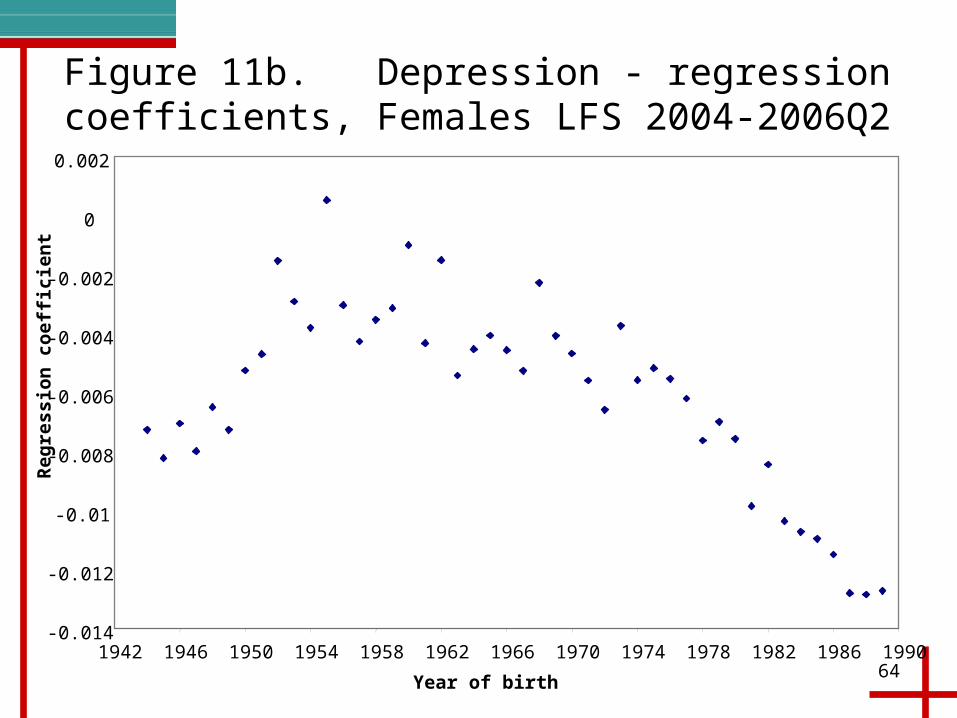
‘Depression, bad nerves or anxiety’
• The proportion of the working population in the LFS that self-report suffering from ‘depression, bad nerves or anxiety’ has increased
UK Scotland• 1998 0.93% 1.33%• 2000 1.08% 1.34%• 2002 1.40% 1.92%• 2004 1.65% 2.03%• 2006Q1&2 1.66% 2.19%

63
Figure 11a. Depression - regression coefficients, Males LFS 2004-2006Q2
-0.01
-0.005
0
0.005
0.01
0.015
0.02
1938 1942 1946 1950 1954 1958 1962 1966 1970 1974 1978 1982 1986 1990
Year of birth
Reg
ress
ion
co
effi
cien
t
64
-0.014
-0.012
-0.01
-0.008
-0.006
-0.004
-0.002
0
0.002
1942 1946 1950 1954 1958 1962 1966 1970 1974 1978 1982 1986 1990
Figure 11b. Depression - regression coefficients, Females LFS 2004-2006Q2
Year of birth
Reg
ress
ion
co
effi
cien
t
65
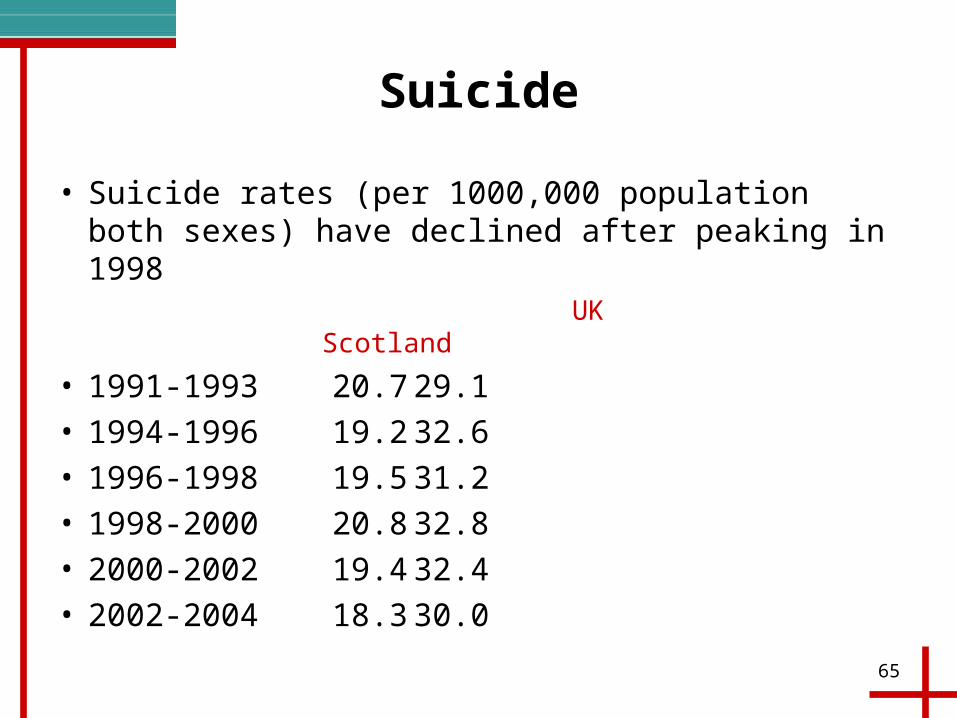
Suicide
• Suicide rates (per 1000,000 population both sexes) have declined after peaking in 1998
UK Scotland
• 1991-1993 20.7 29.1• 1994-1996 19.2 32.6• 1996-1998 19.5 31.2• 1998-2000 20.8 32.8• 2000-2002 19.4 32.4• 2002-2004 18.3 30.0
66
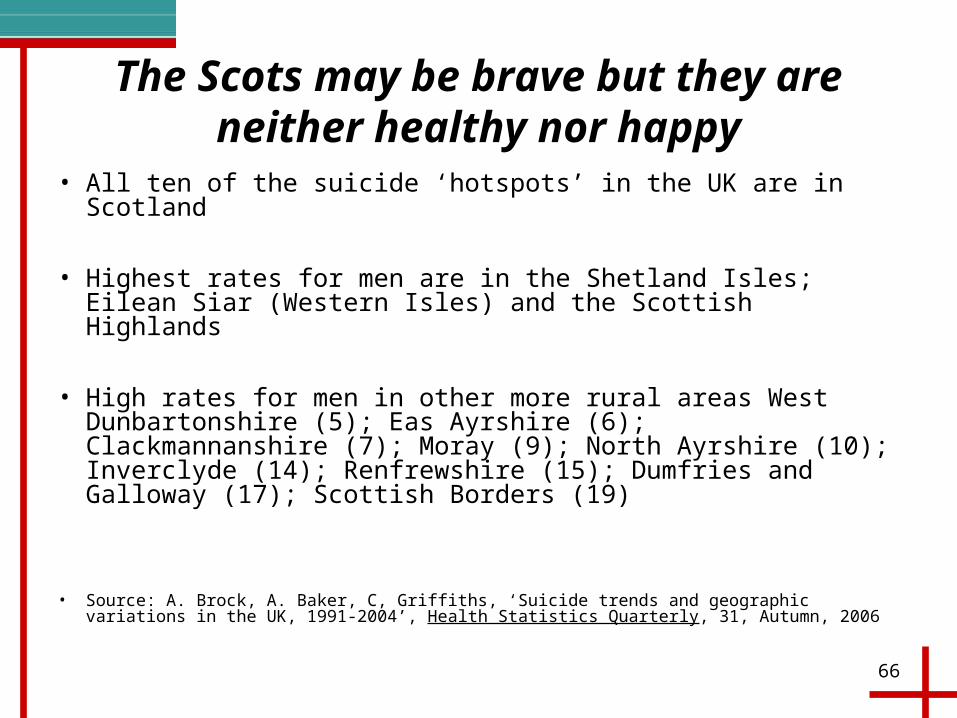
The Scots may be brave but they are neither healthy nor happy
• All ten of the suicide ‘hotspots’ in the UK are in Scotland
• Highest rates for men are in the Shetland Isles; Eilean Siar (Western Isles) and the Scottish Highlands
• High rates for men in other more rural areas West Dunbartonshire (5); Eas Ayrshire (6); Clackmannanshire (7); Moray (9); North Ayrshire (10); Inverclyde (14); Renfrewshire (15); Dumfries and Galloway (17); Scottish Borders (19)
• Source: A. Brock, A. Baker, C, Griffiths, ‘Suicide trends and geographic variations in the UK, 1991-2004’, Health Statistics Quarterly, 31, Autumn, 2006
67
Summing up
Given our current real income levels:
Growth is not making the industrialized nations happier.

68
The natural conclusion
Policy in the coming century will likely need to concentrate more on non-materialistic goals including health and well-being
Related Documents