1 Nonparametric Methods Nonparametric Methods Sign Test Sign Test Wilcoxon Signed-Rank Test Wilcoxon Signed-Rank Test Mann-Whitney-Wilcoxon Test Mann-Whitney-Wilcoxon Test Kruskal-Wallis Test Kruskal-Wallis Test Rank Correlation Rank Correlation

Welcome message from author
This document is posted to help you gain knowledge. Please leave a comment to let me know what you think about it! Share it to your friends and learn new things together.
Transcript

1 1 Slide
Slide
Nonparametric Methods Nonparametric Methods
Sign TestSign Test Wilcoxon Signed-Rank TestWilcoxon Signed-Rank Test Mann-Whitney-Wilcoxon TestMann-Whitney-Wilcoxon Test Kruskal-Wallis TestKruskal-Wallis Test Rank CorrelationRank Correlation

2 2 Slide
Slide
Most of the statistical methods referred to as Most of the statistical methods referred to as parametric require the use of parametric require the use of intervalinterval- or - or ratio-ratio-scaled datascaled data..
Nonparametric methods are often the only Nonparametric methods are often the only way to analyze way to analyze nominalnominal or or ordinal dataordinal data and and draw statistical conclusions.draw statistical conclusions.
Nonparametric methods require no Nonparametric methods require no assumptions about the population probability assumptions about the population probability distributions.distributions.
Nonparametric methods are often called Nonparametric methods are often called distribution-free methodsdistribution-free methods..
Nonparametric MethodsNonparametric Methods
3 3 Slide
Slide
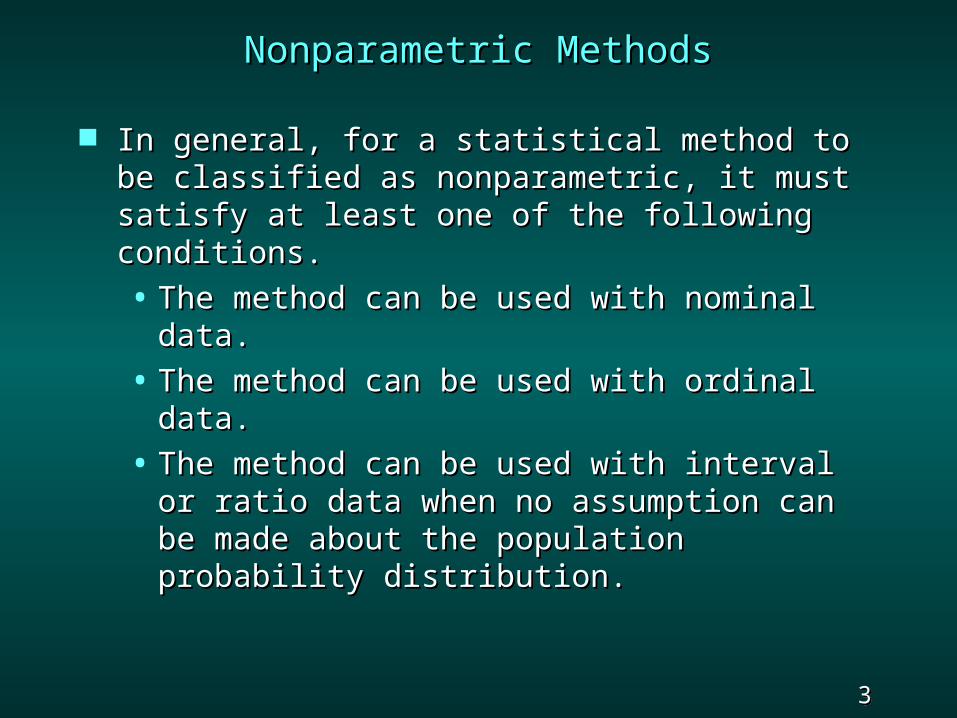
Nonparametric MethodsNonparametric Methods
In general, for a statistical method to be In general, for a statistical method to be classified as nonparametric, it must satisfy at classified as nonparametric, it must satisfy at least one of the following conditions.least one of the following conditions.
• The method can be used with nominal data.The method can be used with nominal data.
• The method can be used with ordinal data.The method can be used with ordinal data.
• The method can be used with interval or The method can be used with interval or ratio data when no assumption can be made ratio data when no assumption can be made about the population probability about the population probability distribution.distribution.

4 4 Slide
Slide
Sign TestSign Test
A common application of the A common application of the sign testsign test involves involves using a sample of using a sample of n n potential customers to potential customers to identify a preference for one of two brands of a identify a preference for one of two brands of a product.product.
The objective is to determine whether there is The objective is to determine whether there is a difference in preference between the two a difference in preference between the two items being compared.items being compared.
To record the preference data, we use a plus To record the preference data, we use a plus sign if the individual prefers one brand and a sign if the individual prefers one brand and a minus sign if the individual prefers the other minus sign if the individual prefers the other brand.brand.
Because the data are recorded as plus and Because the data are recorded as plus and minus signs, this test is called the sign test.minus signs, this test is called the sign test.

5 5 Slide
Slide
Example: Peanut Butter Taste TestExample: Peanut Butter Taste Test
Sign Test: Large-Sample CaseSign Test: Large-Sample Case
As part of a market research study, a sample of 36 As part of a market research study, a sample of 36
consumers were asked to taste two brands of peanutconsumers were asked to taste two brands of peanut
butter and indicate a preference. Do the data shownbutter and indicate a preference. Do the data shown
below indicate a significant difference in the consumerbelow indicate a significant difference in the consumer
preferences for the two brands?preferences for the two brands?
18 18 preferred Hoppy Peanut Butter (+ sign recorded) preferred Hoppy Peanut Butter (+ sign recorded)
1212 preferred Pokey Peanut Butter ( preferred Pokey Peanut Butter (__ sign recorded) sign recorded)
66 had no preference had no preference
The analysis is based on a sample size of 18 + 12 = 30.The analysis is based on a sample size of 18 + 12 = 30.

6 6 Slide
Slide
HypothesesHypotheses
HH00: No preference for one brand over the other : No preference for one brand over the other existsexists
HHaa: A preference for one brand over the other : A preference for one brand over the other
existsexists Sampling DistributionSampling Distribution
2.742.74
Sampling distribution of the number of “+” values if there is no brand preference
Sampling distribution of the number of “+” values if there is no brand preference
= 15 = .5(30)= 15 = .5(30)
Example: Peanut Butter Taste TestExample: Peanut Butter Taste Test
7 7 Slide
Slide
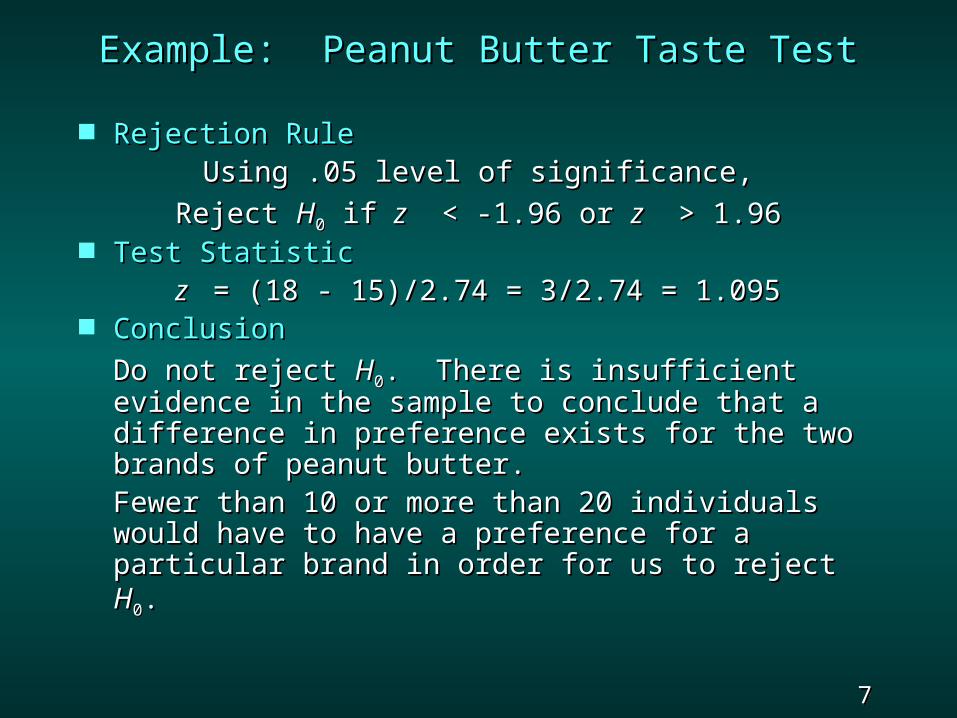
Example: Peanut Butter Taste TestExample: Peanut Butter Taste Test
Rejection RuleRejection RuleUsing .05 level of significance,Using .05 level of significance,
Reject Reject HH00 if if zz < -1.96 or < -1.96 or zz > 1.96 > 1.96 Test StatisticTest Statistic
z z = (18 - 15)/2.74 = 3/2.74 = 1.095 = (18 - 15)/2.74 = 3/2.74 = 1.095 ConclusionConclusion
Do not reject Do not reject HH00. There is insufficient . There is insufficient evidence in the sample to conclude that a evidence in the sample to conclude that a difference in preference exists for the two difference in preference exists for the two brands of peanut butter. brands of peanut butter.
Fewer than 10 or more than 20 individuals Fewer than 10 or more than 20 individuals would have to have a preference for a particular would have to have a preference for a particular brand in order for us to reject brand in order for us to reject HH00..

8 8 Slide
Slide
Wilcoxon Signed-Rank TestWilcoxon Signed-Rank Test
This test is the nonparametric alternative to This test is the nonparametric alternative to the parametric matched-sample test the parametric matched-sample test presented in Chapter 10.presented in Chapter 10.
The methodology of the parametric matched-The methodology of the parametric matched-sample analysis requires:sample analysis requires:• interval data, andinterval data, and• the assumption that the population of the assumption that the population of
differences between the pairs of differences between the pairs of observations is normally distributed.observations is normally distributed.
If the assumption of normally distributed If the assumption of normally distributed differences is not appropriate, the Wilcoxon differences is not appropriate, the Wilcoxon signed-rank test can be used.signed-rank test can be used.

9 9 Slide
Slide
Example: Express DeliveriesExample: Express Deliveries
Wilcoxon Signed-Rank TestWilcoxon Signed-Rank Test
A firm has decided to select one of two express A firm has decided to select one of two express
delivery services to provide next-day deliveries to thedelivery services to provide next-day deliveries to the
district offices.district offices.
To test the delivery times of the two services, the To test the delivery times of the two services, the firmfirm
sends two reports to a sample of 10 district offices, withsends two reports to a sample of 10 district offices, with
one report carried by one service and the other reportone report carried by one service and the other report
carried by the second service.carried by the second service.
Do the data (delivery times in hours) on the nextDo the data (delivery times in hours) on the next
slide indicate a difference in the two services?slide indicate a difference in the two services?

10 10 Slide
Slide
Example: Express DeliveriesExample: Express Deliveries
District OfficeDistrict Office OvernightOvernight NiteFliteNiteFlite
SeattleSeattle 32 hrs. 32 hrs. 25 hrs. 25 hrs.
Los AngelesLos Angeles 3030 2424
BostonBoston 1919 1515
ClevelandCleveland 1616 1515
New YorkNew York 1515 1313
HoustonHouston 1818 1515
AtlantaAtlanta 1414 1515
St. LouisSt. Louis 1010 88
MilwaukeeMilwaukee 77 99
DenverDenver 1616 1111

11 11 Slide
Slide
Wilcoxon Signed-Rank TestWilcoxon Signed-Rank Test
Preliminary Steps of the TestPreliminary Steps of the Test• Compute the differences between the Compute the differences between the
paired observations.paired observations.• Discard any differences of zero.Discard any differences of zero.• Rank the absolute value of the differences Rank the absolute value of the differences
from lowest to highest. Tied differences are from lowest to highest. Tied differences are assigned the average ranking of their assigned the average ranking of their positions.positions.
• Give the ranks the sign of the original Give the ranks the sign of the original difference in the data.difference in the data.
• Sum the signed ranks.Sum the signed ranks.. . . next we will determine whether the sum . . . next we will determine whether the sum is significantly different from zero.is significantly different from zero.

12 12 Slide
Slide
Example: Express DeliveriesExample: Express Deliveries
District Office Differ. |Diff.| Rank District Office Differ. |Diff.| Rank Sign. RankSign. Rank
SeattleSeattle 77 1010 +10+10Los AngelesLos Angeles 66 99 +9+9BostonBoston 44 77 +7+7ClevelandCleveland 11 1.51.5 +1.5+1.5New YorkNew York 22 44 +4+4HoustonHouston 33 66 +6+6AtlantaAtlanta -1-1 1.51.5 -1.5-1.5St. LouisSt. Louis 22 44 +4+4MilwaukeeMilwaukee -2-2 44 -4-4DenverDenver 55 88 +8+8
+44+44

13 13 Slide
Slide
HypothesesHypotheses
HH00: The delivery times of the two services are : The delivery times of the two services are the the
same; neither offers faster service than same; neither offers faster service than the other.the other.
HHaa: Delivery times differ between the two : Delivery times differ between the two
services; services;
recommend the one with the recommend the one with the smaller times.smaller times.
Sampling DistributionSampling Distribution
Sampling distribution of T if populations are identical
Sampling distribution of T if populations are identical 19.6219.62
TT = 0 = 0TT
Example: Express DeliveriesExample: Express Deliveries

14 14 Slide
Slide
Rejection RuleRejection Rule
Using .05 level of significance,Using .05 level of significance,
Reject Reject HH00 if if zz < -1.96 or < -1.96 or zz > 1.96 > 1.96 Test StatisticTest Statistic
zz = ( = (TT - - T T )/)/TT = (44 - 0)/19.62 = 2.24 = (44 - 0)/19.62 = 2.24 ConclusionConclusion
Reject Reject HH00. There is sufficient evidence in . There is sufficient evidence in the sample to conclude that a difference exists the sample to conclude that a difference exists in the delivery times provided by the two in the delivery times provided by the two services. Recommend using the NiteFlite services. Recommend using the NiteFlite service. service.
Example: Express DeliveriesExample: Express Deliveries
15 15 Slide
Slide
Mann-Whitney-Wilcoxon TestMann-Whitney-Wilcoxon Test
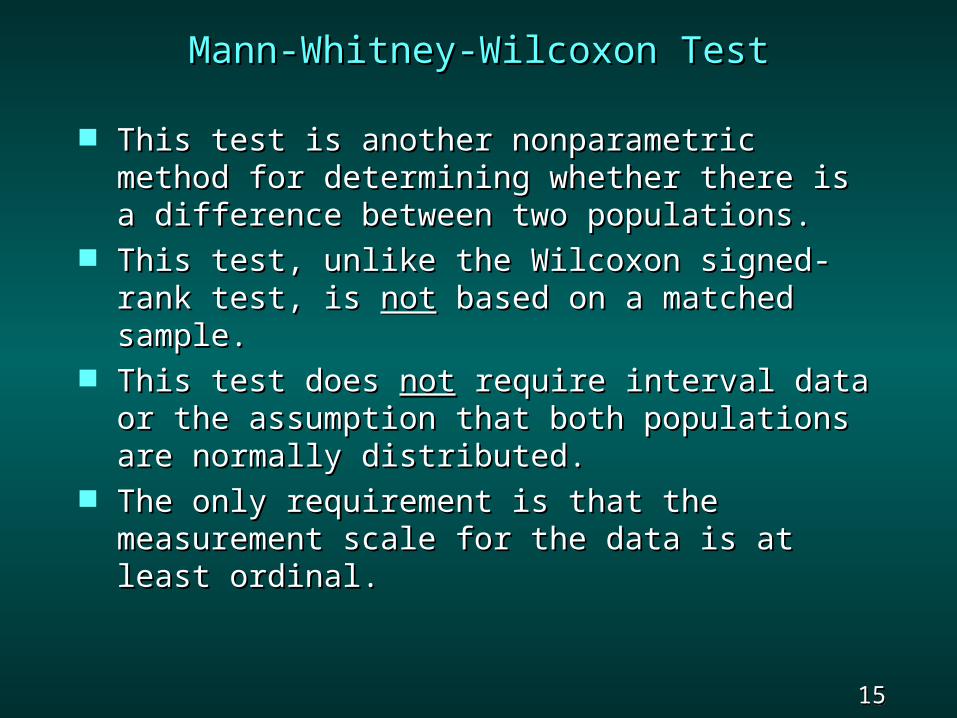
This test is another nonparametric method for This test is another nonparametric method for determining whether there is a difference determining whether there is a difference between two populations.between two populations.
This test, unlike the Wilcoxon signed-rank test, This test, unlike the Wilcoxon signed-rank test, is is notnot based on a matched sample. based on a matched sample.
This test does This test does notnot require interval data or the require interval data or the assumption that both populations are normally assumption that both populations are normally distributed.distributed.
The only requirement is that the measurement The only requirement is that the measurement scale for the data is at least ordinal.scale for the data is at least ordinal.
16 16 Slide
Slide
Mann-Whitney-Wilcoxon TestMann-Whitney-Wilcoxon Test
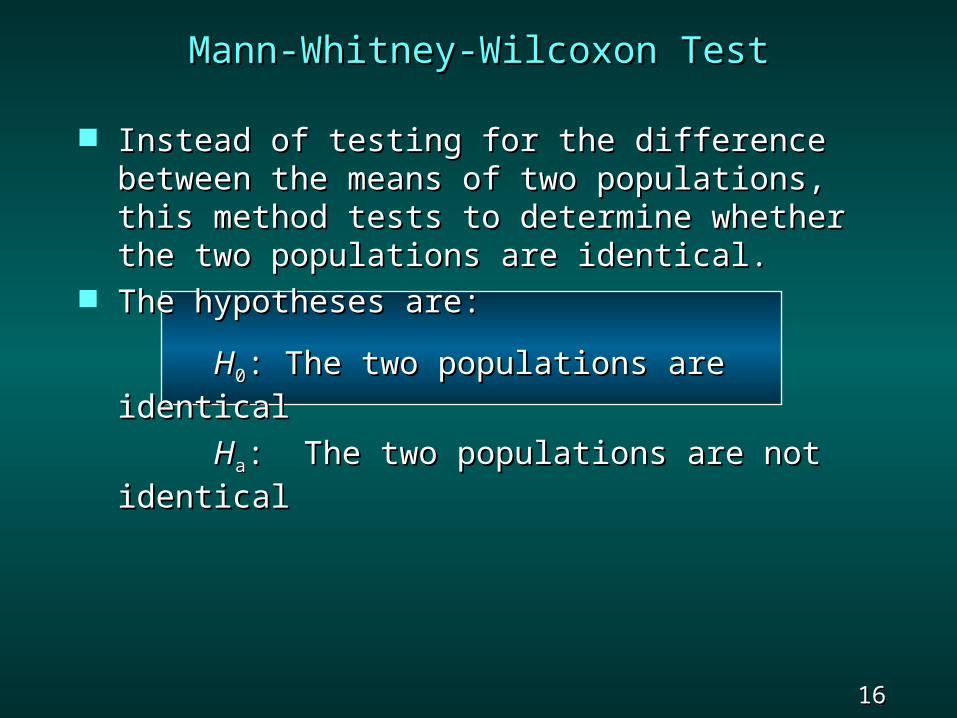
Instead of testing for the difference between Instead of testing for the difference between the means of two populations, this method the means of two populations, this method tests to determine whether the two tests to determine whether the two populations are identical.populations are identical.
The hypotheses are:The hypotheses are:
HH00: The two populations are identical: The two populations are identical
HHaa: The two populations are not identical: The two populations are not identical

17 17 Slide
Slide
Example: Westin FreezersExample: Westin Freezers
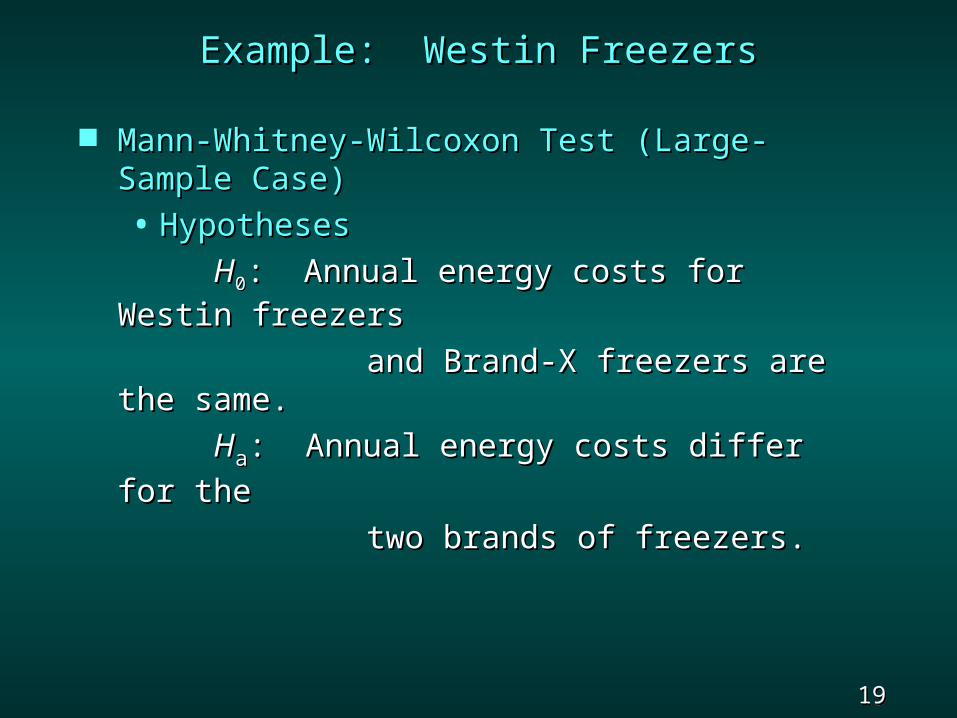
Mann-Whitney-Wilcoxon Test (Large-Sample Mann-Whitney-Wilcoxon Test (Large-Sample Case)Case)
Manufacturer labels indicate the annual Manufacturer labels indicate the annual energy cost associated with operating home energy cost associated with operating home appliances such as freezers.appliances such as freezers.
The energy costs for a sample of 10 The energy costs for a sample of 10 Westin freezers and a sample of 10 Brand-X Westin freezers and a sample of 10 Brand-X Freezers are shown on the next slide. Do the Freezers are shown on the next slide. Do the data indicate, using data indicate, using = .05, that a difference = .05, that a difference exists in the annual energy costs associated exists in the annual energy costs associated with the two brands of freezers?with the two brands of freezers?

18 18 Slide
Slide
Example: Westin FreezersExample: Westin Freezers
Westin Freezers Brand-X Westin Freezers Brand-X FreezersFreezers
$55.10 $55.10 $56.10 $56.10
54.5054.50 54.70 54.70
53.2053.20 54.40 54.40
53.0053.00 55.40 55.40
55.5055.50 54.10 54.10
54.9054.90 56.00 56.00
55.8055.80 55.50 55.50
54.0054.00 55.00 55.00
54.2054.20 54.30 54.30
55.2055.20 57.00 57.00
19 19 Slide
Slide
Example: Westin FreezersExample: Westin Freezers
Mann-Whitney-Wilcoxon Test (Large-Sample Mann-Whitney-Wilcoxon Test (Large-Sample Case)Case)
• HypothesesHypotheses
HH00: Annual energy costs for Westin : Annual energy costs for Westin freezersfreezers
and Brand-X freezers are the same. and Brand-X freezers are the same.
HHaa: Annual energy costs differ for the: Annual energy costs differ for the
two brands of freezers.two brands of freezers.

20 20 Slide
Slide
First, rank the First, rank the combinedcombined data from the lowest data from the lowest to to
the highest values, with tied values being the highest values, with tied values being assigned the average of the tied rankings.assigned the average of the tied rankings.
Then, compute Then, compute TT, the sum of the ranks for the , the sum of the ranks for the first sample.first sample.
Then, compare the observed value of Then, compare the observed value of TT to the to the sampling distribution of sampling distribution of TT for identical for identical populations. The value of the standardized populations. The value of the standardized test statistic test statistic zz will provide the basis for will provide the basis for deciding whether to reject deciding whether to reject HH00..
Mann-Whitney-Wilcoxon Test:Mann-Whitney-Wilcoxon Test:Large-Sample CaseLarge-Sample Case

21 21 Slide
Slide
Sampling Distribution of Sampling Distribution of TT for Identical for Identical PopulationsPopulations
• MeanMean
TT = = nn11((nn11 + + nn22 + 1) + 1)
• Standard DeviationStandard Deviation
• Distribution FormDistribution Form
Approximately normal, providedApproximately normal, provided
nn11 >> 10 and 10 and nn22 >> 10 10
Mann-Whitney-Wilcoxon Test:Mann-Whitney-Wilcoxon Test:Large-Sample CaseLarge-Sample Case
1 2 1 21 ( 1)12T n n n n 1 2 1 21 ( 1)12T n n n n

22 22 Slide
Slide
Example: Westin FreezersExample: Westin Freezers
Westin Freezers Rank Brand-X Freezers Westin Freezers Rank Brand-X Freezers RankRank
$55.10 $55.10 12 12 $56.10 $56.10 19 19
54.5054.50 8 8 54.70 54.70 9 9 53.2053.20 2 2 54.40 54.40 7 7 53.0053.00 1 1 55.40 55.40 14 14 55.5055.50 15.5 15.5 54.10 54.10 4 4 54.9054.90 10 10 56.00 56.00 18 18 55.8055.80 17 17 55.50 55.50 15.5 15.5 54.0054.00 3 3 55.00 55.00 11 11 54.2054.20 5 5 54.30 54.30 6 6 55.2055.20 1313 57.00 57.00 2020Sum of RanksSum of Ranks 86.5 86.5 Sum of RanksSum of Ranks
123.5123.5

23 23 Slide
Slide
Example: Westin FreezersExample: Westin Freezers
Mann-Whitney-Wilcoxon Test (Large-Sample Mann-Whitney-Wilcoxon Test (Large-Sample Case)Case)
• Sampling DistributionSampling Distribution
13.2313.23
Sampling distribution of T if populations are identical
Sampling distribution of T if populations are identical
TT = 105 =1/2(10)(21) = 105 =1/2(10)(21)TT

24 24 Slide
Slide
Example: Westin FreezersExample: Westin Freezers
Rejection RuleRejection Rule
Using .05 level of significance,Using .05 level of significance,
Reject Reject HH00 if if zz < -1.96 or < -1.96 or zz > 1.96 > 1.96 Test StatisticTest Statistic
zz = ( = (TT - - T T )/)/TT = (86.5 - 105)/13.23 = -1.40 = (86.5 - 105)/13.23 = -1.40 ConclusionConclusion
Do not reject Do not reject HH00. There is insufficient . There is insufficient evidence in the sample data to conclude that evidence in the sample data to conclude that there is a difference in the annual energy cost there is a difference in the annual energy cost associated with the two brands of freezers.associated with the two brands of freezers.
25 25 Slide
Slide
Kruskal-Wallis TestKruskal-Wallis Test
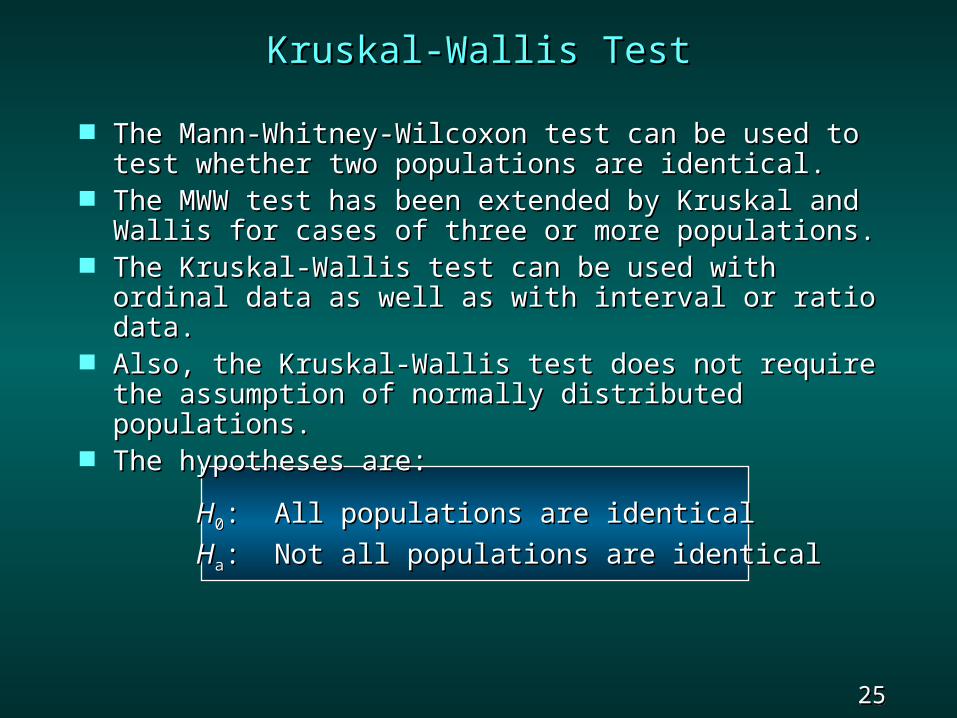
The Mann-Whitney-Wilcoxon test can be used to The Mann-Whitney-Wilcoxon test can be used to test whether two populations are identical.test whether two populations are identical.
The MWW test has been extended by Kruskal The MWW test has been extended by Kruskal and Wallis for cases of three or more and Wallis for cases of three or more populations.populations.
The Kruskal-Wallis test can be used with ordinal The Kruskal-Wallis test can be used with ordinal data as well as with interval or ratio data.data as well as with interval or ratio data.
Also, the Kruskal-Wallis test does not require the Also, the Kruskal-Wallis test does not require the assumption of normally distributed populations.assumption of normally distributed populations.
The hypotheses are:The hypotheses are:
HH00: All populations are identical: All populations are identical
HHaa: Not all populations are identical: Not all populations are identical

26 26 Slide
Slide
Rank CorrelationRank Correlation
The Pearson correlation coefficient, The Pearson correlation coefficient, rr, is a , is a measure of the linear association between two measure of the linear association between two variables for which interval or ratio data are variables for which interval or ratio data are available.available.
The The Spearman rank-correlation coefficientSpearman rank-correlation coefficient, , rrs s , is , is a measure of association between two variables a measure of association between two variables when only ordinal data are available.when only ordinal data are available.
Values of Values of rrss can range from –1.0 to +1.0, where can range from –1.0 to +1.0, where
• values near 1.0 indicate a strong positive values near 1.0 indicate a strong positive association between the rankings, andassociation between the rankings, and
• values near -1.0 indicate a strong negative values near -1.0 indicate a strong negative association between the rankings.association between the rankings.
27 27 Slide
Slide
Rank CorrelationRank Correlation
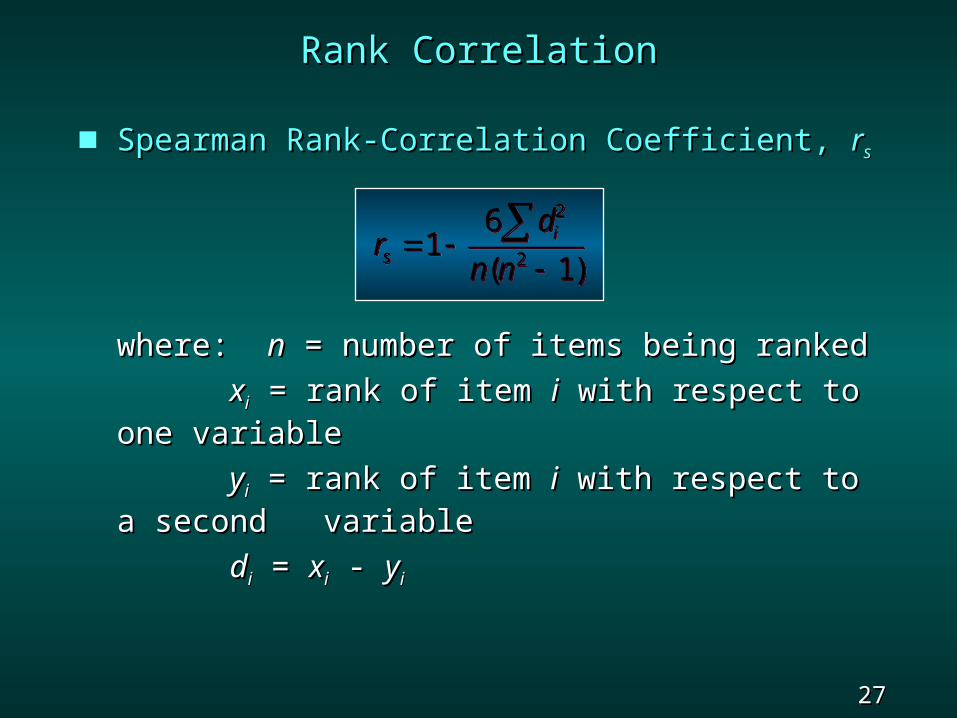
Spearman Rank-Correlation Coefficient, Spearman Rank-Correlation Coefficient, rrss
where: where: nn = number of items being ranked = number of items being ranked
xxii = rank of item = rank of item ii with respect to with respect to one variableone variable
yyii = rank of item = rank of item ii with respect to a with respect to a second second variable variable
ddii = = xxii - - yyii
2
2
61
( 1)i
s
dr
n n
2
2
61
( 1)i
s
dr
n n

28 28 Slide
Slide
Test for Significant Rank CorrelationTest for Significant Rank Correlation
We may want to use sample results to make We may want to use sample results to make an inference about the population rank an inference about the population rank correlation correlation ppss..
To do so, we must test the hypotheses:To do so, we must test the hypotheses:
HH00: : ppss = 0 = 0
HHaa: : ppss = 0 = 0

29 29 Slide
Slide
Sampling Distribution ofSampling Distribution of rrss when when ppss = 0 = 0
• MeanMean
• Standard DeviationStandard Deviation
• Distribution FormDistribution Form
Approximately normal, provided Approximately normal, provided nn >> 1010
Rank CorrelationRank Correlation
0sr
0sr
11sr n
1
1sr n

30 30 Slide
Slide
Example: Connor InvestorsExample: Connor Investors
Rank CorrelationRank Correlation
Connor Investors provides a portfolio Connor Investors provides a portfolio management service for its clients. Two of management service for its clients. Two of Connor’s analysts rated ten investments from Connor’s analysts rated ten investments from high (6) to low (1) risk as shown below. Use high (6) to low (1) risk as shown below. Use rank correlation, with rank correlation, with = .10, to comment on = .10, to comment on the agreement of the two analysts’ ratings.the agreement of the two analysts’ ratings.
InvestmentInvestment AA BB CC DD EE FF GG HH II JJ
Analyst #1Analyst #1 11 44 99 88 66 33 55 7 7 22 1010
Analyst #2Analyst #2 11 55 66 22 99 77 33 1010 44 8 8

31 31 Slide
Slide
Analyst #1 Analyst #2 Analyst #1 Analyst #2
InvestmentInvestment RatingRating RatingRating Differ.Differ. ((Differ.)Differ.)22
AA 11 11 00 00BB 44 55 -1-1 11CC 99 66 33 99DD 88 22 66 3636EE 66 99 -3-3 99FF 33 77 -4-4 1616GG 55 33 22 44HH 77 1010 -3-3 99II 22 44 -2-2 44JJ 1010 88 22 44
Sum =Sum =9292
Example: Connor InvestorsExample: Connor Investors

32 32 Slide
Slide
Example: Connor InvestorsExample: Connor Investors
HypothesesHypotheses
HH00: : ppss = 0 (No rank correlation = 0 (No rank correlation exists.)exists.)
HHaa: : ppss = 0 (Rank correlation exists.) = 0 (Rank correlation exists.)
Sampling DistributionSampling Distribution
rr = 0 = 0rrss
Sampling distribution of rs under the assumptionof no rank correlation
Sampling distribution of rs under the assumptionof no rank correlation
1.333
10 1sr
1
.33310 1sr

33 33 Slide
Slide
Example: Connor InvestorsExample: Connor Investors
Rejection RuleRejection RuleUsing .10 level of significance,Using .10 level of significance,
Reject Reject HH00 if if zz < -1.645 or < -1.645 or zz > 1.645 > 1.645 Test StatisticTest Statistic
zz = ( = (rrss - - r r )/)/rr = (.4424 - 0)/.3333 = 1.33 = (.4424 - 0)/.3333 = 1.33 ConclusionConclusion
Do no reject Do no reject HH00. There is not a significant . There is not a significant rank correlation. The two analysts are not rank correlation. The two analysts are not showing agreement in their rating of the risk showing agreement in their rating of the risk associated with the different investments.associated with the different investments.
2
2
6 6(92)1 1 0.4424
( 1) 10(100 1)i
s
dr
n n
2
2
6 6(92)1 1 0.4424
( 1) 10(100 1)i
s
dr
n n
Related Documents