1 Chapter 6 Chapter 6 Continuous Probability Continuous Probability Distributions Distributions Uniform Probability Distribution Uniform Probability Distribution Normal Probability Distribution Normal Probability Distribution Exponential Probability Exponential Probability Distribution Distribution f (x) x Uniform Uniform x x f f ( ( x x ) ) Normal Normal x f (x) Exponential Exponential

Welcome message from author
This document is posted to help you gain knowledge. Please leave a comment to let me know what you think about it! Share it to your friends and learn new things together.
Transcript

1 1 Slide Slide
Chapter 6Chapter 6 Continuous Probability Distributions Continuous Probability Distributions
Uniform Probability DistributionUniform Probability Distribution Normal Probability DistributionNormal Probability Distribution Exponential Probability DistributionExponential Probability Distribution
f (x)f (x)
x x
UniformUniform
xx
f f ((xx)) NormalNormal
xx
f (x)f (x) ExponentialExponential
2 2 Slide Slide
6.1 Continuous Probability Distributions6.1 Continuous Probability Distributions
A A continuous random variablecontinuous random variable can assume any can assume any value in an interval on the real line or in a value in an interval on the real line or in a collection of intervals.collection of intervals.
It is not possible to talk about the probability of It is not possible to talk about the probability of the random variable assuming a particular value.the random variable assuming a particular value.
Instead, we talk about the probability of the Instead, we talk about the probability of the random variable assuming a value within a given random variable assuming a value within a given interval.interval.
3 3 Slide Slide
Continuous Probability DistributionsContinuous Probability Distributions
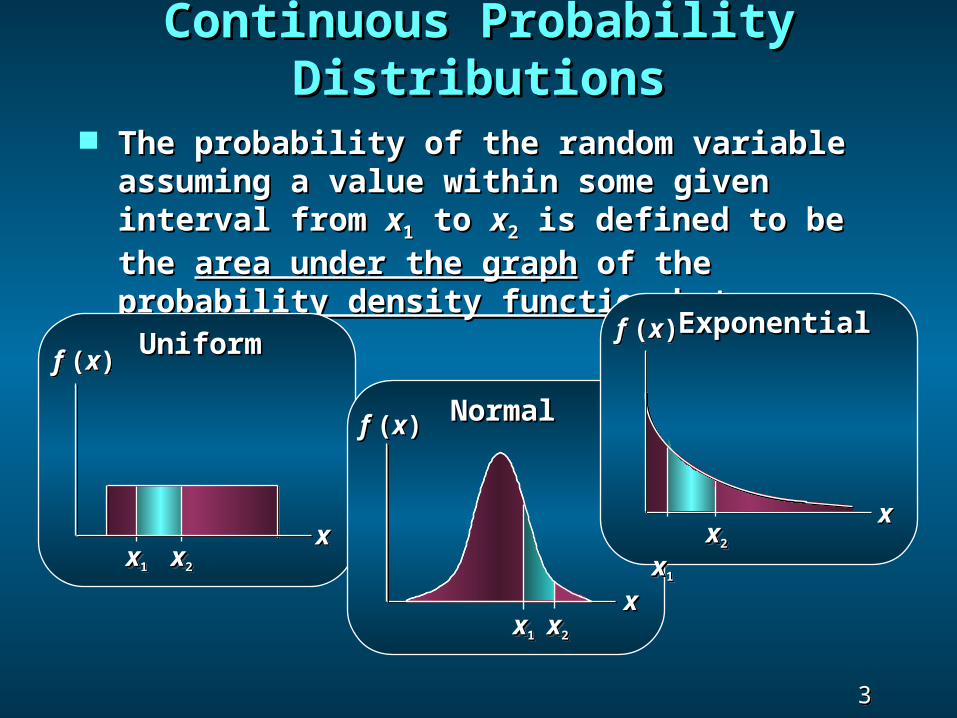
The probability of the random variable assuming a value The probability of the random variable assuming a value within some given interval from within some given interval from xx11 to to xx22 is defined to be is defined to be the the area under the grapharea under the graph of the of the probability density probability density functionfunction between between x x11 andand x x22..
f (x)f (x)
x x
UniformUniform
xx11 xx11 xx22 xx22
xx
f f ((xx)) NormalNormal
xx11 xx11 xx22 xx22
xx11 xx11 xx22 xx22
ExponentialExponential
xx
f (x)f (x)
xx11 xx11 xx22 xx22
4 4 Slide Slide
6.2 Uniform Probability Distribution6.2 Uniform Probability Distribution
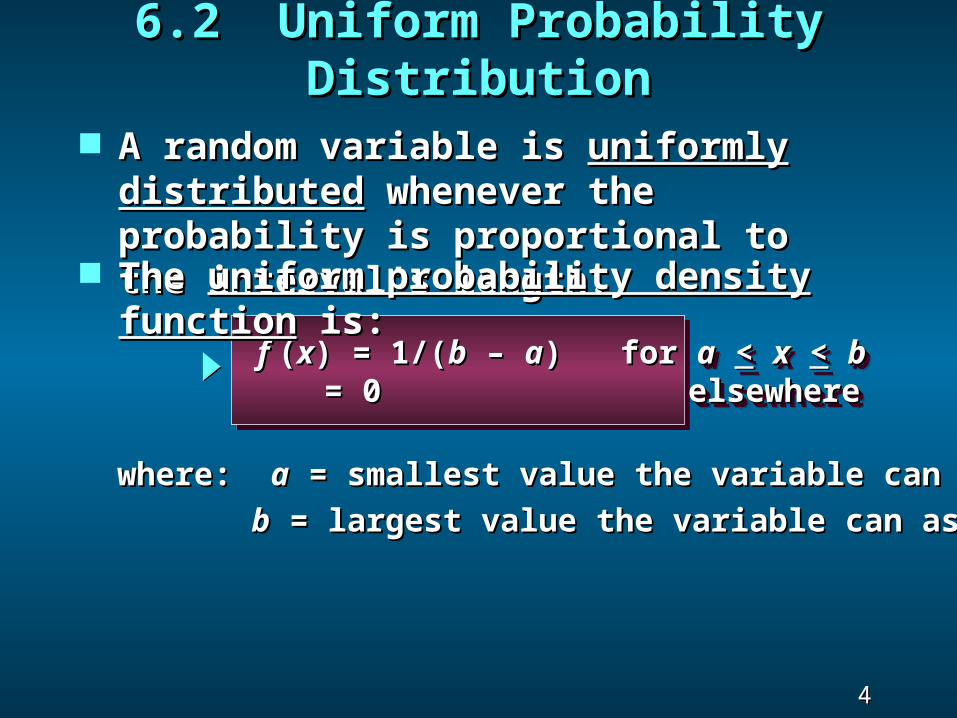
where: where: aa = smallest value the variable can assume = smallest value the variable can assume bb = largest value the variable can assume = largest value the variable can assume
f f ((xx) = 1/() = 1/(bb – – aa) for) for aa << xx << bb = 0 elsewhere= 0 elsewhere f f ((xx) = 1/() = 1/(bb – – aa) for) for aa << xx << bb = 0 elsewhere= 0 elsewhere
A random variable is A random variable is uniformly distributeduniformly distributed whenever the probability is proportional to the whenever the probability is proportional to the intervalinterval’’s length. s length.
The The uniform probability density functionuniform probability density function is: is:
5 5 Slide Slide
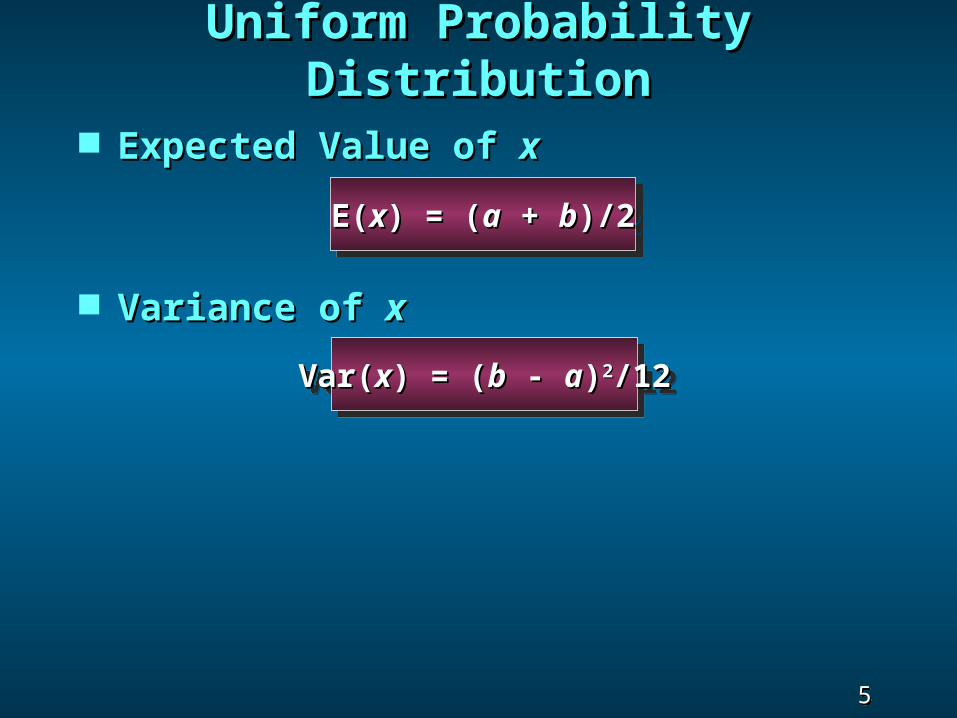
Var(Var(xx) = () = (bb - - aa))22/12/12Var(Var(xx) = () = (bb - - aa))22/12/12
E(E(xx) = () = (aa + + bb)/2)/2E(E(xx) = () = (aa + + bb)/2)/2
Uniform Probability DistributionUniform Probability Distribution
Expected Value of Expected Value of xx
Variance of Variance of xx

6 6 Slide Slide
Uniform Probability DistributionUniform Probability Distribution
Example: Slater's BuffetExample: Slater's BuffetSlater customers are chargedSlater customers are chargedfor the amount of salad they take. for the amount of salad they take. Sampling suggests that theSampling suggests that theamount of salad taken is amount of salad taken is uniformly distributeduniformly distributedbetween 5 ounces and 15 ounces.between 5 ounces and 15 ounces.
7 7 Slide Slide
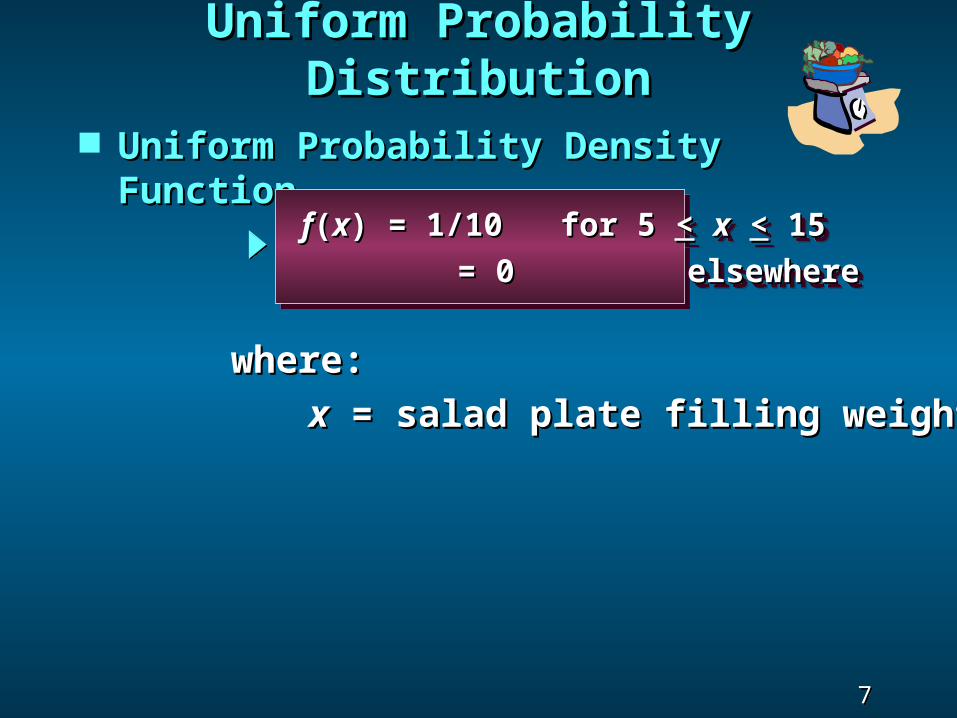
Uniform Probability Density FunctionUniform Probability Density Function
ff((xx) = 1/10 for 5 ) = 1/10 for 5 << xx << 15 15 = 0 elsewhere= 0 elsewhere
ff((xx) = 1/10 for 5 ) = 1/10 for 5 << xx << 15 15 = 0 elsewhere= 0 elsewhere
where:where: xx = salad plate filling weight = salad plate filling weight
Uniform Probability DistributionUniform Probability Distribution
8 8 Slide Slide
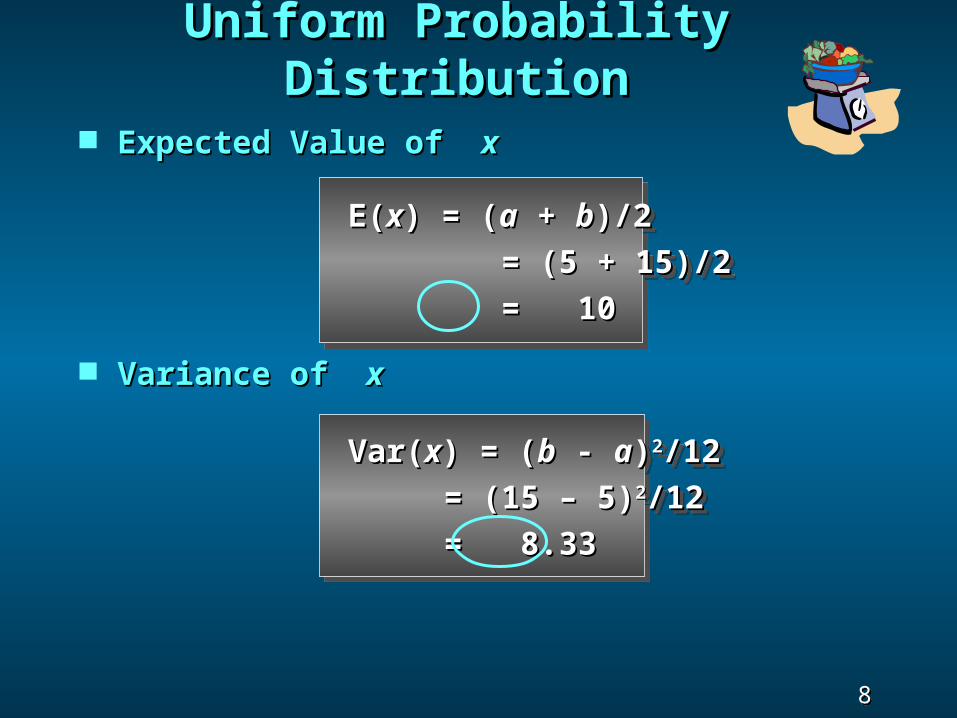
Expected Value of Expected Value of xx
Variance of Variance of xx
E(E(xx) = () = (aa + + bb)/2)/2 = (5 + 15)/2= (5 + 15)/2 = 10= 10
E(E(xx) = () = (aa + + bb)/2)/2 = (5 + 15)/2= (5 + 15)/2 = 10= 10
Var(Var(xx) = () = (bb - - aa))22/12/12 = (15 – 5)= (15 – 5)22/12/12 = 8.33= 8.33
Var(Var(xx) = () = (bb - - aa))22/12/12 = (15 – 5)= (15 – 5)22/12/12 = 8.33= 8.33
Uniform Probability DistributionUniform Probability Distribution
9 9 Slide Slide
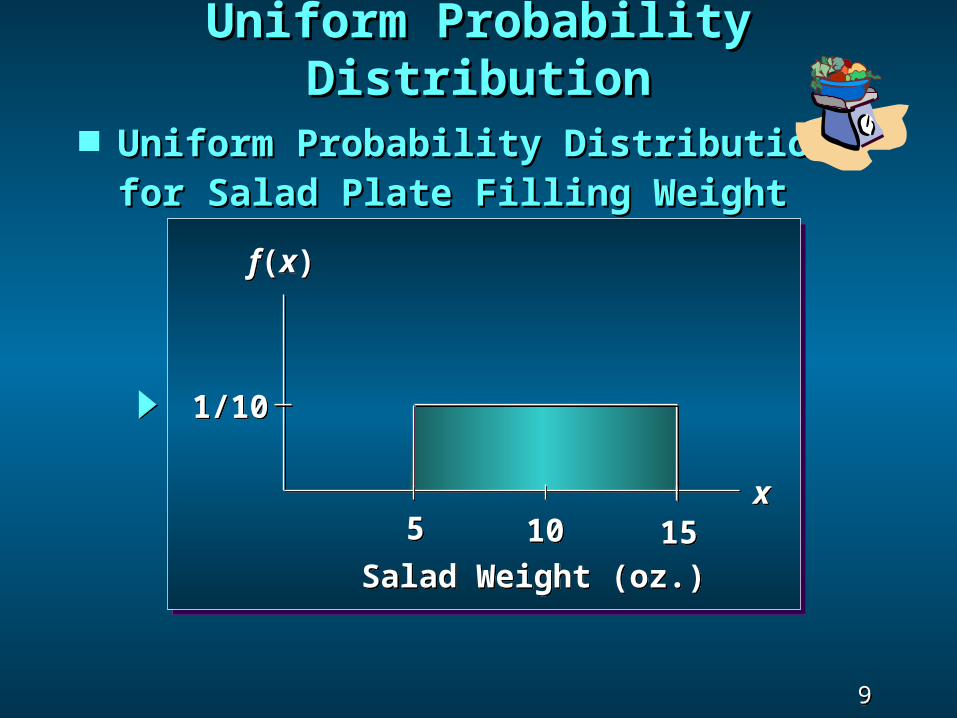
Uniform Probability DistributionUniform Probability Distributionfor Salad Plate Filling Weightfor Salad Plate Filling Weight
f(x)f(x)
x x55 1010 1515
1/101/10
Salad Weight (oz.)Salad Weight (oz.)
Uniform Probability DistributionUniform Probability Distribution
10 10 Slide Slide
f(x)f(x)
x x55 1010 1515
1/101/10
Salad Weight (oz.)Salad Weight (oz.)
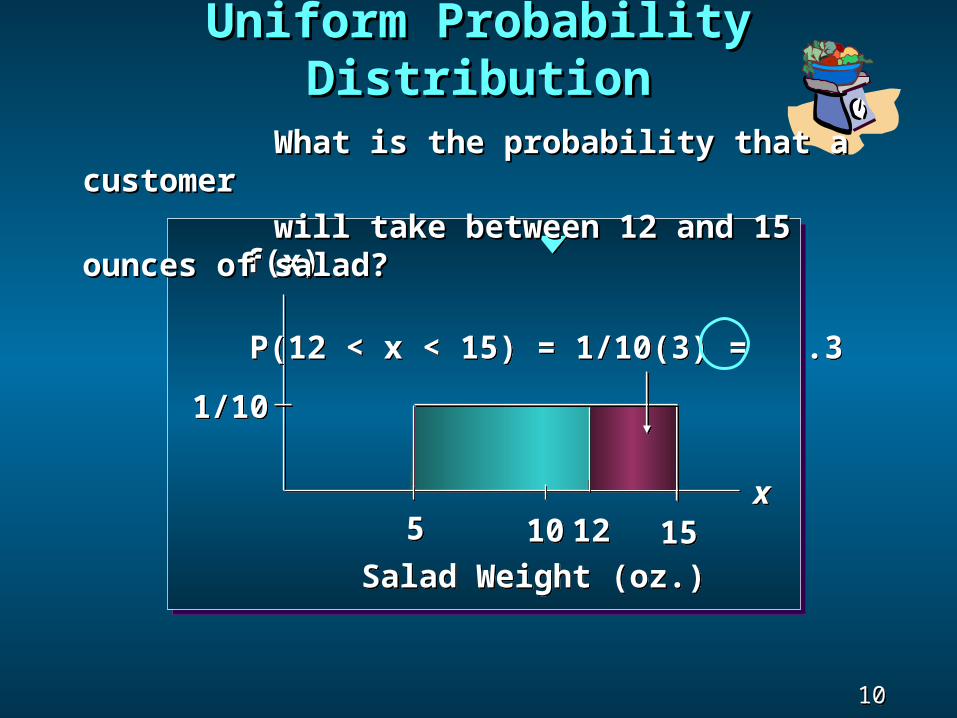
P(12 < x < 15) = 1/10(3) = .3P(12 < x < 15) = 1/10(3) = .3
What is the probability that a customerWhat is the probability that a customer will take between 12 and 15 ounces of salad?will take between 12 and 15 ounces of salad?
1212
Uniform Probability DistributionUniform Probability Distribution
11 11 Slide Slide
6.3 Normal Probability Distribution6.3 Normal Probability Distribution
The The normal probability distributionnormal probability distribution is the most is the most important distribution for describing a important distribution for describing a continuous random variable.continuous random variable.
It is widely used in statistical inference.It is widely used in statistical inference.
12 12 Slide Slide
Normal Probability DistributionNormal Probability Distribution
It has been used in a wide variety of applications:It has been used in a wide variety of applications:
TestTest scoresscores
AmountsAmountsof rainfallof rainfall
13 13 Slide Slide
Normal Probability DistributionNormal Probability Distribution
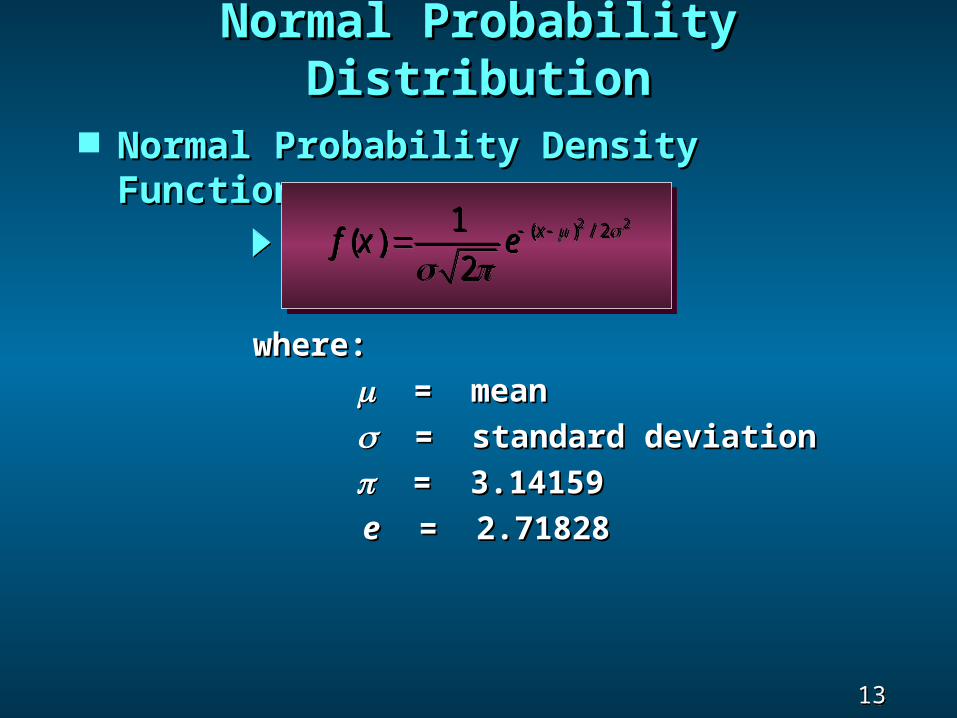
Normal Probability Density FunctionNormal Probability Density Function
2 2( ) / 21( )
2xf x e
2 2( ) / 21( )
2xf x e
= mean= mean = standard deviation= standard deviation = 3.14159= 3.14159ee = 2.71828 = 2.71828
where:where:
14 14 Slide Slide
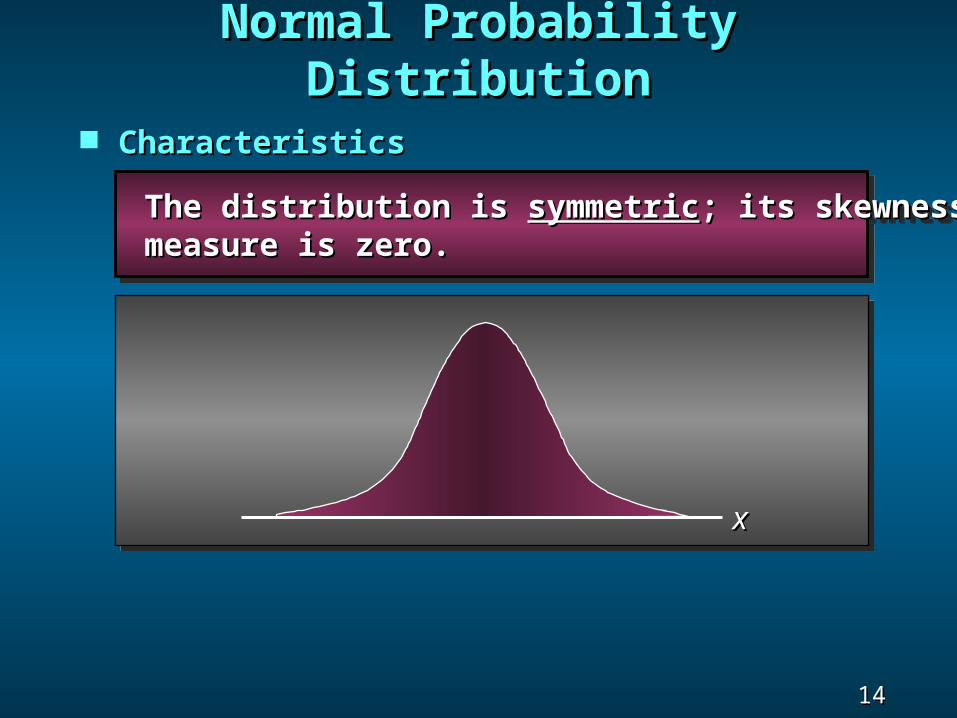
The distribution is The distribution is symmetricsymmetric; its skewness; its skewness measure is zero.measure is zero. The distribution is The distribution is symmetricsymmetric; its skewness; its skewness measure is zero.measure is zero.
Normal Probability DistributionNormal Probability Distribution
CharacteristicsCharacteristics
xx

15 15 Slide Slide
The entire family of normal probabilityThe entire family of normal probability distributions is defined by itsdistributions is defined by its meanmean μμ and itsand its standard deviationstandard deviationσσ..
The entire family of normal probabilityThe entire family of normal probability distributions is defined by itsdistributions is defined by its meanmean μμ and itsand its standard deviationstandard deviationσσ..
Normal Probability DistributionNormal Probability Distribution
CharacteristicsCharacteristics
Standard DeviationStandard Deviation
MeanMean xx
16 16 Slide Slide
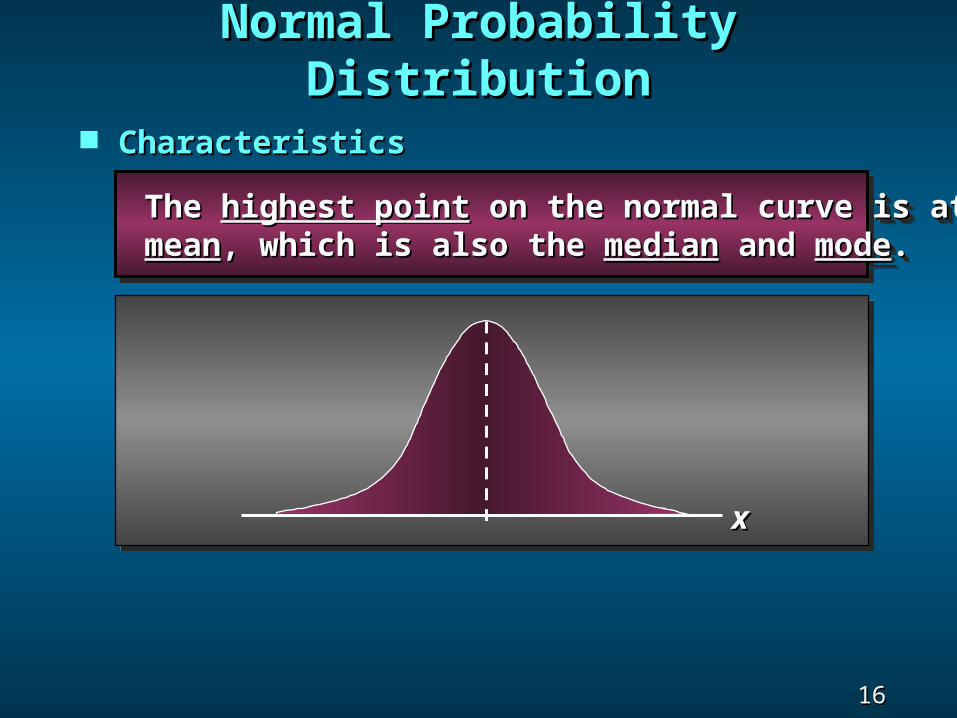
The The highest pointhighest point on the normal curve is at the on the normal curve is at the meanmean, which is also the , which is also the medianmedian and and modemode.. The The highest pointhighest point on the normal curve is at the on the normal curve is at the meanmean, which is also the , which is also the medianmedian and and modemode..
Normal Probability DistributionNormal Probability Distribution
CharacteristicsCharacteristics
xx
17 17 Slide Slide
Normal Probability DistributionNormal Probability Distribution
CharacteristicsCharacteristics
-10-10 00 2020
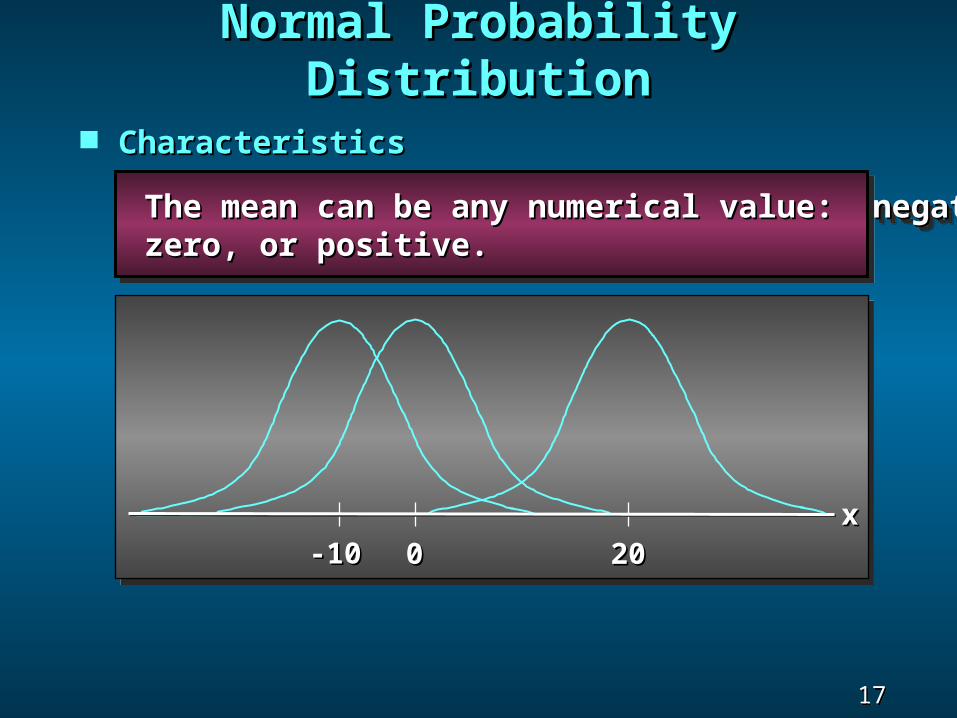
The mean can be any numerical value: negative,The mean can be any numerical value: negative, zero, or positive.zero, or positive. The mean can be any numerical value: negative,The mean can be any numerical value: negative, zero, or positive.zero, or positive.
xx

18 18 Slide Slide
Normal Probability DistributionNormal Probability Distribution
CharacteristicsCharacteristics
= 15= 15
= 25= 25
The standard deviation determines the width of theThe standard deviation determines the width of thecurve: larger values result in wider, flatter curves.curve: larger values result in wider, flatter curves.The standard deviation determines the width of theThe standard deviation determines the width of thecurve: larger values result in wider, flatter curves.curve: larger values result in wider, flatter curves.
xx
19 19 Slide Slide
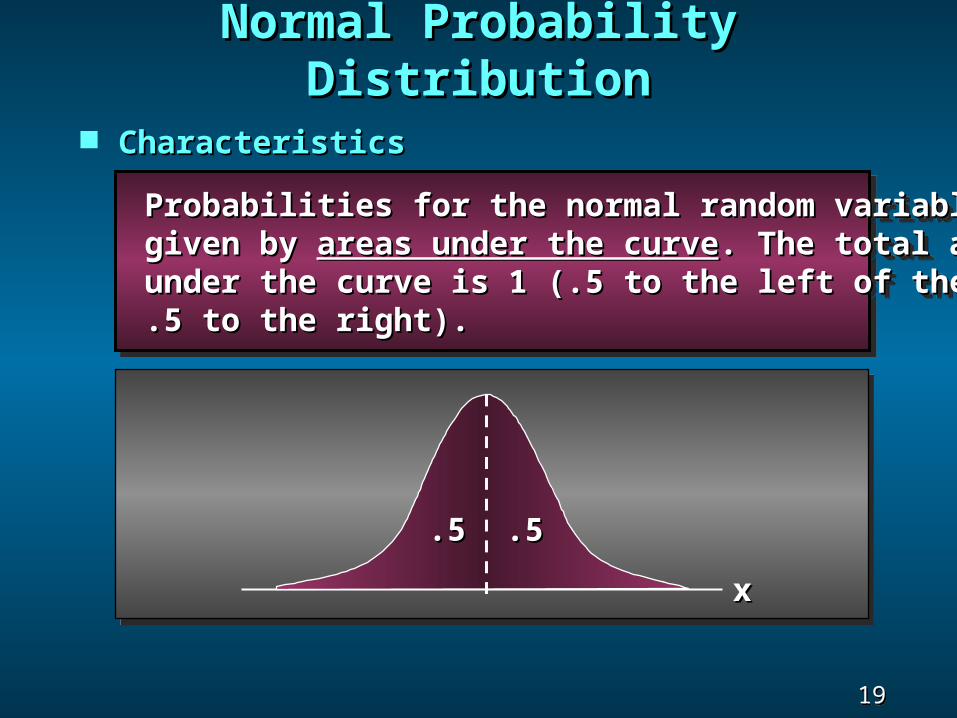
Probabilities for the normal random variable areProbabilities for the normal random variable are given by given by areas under the curveareas under the curve. The total area. The total area under the curve is 1 (.5 to the left of the mean andunder the curve is 1 (.5 to the left of the mean and .5 to the right)..5 to the right).
Probabilities for the normal random variable areProbabilities for the normal random variable are given by given by areas under the curveareas under the curve. The total area. The total area under the curve is 1 (.5 to the left of the mean andunder the curve is 1 (.5 to the left of the mean and .5 to the right)..5 to the right).
Normal Probability DistributionNormal Probability Distribution
CharacteristicsCharacteristics
.5.5 .5.5
xx
20 20 Slide Slide
Normal Probability DistributionNormal Probability Distribution
CharacteristicsCharacteristics
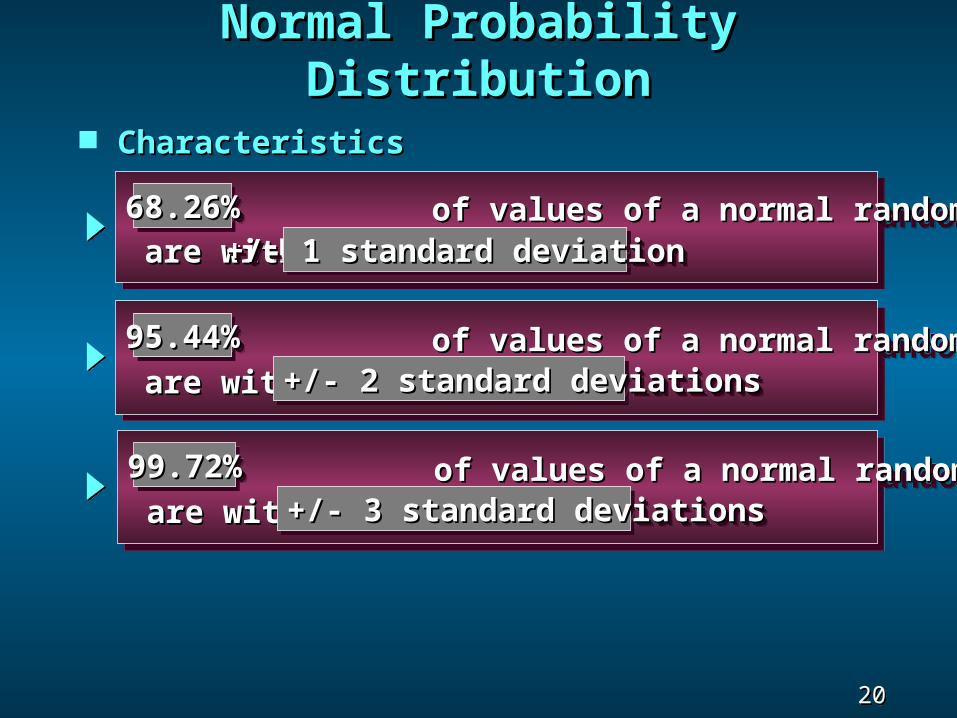
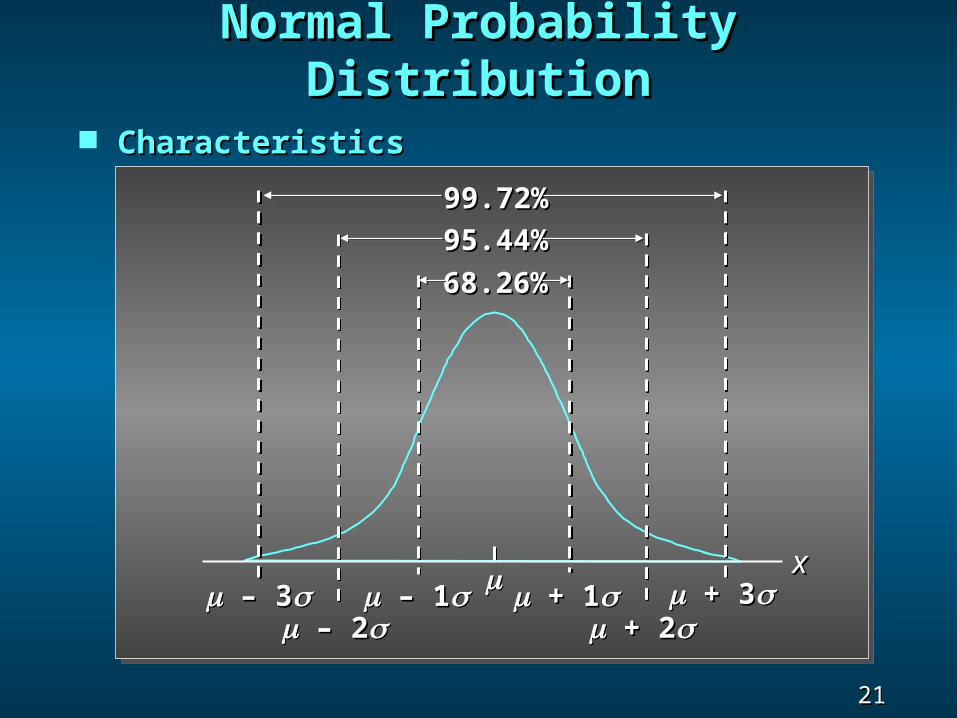
of values of a normal random variableof values of a normal random variable are within of its mean.are within of its mean. of values of a normal random variableof values of a normal random variable are within of its mean.are within of its mean.68.26%68.26%68.26%68.26%
+/- 1 standard deviation+/- 1 standard deviation+/- 1 standard deviation+/- 1 standard deviation
of values of a normal random variableof values of a normal random variable are within of its mean.are within of its mean. of values of a normal random variableof values of a normal random variable are within of its mean.are within of its mean.95.44%95.44%95.44%95.44%
+/- 2 standard deviations+/- 2 standard deviations+/- 2 standard deviations+/- 2 standard deviations
of values of a normal random variableof values of a normal random variable are within of its mean.are within of its mean. of values of a normal random variableof values of a normal random variable are within of its mean.are within of its mean.99.72%99.72%99.72%99.72%
+/- 3 standard deviations+/- 3 standard deviations+/- 3 standard deviations+/- 3 standard deviations
21 21 Slide Slide
Normal Probability DistributionNormal Probability Distribution
CharacteristicsCharacteristics
xx – – 33 – – 11
– – 22 + 1+ 1
+ 2+ 2 + 3+ 3
68.26%68.26%95.44%95.44%99.72%99.72%
22 22 Slide Slide
Standard Normal Probability DistributionStandard Normal Probability Distribution
A random variable having a normal distributionA random variable having a normal distribution with a mean of 0 and a standard deviation of 1 iswith a mean of 0 and a standard deviation of 1 is said to have a said to have a standard normal probabilitystandard normal probability distributiondistribution..
A random variable having a normal distributionA random variable having a normal distribution with a mean of 0 and a standard deviation of 1 iswith a mean of 0 and a standard deviation of 1 is said to have a said to have a standard normal probabilitystandard normal probability distributiondistribution..

23 23 Slide Slide
00zz
The letter The letter z z is used to designate the standardis used to designate the standard normal random variable.normal random variable. The letter The letter z z is used to designate the standardis used to designate the standard normal random variable.normal random variable.
Standard Normal Probability DistributionStandard Normal Probability Distribution
24 24 Slide Slide
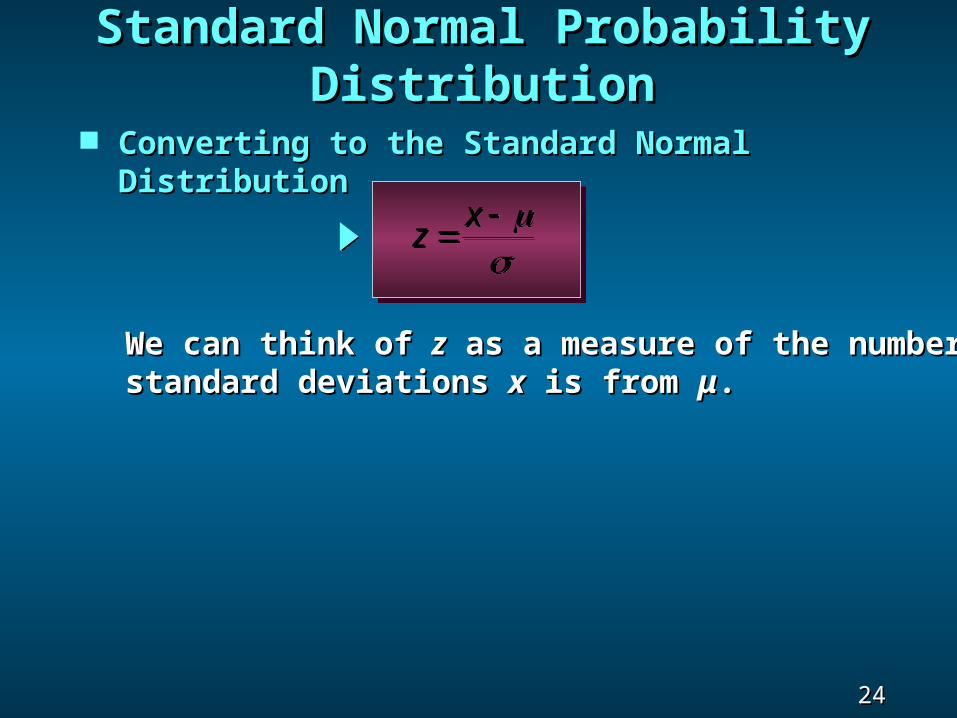
Converting to the Standard Normal DistributionConverting to the Standard Normal Distribution
Standard Normal Probability DistributionStandard Normal Probability Distribution
zx
zx
We can think of We can think of zz as a measure of the number of as a measure of the number ofstandard deviations standard deviations xx is from is from μμ..
25 25 Slide Slide
Standard Normal Probability DistributionStandard Normal Probability Distribution
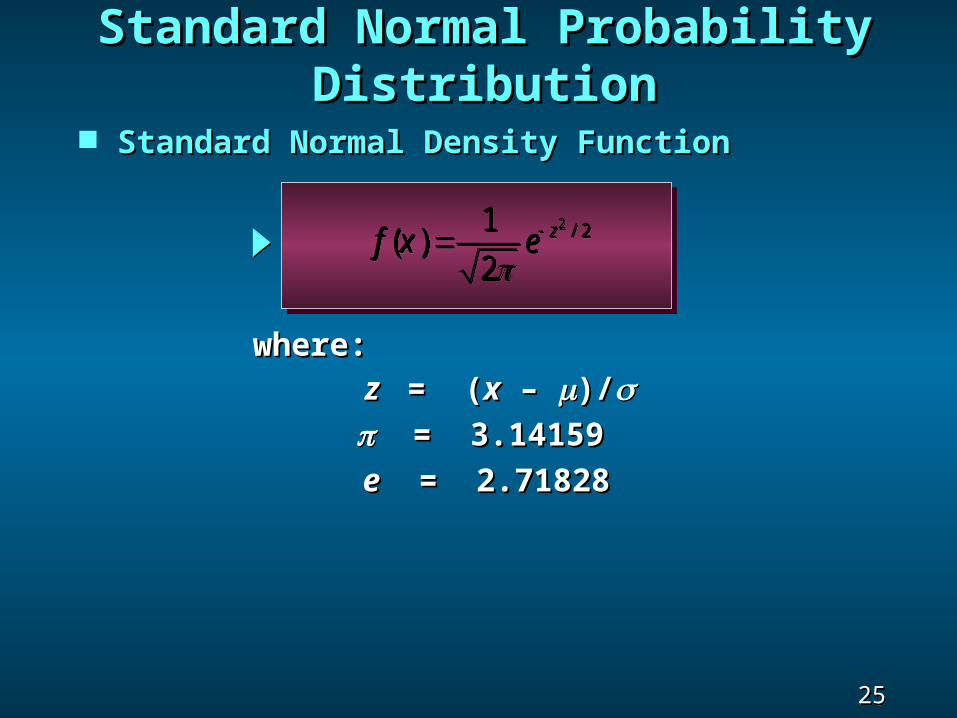
Standard Normal Density FunctionStandard Normal Density Function
2 / 21( )
2zf x e
2 / 21( )
2zf x e
z z = ( = (xx – – )/)/ = 3.14159= 3.14159ee = 2.71828 = 2.71828
where:where:
26 26 Slide Slide
Standard Normal Probability DistributionStandard Normal Probability Distribution
Example: Pep ZoneExample: Pep ZonePep Zone sells auto parts and supplies includingPep Zone sells auto parts and supplies includinga popular multi-grade motor oil. When thea popular multi-grade motor oil. When thestock of this oil drops to 20 gallons, astock of this oil drops to 20 gallons, areplenishment order is placed.replenishment order is placed. Pep
Zone5w-20Motor Oil
27 27 Slide Slide
The store manager is concerned that sales are beingThe store manager is concerned that sales are beinglost due to stockouts while waiting for an order.lost due to stockouts while waiting for an order.It has been determined that demand duringIt has been determined that demand duringreplenishment lead-time is normallyreplenishment lead-time is normallydistributed with a mean of 15 gallons anddistributed with a mean of 15 gallons anda standard deviation of 6 gallons. a standard deviation of 6 gallons.
The manager would like to know theThe manager would like to know theprobability of a stockout, probability of a stockout, PP((xx > 20). > 20).
Standard Normal Probability DistributionStandard Normal Probability Distribution
PepZone5w-20Motor Oil
Example: Pep ZoneExample: Pep Zone
28 28 Slide Slide
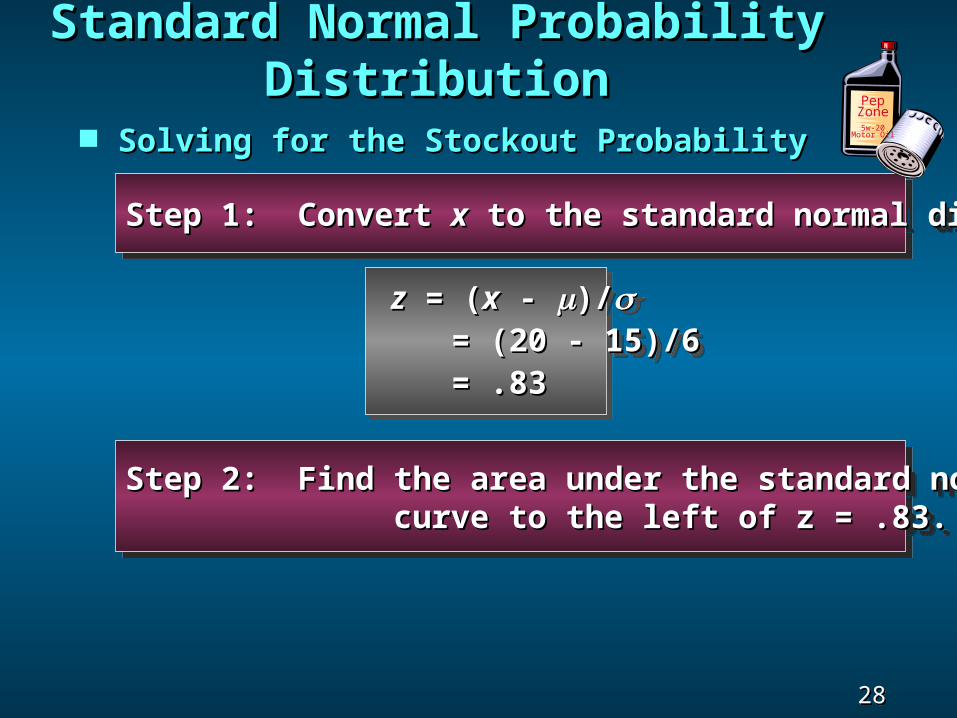
zz = ( = (xx - - )/)/ = (20 - 15)/6= (20 - 15)/6 = .83= .83
zz = ( = (xx - - )/)/ = (20 - 15)/6= (20 - 15)/6 = .83= .83
Solving for the Stockout ProbabilitySolving for the Stockout Probability
Step 1: Convert Step 1: Convert xx to the standard normal distribution. to the standard normal distribution.Step 1: Convert Step 1: Convert xx to the standard normal distribution. to the standard normal distribution.
PepZone5w-20
Motor Oil
Step 2: Find the area under the standard normalStep 2: Find the area under the standard normal curve to the left of z = .83.curve to the left of z = .83.Step 2: Find the area under the standard normalStep 2: Find the area under the standard normal curve to the left of z = .83.curve to the left of z = .83.
Standard Normal Probability DistributionStandard Normal Probability Distribution
29 29 Slide Slide
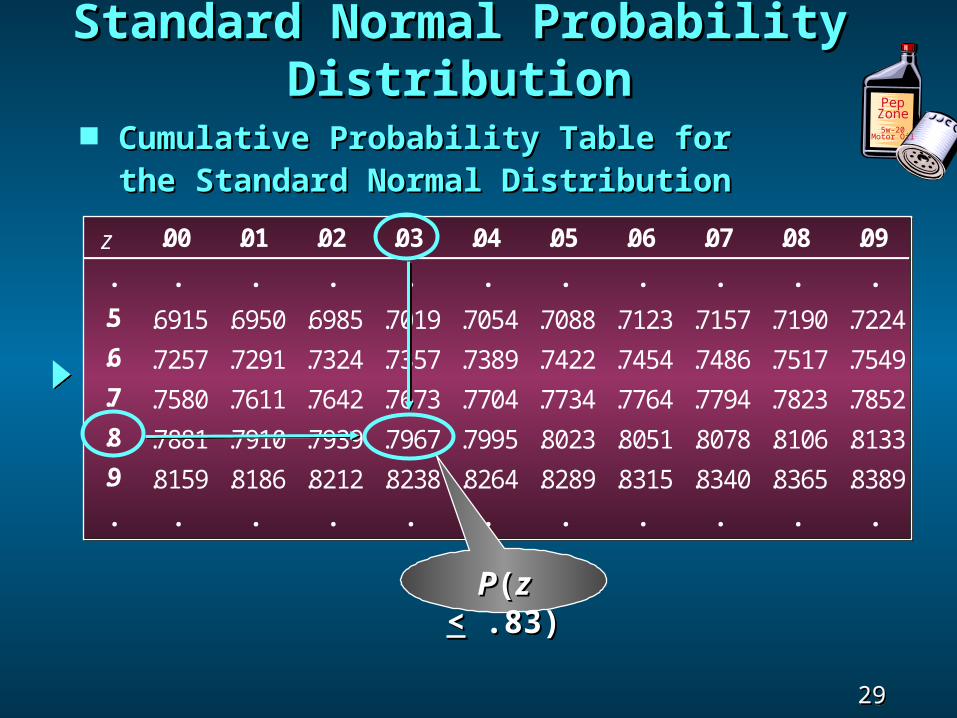
Cumulative Probability Table for Cumulative Probability Table for the Standard Normal Distributionthe Standard Normal Distribution
z .00 .01 .02 .03 .04 .05 .06 .07 .08 .09
. . . . . . . . . . .
.5 .6915 .6950 .6985 .7019 .7054 .7088 .7123 .7157 .7190 .7224
.6 .7257 .7291 .7324 .7357 .7389 .7422 .7454 .7486 .7517 .7549
.7 .7580 .7611 .7642 .7673 .7704 .7734 .7764 .7794 .7823 .7852
.8 .7881 .7910 .7939 .7967 .7995 .8023 .8051 .8078 .8106 .8133
.9 .8159 .8186 .8212 .8238 .8264 .8289 .8315 .8340 .8365 .8389
. . . . . . . . . . .
PepZone5w-20
Motor Oil
PP((zz << .83) .83)
Standard Normal Probability DistributionStandard Normal Probability Distribution
30 30 Slide Slide
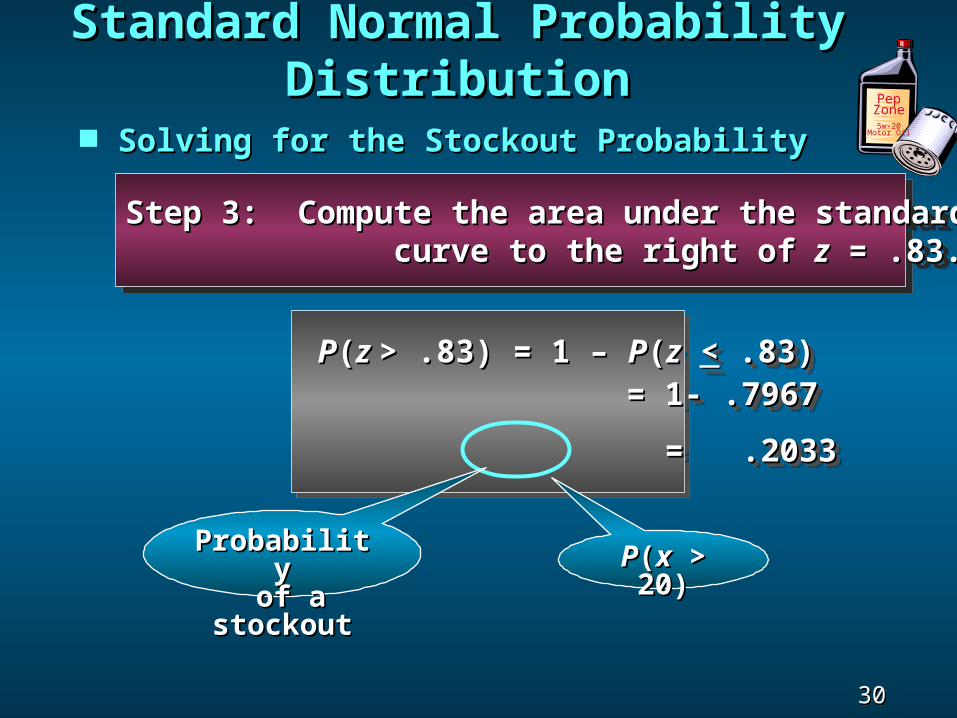
PP((z z > .83) = 1 – > .83) = 1 – PP((zz << .83) .83) = 1- .7967= 1- .7967
= .2033= .2033
PP((z z > .83) = 1 – > .83) = 1 – PP((zz << .83) .83) = 1- .7967= 1- .7967
= .2033= .2033
Solving for the Stockout ProbabilitySolving for the Stockout Probability
Step 3: Compute the area under the standard normalStep 3: Compute the area under the standard normal curve to the right of curve to the right of zz = .83. = .83.Step 3: Compute the area under the standard normalStep 3: Compute the area under the standard normal curve to the right of curve to the right of zz = .83. = .83.
PepZone5w-20
Motor Oil
ProbabilityProbability of a stockoutof a stockout PP((xx > 20) > 20)
Standard Normal Probability DistributionStandard Normal Probability Distribution

31 31 Slide Slide
Solving for the Stockout ProbabilitySolving for the Stockout Probability
00 .83.83
Area = .7967Area = .7967Area = 1 - .7967Area = 1 - .7967
= .2033= .2033
zz
PepZone5w-20
Motor Oil
Standard Normal Probability DistributionStandard Normal Probability Distribution

32 32 Slide Slide
Standard Normal Probability DistributionStandard Normal Probability DistributionIf the manager of Pep Zone wants the If the manager of Pep Zone wants the
probability of a stockout to be no more than .05, probability of a stockout to be no more than .05, what should the reorder point be?what should the reorder point be?
PepZone5w-20
Motor Oil
Standard Normal Probability DistributionStandard Normal Probability Distribution

33 33 Slide Slide
Solving for the Reorder PointSolving for the Reorder PointPep
Zone5w-20
Motor Oil
00
Area = .9500Area = .9500
Area = .0500Area = .0500
zzzz.05.05
Standard Normal Probability DistributionStandard Normal Probability Distribution
34 34 Slide Slide
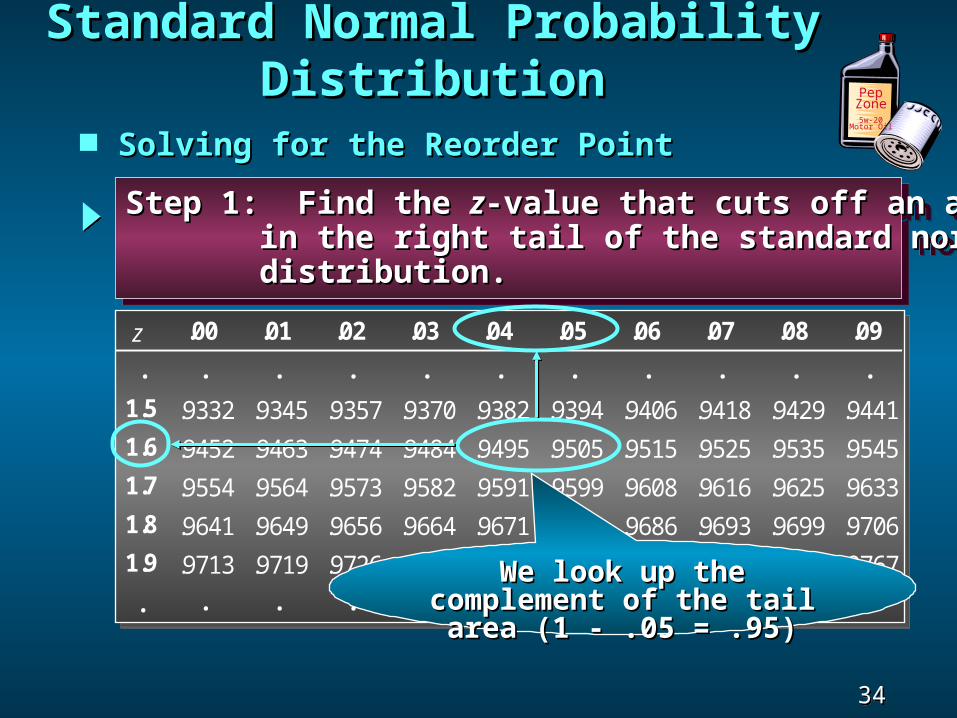
Solving for the Reorder PointSolving for the Reorder Point
PepZone5w-20
Motor Oil
Step 1: Find the Step 1: Find the zz-value that cuts off an area of .05-value that cuts off an area of .05 in the right tail of the standard normalin the right tail of the standard normal distribution.distribution.
Step 1: Find the Step 1: Find the zz-value that cuts off an area of .05-value that cuts off an area of .05 in the right tail of the standard normalin the right tail of the standard normal distribution.distribution.
z .00 .01 .02 .03 .04 .05 .06 .07 .08 .09
. . . . . . . . . . .
1.5 .9332 .9345 .9357 .9370 .9382 .9394 .9406 .9418 .9429 .9441
1.6 .9452 .9463 .9474 .9484 .9495 .9505 .9515 .9525 .9535 .9545
1.7 .9554 .9564 .9573 .9582 .9591 .9599 .9608 .9616 .9625 .9633
1.8 .9641 .9649 .9656 .9664 .9671 .9678 .9686 .9693 .9699 .9706
1.9 .9713 .9719 .9726 .9732 .9738 .9744 .9750 .9756 .9761 .9767
. . . . . . . . . . .
z .00 .01 .02 .03 .04 .05 .06 .07 .08 .09
. . . . . . . . . . .
1.5 .9332 .9345 .9357 .9370 .9382 .9394 .9406 .9418 .9429 .9441
1.6 .9452 .9463 .9474 .9484 .9495 .9505 .9515 .9525 .9535 .9545
1.7 .9554 .9564 .9573 .9582 .9591 .9599 .9608 .9616 .9625 .9633
1.8 .9641 .9649 .9656 .9664 .9671 .9678 .9686 .9693 .9699 .9706
1.9 .9713 .9719 .9726 .9732 .9738 .9744 .9750 .9756 .9761 .9767
. . . . . . . . . . .We look up the complement of We look up the complement of
the tail area (1 - .05 = .95)the tail area (1 - .05 = .95)
Standard Normal Probability DistributionStandard Normal Probability Distribution
35 35 Slide Slide
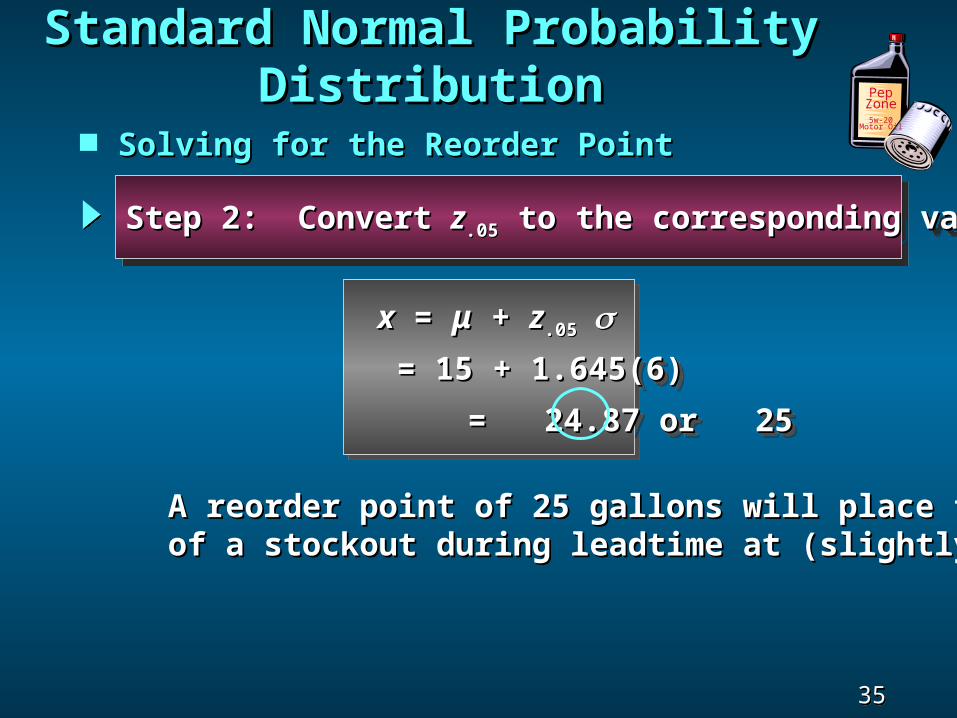
Solving for the Reorder PointSolving for the Reorder Point
PepZone5w-20
Motor Oil
Step 2: Convert Step 2: Convert zz.05.05 to the corresponding value of to the corresponding value of xx..Step 2: Convert Step 2: Convert zz.05.05 to the corresponding value of to the corresponding value of xx..
xx = = μμ + + zz.05.05
= 15 + 1.645(6)= 15 + 1.645(6)
= 24.87 or 25= 24.87 or 25
xx = = μμ + + zz.05.05
= 15 + 1.645(6)= 15 + 1.645(6)
= 24.87 or 25= 24.87 or 25
A reorder point of 25 gallons will place the probabilityA reorder point of 25 gallons will place the probability of a stockout during leadtime at (slightly less than) .05.of a stockout during leadtime at (slightly less than) .05.
Standard Normal Probability DistributionStandard Normal Probability Distribution
36 36 Slide Slide
Solving for the Reorder PointSolving for the Reorder PointPep
Zone5w-20
Motor Oil
By raising the reorder point from 20 gallons to By raising the reorder point from 20 gallons to 25 gallons on hand, the probability of a stockout25 gallons on hand, the probability of a stockoutdecreases from about .20 to .05.decreases from about .20 to .05. This is a significant decrease in the chance that PepThis is a significant decrease in the chance that PepZone will be out of stock and unable to meet aZone will be out of stock and unable to meet acustomer’s desire to make a purchase.customer’s desire to make a purchase.
Standard Normal Probability DistributionStandard Normal Probability Distribution

37 37 Slide Slide
Normal Approximation Normal Approximation of Binomial Probabilitiesof Binomial Probabilities
When the number of trials, When the number of trials, nn, becomes large,, becomes large,evaluating the binomial probability function byevaluating the binomial probability function byhand or with a calculator is difficulthand or with a calculator is difficult
The normal probability distribution provides anThe normal probability distribution provides aneasy-to-use approximation of binomial probabilitieseasy-to-use approximation of binomial probabilitieswhere where nn > 20, > 20, np np >> 5, and 5, and nn(1 - (1 - pp) ) >> 5. 5.
38 38 Slide Slide
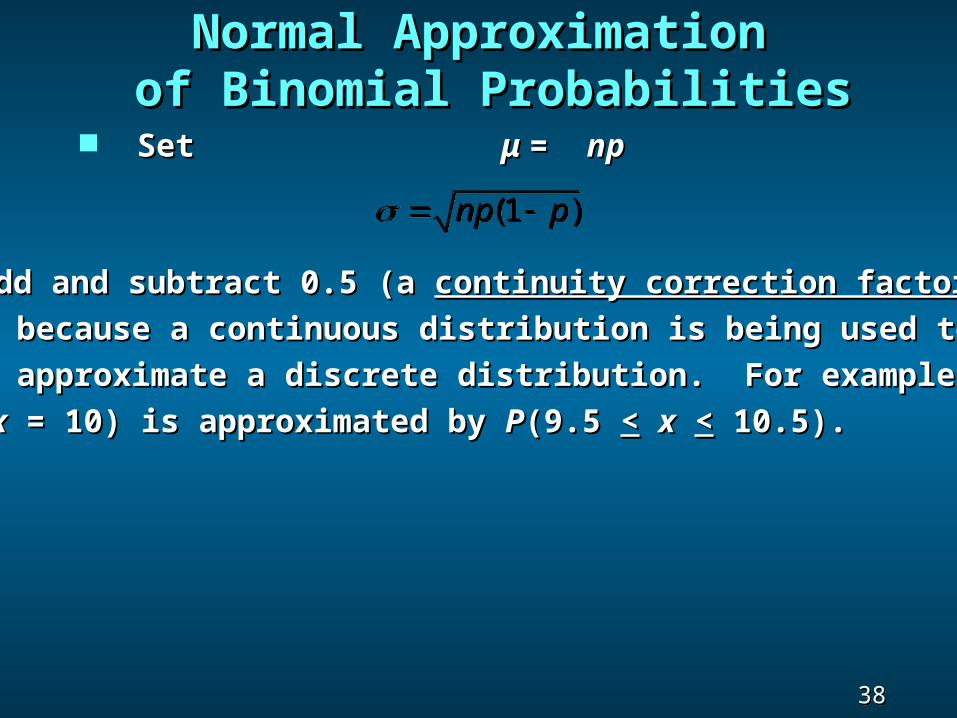
Normal Approximation Normal Approximation of Binomial Probabilitiesof Binomial Probabilities
Set Set μμ = = npnp
(1 )np p (1 )np p
Add and subtract 0.5 (a Add and subtract 0.5 (a continuity correction factorcontinuity correction factor)) because a continuous distribution is being used tobecause a continuous distribution is being used to approximate a discrete distribution. For example, approximate a discrete distribution. For example, PP((xx = 10) is approximated by = 10) is approximated by PP(9.5 (9.5 << xx << 10.5). 10.5).

39 39 Slide Slide
End of Chapter 6End of Chapter 6
Related Documents