1 Chapter 5: Multiple Regression 5.1 Fitting a Multiple Regression Model 5.2 Fitting a Multiple Regression Model with Interactions 5.3 Generating and Comparing Candidate Models

Welcome message from author
This document is posted to help you gain knowledge. Please leave a comment to let me know what you think about it! Share it to your friends and learn new things together.
Transcript
11
Chapter 5: Multiple Regression
5.1 Fitting a Multiple Regression Model
5.2 Fitting a Multiple Regression Model with Interactions
5.3 Generating and Comparing Candidate Models
22
Chapter 5: Multiple Regression
5.1 Fitting a Multiple Regression Model5.1 Fitting a Multiple Regression Model
5.2 Fitting a Multiple Regression Model with Interactions
5.3 Generating and Comparing Candidate Models
3
Objectives Understand the principles of multiple linear regression. Recognize the main advantage of multiple regression
versus simple linear regression. Fit a multiple regression model with the Fit Model
platform.
3
4
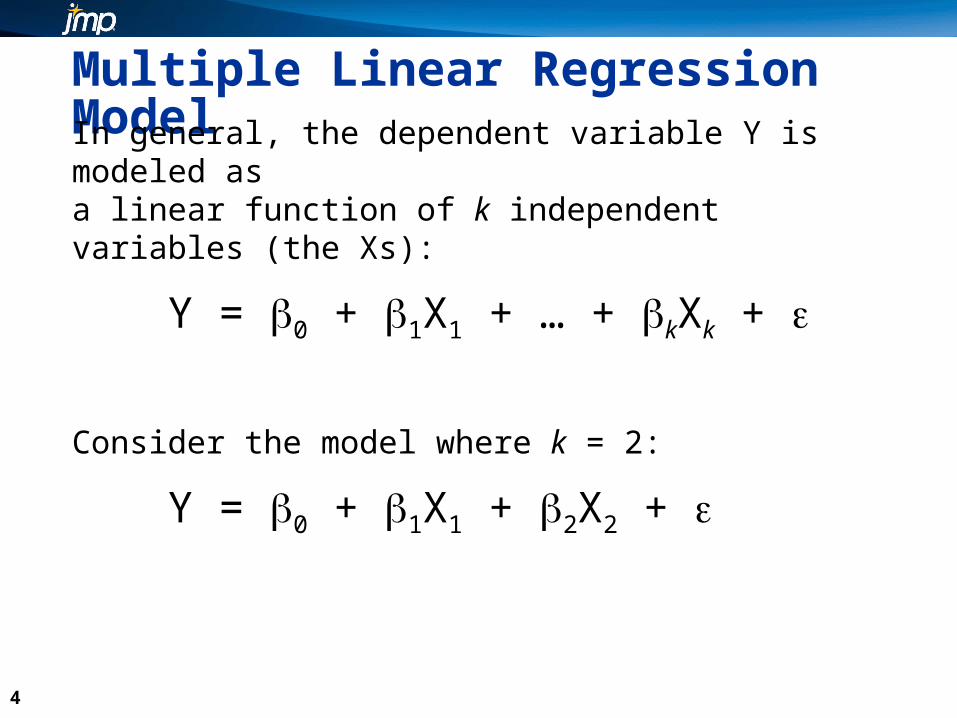
Multiple Linear Regression ModelIn general, the dependent variable Y is modeled as a linear function of k independent variables (the Xs):
Y = 0 + 1X1 + … + kXk +
Consider the model where k = 2:
Y = 0 + 1X1 + 2X2 +
4

5
Picturing the Model: No Relationship
5
6
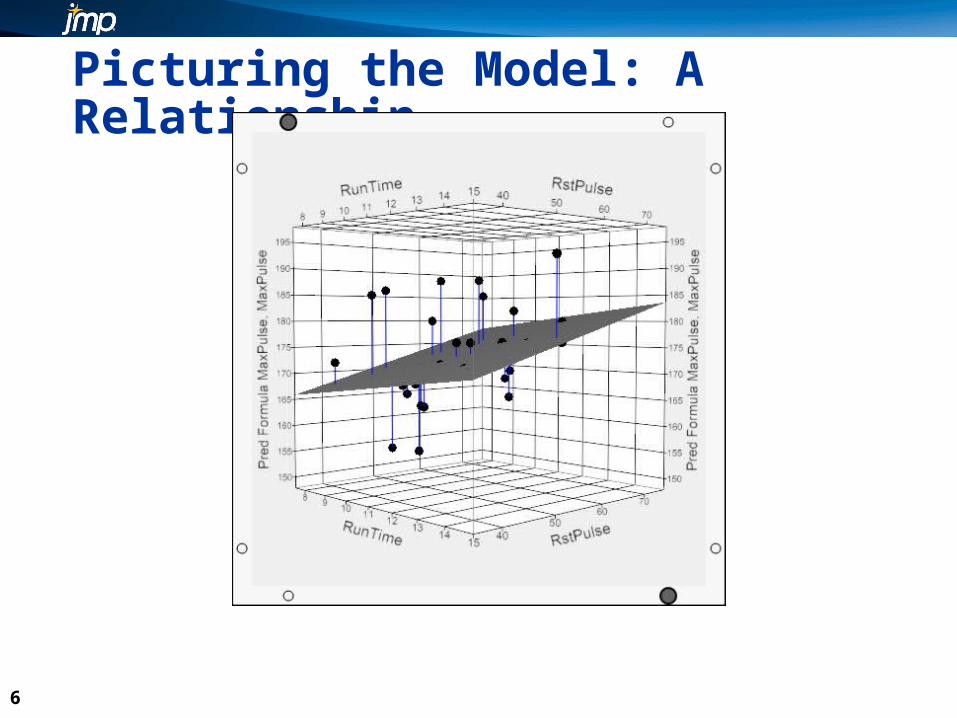
Picturing the Model: A Relationship
6
7
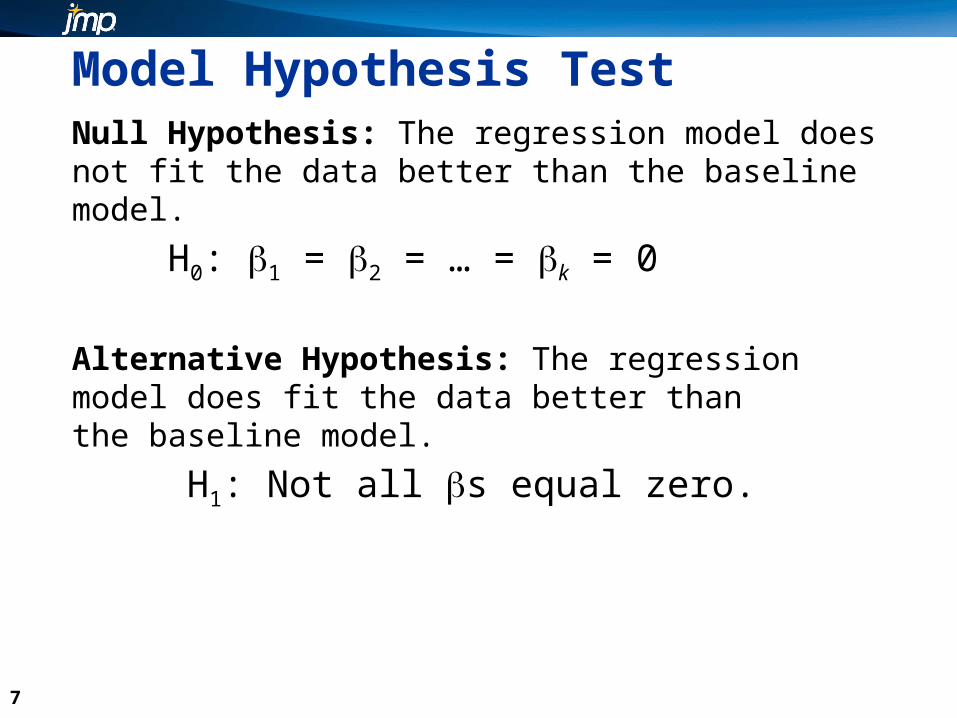
Model Hypothesis TestNull Hypothesis: The regression model does not fit the data better than the baseline model.
H0: 1 = 2 = … = k = 0
Alternative Hypothesis: The regression model does fit the data better than the baseline model.
H1: Not all s equal zero.
7
8
5.01 Multiple Choice PollWhich statistic in the ANOVA table tests the overall hypothesis?
a. Fb. tc. R2
d. Adjusted R2
8
9
5.01 Multiple Choice Poll – Correct AnswerWhich statistic in the ANOVA table tests the overall hypothesis?
a. Fb. tc. R2
d. Adjusted R2
9
10
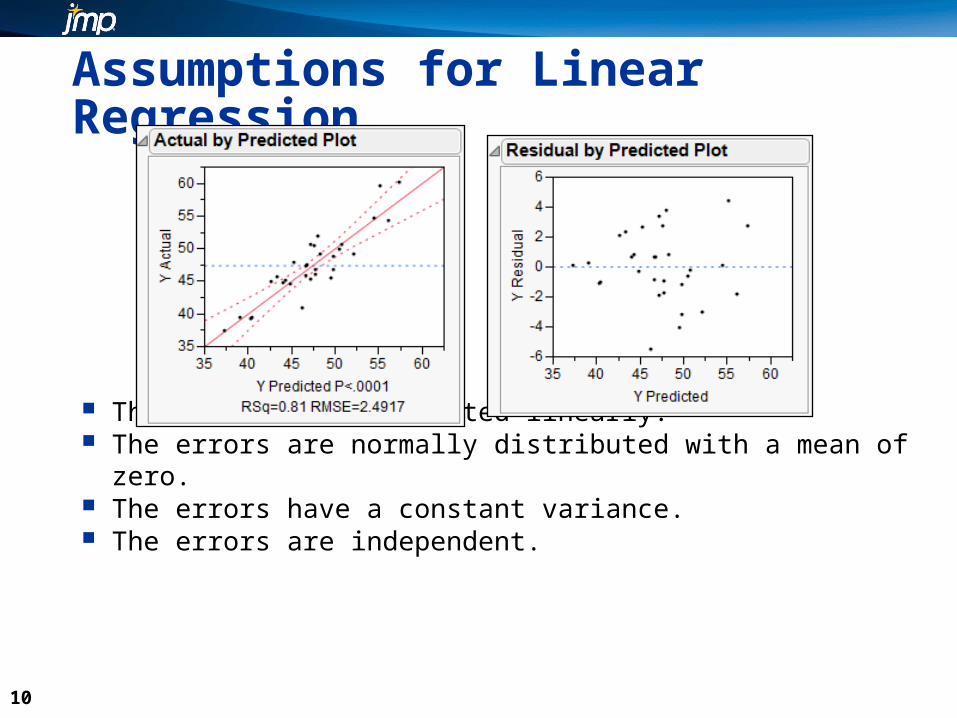
Assumptions for Linear Regression
The variables are related linearly. The errors are normally distributed with a mean of zero. The errors have a constant variance. The errors are independent.
10
11
Multiple Linear Regression versus Simple Linear RegressionMain Advantage
Multiple linear regression enables an investigation of the relationship between Y and several independent variables simultaneously.
Main Disadvantages
Increased complexity makes it more difficult to ascertain which model is best interpret the models.
11
12
Common ApplicationsMultiple linear regression is a powerful tool for Prediction – to develop a model to predict future
values of a response variable (Y) based on its relationships with other predictor variables (Xs)
Analytical or Explanatory Analysis – to develop an understanding of the relationships between the response variable and predictor variables.
12
13
PredictionSometimes the terms in the model, the values of their coefficients, and their statistical significance are of secondary importance.
The focus is on producing a model that is the best at predicting future values of Y as a function of the Xs. The predicted value of Y is given by
13
Y = β0 + β1X1 + … + βkXk
14
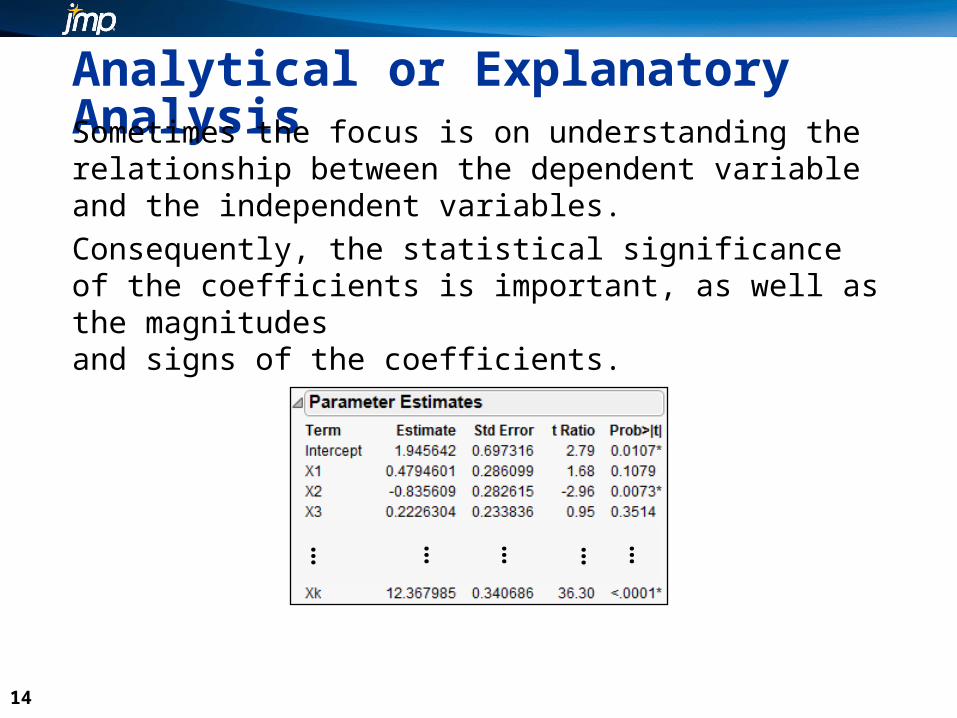
Analytical or Explanatory AnalysisSometimes the focus is on understanding the relationship between the dependent variable and the independent variables.
Consequently, the statistical significance of the coefficients is important, as well as the magnitudes and signs of the coefficients.
14
… …… … …
15
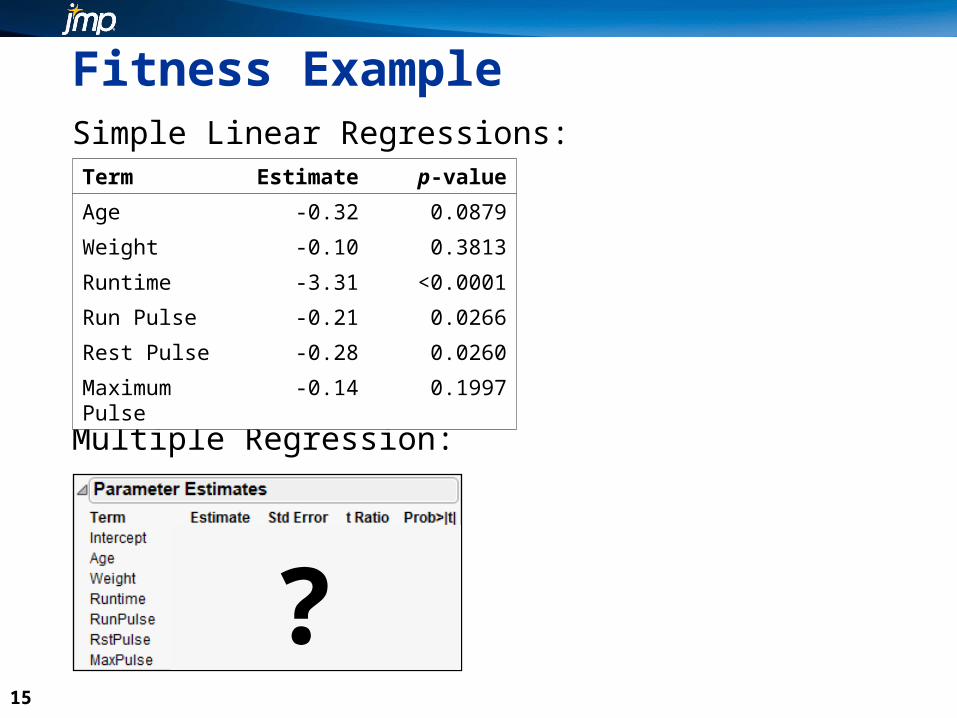
Fitness ExampleSimple Linear Regressions:
Multiple Regression:
15
Term Estimate p-value
Age -0.32 0.0879
Weight -0.10 0.3813
Runtime -3.31 <0.0001
Run Pulse -0.21 0.0266
Rest Pulse -0.28 0.0260
Maximum Pulse -0.14 0.1997
?
16
This demonstration illustrates the concepts discussed previously.
Fitting a Multiple Regression Model

17
1818
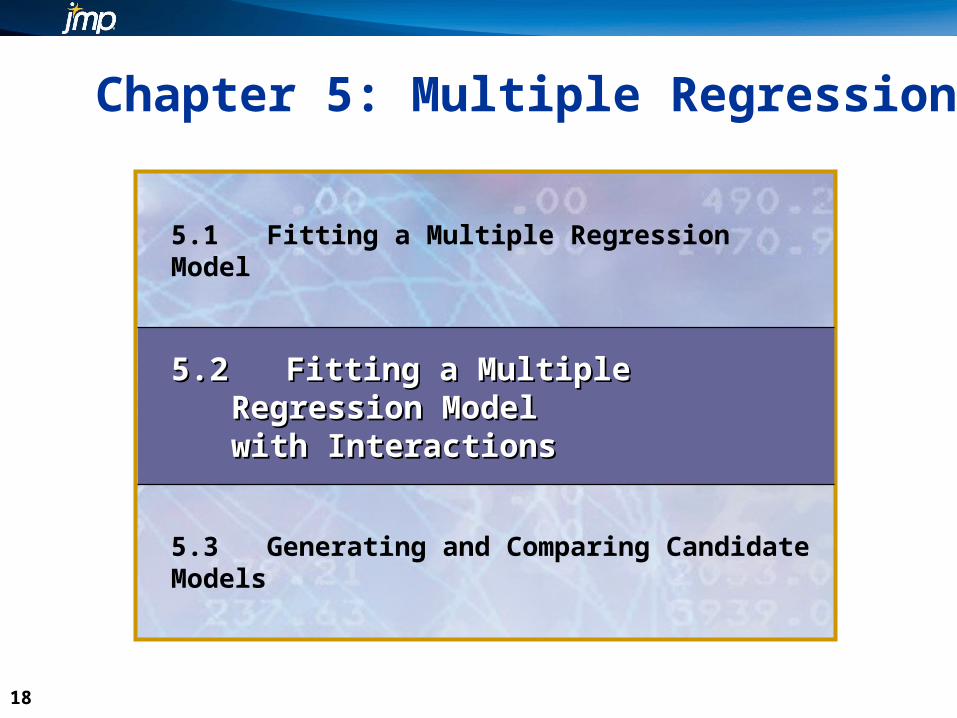
Chapter 5: Multiple Regression
5.1 Fitting a Multiple Regression Model
5.2 Fitting a Multiple Regression Model 5.2 Fitting a Multiple Regression Model with Interactionswith Interactions
5.3 Generating and Comparing Candidate Models

19
Objectives Add interactions to a multiple regression model. Fit a multiple regression model with interactions.
19
20
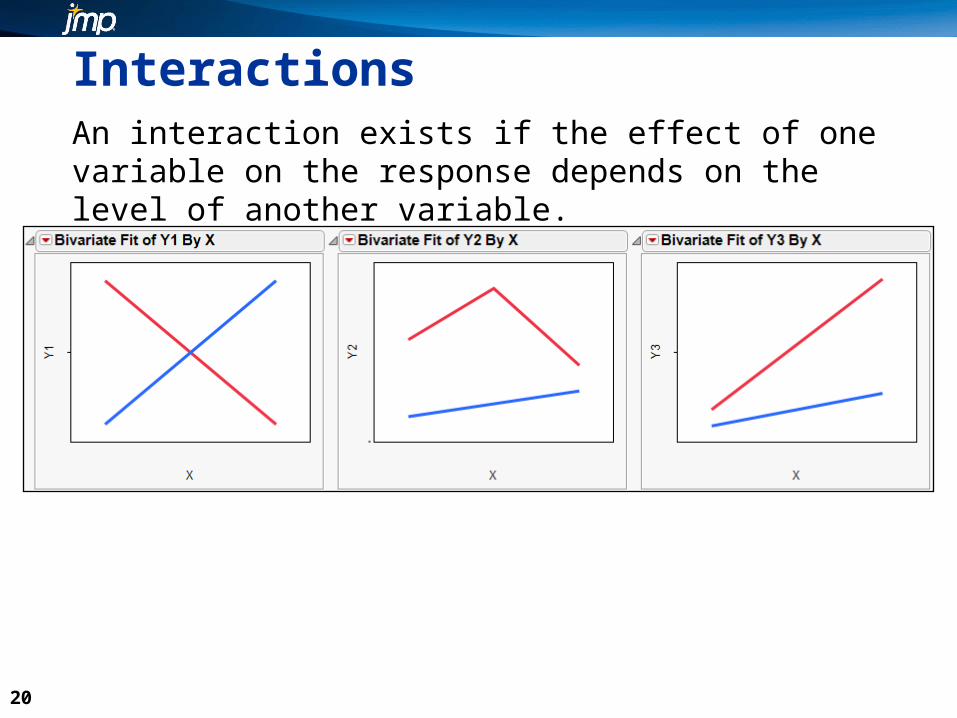
InteractionsAn interaction exists if the effect of one variable on the response depends on the level of another variable.
20
21
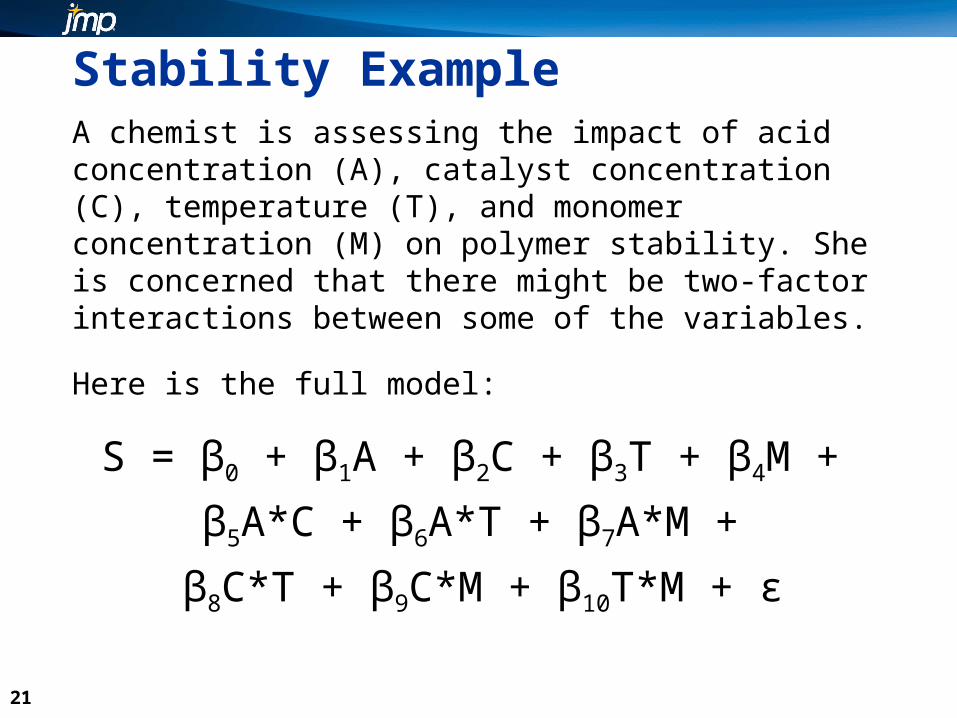
Stability ExampleA chemist is assessing the impact of acid concentration (A), catalyst concentration (C), temperature (T), and monomer concentration (M) on polymer stability. She is concerned that there might be two-factor interactions between some of the variables.
Here is the full model:
S = β0 + β1A + β2C + β3T + β4M +
β5A*C + β6A*T + β7A*M +
β8C*T + β9C*M + β10T*M + ε
21
22
This demonstration illustrates the concepts discussed previously.
Fitting a Multiple Regression Model with Interactions
23
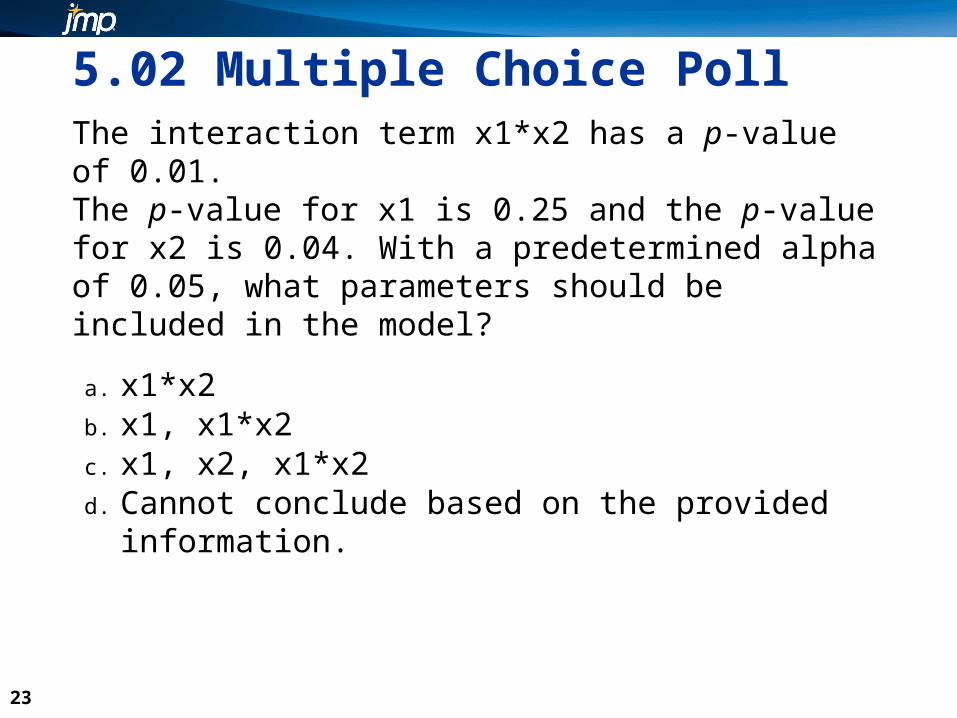
5.02 Multiple Choice PollThe interaction term x1*x2 has a p-value of 0.01. The p-value for x1 is 0.25 and the p-value for x2 is 0.04. With a predetermined alpha of 0.05, what parameters should be included in the model?
a. x1*x2b. x1, x1*x2c. x1, x2, x1*x2d. Cannot conclude based on the provided information.
23
24
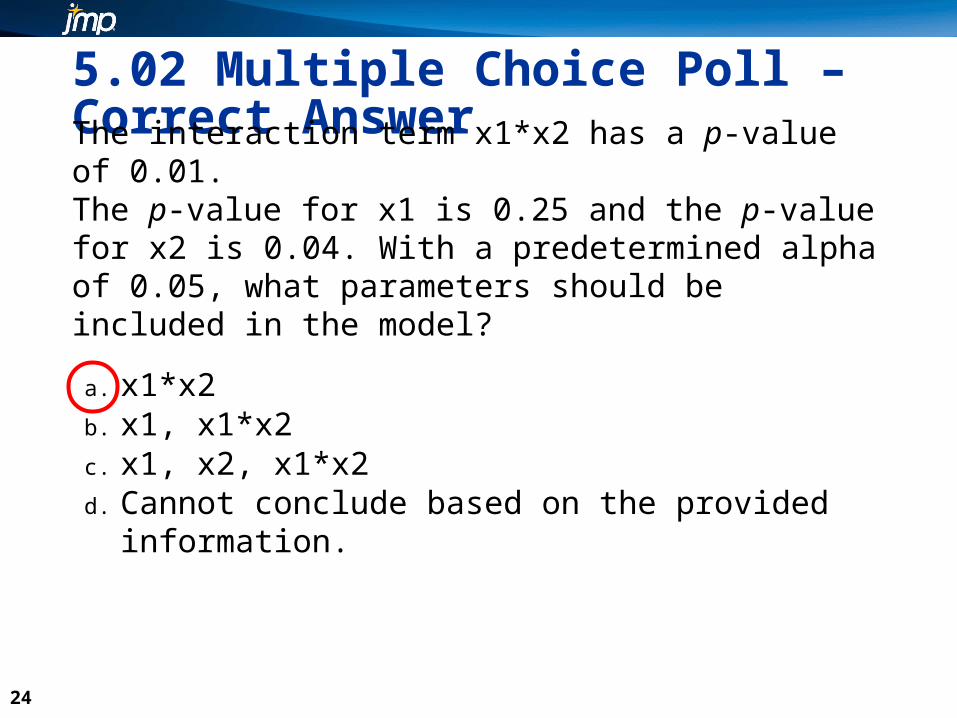
5.02 Multiple Choice Poll – Correct AnswerThe interaction term x1*x2 has a p-value of 0.01. The p-value for x1 is 0.25 and the p-value for x2 is 0.04. With a predetermined alpha of 0.05, what parameters should be included in the model?
a. x1*x2b. x1, x1*x2c. x1, x2, x1*x2d. Cannot conclude based on the provided information.
24

25
2626
Chapter 5: Multiple Regression
5.1 Fitting a Multiple Regression Model
5.2 Fitting a Multiple Regression Model with Interactions
5.3 Generating and Comparing Candidate Models5.3 Generating and Comparing Candidate Models
27
Objectives Identify candidate models. Compute various statistics to evaluate candidate
models.
27
28
Model SelectionEliminating one variable at a time manually for a small number of predictor variables is a reasonable
approach numerous predictor variables can take a lot of time.
28
29
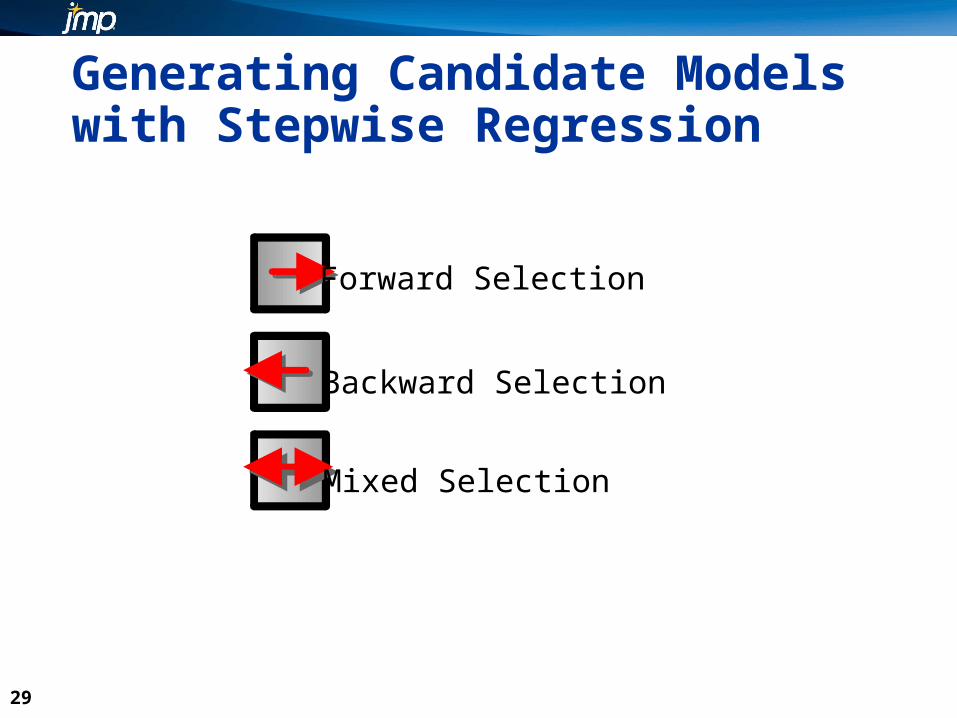
Generating Candidate Models with Stepwise Regression
29
Forward Selection
Backward Selection
Mixed Selection
30
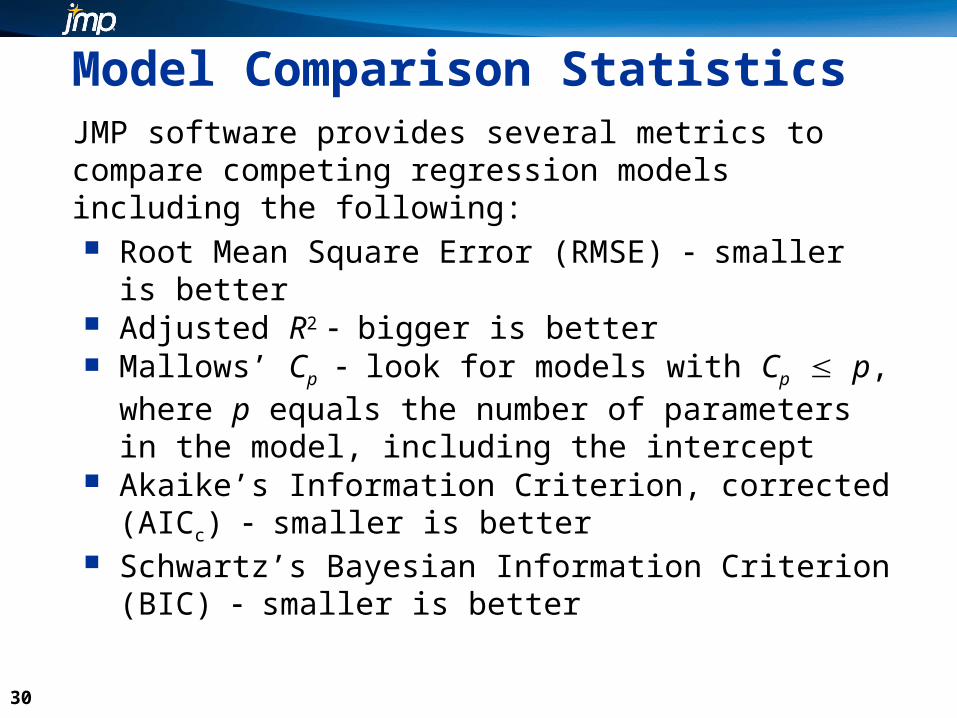
Model Comparison StatisticsJMP software provides several metrics to compare competing regression models including the following: Root Mean Square Error (RMSE) smaller is better Adjusted R2 bigger is better Mallows’ Cp look for models with Cp p, where p
equals the number of parameters in the model, including the intercept
Akaike’s Information Criterion, corrected (AICc) smaller is better
Schwartz’s Bayesian Information Criterion (BIC) smaller is better
30

31
This demonstration illustrates the concepts discussed previously.
Generating and Comparing Candidate Models
32
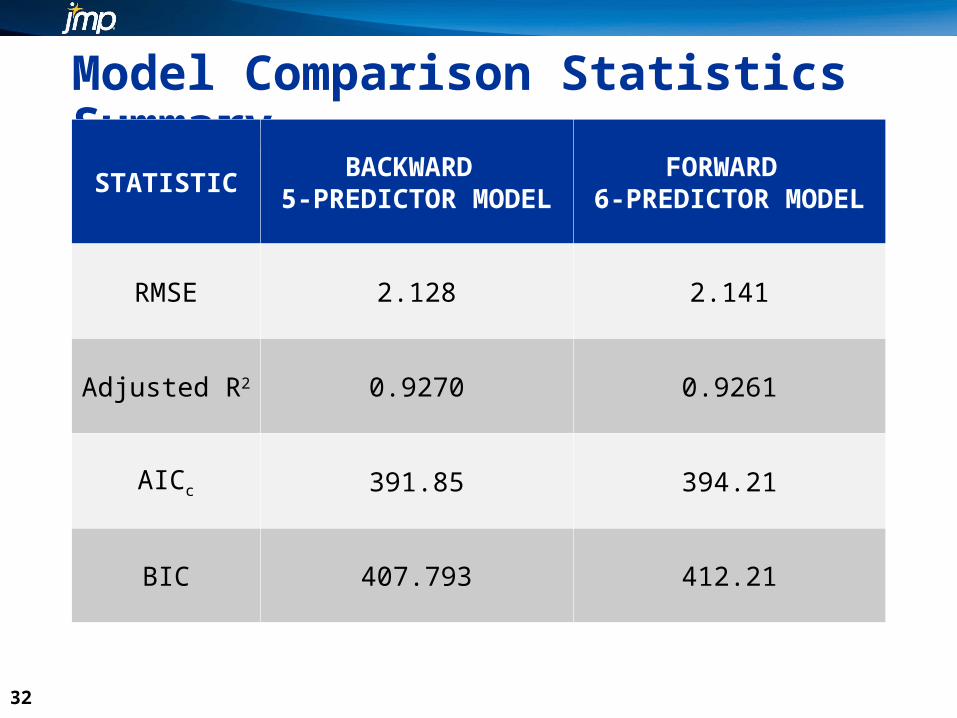
Model Comparison Statistics Summary
STATISTICBACKWARD
5-PREDICTOR MODELFORWARD
6-PREDICTOR MODEL
RMSE 2.128 2.141
Adjusted R2 0.9270 0.9261
AICc 391.85 394.21
BIC 407.793 412.21
32

33

34
This exercise reinforces the concepts discussed previously.
Exercise
35
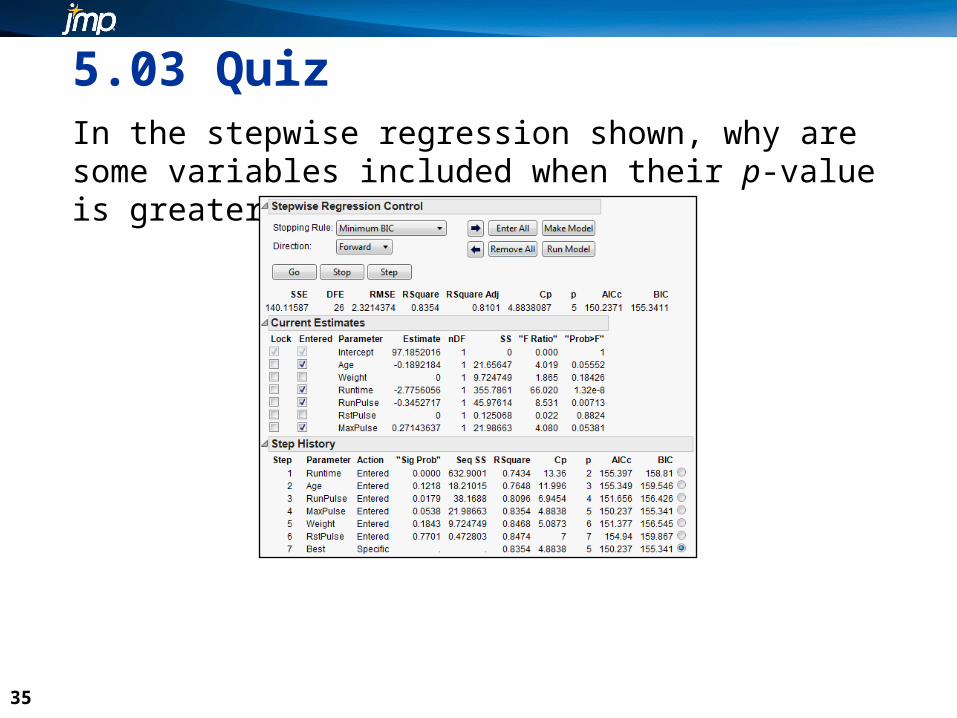
5.03 QuizIn the stepwise regression shown, why are some variables included when their p-value is greater than 0.05?
35
36
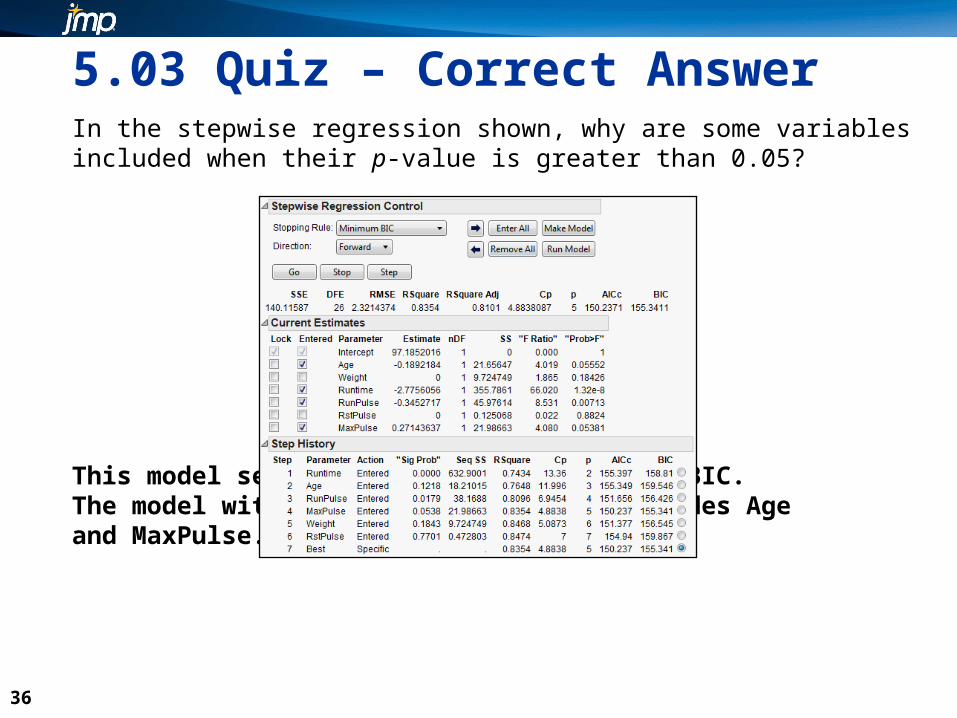
5.03 Quiz – Correct AnswerIn the stepwise regression shown, why are some variables included when their p-value is greater than 0.05?
This model selection is based on Minimum BIC. The model with the lowest BIC value includes Age and MaxPulse.
36
Related Documents