1 - 1 © 2014 Pearson Education Operations and Productivity PowerPoint presentation to accompany Heizer and Render Operations Management, Global Edition, Eleventh Edition Principles of Operations Management, Global Edition, Ninth Edition PowerPoint slides by Jeff Heyl 1 1 © 2014 Pearson Education

Welcome message from author
This document is posted to help you gain knowledge. Please leave a comment to let me know what you think about it! Share it to your friends and learn new things together.
Transcript
1 - 1© 2014 Pearson Education
Operations and Productivity
PowerPoint presentation to accompany Heizer and Render Operations Management, Global Edition, Eleventh EditionPrinciples of Operations Management, Global Edition, Ninth Edition
PowerPoint slides by Jeff Heyl
11
© 2014 Pearson Education

1 - 2© 2014 Pearson Education
What Is Operations Management?
Production is the creation of goods and services
Operations management (OM) is the set of activities that create value in the form of goods and services by transforming inputs
into outputs
1 - 3© 2014 Pearson Education
Organizing to Produce Goods and Services
▶ Essential functions:
1. Marketing – generates demand
2. Production/operations – creates the product
3. Finance/accounting – tracks how well the organization is doing, pays bills, collects the money
4. Human Resources – provides labor, employs, assigns and gives training.

1 - 4© 2014 Pearson Education
The Supply Chain▶A global network of organizations and
activities that supply a firm with goods and services
▶Members of the supply chain collaborate to achieve high levels of customer satisfaction, efficiency and competitive advantage.
Figure 1.2
Farmer Syrup Bottler Distributor Retailerproducer
1 - 5© 2014 Pearson Education
Why Study OM?1. OM is one of four major functions of any
organization, we want to study how people organize themselves for productive enterprise
2. We want (and need) to know how goods and services are produced
3. We want to understand what operations managers do
4. OM is such a costly part of an organization
1 - 6© 2014 Pearson Education
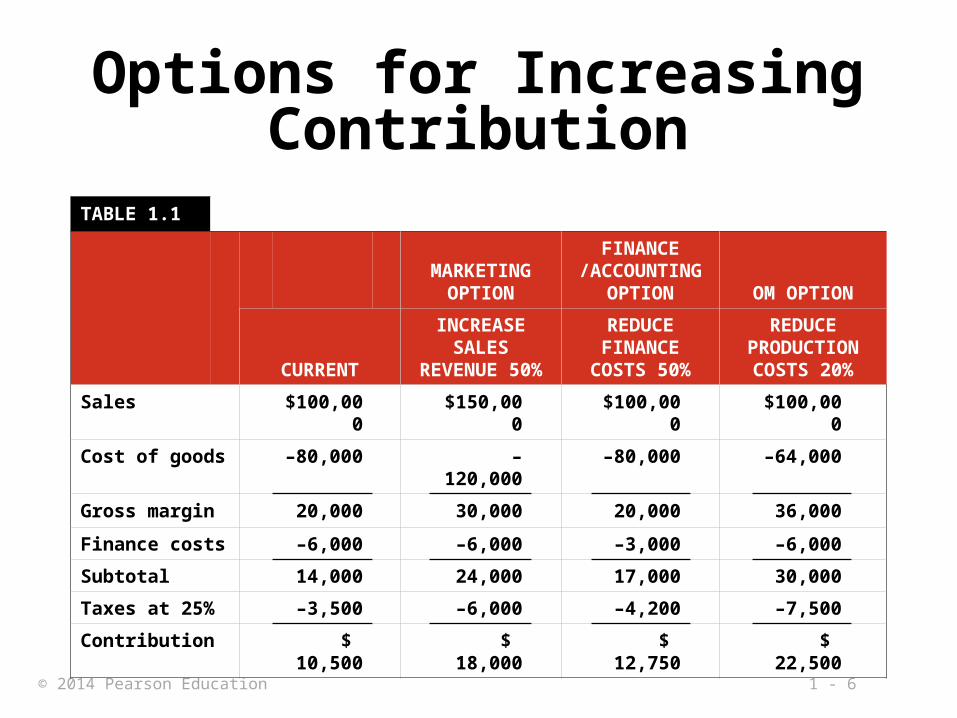
Options for Increasing Contribution
TABLE 1.1
MARKETING OPTION
FINANCE /ACCOUNTING
OPTION OM OPTION
CURRENT
INCREASE SALES
REVENUE 50%
REDUCE FINANCE
COSTS 50%
REDUCE PRODUCTION COSTS 20%
Sales $100,000 $150,000 $100,000 $100,000
Cost of goods –80,000 –120,000 –80,000 –64,000
Gross margin 20,000 30,000 20,000 36,000
Finance costs –6,000 –6,000 –3,000 –6,000
Subtotal 14,000 24,000 17,000 30,000
Taxes at 25% –3,500 –6,000 –4,200 –7,500
Contribution $ 10,500 $ 18,000 $ 12,750 $ 22,500
1 - 7© 2014 Pearson Education
What Operations Managers Do
Basic Management Functions
▶Planning▶Organizing▶Staffing▶Leading▶Controlling
1 - 8© 2014 Pearson Education
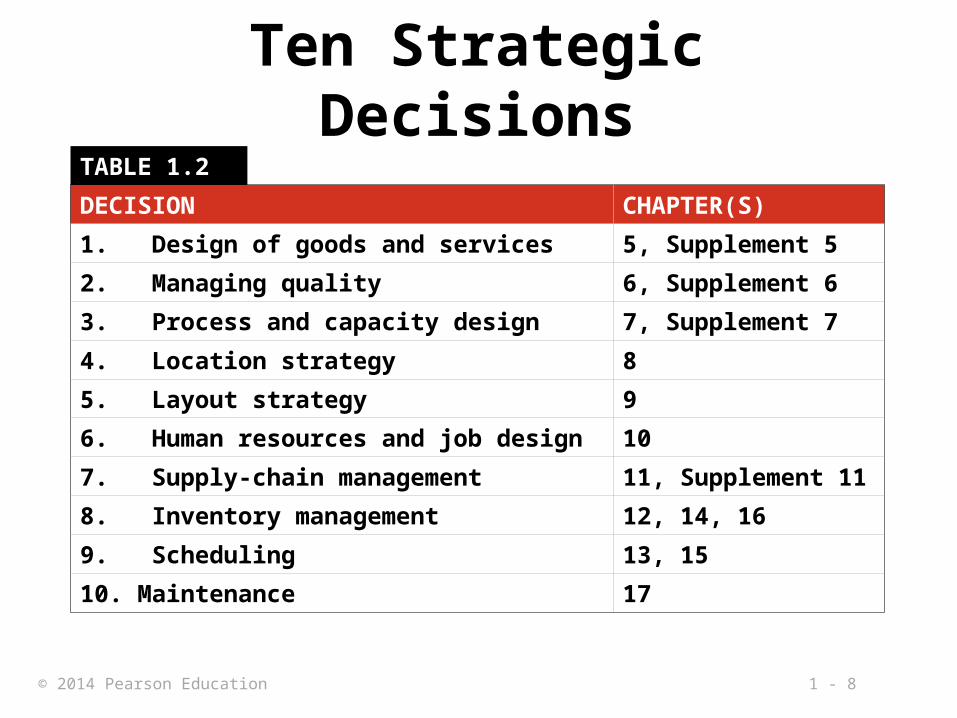
Ten Strategic DecisionsTABLE 1.2
DECISION CHAPTER(S)
1. Design of goods and services 5, Supplement 5
2. Managing quality 6, Supplement 6
3. Process and capacity design 7, Supplement 7
4. Location strategy 8
5. Layout strategy 9
6. Human resources and job design 10
7. Supply-chain management 11, Supplement 11
8. Inventory management 12, 14, 16
9. Scheduling 13, 15
10. Maintenance 17
1 - 9© 2014 Pearson Education
The Strategic Decisions
1. Design of goods and services▶ Defines what is required of operations
▶ Product design determines quality, sustainability and human resources
2. Managing quality▶ Determine the customer’s quality
expectations
▶ Establish policies and procedures to identify and achieve that quality
Table 1.2 (cont.)

1 - 10© 2014 Pearson Education
The Strategic Decisions
3. Process and capacity design▶ How is a good or service produced?
▶ Commits management to specific technology, quality, resources, and investment.
4. Location strategy▶ Nearness to customers, suppliers, and
talent.
▶ Considering costs, infrastructure, logistics, and government.
Table 1.2 (cont.)

1 - 11© 2014 Pearson Education
The Strategic Decisions5. Layout strategy
▶ Integrate capacity needs, personnel levels, technology, and inventory
▶ Determine the efficient flow of materials, people, and information.
6. Human resources and job design▶ Recruit, motivate, and retain personnel with
the required talent and skills.
▶ Integral and expensive part of the total system design.
Table 1.2 (cont.)

1 - 12© 2014 Pearson Education
The Strategic Decisions7. Supply-chain management
▶ Integrate supply chain into the firm’s strategy.
▶ Determine what is to be purchased, from whom, and under what conditions.
8. Inventory management▶ Inventory ordering and holding decisions.
▶ Optimize considering customer satisfaction, supplier capability, and production schedules.
Table 1.2 (cont.)

1 - 13© 2014 Pearson Education
The Strategic Decisions9. Scheduling
▶ Determine and implement intermediate- and short-term schedules.
▶ Utilize personnel and facilities while meeting customer demands.
10. Maintenance▶ Consider facility capacity, production
demands, and personnel.
▶ Maintain a reliable and stable process.
Table 1.2 (cont.)

1 - 14© 2014 Pearson Education
Significant Events in OM
Figure 1.4
1 - 15© 2014 Pearson Education
The Heritage of OM
▶ Division of labor (Adam Smith 1776; Charles Babbage 1852)
▶ Standardized parts (Whitney 1800)
▶ Scientific Management (Taylor 1881)
▶ Coordinated assembly line (Ford/ Sorenson 1913)
▶ Gantt charts (Gantt 1916)
▶ Motion study (Frank and Lillian Gilbreth 1922)
▶ Quality control (Shewhart 1924; Deming 1950)

1 - 16© 2014 Pearson Education
The Heritage of OM
▶ Computer (Atanasoff 1938)
▶ CPM/PERT (DuPont 1957, Navy 1958)
▶ Material requirements planning (Orlicky 1960)
▶ Computer aided design (CAD 1970)
▶ Flexible manufacturing system (FMS 1975)
▶ Baldrige Quality Awards (1980)
▶ Computer integrated manufacturing (1990)
▶ Globalization (1992)
▶ Internet (1995)
1 - 17© 2014 Pearson Education
Eli Whitney
▶ Born 1765; died 1825
▶ In 1798, received government contract to make 10,000 muskets
▶ Showed that machine tools could make standardized parts to exact specifications▶ Musket parts could be used in any
musket
1 - 18© 2014 Pearson Education
Frederick W. Taylor
▶ Born 1856; died 1915
▶ Known as ‘father of scientific management’
▶ In 1881, as chief engineer for Midvale Steel, studied how tasks were done▶ Began first motion and time studies
▶ Created efficiency principles
1 - 19© 2014 Pearson Education
Taylor’s Principles
Management Should Take More Responsibility for:
► Matching employees to right job► Providing the proper training► Providing proper work methods and
tools► Establishing legitimate incentives for
work to be accomplished
1 - 20© 2014 Pearson Education
Frank & Lillian Gilbreth▶ Frank (1868-1924); Lillian (1878-1972)
▶ Husband-and-wife engineering team
▶ Further developed work measurement methods
▶ Applied efficiency methods to their home and 12 children!
▶ Book & Movie: “Cheaper by the Dozen,” “Bells on Their Toes”
1 - 21© 2014 Pearson Education
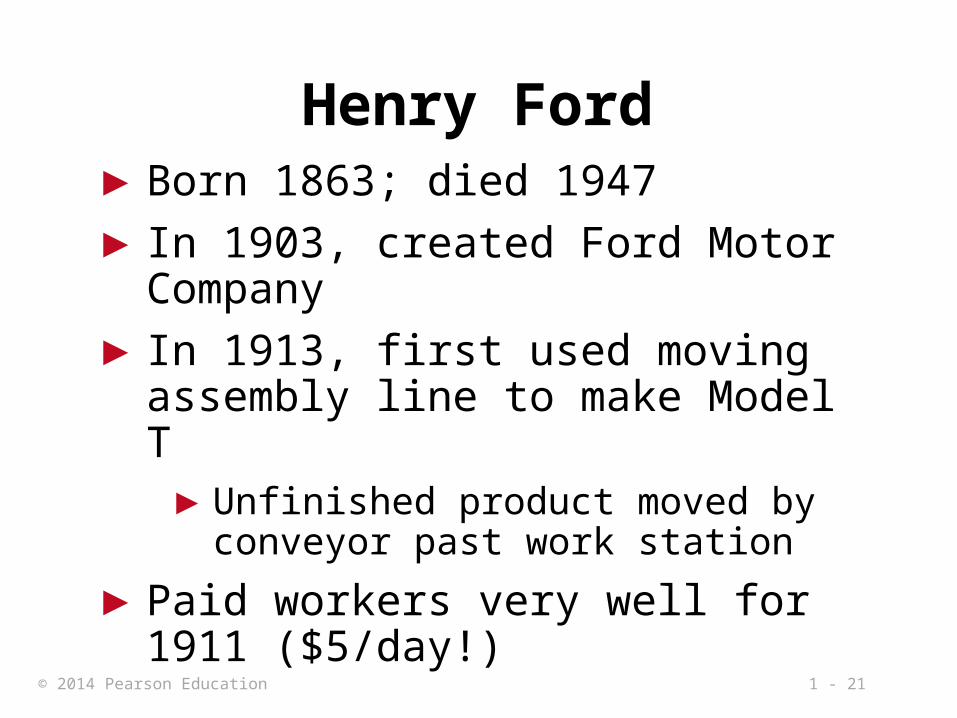
▶ Born 1863; died 1947
▶ In 1903, created Ford Motor Company
▶ In 1913, first used moving assembly line to make Model T▶ Unfinished product moved by conveyor
past work station
▶ Paid workers very well for 1911 ($5/day!)
Henry Ford

1 - 22© 2014 Pearson Education
W. Edwards Deming
▶ Born 1900; died 1993
▶ Engineer and physicist
▶ Credited with teaching Japan quality control methods in post-WW2
▶ Used statistics to analyze process
▶ His methods involve workers in decisions
1 - 23© 2014 Pearson Education
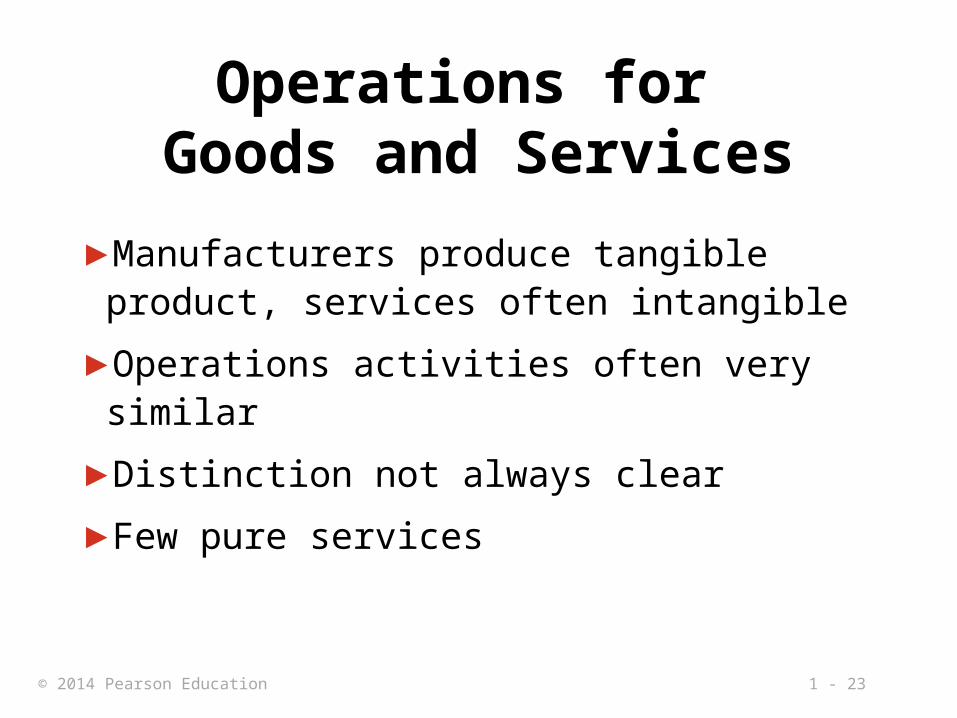
Operations for Goods and Services
▶Manufacturers produce tangible product, services often intangible
▶Operations activities often very similar
▶Distinction not always clear
▶Few pure services
1 - 24© 2014 Pearson Education
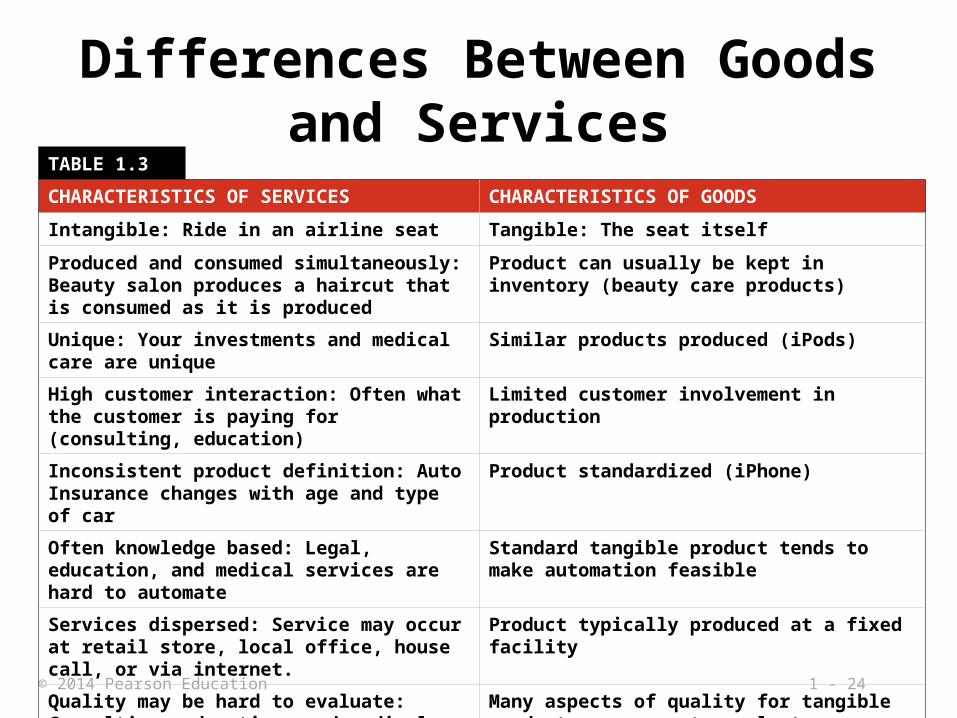
Differences Between Goods and Services
TABLE 1.3
CHARACTERISTICS OF SERVICES CHARACTERISTICS OF GOODS
Intangible: Ride in an airline seat Tangible: The seat itself
Produced and consumed simultaneously: Beauty salon produces a haircut that is consumed as it is produced
Product can usually be kept in inventory (beauty care products)
Unique: Your investments and medical care are unique
Similar products produced (iPods)
High customer interaction: Often what the customer is paying for (consulting, education)
Limited customer involvement in production
Inconsistent product definition: Auto Insurance changes with age and type of car
Product standardized (iPhone)
Often knowledge based: Legal, education, and medical services are hard to automate
Standard tangible product tends to make automation feasible
Services dispersed: Service may occur at retail store, local office, house call, or via internet.
Product typically produced at a fixed facility
Quality may be hard to evaluate: Consulting, education, and medical services
Many aspects of quality for tangible products are easy to evaluate (strength of a bolt)
Reselling is unusual: Musical concert or medical care Product often has some residual value
1 - 25© 2014 Pearson Education
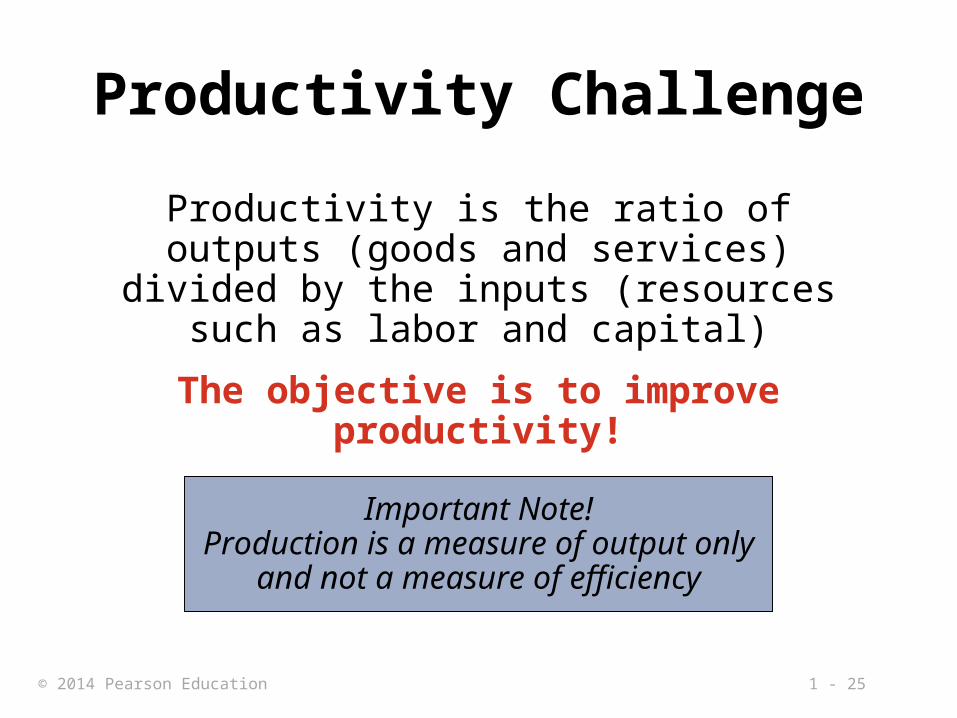
Productivity Challenge
Productivity is the ratio of outputs (goods and services) divided by the inputs (resources
such as labor and capital)
The objective is to improve productivity!
Important Note!Production is a measure of output only
and not a measure of efficiency
1 - 26© 2014 Pearson Education
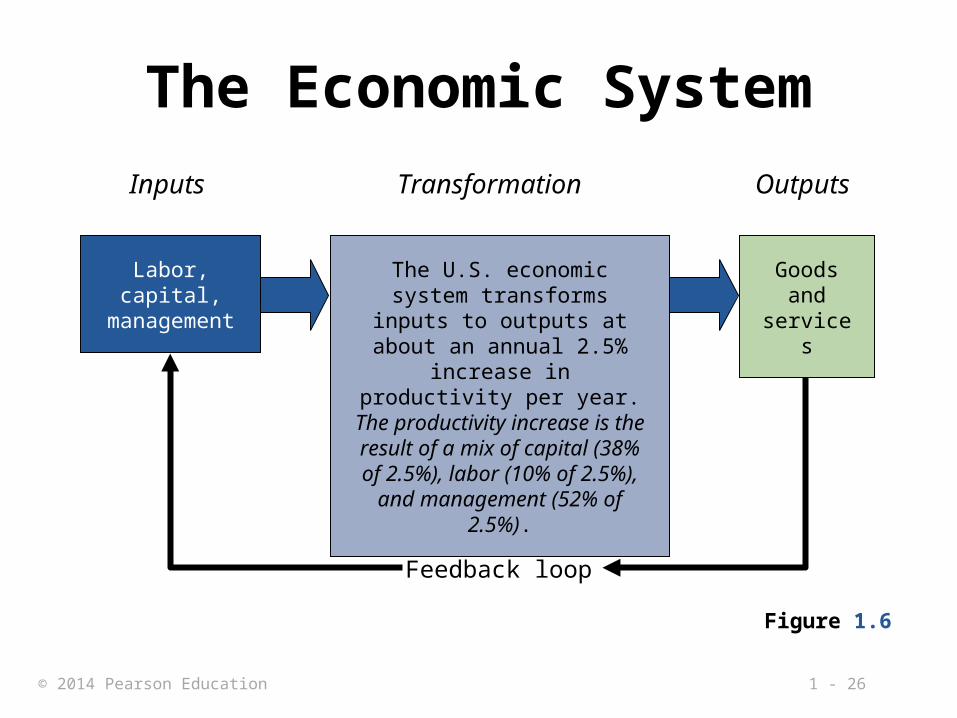
Feedback loop
Outputs
Goods and
services
Transformation
The U.S. economic system transforms inputs to outputs at about an annual 2.5% increase
in productivity per year. The productivity increase is the
result of a mix of capital (38% of 2.5%), labor (10% of 2.5%),
and management (52% of 2.5%).
The Economic System
Inputs
Labor,capital,
management
Figure 1.6

1 - 27© 2014 Pearson Education
Improving Productivity at Starbucks
A team of 10 analysts continually look for ways to shave time. Some improvements:
Stop requiring signatures on credit card purchases under $25
Saved 8 seconds per transaction
Change the size of the ice scoop
Saved 14 seconds per drink
New espresso machines Saved 12 seconds per shot
1 - 28© 2014 Pearson Education
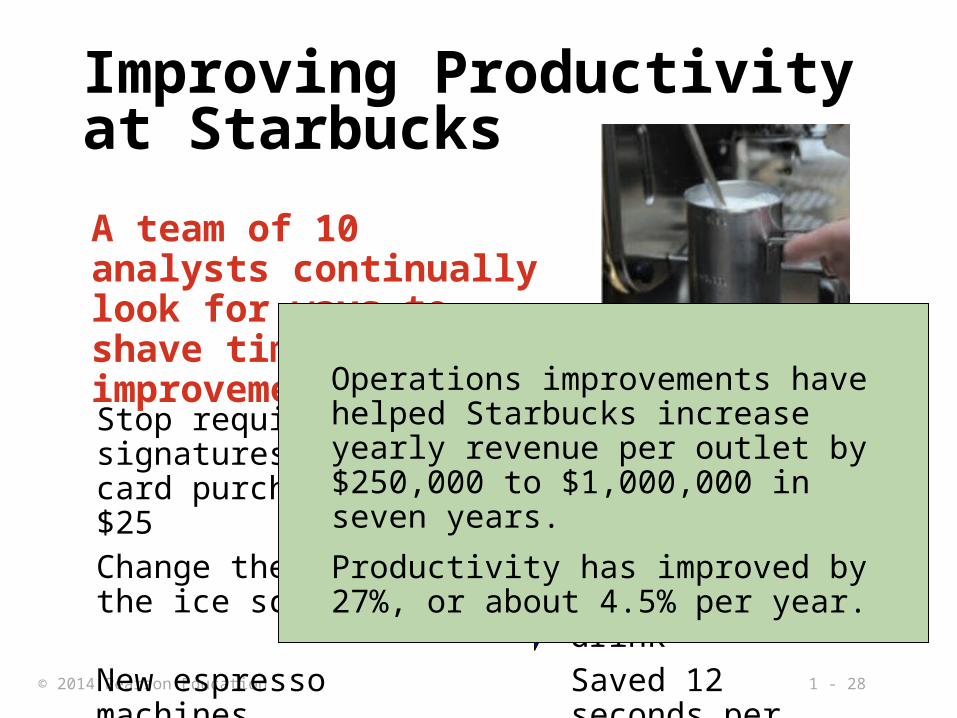
Improving Productivity at Starbucks
A team of 10 analysts continually look for ways to shave time. Some improvements:
Stop requiring signatures on credit card purchases under $25
Saved 8 seconds per transaction
Change the size of the ice scoop
Saved 14 seconds per drink
New espresso machines Saved 12 seconds per shot
Operations improvements have helped Starbucks increase yearly revenue per outlet by $250,000 to $1,000,000 in seven years.
Productivity has improved by 27%, or about 4.5% per year.

1 - 29© 2014 Pearson Education
▶ Measure of process improvement
▶ Represents output relative to input
▶ Only through productivity increases can our standard of living improve
Productivity
Productivity =Units produced
Input used

1 - 30© 2014 Pearson Education
Productivity Calculations
Productivity =Units produced
Labor-hours used
= = 4 units/labor-hour1,000
250
Labor Productivity
One resource input single-factor productivity

1 - 31© 2014 Pearson Education
Multi-Factor Productivity
OutputLabor + Material + Energy +
Capital + Miscellaneous
Productivity =
► Also known as total factor productivity
► Output and inputs are often expressed in dollars
Multiple resource inputs multi-factor productivity
1 - 32© 2014 Pearson Education
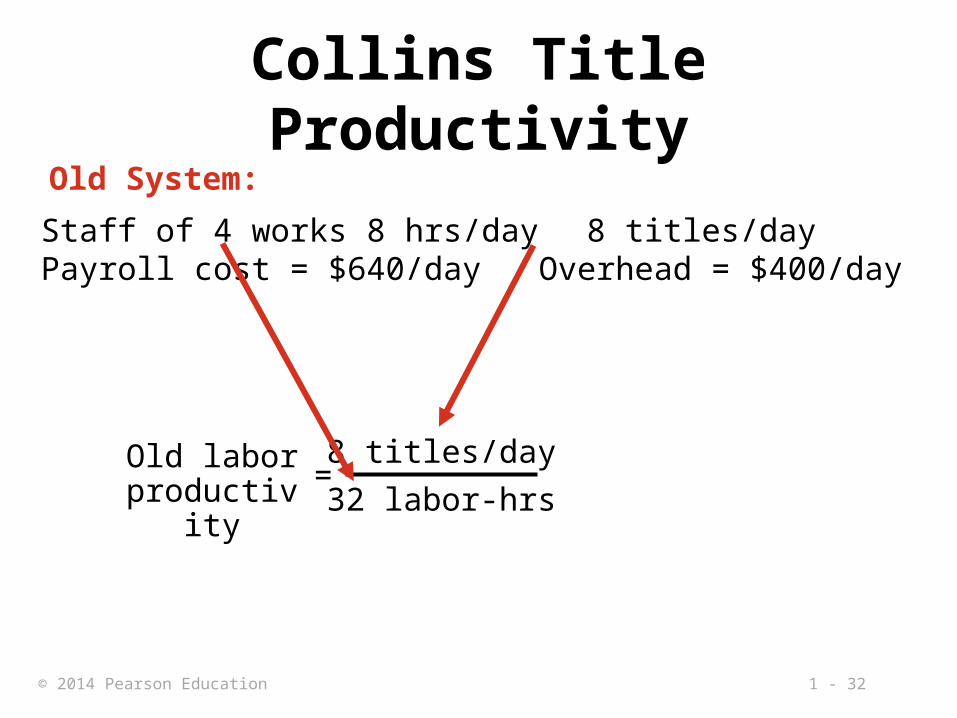
Collins Title Productivity
Staff of 4 works 8 hrs/day 8 titles/dayPayroll cost = $640/day Overhead = $400/day
Old System:
=Old labor
productivity8 titles/day
32 labor-hrs
1 - 33© 2014 Pearson Education
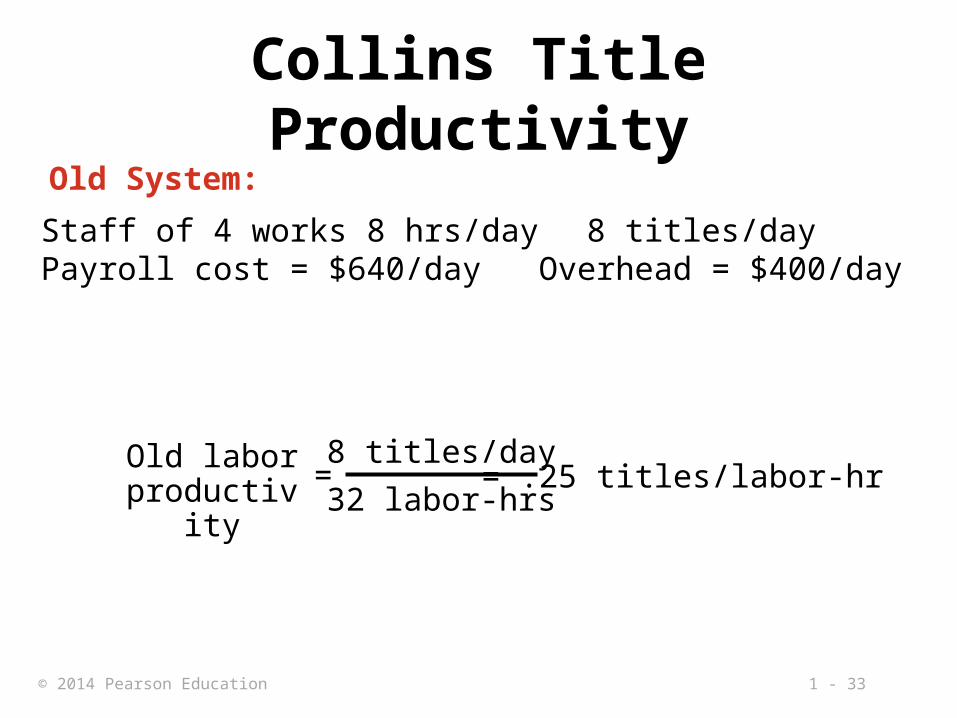
Collins Title Productivity
Staff of 4 works 8 hrs/day 8 titles/dayPayroll cost = $640/day Overhead = $400/day
Old System:
8 titles/day
32 labor-hrs=
Old labor productivity = .25 titles/labor-hr

1 - 34© 2014 Pearson Education
Collins Title Productivity
Staff of 4 works 8 hrs/day 8 titles/dayPayroll cost = $640/day Overhead = $400/day
Old System:
14 titles/day Overhead = $800/day
New System:
8 titles/day
32 labor-hrs=
Old labor productivity
=New labor
productivity
= .25 titles/labor-hr
14 titles/day
32 labor-hrs
1 - 35© 2014 Pearson Education
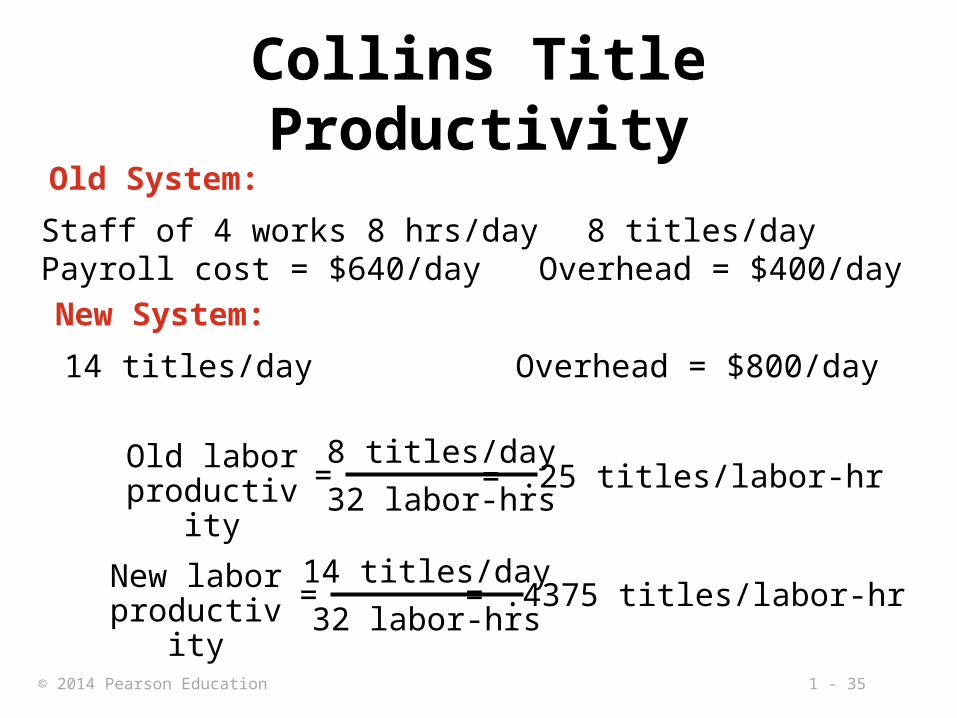
Collins Title Productivity
Staff of 4 works 8 hrs/day 8 titles/dayPayroll cost = $640/day Overhead = $400/day
Old System:
14 titles/day Overhead = $800/day
New System:
8 titles/day
32 labor-hrs=
Old labor productivity = .25 titles/labor-hr
14 titles/day
32 labor-hrs=
New labor productivity = .4375 titles/labor-hr
1 - 36© 2014 Pearson Education
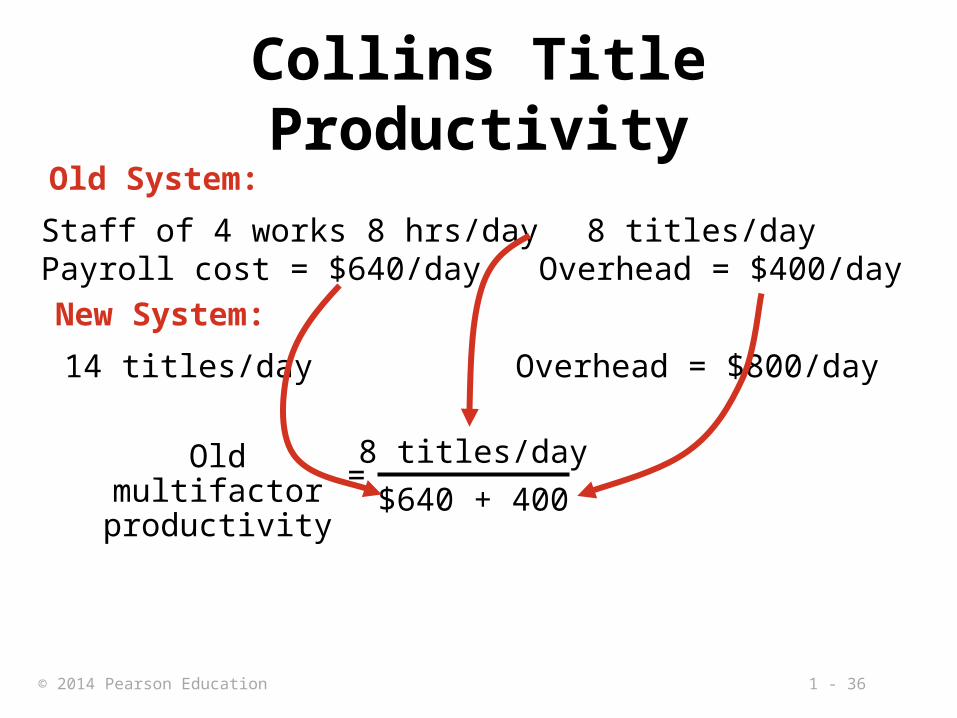
Collins Title Productivity
Staff of 4 works 8 hrs/day 8 titles/dayPayroll cost = $640/day Overhead = $400/day
Old System:
14 titles/day Overhead = $800/day
New System:
=Old multifactor
productivity8 titles/day
$640 + 400
1 - 37© 2014 Pearson Education
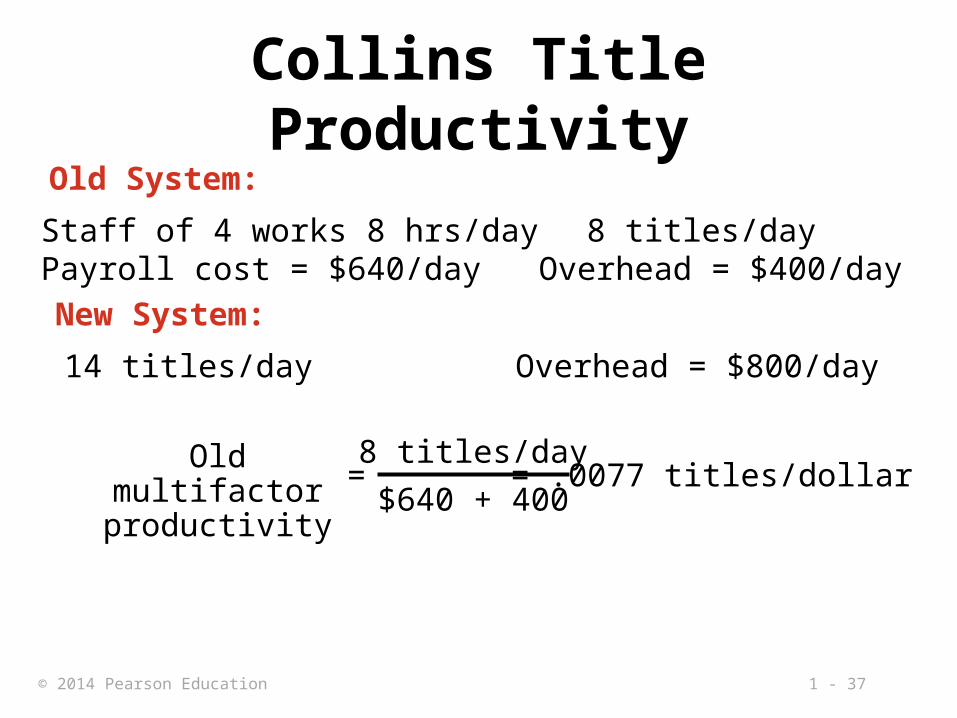
Collins Title Productivity
Staff of 4 works 8 hrs/day 8 titles/dayPayroll cost = $640/day Overhead = $400/day
Old System:
14 titles/day Overhead = $800/day
New System:
8 titles/day
$640 + 400=
Old multifactor productivity = .0077 titles/dollar

1 - 38© 2014 Pearson Education
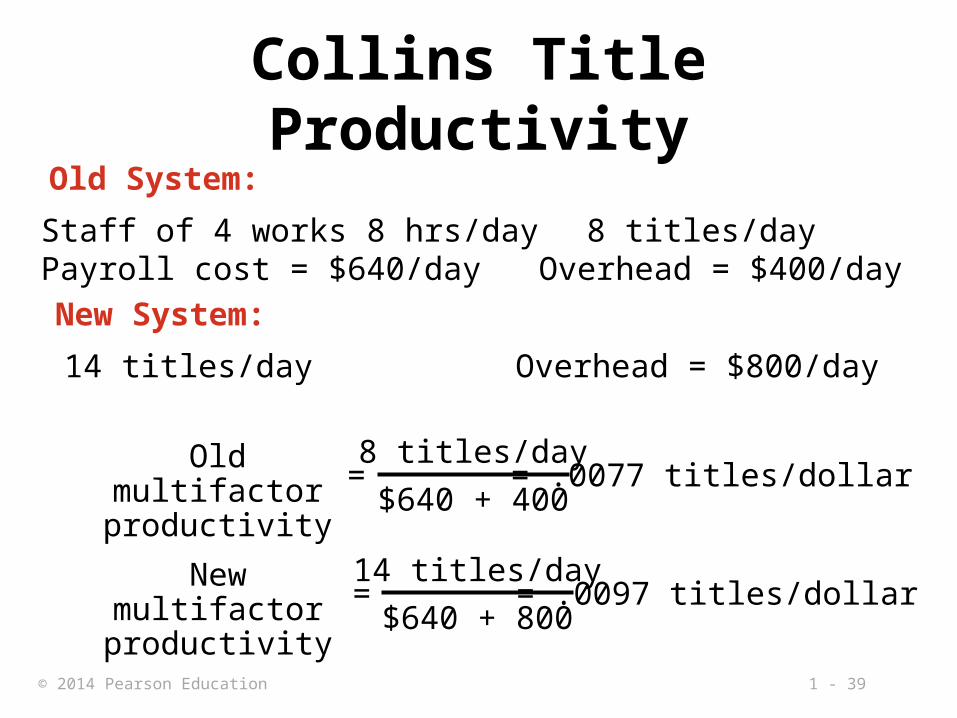
Collins Title Productivity
Staff of 4 works 8 hrs/day 8 titles/dayPayroll cost = $640/day Overhead = $400/day
Old System:
14 titles/day Overhead = $800/day
New System:
8 titles/day
$640 + 400=
Old multifactor productivity
=New multifactor
productivity
= .0077 titles/dollar
14 titles/day
$640 + 800
1 - 39© 2014 Pearson Education
Collins Title Productivity
Staff of 4 works 8 hrs/day 8 titles/dayPayroll cost = $640/day Overhead = $400/day
Old System:
14 titles/day Overhead = $800/day
New System:
8 titles/day
$640 + 400
14 titles/day
$640 + 800
=Old multifactor
productivity
=New multifactor
productivity
= .0077 titles/dollar
= .0097 titles/dollar

1 - 40© 2014 Pearson Education
Productivity Variables
1. Labor - contributes about 10% of the annual increase
2. Capital - contributes about 38% of the annual increase
3. Management - contributes about 52% of the annual increase
1 - 41© 2014 Pearson Education
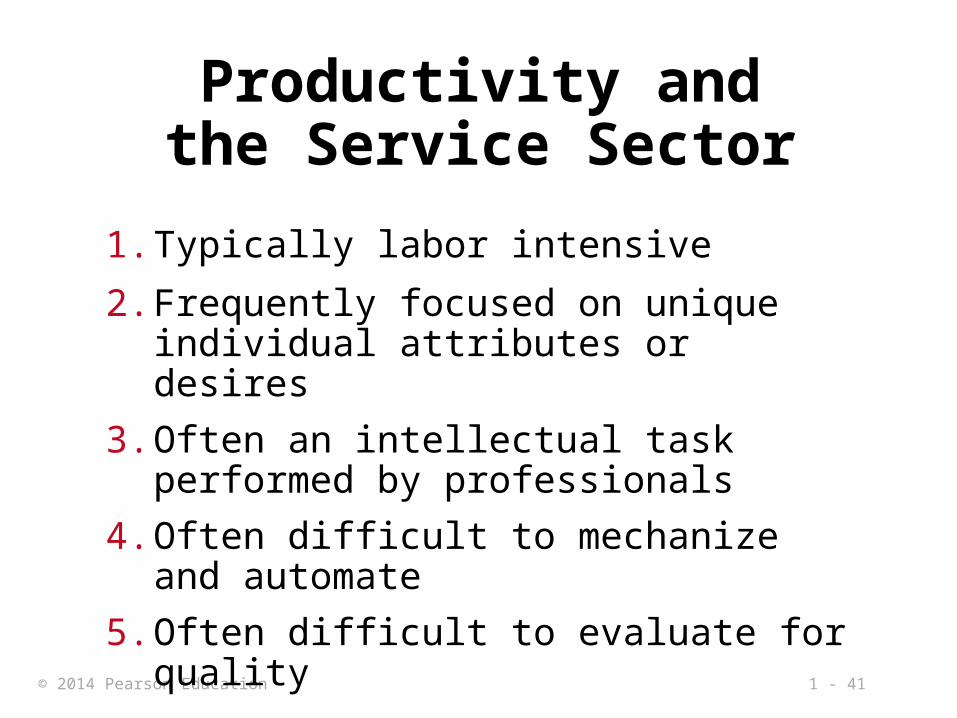
Productivity and the Service Sector
1. Typically labor intensive
2. Frequently focused on unique individual attributes or desires
3. Often an intellectual task performed by professionals
4. Often difficult to mechanize and automate
5. Often difficult to evaluate for quality
1 - 42© 2014 Pearson Education
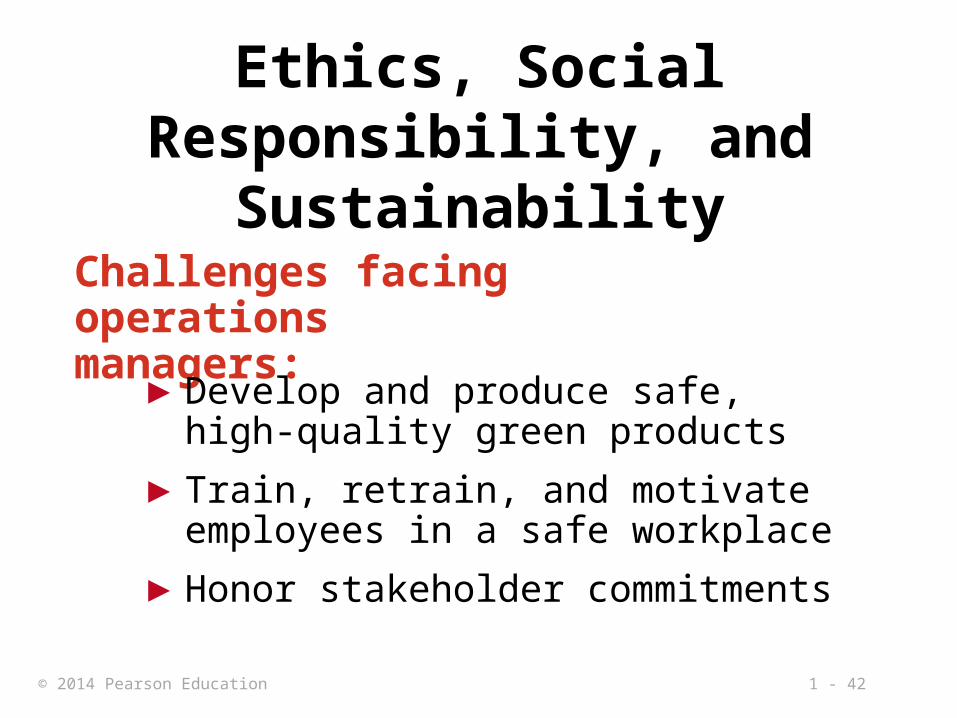
Ethics, Social Responsibility, and Sustainability
Challenges facing operations managers:
▶ Develop and produce safe, high-quality green products
▶ Train, retrain, and motivate employees in a safe workplace
▶ Honor stakeholder commitments
Related Documents


![[Jay Heizer, Barry Render]Operations Management 10e](https://static.cupdf.com/doc/110x72/55cf8e81550346703b92d9f3/jay-heizer-barry-renderoperations-management-10e-56427fb5ecb7b.jpg)


