Final Report 2015 CMP Update Marin County September 24, 2015

Welcome message from author
This document is posted to help you gain knowledge. Please leave a comment to let me know what you think about it! Share it to your friends and learn new things together.
Transcript
Final Report 2015 CMP Update
Marin CountySeptember 24, 2015

Marin County, Draft CMP Update
iTable of Contents
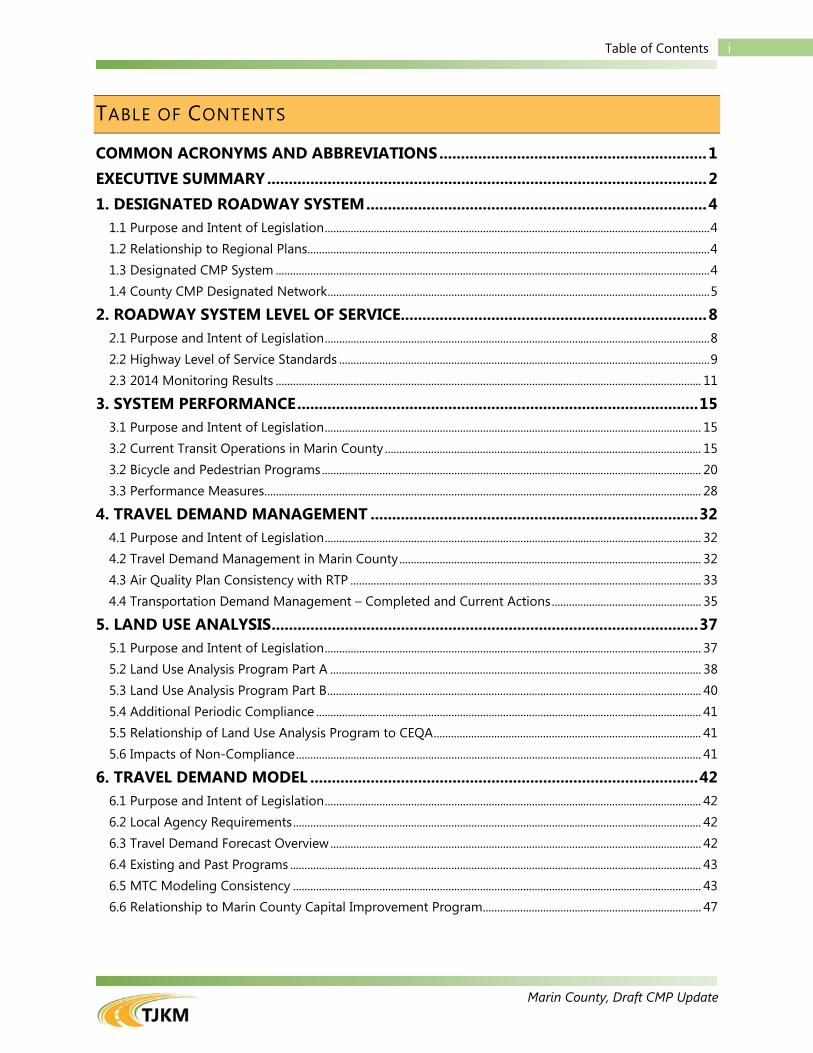
TABLE OF CONTENTS
COMMON ACRONYMS AND ABBREVIATIONS .............................................................. 1 EXECUTIVE SUMMARY ...................................................................................................... 2 1. DESIGNATED ROADWAY SYSTEM ............................................................................... 4
1.1 Purpose and Intent of Legislation ...................................................................................................................................... 4 1.2 Relationship to Regional Plans ............................................................................................................................................ 4 1.3 Designated CMP System ....................................................................................................................................................... 4 1.4 County CMP Designated Network ..................................................................................................................................... 5
2. ROADWAY SYSTEM LEVEL OF SERVICE....................................................................... 8 2.1 Purpose and Intent of Legislation ...................................................................................................................................... 8 2.2 Highway Level of Service Standards ................................................................................................................................. 9 2.3 2014 Monitoring Results .................................................................................................................................................... 11
3. SYSTEM PERFORMANCE ............................................................................................. 15 3.1 Purpose and Intent of Legislation ................................................................................................................................... 15 3.2 Current Transit Operations in Marin County .............................................................................................................. 15 3.2 Bicycle and Pedestrian Programs .................................................................................................................................... 20 3.3 Performance Measures ........................................................................................................................................................ 28
4. TRAVEL DEMAND MANAGEMENT ............................................................................ 32 4.1 Purpose and Intent of Legislation ................................................................................................................................... 32 4.2 Travel Demand Management in Marin County ......................................................................................................... 32 4.3 Air Quality Plan Consistency with RTP .......................................................................................................................... 33 4.4 Transportation Demand Management – Completed and Current Actions .................................................... 35
5. LAND USE ANALYSIS ................................................................................................... 37 5.1 Purpose and Intent of Legislation ................................................................................................................................... 37 5.2 Land Use Analysis Program Part A ................................................................................................................................. 38 5.3 Land Use Analysis Program Part B .................................................................................................................................. 40 5.4 Additional Periodic Compliance ...................................................................................................................................... 41 5.5 Relationship of Land Use Analysis Program to CEQA ............................................................................................. 41 5.6 Impacts of Non-Compliance ............................................................................................................................................. 41
6. TRAVEL DEMAND MODEL .......................................................................................... 42 6.1 Purpose and Intent of Legislation ................................................................................................................................... 42 6.2 Local Agency Requirements .............................................................................................................................................. 42 6.3 Travel Demand Forecast Overview ................................................................................................................................. 42 6.4 Existing and Past Programs ............................................................................................................................................... 43 6.5 MTC Modeling Consistency .............................................................................................................................................. 43 6.6 Relationship to Marin County Capital Improvement Program ............................................................................ 47
Marin County, Draft CMP Update
iiTable of Contents
7. CAPITAL IMPROVEMENT PROGRAM ........................................................................ 48 7.1 Purpose and Intent of Legislation ................................................................................................................................... 48 7.2 Relationship to Regional Transportation Plan ........................................................................................................... 48 7.3 Relationship to Regional Transportation Improvement Program ...................................................................... 48 7.4 Relationship to Air Quality Attainment Plans ............................................................................................................. 48 7.5 Project Funding Identified in TAM Measure A Strategic Plan ............................................................................. 49 7.6 Marin-Sonoma Narrows Project and Funding ........................................................................................................... 50 7.7 Recent Project Funding Identified in CTC Programs ............................................................................................... 51 7.8 Recent Project Funding Identified in RTIP ................................................................................................................... 55 7.9 Project Funding Identified in TAM Measure B Strategic Plan .............................................................................. 56 7.10 Project Funding Identified in Local Jurisdictions’ Bicycle Plans ........................................................................ 57
8. DEFICIENCY PLAN PROCEDURES ............................................................................... 58 8.1 Purpose and Intent of Legislation ................................................................................................................................... 58 8.2 Local Government Conformance Requirements ....................................................................................................... 58 8.3 Local Government Monitoring Requirements ........................................................................................................... 58
9. STUDY REFERENCES .................................................................................................... 61
LIST OF TABLES
Table 1: Arterial and Freeway Segments in CMP Network .................................................................................................. 7 Table 2: Arterial Level of Service Thresholds ............................................................................................................................. 8 Table 3: Freeway Level of Service Thresholds ........................................................................................................................... 8 Table 4: Approaches to Marin CMP Issues ................................................................................................................................. 9 Table 5: Arterial LOS Summary - PM Peak Period ................................................................................................................ 11 Table 6: Freeway Mixed-Flow Lanes LOS Summary - PM Peak Period ........................................................................ 12 Table 7: Marin Access Performance Statistics ........................................................................................................................ 20 Table 8: 2010 Bay Area Clean Air Plan Transportation Control Measures (TCMs) in Marin CMP ..................... 34 Table 9: Major Development Proposals in Near-Term Horizon ...................................................................................... 38 Table 10: Marin County Measure A Strategic Plan Capital Projects .............................................................................. 50 Table 11: Marin-Sonoma Narrows Project .............................................................................................................................. 51 Table 12: State Transportation Improvement Program Projects in Marin County .................................................. 52 Table 13: State Highway Operations and Protection Program (SHOPP) Projects ................................................... 54 Table 14: Regional Transportation Improvement Program (RTIP) Projects ............................................................... 55 Table 15: Marin County Measure B Strategic Plan Capital Projects .............................................................................. 57
Marin County, Draft CMP Update
Page 1Common Acronyms and Abbreviations
COMMON ACRONYMS AND ABBREVIATIONS AB Assembly Bill PeMS Performance Measurement System
ABAG Association of Bay Area Governments RTIP Regional Transportation Improvement Program
ADA Americans with Disabilities Act RTP Regional Transportation Plan
ADT Average Daily Traffic SB Southbound
BAAQMD Bay Area Air Quality Management District SCS Sustainable Communities Strategy
Caltrans California Department of Transportation SCTA Sonoma County Transportation Authority
CEQA California Environmental Quality Act SHOPP State Highway Operations and Protection Program
CIP Capital Improvement Program SMART Sonoma-Marin Area Rapid Transit
CMA Congestion Management Agency SOV Single Occupancy Vehicle
CMIA Corridor Mobility Improvement Account SR State Route
CMP Congestion Management Program SR2S Safe Routes to School
CTC California Transportation Commission STAR Safe Transport and Reimbursement
EB Eastbound STIP State Transportation Improvement Program
FY Fiscal Year TAM Transpoortation Authority of Marin
GHG Greenhouse Gasses TAZ Traffic Analysis Zones
HCM Highway Capacity Manual TCIF Trade Corridors Improvement Fund
HOT High Occupancy Toll TCM Transportation Control Measures
HOV High Occupancy Vehicle TDM Travel Demand Management
IOS Initial Operating Segment TDM Transportation Demand Management
LOS Level of Service TFCA Transportation Fund for Clean Air
MSN Marin-Sonoma Narrows TIP Transportation Improvement Program
MTC Metropolitan Transportation Commission V/C Volume to Capacity
MTM Marin Travel Model VMT Vehicle Miles Travelled
MUTCD Manual of Uniform Traffic Control Devices VRF Vehicle Registration Fee
NB Northbound WB Westbound
NTPP Nonmotorized Transportation Pilot Program
Marin County, Draft CMP Update
Page 2Executive Summary
EXECUTIVE SUMMARY
The 2015 Congestion Management Program (CMP) Update is a document of the Transportation Authority of Marin (TAM), the designated Congestion Management Agency (CMA) for Marin County. The 2015 biennial update is required by State statute. Following are highlights of this document.
Chapter 1: Designated Roadway System
The designated CMP roadway system in Marin County has not changed, as required by law. The CMP network numbering system is defined in corridor segments, allowing readers to easily reference roadway performance tables.
Chapter 2: Roadway System Level of Service
The monitoring results of roadway segments have varied little since the 2013 CMP Update, although some segments show improved levels of service (LOS). Seven monitored CMP roadway segments (all grandfathered) out of 27 fell below LOS standards based on the 2014 Monitoring results.
Grandfathered roadway segments are those that operated at a lower (deficient) LOS than the standard established in 1991. Such segments are allowed to continue operating at a lower LOS without requiring remedial action.
Chapter 3: System Performance
The transit system in Marin County continues to serve many residents and commuters. The recent dedication of additional resources has led to an expansion of local transit service, which in turn has increased local boardings. Overall demand for Golden Gate Commuter and Ferry, Marin Access, and Marin Transit Fixed Route services has increased during Fiscal Year (FY) 2013/14.
Bicycle and pedestrian improvements are important to the County. These improvements are detailed according to information received from staff at each local jurisdiction. Many such improvements are associated with TAM’s Safe Routes to Schools programs.
The performance measures presented in this chapter show that multi-modal demand is not showing significant change in the last two years. The current economy is good and though many efforts on different fronts are proceeding well, the challenges of increased travel demand remain significant. Overall traffic flow on eight arterial segments and two US 101 segments was better in 2014 than it was in 2012.
Travel times along US 101 in the NB and SB directions between the County lines vary between 19 - 32 minutes and 19 - 30 minutes respectively depending on the time of day. Planning travel time, the total time a traveler should allow to ensure on-time arrival, in the NB direction during the PM peak hour can be as high as approximately 32 minutes, and approximately 30 minutes in the SB direction during the AM peak hour. Vehicle occupancy in mixed flow lanes on US 101 shows an approximate 80:20 distribution between single and high occupancy ridership respectively. Within the HOV lanes, over 20% of users are single occupancy vehicles, which includes motorcycles, Clean Air Vehicles, and illegal lane users. Transit ridership shows over 60% using Golden Gate Transit Services, 35% using Marin Transit Fixed Route Services, and the remainder using Marin Access Services.
Marin County, Draft CMP Update
Page 3Executive Summary
Chapter 4: Travel Demand Management
Transportation Demand Management (TDM) strategies are utilized to improve efficiency of the existing transportation systems without significant expansion of the infrastructure. These strategies focus on ways to reduce solo driving and/or to eliminate need for driving all together. Some of the commonly used strategies that aim at cutting down solo driving include carpool, vanpool, bicycles, transit and park & ride lots. Strategies to reduce VMTs include alternatives such as telecommuting, flexible work schedules and parking cash-out programs. Improving a balance between available jobs and housing also help encourage non-auto modes of transportation. Use of TDM strategies help cities and counties in their attempt to balance the growing need for transportation and availability of limited transportation dollars.
Chapter 5: Land Use Analysis Program
The CMP presents two important elements of the Land Use Analysis Program: Part A for major development projects and general plan updates, and Part B for biennial development tracking, both of which require local government participation and cooperation. The first program was adopted in 1991. As of August 2015, five major development proposals in the near-term horizon are to be considered in Part A. Compliance to CMP requirements allows jurisdictions to retain gas tax funding and have projects programmed in the RTIP.
Chapter 6: Travel Demand Model
CMP requirements include maintaining and utilizing a travel demand model that is consistent with the regional model and available for use in corridor and development studies. The Marin Travel Model (MTM) was updated in 2013 with 2040 land use projections to be consistent with Plan Bay Area forecasts.
Chapter 7: Capital Improvements Program
A majority of Measure A, the County’s 1/2-cent transportation sales tax, funding is allocated to operating existing programs. Also, many Marin County projects have received major funding from other sources in the past several years, so that there are not many improvements that can be identified. The most significant investment to Marin’s roadway system, the Marin-Sonoma Narrows (MSN) Project, is detailed in this chapter. MSN Phase 1 projects are underway, with the Novato carpool lane component completed in 2012. This report also describes other projects whose funding is provided and tracked by regional and state agencies.
This CMP identifies programs and funding relative to County Measure B, the $10 vehicle registration fee (VRF) approved by Marin County voters in 2010. Measure B includes three elements: maintain local streets and pathways; improve transit for seniors and persons with disabilities; and, reduce congestion and pollution with programs relating to school safety and congestion, commute alternatives, and alternative fuels.
Chapter 8: Monitoring, Deficiency Plans and Conformance
Local jurisdictions must meet the CMP conformance requirements to receive funding from several State programs. The conformity process has not substantially changed in the 2015 CMP. LOS monitoring in this CMP did not find any new deficiencies, and local jurisdictions that conform to the land use analysis program requirements are expected to remain in conformance.
Marin County, Draft CMP Update
Page 41. Designated Roadway System
1. DESIGNATED ROADWAY SYSTEM
1.1 Purpose and Intent of Legislation
The CMP roadway system is a network that allows performance monitoring in terms of established LOS standards. The network must be created at a level such that impacts can be identified, and a connection can be made between proposed projects and their specific impacts on the network. The network can neither be too small, as impacts would be unidentifiable, nor too large, as there would be logistical issues in monitoring network performance. The CMP was established as part of the legislated Transportation Blueprint of 1990 and became a requirement for CMAs across California to fulfill.
The Marin County CMA established the CMP roadway network in 1991. The designated CMP roadway system includes all state highways and principal arterial roadways in Marin County. California Government Code Section 65089(b)(1)(A) states that once a highway or roadway has been designated as part of the CMP system, it cannot be removed. Furthermore, Section 60589(b)(4) requires that the regional transportation system is part of the required land use program defined by State statute.
1.2 Relationship to Regional Plans
The CMP is a short-range document containing elements that further the goals of the Regional Transportation Plan (RTP) maintained by the Metropolitan Transportation Commission (MTC), the San Francisco Bay Area’s regional transportation planning agency. The Marin CMP roadway system is consistent with the RTP, which was adopted in July 2013 as part of Plan Bay Area.
The designated County CMP roadway system is included within the RTP’s Metropolitan Transportation System. This facilitates regional consistency between the Marin CMP and CMPs of adjoining Contra Costa, San Francisco, and Sonoma counties.
1.3 Designated CMP System
Prior Marin County CMPs have defined State highways and other principal arterial roadways for the County CMP roadway network. MTC has provided a framework that allows for flexibility in defining the principal arterial system. The following criteria were used to establish the designated CMP roadway network:
Marin County, Draft CMP Update
Page 51. Designated Roadway System
State Highways: All State Highways must be included in the CMP roadway network according to the CMP legislation. If a route is to be removed from the State Highway System, it is to be evaluated according to principal arterial criteria to determine whether it should remain in the CMP network.
Principal Arterial Roadways: Marin’s first CMP, created in 1991, designated principal arterial roadways as part of the CMP roadway network. Non-State CMP roadways were included based upon the following criteria: Purpose and function of the roadway Land use adjacent to the roadway and proximity to activity centers Average Daily Traffic (ADT) volume (generally greater than 25,000 daily vehicles) Connectivity to other facilities
1.4 County CMP Designated Network
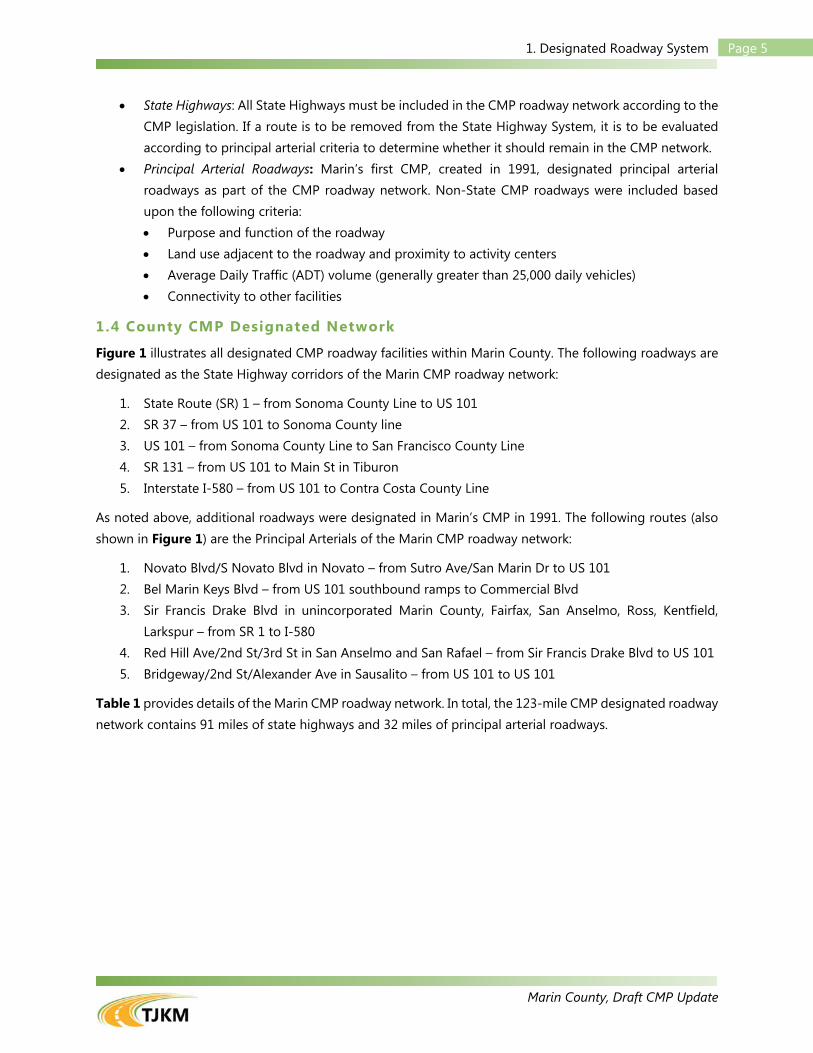
Figure 1 illustrates all designated CMP roadway facilities within Marin County. The following roadways are designated as the State Highway corridors of the Marin CMP roadway network:
1. State Route (SR) 1 – from Sonoma County Line to US 101 2. SR 37 – from US 101 to Sonoma County line 3. US 101 – from Sonoma County Line to San Francisco County Line 4. SR 131 – from US 101 to Main St in Tiburon 5. Interstate I-580 – from US 101 to Contra Costa County Line
As noted above, additional roadways were designated in Marin’s CMP in 1991. The following routes (also shown in Figure 1) are the Principal Arterials of the Marin CMP roadway network:
1. Novato Blvd/S Novato Blvd in Novato – from Sutro Ave/San Marin Dr to US 101 2. Bel Marin Keys Blvd – from US 101 southbound ramps to Commercial Blvd 3. Sir Francis Drake Blvd in unincorporated Marin County, Fairfax, San Anselmo, Ross, Kentfield,
Larkspur – from SR 1 to I-580 4. Red Hill Ave/2nd St/3rd St in San Anselmo and San Rafael – from Sir Francis Drake Blvd to US 101 5. Bridgeway/2nd St/Alexander Ave in Sausalito – from US 101 to US 101
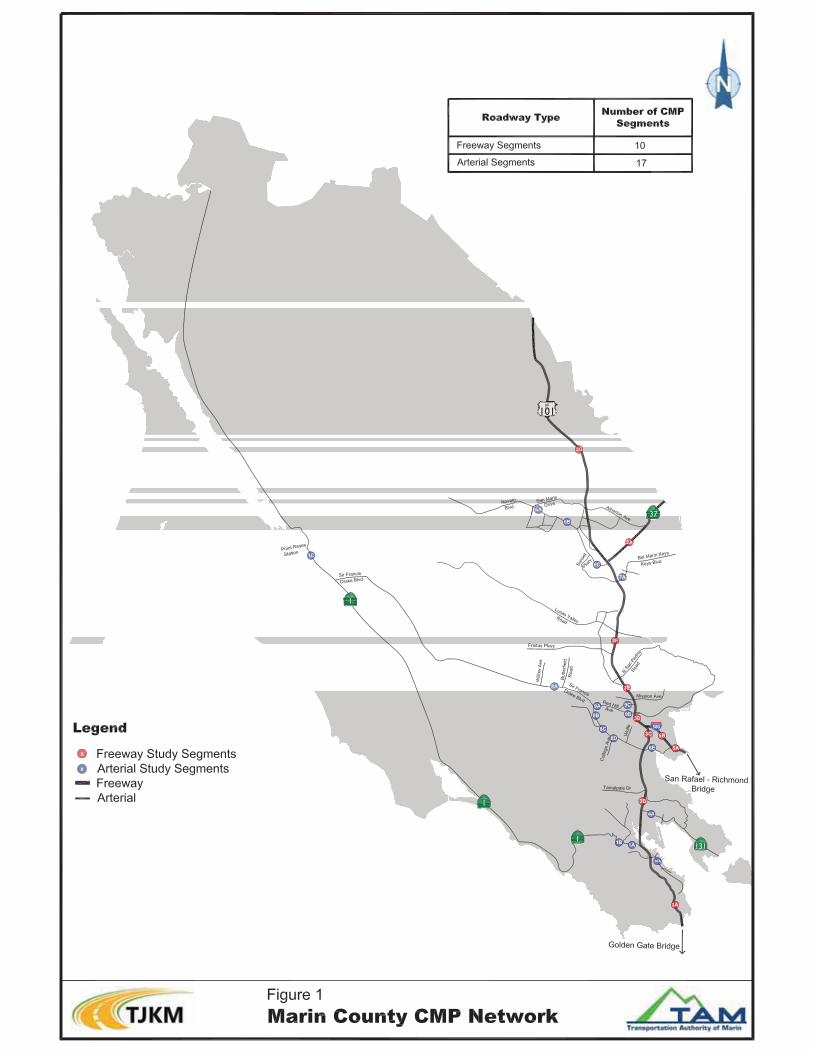
Table 1 provides details of the Marin CMP roadway network. In total, the 123-mile CMP designated roadway network contains 91 miles of state highways and 32 miles of principal arterial roadways.
Marin County, Draft CMP Update
Page 71. Designated Roadway System
Table 1: Arterial and Freeway Segments in CMP Network
New #
Old #
Street From To Roadway
Type
Grand-fathered Status
1A 25 SR 1 US 101 Tennessee Valley Rd Arterial No
1B 19 SR 1 Northern Ave Almonte Blvd Arterial Yes
1C 1 SR 1 Sir Francis Drake Blvd Pt. Reyes Station Arterial No
2A 5 SR 37 US 101 Atherton Ave Freeway No
3A 21 US 101 Golden Gate Bridge Spencer Ave Freeway No
3B 17 US 101 (SOV and HOV) SR 131 (Tiburon Blvd) Tamalpais Dr Freeway Yes
3C 13 US 101 (SOV and HOV) Sir Francis Drake Blvd I-580 Freeway Yes
3D 11 US 101 (SOV and HOV) I-580 Mission Ave Freeway Yes
3E 8 US 101 (SOV and HOV) Mission Ave N. San Pedro Rd Freeway Yes
3F 7 US 101 (SOV and HOV) Freitas Pkwy Lucas Valley Rd Freeway Yes
3G 2 US 101 North of Atherton Sonoma Co. Line Freeway Yes
4A 18 SR 131 (Tiburon Blvd) Redwood Hwy Frontage Rd
E. Strawberry Dr Arterial No
5A 15 I-580 Sir Francis Drake Blvd Marin Co. Line Freeway No
5B 14 I-580 Bellam Blvd Sir Francis Drake Blvd Freeway Yes
6A 3 Novato Blvd San Marin Dr Eucalyptus Ave Arterial No
6B 24 Novato Blvd Wilson Ave Diablo Ave Arterial No
6C 4 S. Novato Blvd Sunset Pkwy US 101 Arterial No
7A 6 Bel Marin Keys US 101 Commercial Blvd Arterial Yes
8A 22 Sir Francis Drake Blvd Butterfield Rd Willow Rd Arterial Yes
8B 9 Sir Francis Drake Blvd San Anselmo Ave Red Hill Ave Arterial Yes
8C 23 Sir Francis Drake Blvd College Ave Toussin Ave Arterial Yes
8D 12 Sir Francis Drake Blvd College Ave Wolfe Grade Arterial Yes
8E 16 Sir Francis Drake Blvd US 101 Larkspur Landing Circle Arterial Yes
9A 10 Red Hill Ave Sir Francis Drake Blvd Second St Arterial No
9B 26 Second St US 101 Marquard St Arterial No
9C 27 Third St US 101 Marquard St Arterial No
10A 20 Bridgeway Gate 5 Rd Gate 6 Rd Arterial No Notes: SOV = Single Occupancy Vehicle; HOV = High Occupancy Vehicle
Marin County, Draft CMP Update
Page 82. Roadway System Level of Service
2. ROADWAY SYSTEM LEVEL OF SERVICE
2.1 Purpose and Intent of Legislation
California Government Code 65089(b)(1)(A) requires that LOS standards be established as part of a CMP using the Transportation Research Board’s Highway Capacity Manual (HCM) or an accepted alternative.
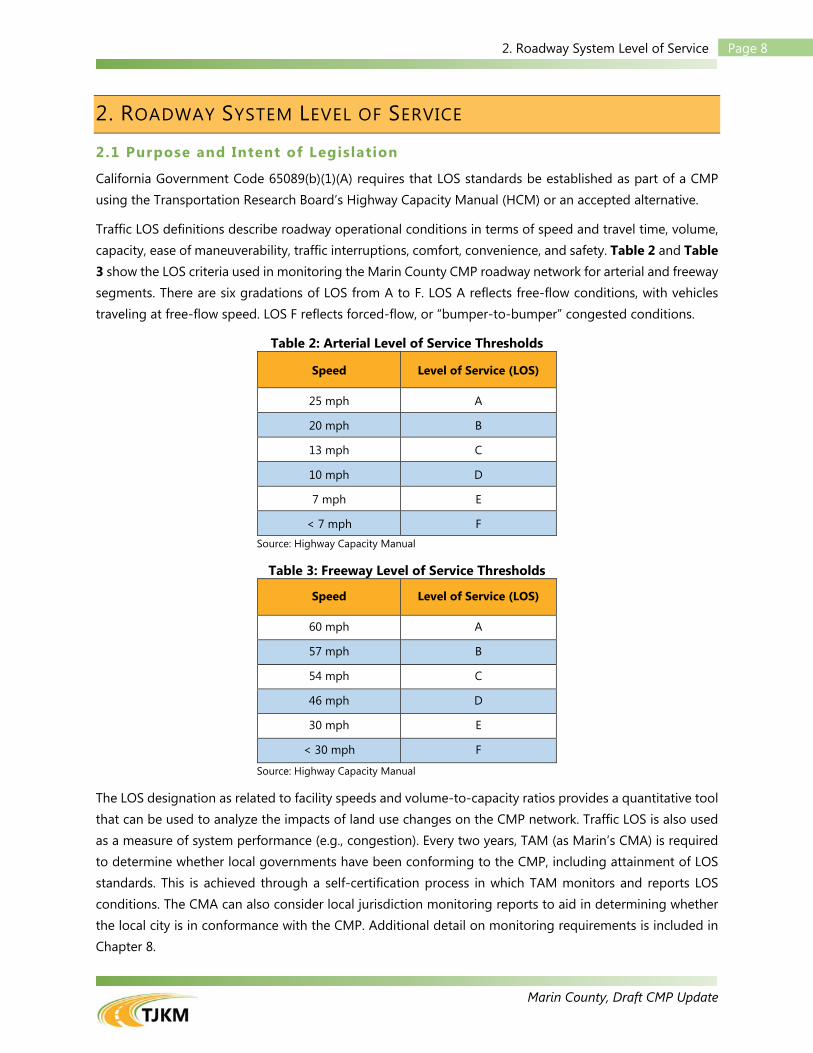
Traffic LOS definitions describe roadway operational conditions in terms of speed and travel time, volume, capacity, ease of maneuverability, traffic interruptions, comfort, convenience, and safety. Table 2 and Table 3 show the LOS criteria used in monitoring the Marin County CMP roadway network for arterial and freeway segments. There are six gradations of LOS from A to F. LOS A reflects free-flow conditions, with vehicles traveling at free-flow speed. LOS F reflects forced-flow, or “bumper-to-bumper” congested conditions.
Table 2: Arterial Level of Service Thresholds
Speed Level of Service (LOS)
25 mph A
20 mph B
13 mph C
10 mph D
7 mph E
< 7 mph F Source: Highway Capacity Manual
Table 3: Freeway Level of Service Thresholds
Speed Level of Service (LOS)
60 mph A
57 mph B
54 mph C
46 mph D
30 mph E
< 30 mph F
Source: Highway Capacity Manual
The LOS designation as related to facility speeds and volume-to-capacity ratios provides a quantitative tool that can be used to analyze the impacts of land use changes on the CMP network. Traffic LOS is also used as a measure of system performance (e.g., congestion). Every two years, TAM (as Marin’s CMA) is required to determine whether local governments have been conforming to the CMP, including attainment of LOS standards. This is achieved through a self-certification process in which TAM monitors and reports LOS conditions. The CMA can also consider local jurisdiction monitoring reports to aid in determining whether the local city is in conformance with the CMP. Additional detail on monitoring requirements is included in Chapter 8.
Marin County, Draft CMP Update
Page 92. Roadway System Level of Service
Local cities and towns must consider the impacts that land use decisions have on LOS within the designated CMP network. TAM works with local government entities to determine whether a change in land use affects LOS negatively, and how to mitigate any anticipated deficiencies. A systems approach may have to be examined when considering LOS of the entire system. Cities and counties may be responsible for improvements and funding of programs that affect the system as a whole.
2.2 Highway Level of Service Standards
Goals and Objectives
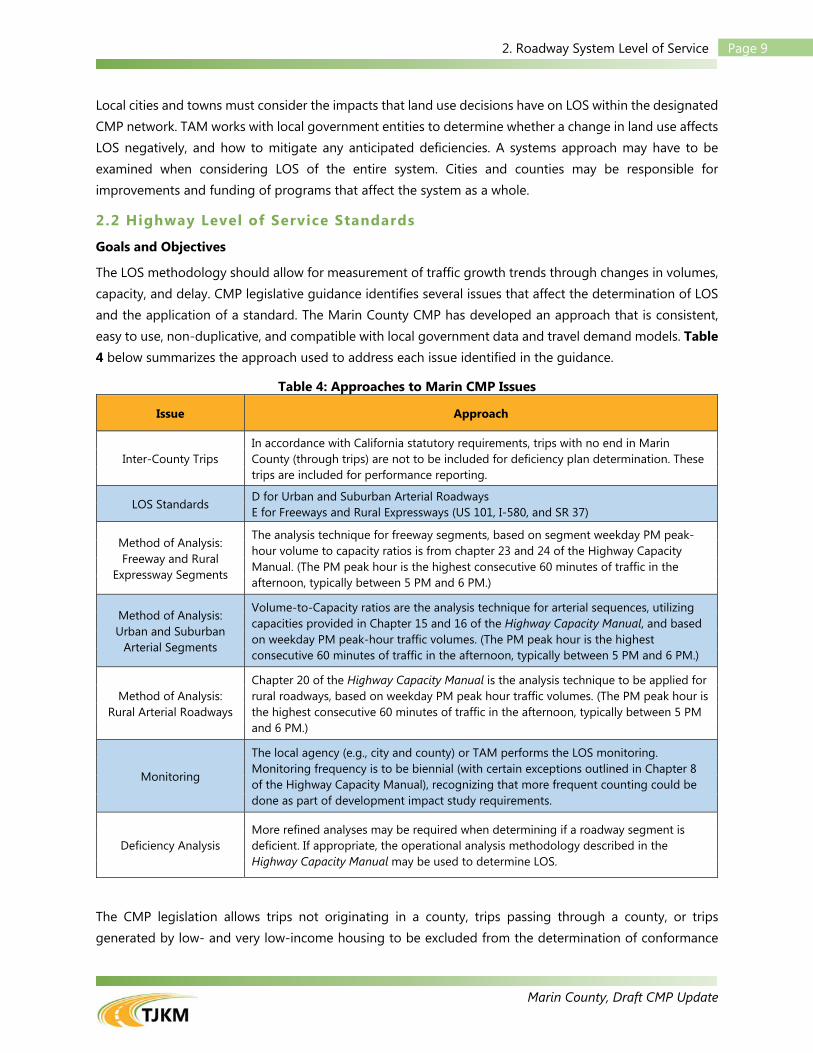
The LOS methodology should allow for measurement of traffic growth trends through changes in volumes, capacity, and delay. CMP legislative guidance identifies several issues that affect the determination of LOS and the application of a standard. The Marin County CMP has developed an approach that is consistent, easy to use, non-duplicative, and compatible with local government data and travel demand models. Table 4 below summarizes the approach used to address each issue identified in the guidance.
Table 4: Approaches to Marin CMP Issues
Issue Approach
Inter-County Trips In accordance with California statutory requirements, trips with no end in Marin County (through trips) are not to be included for deficiency plan determination. These trips are included for performance reporting.
LOS Standards D for Urban and Suburban Arterial Roadways E for Freeways and Rural Expressways (US 101, I-580, and SR 37)
Method of Analysis: Freeway and Rural
Expressway Segments
The analysis technique for freeway segments, based on segment weekday PM peak-hour volume to capacity ratios is from chapter 23 and 24 of the Highway Capacity Manual. (The PM peak hour is the highest consecutive 60 minutes of traffic in the afternoon, typically between 5 PM and 6 PM.)
Method of Analysis: Urban and Suburban
Arterial Segments
Volume-to-Capacity ratios are the analysis technique for arterial sequences, utilizing capacities provided in Chapter 15 and 16 of the Highway Capacity Manual, and based on weekday PM peak-hour traffic volumes. (The PM peak hour is the highest consecutive 60 minutes of traffic in the afternoon, typically between 5 PM and 6 PM.)
Method of Analysis: Rural Arterial Roadways
Chapter 20 of the Highway Capacity Manual is the analysis technique to be applied for rural roadways, based on weekday PM peak hour traffic volumes. (The PM peak hour is the highest consecutive 60 minutes of traffic in the afternoon, typically between 5 PM and 6 PM.)
Monitoring
The local agency (e.g., city and county) or TAM performs the LOS monitoring. Monitoring frequency is to be biennial (with certain exceptions outlined in Chapter 8 of the Highway Capacity Manual), recognizing that more frequent counting could be done as part of development impact study requirements.
Deficiency Analysis More refined analyses may be required when determining if a roadway segment is deficient. If appropriate, the operational analysis methodology described in the Highway Capacity Manual may be used to determine LOS.
The CMP legislation allows trips not originating in a county, trips passing through a county, or trips generated by low- and very low-income housing to be excluded from the determination of conformance
Marin County, Draft CMP Update
Page 102. Roadway System Level of Service
with LOS standards following consultation with MTC, Caltrans, and the Bay Area Air Quality Management District. TAM, however, decided to include these trips when determining conformance with LOS standards for local planning purposes, as exclusion of these trips would present a misleading picture of the traffic conditions in the county and could artificially skew the inclusion and/or ranking of projects in the seven-year Capital Improvement Program (CIP).
Facility Classifications
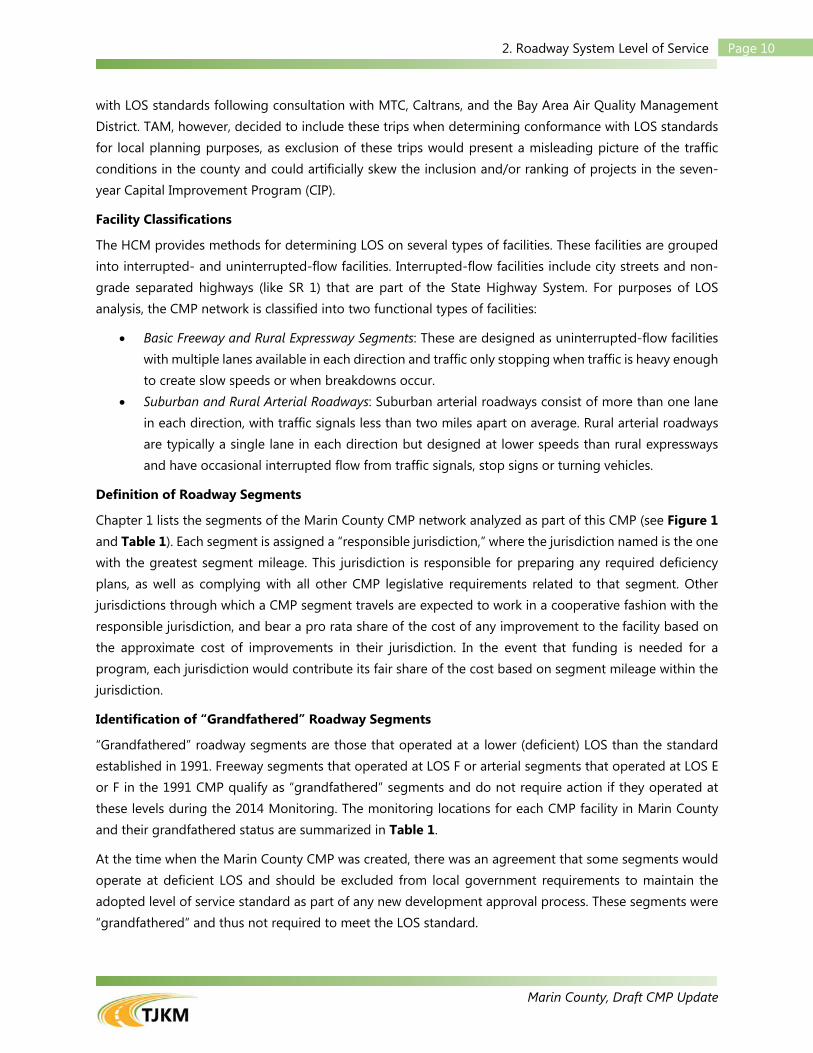
The HCM provides methods for determining LOS on several types of facilities. These facilities are grouped into interrupted- and uninterrupted-flow facilities. Interrupted-flow facilities include city streets and non-grade separated highways (like SR 1) that are part of the State Highway System. For purposes of LOS analysis, the CMP network is classified into two functional types of facilities:
Basic Freeway and Rural Expressway Segments: These are designed as uninterrupted-flow facilities with multiple lanes available in each direction and traffic only stopping when traffic is heavy enough to create slow speeds or when breakdowns occur.
Suburban and Rural Arterial Roadways: Suburban arterial roadways consist of more than one lane in each direction, with traffic signals less than two miles apart on average. Rural arterial roadways are typically a single lane in each direction but designed at lower speeds than rural expressways and have occasional interrupted flow from traffic signals, stop signs or turning vehicles.
Definition of Roadway Segments
Chapter 1 lists the segments of the Marin County CMP network analyzed as part of this CMP (see Figure 1 and Table 1). Each segment is assigned a “responsible jurisdiction,” where the jurisdiction named is the one with the greatest segment mileage. This jurisdiction is responsible for preparing any required deficiency plans, as well as complying with all other CMP legislative requirements related to that segment. Other jurisdictions through which a CMP segment travels are expected to work in a cooperative fashion with the responsible jurisdiction, and bear a pro rata share of the cost of any improvement to the facility based on the approximate cost of improvements in their jurisdiction. In the event that funding is needed for a program, each jurisdiction would contribute its fair share of the cost based on segment mileage within the jurisdiction.
Identification of “Grandfathered” Roadway Segments
“Grandfathered” roadway segments are those that operated at a lower (deficient) LOS than the standard established in 1991. Freeway segments that operated at LOS F or arterial segments that operated at LOS E or F in the 1991 CMP qualify as “grandfathered” segments and do not require action if they operated at these levels during the 2014 Monitoring. The monitoring locations for each CMP facility in Marin County and their grandfathered status are summarized in Table 1.
At the time when the Marin County CMP was created, there was an agreement that some segments would operate at deficient LOS and should be excluded from local government requirements to maintain the adopted level of service standard as part of any new development approval process. These segments were “grandfathered” and thus not required to meet the LOS standard.
Marin County, Draft CMP Update
Page 112. Roadway System Level of Service
In the future, TAM may wish to develop an improvement plan to address congestion as appropriate for these remaining grandfathered facilities. An improvement plan would consist of a description of the actions required to improve the LOS on the facility, either by increasing capacity or managing the demand for travel in a manner that effectively improves LOS.
2.3 2014 Monitoring Results
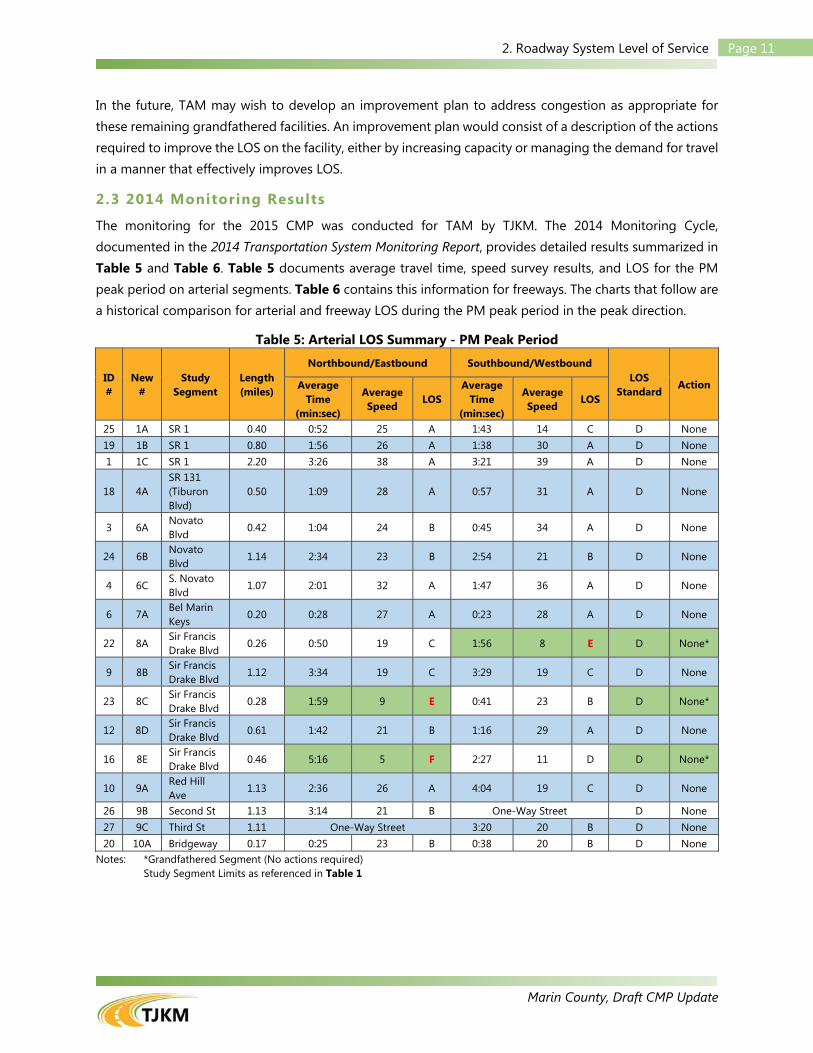
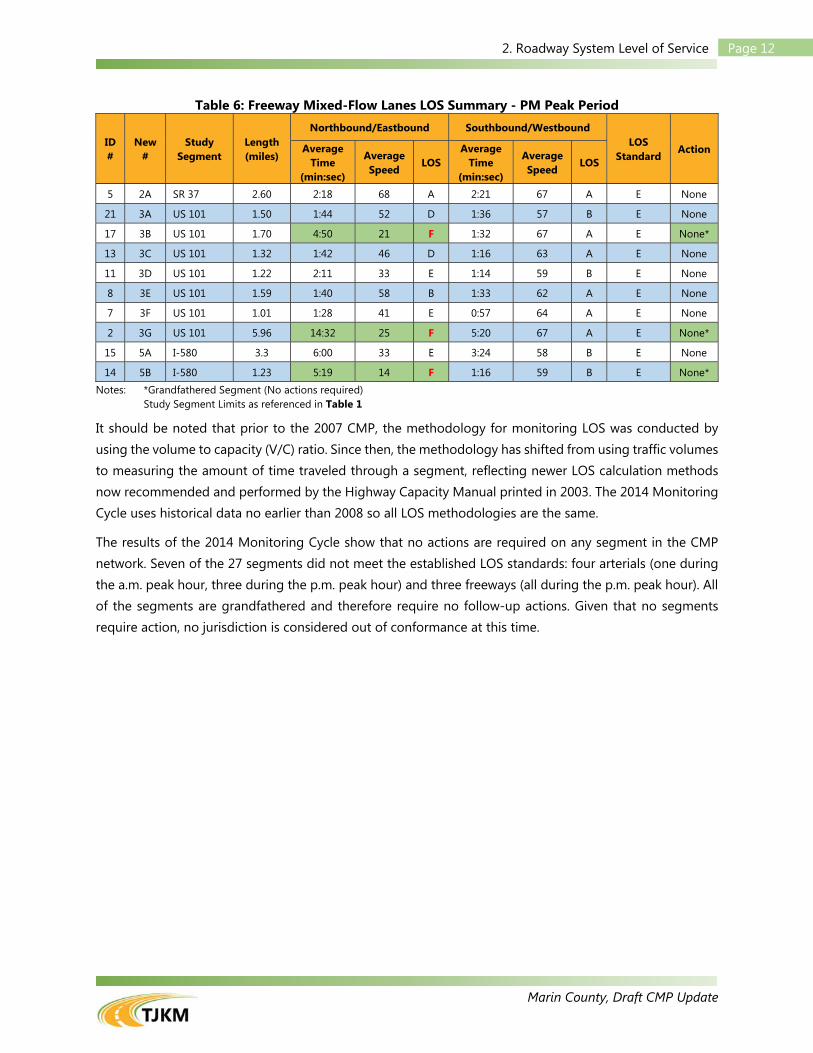
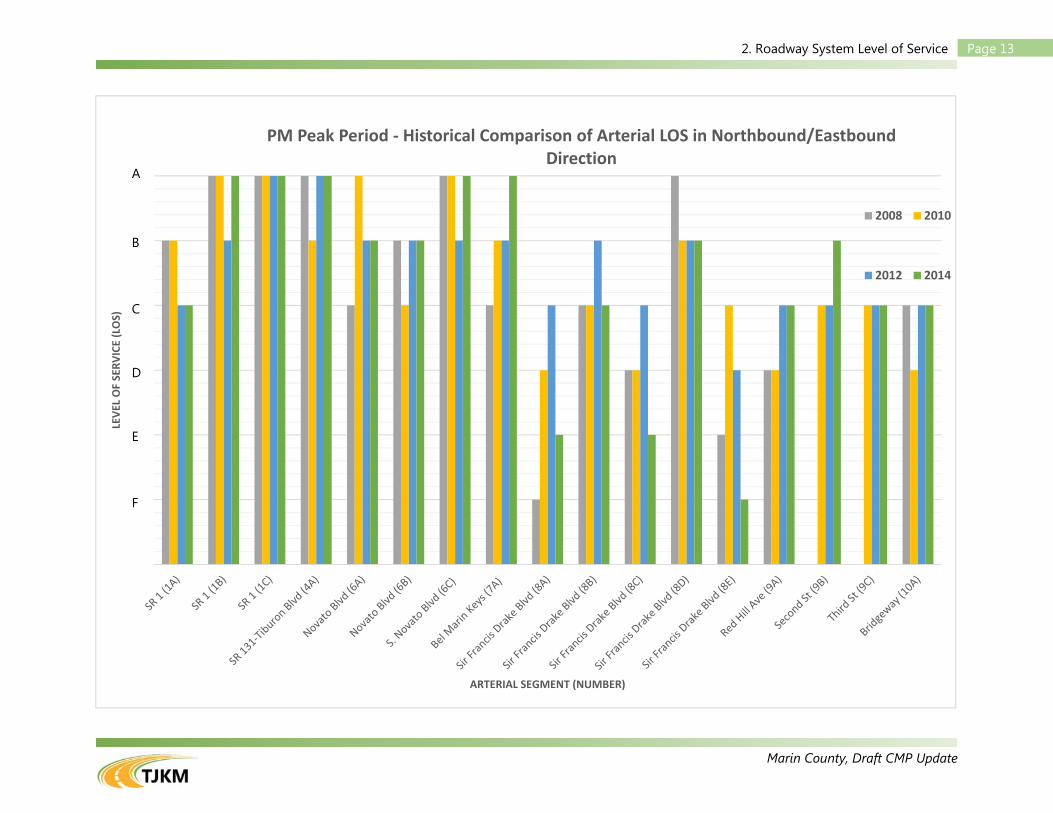
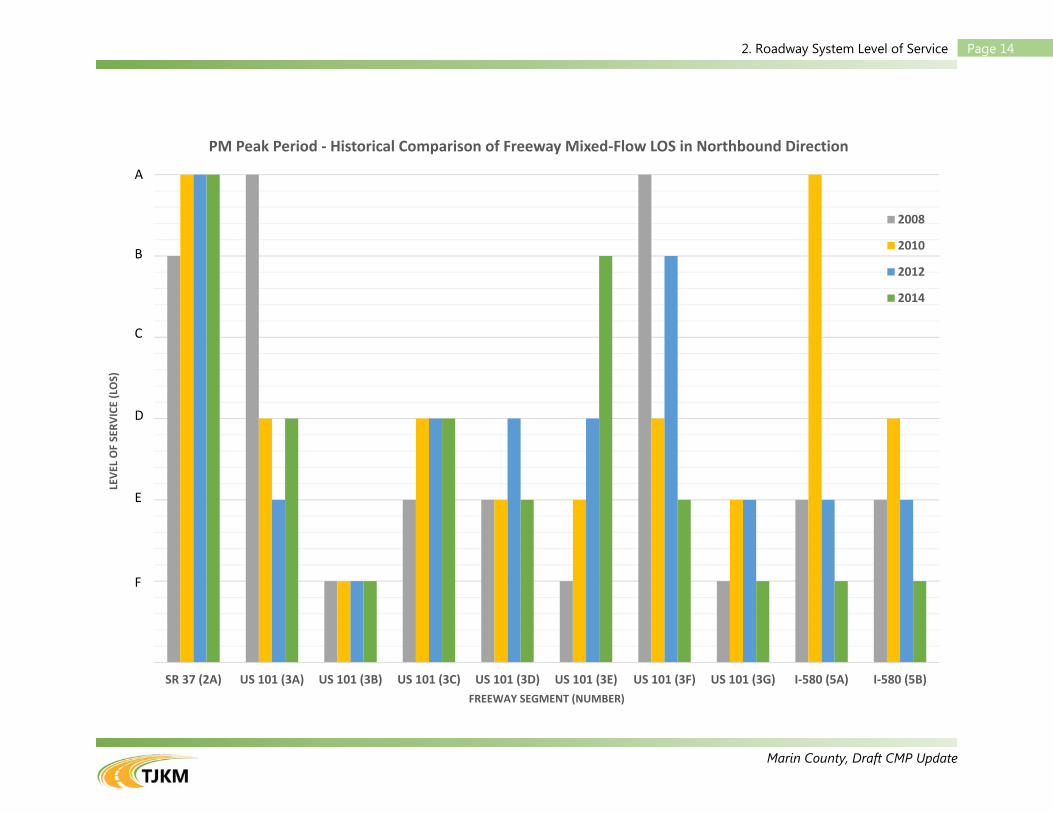
The monitoring for the 2015 CMP was conducted for TAM by TJKM. The 2014 Monitoring Cycle, documented in the 2014 Transportation System Monitoring Report, provides detailed results summarized in Table 5 and Table 6. Table 5 documents average travel time, speed survey results, and LOS for the PM peak period on arterial segments. Table 6 contains this information for freeways. The charts that follow are a historical comparison for arterial and freeway LOS during the PM peak period in the peak direction.
Table 5: Arterial LOS Summary - PM Peak Period
ID #
New #
Study Segment
Length (miles)
Northbound/Eastbound Southbound/Westbound LOS
Standard Action Average
Time (min:sec)
Average Speed
LOS Average
Time (min:sec)
Average Speed
LOS
25 1A SR 1 0.40 0:52 25 A 1:43 14 C D None 19 1B SR 1 0.80 1:56 26 A 1:38 30 A D None 1 1C SR 1 2.20 3:26 38 A 3:21 39 A D None
18 4A SR 131 (Tiburon Blvd)
0.50 1:09 28 A 0:57 31 A D None
3 6A Novato Blvd
0.42 1:04 24 B 0:45 34 A D None
24 6B Novato Blvd
1.14 2:34 23 B 2:54 21 B D None
4 6C S. Novato Blvd
1.07 2:01 32 A 1:47 36 A D None
6 7A Bel Marin Keys
0.20 0:28 27 A 0:23 28 A D None
22 8A Sir Francis Drake Blvd
0.26 0:50 19 C 1:56 8 E D None*
9 8B Sir Francis Drake Blvd
1.12 3:34 19 C 3:29 19 C D None
23 8C Sir Francis Drake Blvd
0.28 1:59 9 E 0:41 23 B D None*
12 8D Sir Francis Drake Blvd
0.61 1:42 21 B 1:16 29 A D None
16 8E Sir Francis Drake Blvd
0.46 5:16 5 F 2:27 11 D D None*
10 9A Red Hill Ave
1.13 2:36 26 A 4:04 19 C D None
26 9B Second St 1.13 3:14 21 B One-Way Street D None 27 9C Third St 1.11 One-Way Street 3:20 20 B D None 20 10A Bridgeway 0.17 0:25 23 B 0:38 20 B D None
Notes: *Grandfathered Segment (No actions required) Study Segment Limits as referenced in Table 1
Marin County, Draft CMP Update
Page 122. Roadway System Level of Service
Table 6: Freeway Mixed-Flow Lanes LOS Summary - PM Peak Period
ID #
New #
Study Segment
Length (miles)
Northbound/Eastbound Southbound/Westbound LOS
Standard Action Average
Time (min:sec)
Average Speed
LOS Average
Time (min:sec)
Average Speed
LOS
5 2A SR 37 2.60 2:18 68 A 2:21 67 A E None
21 3A US 101 1.50 1:44 52 D 1:36 57 B E None
17 3B US 101 1.70 4:50 21 F 1:32 67 A E None*
13 3C US 101 1.32 1:42 46 D 1:16 63 A E None
11 3D US 101 1.22 2:11 33 E 1:14 59 B E None
8 3E US 101 1.59 1:40 58 B 1:33 62 A E None
7 3F US 101 1.01 1:28 41 E 0:57 64 A E None
2 3G US 101 5.96 14:32 25 F 5:20 67 A E None*
15 5A I-580 3.3 6:00 33 E 3:24 58 B E None
14 5B I-580 1.23 5:19 14 F 1:16 59 B E None*
Notes: *Grandfathered Segment (No actions required) Study Segment Limits as referenced in Table 1
It should be noted that prior to the 2007 CMP, the methodology for monitoring LOS was conducted by using the volume to capacity (V/C) ratio. Since then, the methodology has shifted from using traffic volumes to measuring the amount of time traveled through a segment, reflecting newer LOS calculation methods now recommended and performed by the Highway Capacity Manual printed in 2003. The 2014 Monitoring Cycle uses historical data no earlier than 2008 so all LOS methodologies are the same.
The results of the 2014 Monitoring Cycle show that no actions are required on any segment in the CMP network. Seven of the 27 segments did not meet the established LOS standards: four arterials (one during the a.m. peak hour, three during the p.m. peak hour) and three freeways (all during the p.m. peak hour). All of the segments are grandfathered and therefore require no follow-up actions. Given that no segments require action, no jurisdiction is considered out of conformance at this time.
Marin County, Draft CMP Update
Page 13 2. Roadway System Level of Service
0
10
20
30
40
50
60
LEVE
L OF SERV
ICE (LOS)
ARTERIAL SEGMENT (NUMBER)
PM Peak Period ‐ Historical Comparison of Arterial LOS in Northbound/Eastbound Direction
2008 2010
2012 2014
A
B
C
D
E
F
Marin County, Draft CMP Update
Page 14 2. Roadway System Level of Service
0
10
20
30
40
50
60
SR 37 (2A) US 101 (3A) US 101 (3B) US 101 (3C) US 101 (3D) US 101 (3E) US 101 (3F) US 101 (3G) I‐580 (5A) I‐580 (5B)
LEVE
L OF SERV
ICE (LOS)
FREEWAY SEGMENT (NUMBER)
PM Peak Period ‐ Historical Comparison of Freeway Mixed‐Flow LOS in Northbound Direction
2008
2010
2012
2014
A
B
C
D
E
F
Marin County, Draft CMP Update
Page 153. System Performance
3. SYSTEM PERFORMANCE
3.1 Purpose and Intent of Legislation
The California Government Code Section 65089(b)(2) requires each CMA to establish performance measures to evaluate current and future multimodal system performance (in addition to LOS presented in Chapter 2) for the movement of people and goods. Consistent with past CMPs, performance measures are included in this CMP and described in this chapter. The measures should not be confused with “standards,” as no level of performance is required. Rather, measures simply indicate the levels of performance at a given time.
The first part of this section highlights the current transit system in Marin County. The next section highlights bicycle and pedestrian programs. Lastly, two additional performance measures are provided:
Travel Time Reliability Vehicle Occupancy
The above performance measures help determine whether the goals of the CMP are being met: supporting mobility, air quality, land-use, and economic objectives. These measures are also used in the development of any necessary Capital Improvement Program, deficiency plans, and the land-use analysis program. The 2014 Transportation System Monitoring Report prepared by TJKM for TAM in July 2015 contains detailed information on the transportation system, and is a key source in describing these measures.
3.2 Current Transit Operations in Marin County
The transit network within Marin County comprises a variety of services. These include:
General public transit bus service for both inter- and intra-county trips
General public ferry service, serving trips between Marin County and San Francisco
Specialized transit services aimed at serving the needs of the senior and disabled population in the County, including dial-a-ride, paratransit, and wheelchair accessible taxis
Privately operated services, providing targeting service between specific locations, such as the service between Marin County and San Francisco International Airport
Marin County, Draft CMP Update
Page 163. System Performance
The Sonoma-Marin Area Rail Transit (SMART) service will likely be added as a CMP transit service. As of August 2013, construction has begun on the service’s Initial Operating Segment (IOS) between the cities of Santa Rosa in Sonoma County and San Rafael in Marin County. The IOS is expected to be completed in late 2016.
The following sections provide a brief description of the transit services provided for inter-county and intra-county transit travel. In addition, bus route information, headways, and overall transit ridership are summarized in each section.
Marin Transit
Marin Transit is the agency responsible for local transit service within Marin County. Marin Transit has responsibility for local transit services and contracts with other operators for three types of fixed route services within the county: large bus fixed route, shuttle, and rural service. Contracted providers include Golden Gate Transit, MV Transportation, and Marin Airporter. Marin Transit also contracts with Whistlestop Wheels to provide paratransit and dial-a-ride service within Marin County.
Table 8 summarizes the regularly scheduled Marin Transit services. Marin Transit also operates the Marin Access Mobility Management Center, which is a one-call, transportation information and referral service, focused on meeting the mobility needs of Marin’s older adults, disabled persons, and low-income residents.
Transit service provided within Marin County by Marin Transit via contractors includes:
Local Service: Nine routes operate entirely within Marin County on weekdays, with limited weekend service, contracted through Golden Gate Transit. An additional ten routes are operated as school-focused service on school days only, as detailed below. Since the 2013 CMP, Marin Transit has ceased operations on Route 28.
School Service: 11 routes provide limited service on school days in Marin County, as well as select trips on Routes 17 and 23. All routes have operated continuously since the 2013 CMP, with the addition of Route 145 serving Terra Linda High School.
Recreational Services: A shuttle service, Route 66, operates between Muir Woods and Sausalito. A supplemental route (66F) provides intermediate service via Marin City. Shuttle schedules are adapted to weekend and seasonal recreational travel demand. Marin Transit contracts with Golden Gate Transit to operate Route 66, in partnership with the National Park Service between May and October.
West Marin Stagecoach: Marin Transit contracts with MV Transportation to operate the West Marin Stagecoach with three shuttle service routes (Routes 61, 65 and 68) in West Marin. The Stagecoach provides weekday and weekend service to area residents. Route 65 is an additional service since the 2013 CMP.
Community Shuttle Service: Marin Transit contracts with Marin Airporter to operate six shuttle bus routes providing limited service: Strawberry/Tiburon (Route 219); Santa Venetia/San Rafael (Route 233); Hamilton Theater/San Marin Dr in Novato (Route 251); Indian Valley Campus/San Rafael
Marin County, Draft CMP Update
Page 173. System Performance
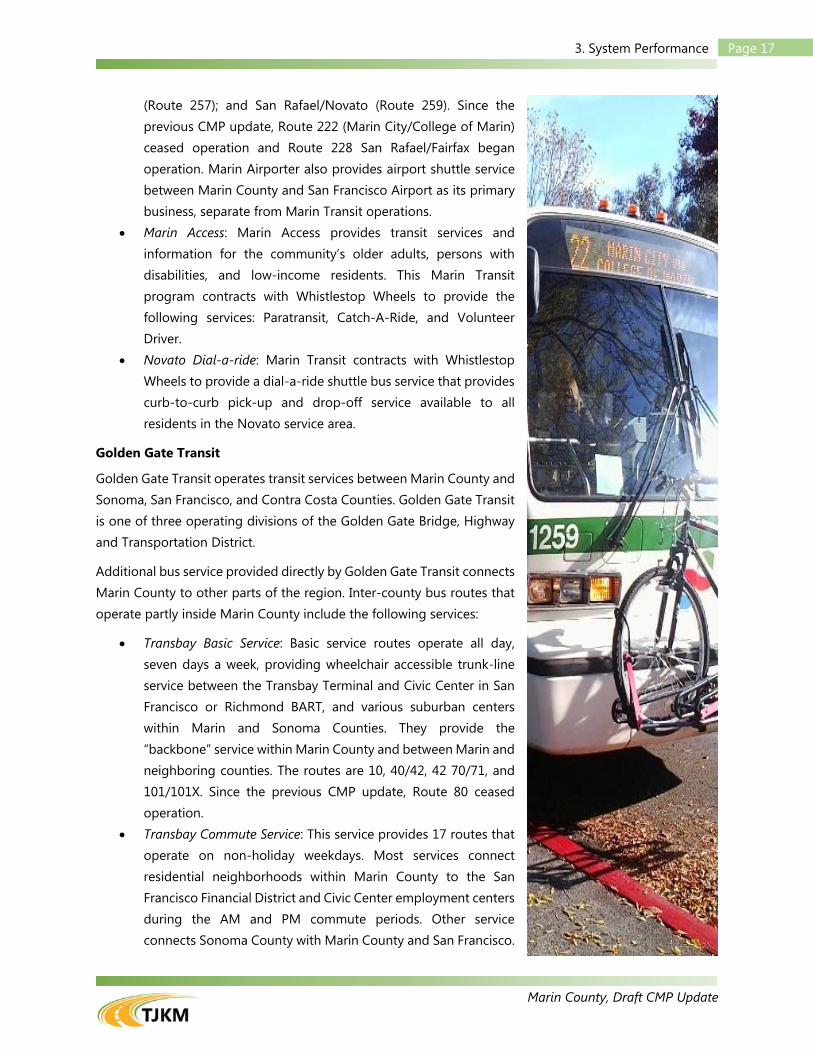
(Route 257); and San Rafael/Novato (Route 259). Since the previous CMP update, Route 222 (Marin City/College of Marin) ceased operation and Route 228 San Rafael/Fairfax began operation. Marin Airporter also provides airport shuttle service between Marin County and San Francisco Airport as its primary business, separate from Marin Transit operations.
Marin Access: Marin Access provides transit services and information for the community’s older adults, persons with disabilities, and low-income residents. This Marin Transit program contracts with Whistlestop Wheels to provide the following services: Paratransit, Catch-A-Ride, and Volunteer Driver.
Novato Dial-a-ride: Marin Transit contracts with Whistlestop Wheels to provide a dial-a-ride shuttle bus service that provides curb-to-curb pick-up and drop-off service available to all residents in the Novato service area.
Golden Gate Transit
Golden Gate Transit operates transit services between Marin County and Sonoma, San Francisco, and Contra Costa Counties. Golden Gate Transit is one of three operating divisions of the Golden Gate Bridge, Highway and Transportation District.
Additional bus service provided directly by Golden Gate Transit connects Marin County to other parts of the region. Inter-county bus routes that operate partly inside Marin County include the following services:
Transbay Basic Service: Basic service routes operate all day, seven days a week, providing wheelchair accessible trunk-line service between the Transbay Terminal and Civic Center in San Francisco or Richmond BART, and various suburban centers within Marin and Sonoma Counties. They provide the “backbone” service within Marin County and between Marin and neighboring counties. The routes are 10, 40/42, 42 70/71, and 101/101X. Since the previous CMP update, Route 80 ceased operation.
Transbay Commute Service: This service provides 17 routes that operate on non-holiday weekdays. Most services connect residential neighborhoods within Marin County to the San Francisco Financial District and Civic Center employment centers during the AM and PM commute periods. Other service connects Sonoma County with Marin County and San Francisco.
Marin County, Draft CMP Update
Page 183. System Performance
Commute service is generally operated in the peak direction during commute hours only, and is not run at all during the midday and off-peak periods.
Ferry Services
Three organizations provide ferry service in Marin County:
Golden Gate Ferry Service (Public Entity): The Golden Gate Bridge, Highway and Transportation District operates ferry services from Larkspur and Sausalito to San Francisco via conventional and high-speed ferries. The Larkspur ferry provides more service to San Francisco, with headways between 30 to 55 minutes during the weekday commute periods. The Sausalito Ferry provides less service and longer headways to San Francisco, between 50 and 90 minutes during the weekday commute periods. Both ferries transport people to the San Francisco Ferry Building. The San Francisco Giants Game Ferry (National League Baseball) is an additional ferry service that operates on game days. This ferry runs until 30 minutes after the final out of the ballgame and runs about 60 minutes from Larkspur to AT&T Park.
Blue and Gold Fleet (Private Entity): The Blue and Gold Fleet operates both commuter and recreational ferry service from Tiburon and Sausalito to Fisherman’s Wharf in San Francisco. Blue and Gold also provides recreational service between Angel Island and San Francisco, Oakland, and Vallejo.
Angel Island Tiburon Ferry (Private Entity): The Angel Island Tiburon Ferry operates recreational service between Angel Island and Downtown Tiburon. Service varies throughout the year; headways are 1-2 hours on weekdays and 1-3 hours on weekends; on weekends from April through October, headways are one hour and from November through March are 1-2 hours. No weekday service is offered from November through February except by reservation, and Wednesday-Friday service is offered in the month of March.
Summary of Fixed Route Services and Boardings
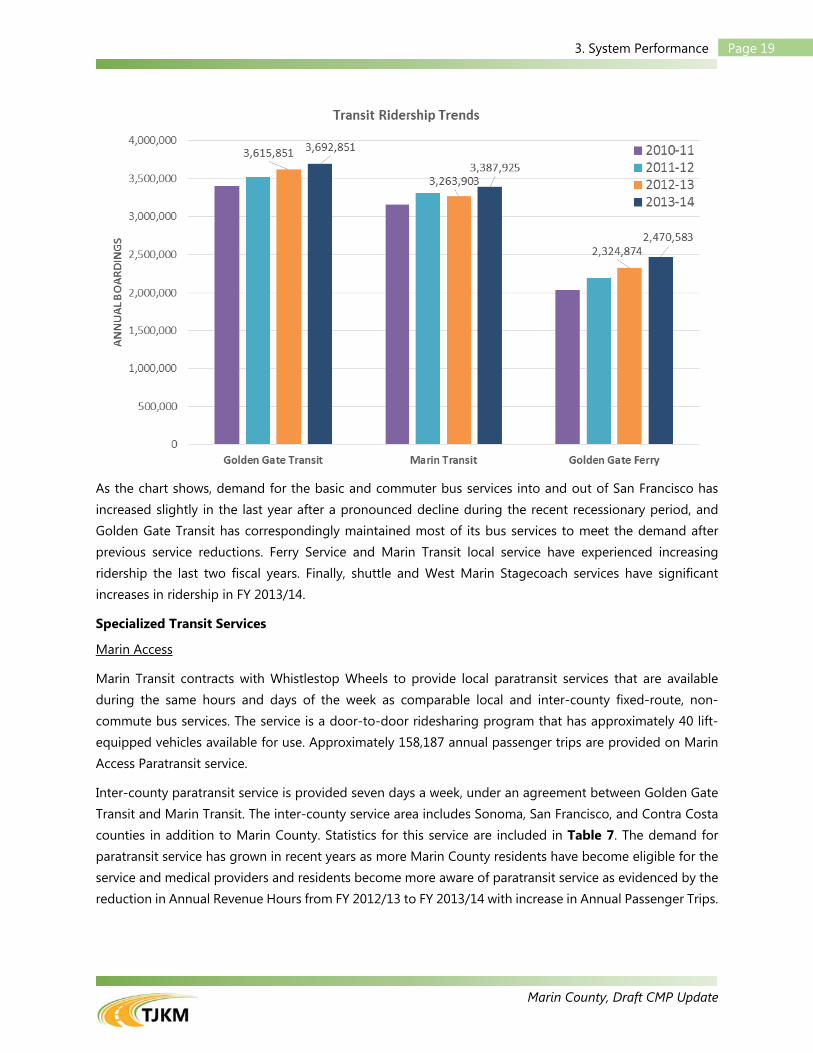
The transit routes managed by Marin Transit are routinely monitored for performance. The recent dedication of additional resources has led to an expansion of local transit service, which in turn has increased local boardings. These trends are summarized in the chart below, which also shows ridership trends in Golden Gate Transit Bus and Ferry Operations. The following summarizes the changes from FY 2012/13 to FY 2013/14:
Golden Gate Transit Basic and Commuter Service – Ridership increased approximately 2% Golden Gate Ferry Service – Ridership increased approximately 6% Marin Transit Fixed Route Services – Ridership increased 5% and revenue hours increased 8% Marin Access Services – Ridership increased 10% and revenue hours decreased 4%
Marin County, Draft CMP Update
Page 193. System Performance
As the chart shows, demand for the basic and commuter bus services into and out of San Francisco has increased slightly in the last year after a pronounced decline during the recent recessionary period, and Golden Gate Transit has correspondingly maintained most of its bus services to meet the demand after previous service reductions. Ferry Service and Marin Transit local service have experienced increasing ridership the last two fiscal years. Finally, shuttle and West Marin Stagecoach services have significant increases in ridership in FY 2013/14.
Specialized Transit Services
Marin Access
Marin Transit contracts with Whistlestop Wheels to provide local paratransit services that are available during the same hours and days of the week as comparable local and inter-county fixed-route, non-commute bus services. The service is a door-to-door ridesharing program that has approximately 40 lift-equipped vehicles available for use. Approximately 158,187 annual passenger trips are provided on Marin Access Paratransit service.
Inter-county paratransit service is provided seven days a week, under an agreement between Golden Gate Transit and Marin Transit. The inter-county service area includes Sonoma, San Francisco, and Contra Costa counties in addition to Marin County. Statistics for this service are included in Table 7. The demand for paratransit service has grown in recent years as more Marin County residents have become eligible for the service and medical providers and residents become more aware of paratransit service as evidenced by the reduction in Annual Revenue Hours from FY 2012/13 to FY 2013/14 with increase in Annual Passenger Trips.
Marin County, Draft CMP Update
Page 203. System Performance
Table 7: Marin Access Performance Statistics
Fiscal Year Annual Revenue
Hours Annual
Passenger Trips
2010/11 53,127 116,970
2011/121 49,012 119,666
2012/132 59,589 143,417
2013/14 57,389 158,187 Notes: 1 Volunteer Driver Program added in FY 2011/12 2 Catch-A-Ride Program added in FY 2012/13
Source: System Performance Summary for FY 2010/11, FY 2011/12, FY 2012/13, FY 2013/14, Marin Transit. (http://www.marintransit.org/monitoringreports.html)
Volunteer Driver
Marin Transit manages two Volunteer Driver programs for seniors who have difficulty using fixed route or paratransit services: 1) the Safe Transport and Reimbursement (STAR) Program operated by Whistlestop Wheels in Eastern Marin, and 2) the TripTrans West Marin Volunteer Driver Program operated by West Marin Senior Services in Western Marin. Both programs provide drivers with mileage reimbursements for their services. During the 2014 fiscal year, the volunteer driver program served 15,381 unlinked passengers during weekday service.
Catch-A-Ride
Marin Transit manages the Catch-A-Ride program, which allows eligible Marin County residents to receive a discounted ride in taxis and other licensed vehicles throughout Marin County. To be considered eligible for the program, participants must be a resident of Marin County and at least 80 years of age, at least 60 years of age and unable to drive, or be eligible for paratransit under the Americans with Disabilities Act. The program pays a discounted rate of the fare based on the mileage of the trip, rather than the meter rate. Fiscal year 2012/13 was the first full year of the program with 12,979 trips. Marin Catch-A-Ride is funded by Marin’s voter approved vehicle registration fee, Measure B.
3.2 Bicycle and Pedestrian Programs
TAM and other jurisdictions have a commitment to non-motorized transportation programs. This commitment extends to all levels of planning and funding, including a portion of TAM-administered Measure A funds. The Measure A Sales Tax Strategic Plan is comprised of four strategies in order to establish exactly where Measure A expenditures are allocated:
Marin County, Draft CMP Update
Page 213. System Performance
Strategy 1: Local Bus Transit Strategy 2: US 101 HOV Gap Closure Strategy 3: Transportation Infrastructure Strategy 4: School Related Congestion and Safer Access to School.
Strategies 2, 3, and 4 include bicycle and pedestrian improvements. Strategy 2 included the completion of two bicycle/pedestrian projects: Puerto Suello Hill and Lincoln Hill multi-use pathways. Strategy 3 is divided into two sub strategies: Major Roads and Related Infrastructure and Local Roads for all modes. Both sub strategies make bicycle and pedestrian eligible for funding. Per the Measure A Strategic Plan, Strategy 4 is identified as a significant component of traffic congestion in Marin, with over 21% of all trips in the morning peak period. Three sub-strategies – Safe Routes to Schools, Crossing Guards, and Safe Pathways to School Fund – complement each other to provide safer access to Marin schools.
Marin County was one of four demonstration locales in the nation to participate in a federally funded Nonmotorized Transportation Pilot Program (NTPP). This project, funded by Section 1807 of the Federally-Authorized SAFETEA-LU legislation, provides a way to measure the performance and results of investments in the bicycle/pedestrian system that has become a national model. The other pilot communities are Columbia, Missouri, Minneapolis area, Minnesota, and Sheboygan County, Wisconsin.
Highway projects in Marin County also consider bicycle and pedestrian needs in their design and construction. Active elements for bicycle and pedestrian needs are included in these recent projects:
US 101 Marin/Sonoma Narrows Project Tiburon/East Blithedale Interchange Bicycle/Pedestrian Access Study
Marin County benefits from having several recent projects funded by Regional Measure 2, Regional Traffic Relief Plan, which funds various projects for bridge corridor improvements. These projects include:
SMART Larkspur Extension Full Funding of the Cal Park Hill Tunnel Central Marin Ferry Connector Project across Sir Francis Drake Boulevard, Design and Phase 1
Additional funding of bicycle and pedestrian improvements in Marin County are provided through targeted funding sources, including
Transportation Funds for Clean Air (TFCA) Transportation Development ACT (TDA) Article 3 Regional Bicycle Program Funds Measure A County ½ Cent Sales Tax
Bicycle Master Plans
Countywide, TAM is coordinating the update of the County of Marin, and eight cities’ and town’s bicycle and pedestrian plans during 2014, 2015, and 2016. The plan updates, expected to be completed by summer of 2016, are funded with TDA Article 3 funds and managed by each local agency for public outreach and local adoption. The schedule of the plan updates will take place over two years.
Marin County, Draft CMP Update
Page 223. System Performance
Safe Routes to Schools Program
Strategy 4 of the Measure A Strategic Plan continues to make significant impact across the county. A brief overview of the three sub-strategies follows:
Safe Routes to School: TAM’s program is one of the most successful in the county, as well as a model for the nation. Since the program began, there has been an 8% mode shift countywide from single-student car trip to walking, bicycling, transit, and carpooling to/from school. The program will continue to strengthen and focus on long-term impacts.
Crossing Guards: This program provides trained crossing guards at key intersections throughout Marin County. Use of the crossing guards can reduce the reluctance parents may have in allowing their children to walk to school.
Safe Pathways: The capital improvement element of this strategy provides funding for the engineering, environmental clearance and construction of pathway, street crossing and sidewalk improvements for better and safer access to schools.
Bicycle and Pedestrian Programs by Jurisdiction
Local jurisdiction staff identified some of the significant contributions to local pedestrian and bicycle projects currently underway or recently completed as listed below.
Belvedere
No bicycle or pedestrian improvement projects have been identified as being completed or are under construction
Corte Madera
Design completed for a Class I Pathway from the High Canal Bridge to Lakeside Drive along the canal. Construction anticipated for Summer 2016. Funds awarded from State Bicycle Transportation Account grant.
Town’s 2013 Pavement Improvements Slurry Seal project (Measure A and B) completed in November 2013, adding a Class III bikeway with sharrows as proposed in Town’s current Bicycle Transportation Plan.
Town’s 2013 Pavement Improvement Overlays project reconfigured the Class III bike way and increased pavement path space on uphill side of Corte Madera Avenue near First Street to southern Town border. Existing lanes were narrowed and moved to downhill side to widen uphill path and add sharrows. Project completed January 2014.
Paradise Drive Bikeway Extension (Safe Pathways to School) project will be designed Summer 2015. 2013 Alto Tunnel Study – the Alto Tunnel corridor is located in the incorporated areas of Mill Valley
and Corte Madera. The County of Marin is the lead agency on this multi-jurisdictional corridor study and works closely with staff from Mill Valley, Corte Madera, Transportation Authority of Marin, and County Parks & Open Space. Surveyors currently working along the corridor conducting boundary and easement surveys for the County.
Bayside Trail Improvements second phase to upgrade the sidewalk on Paradise Drive from San Clemente to Sea Wolf.
Marin County, Draft CMP Update
Page 233. System Performance
Tamalpais/Redwood/Corte Madera Ave Pavement Overlay and Street Improvements completed January 2014.
Safe Routes to Schools, which includes 2 ADA-accessibility ramps, sidewalk, and curb and gutter at Mohawk Avenue and Monona Drive completed in FY 2012/13.
Concept plan completed for Tamalpais Drive Pedestrian/Bicycle Path to Low Canal Bridge Improvements, which includes installation of pedestrian/bicycle pathway.
Pavement rehabilitation construction of Spindrift Passage and Hickory Avenue completed on November 14, 2014.
The Town was awarded Safe Pathways to School funding for the Tamalpais Drive Pedestrian Crossing Enhancements in March 2014. Design will start in July 2015. Construction planned for Summer 2016.
Crosswalk and rectangular rapid flashing beacon improvements on Paradise Drive at Golden Hind Passage, Paradise Drive at Prince Royal Passage, Madera Del Presidio Drive from Meadow Ridge Drive to Simon Ranch Road. Will be constructed Spring 2016.
Lucky Drive Slurry and Bicycle Lane Striping and Safety Improvements will be constructed in Summer 2016.
The Town, with the City of Larkspur, applied for an ATP Grant application for improvements in the corridor of Lucky Drive to Wornum Drive between Tamal Vista Boulevard and Redwood Highway. A cycle track and walkway will be added to the north side of Wornum Drive and the west side of Nellen Avenue. The path on the south side of Wornum Drive between Tamal Vista Boulevard and Redwood Highway will be widened and separated. A separated multi-use path will also be added to the north side of the Wornum Drive between Nellen Avenue and Redwood Highway. Safety improvements will be made at the intersection of Fifer Avenue and Nellen Avenue on Nellen Avenue north of Fifer Avenue. In addition, a traffic signal will be added to the intersection of Nellen Avenue and Wornum Drive. Also, Nellen Avenue will be opened up at Fifer Avenue for southbound traffic only and two-way traffic will remain up to Fifer Avenue.
Pavement Rehabilitation (asphalt overlay) of the following streets will occur Spring 2016. 1. Redwood Avenue from Summit Drive to Merry Lane, 2. Stetson Avenue from Buida Court to Chapman Drive, 3. Chapman Drive from Stetson Avenue to Stetson Avenue, 4. Chapman Drive from Stetson Avenue to 600 feet south of Stetson Avenue, 5. Chapman Drive from 600 feet south of Stetson Avenue to Corte Madera Avenue, 6. Fifer Avenue from Lucky Drive to Tamal Vista Boulevard, and 7. Lucky Drive from Fifer Avenue to 140 feet east of Fifer Avenue.
Fairfax
Two flashing pedestrian crosswalks installed on Center Boulevard between Pastori Avenue and Pacheco Avenue during FY 2014/15.
Marin County, Draft CMP Update
Page 243. System Performance
Larkspur
Sandra Marker Trail ADA Connection, which includes two ADA-accessible concrete ramps from William Avenue along the north side (Larkspur property) and Apache Road along the south side (Corte Madera property) completed construction in FY 2012/13.
Bicycle lane reconfiguration completed on Magnolia Avenue. Sharrow treatment completed on S Eliseo Drive. Bike racks installed at multiple locations. Class I Bike and Pedestrian pathway completed on Magnolia Avenue. Resurfacing of roadway on Magnolia Avenue between Doherty Drive and Ward Street. Magnolia Avenue Sharrows completed. Pathways completed on Meadowood Drive and at Heatherwood Park. Redwood Highway rehabilitation completed. Sir Francis Drake Boulevard wooden bridge completed.
Mill Valley
Sycamore Avenue Bicycle and Pedestrian Improvement Project, constructed Summer 2014, involved construction of a sidewalk and multi-use path on Sycamore Avenue between Camino Alto and Bay Front Park and installation of high visibility school zone crosswalks, warning and directional signs, pavement striping and marking, and new landscaping.
Camino Alto, Miller Avenue/Almonte Boulevard Improvements Project, constructed Summer 2014, involved the installation of a multi-use path on the east side of Camino Alto between Miller Avenue and Sycamore Avenue including curb ramps, high visibility crosswalks, pavement striping and markings at Miller Avenue/Camino Alto and Miller Avenue/Almonte Boulevard intersections.
Miller Avenue Streetscape Plan/New Sidewalk and Bike Lanes involves construction of a sidewalk on the north side of Miller Avenue, as well as placement of Class II bike lanes with buffers and pavement repairs necessary to provide uniform surface for cyclists. Staff completed the Caltrans Field review and started environmental work in 2014.
Miller Avenue Streetscape Plan/Bike Connection to County MUP involves the construction of a multi-use bath on Miller Avenue to connect the Mill Valley-Sausalito Path to Camino Alto Avenue. Staff is currently working on environmental and concept design. Construction is expected for Summer 2016 or 2017.
Camino Alto South Bike Lanes Project involves the installation of bike lanes along Camino Alto between Miller Avenue and E. Blithedale Avenue. Staff completed the Caltrans Field review in 2014, and NEPA evaluation is in progress.
Traffic Calming Project will replace obsolete school area traffic controls, including signage and pavement markings, with traffic control consistent with the CA MUTCD at all five schools in Mill Valley. Additionally, the project involves installation of curb extensions, sidewalk widening and realignment, high visibility crosswalks, curb ramps, and a pedestrian interval traffic signal phase (Park Elementary School); installation of a vehicle speed feedback sign (Tamalpais High School); and
Marin County, Draft CMP Update
Page 253. System Performance
installation of high-visibility crosswalks, crosswalk signage, and crosswalk yield pavement markings (Mill Valley Middle School and TAM High School). Construction expected for Summer 2015.
Various intersection improvements Citywide: Improvements include ADA ramps, crosswalk striping and signing, ADA parking spaces.
Throckmorton Sidewalk Gap Closure involves the construction of approximately 300 LF of sidewalk on the south side of Throckmorton Avenue between Laurel Street and Josephine Street. Construction expected for late 2015.
Various intersection improvements Citywide include ADA ramps, crosswalk striping and signing, ADA parking spaces.
Novato
Bel Marin Keys Pedestrian/Bicycle Path Rehabilitation project completed in December 2013. A Class I multi-use path along Nave Drive between Main Gate Drive and Bolling Circle providing
safe access to Hamilton School and gymnasium and direct pedestrian connection from two active bus stops located at the Main Gate Drive and Bolling Circle intersections. Construction will begin Summer 2015.
Completed installation of 15 new wheelchair ramps and approximately 6,500 square feet of uplifted sidewalk repair throughout the town.
Safe Routes to School funded improvements for Lynwood Elementary School and Sinaloa Middle School completed Summer 2014. Improvements include construction of student pathways along the school perimeter, curb extensions, high visibility crosswalks, sidewalks on adjacent streets and installation of bicycle lanes.
Olive Avenue Class II Bike Lanes will widen Olive Avenue between Samrose Drive and the City limit to include Class II bike lanes. Construction scheduled for late 2015 or beginning of 2016.
Ross
A sidewalk extension approximately 190’ long was constructed in November 2014 along Sir Francis Drake Boulevard frontage of the Marin Art & Garden Center northwesterly to the intersection with Laurel Grove Avenue. Funding must be assumed to have been through the Town.
There is an application under TAM Measure A (Safe Pathways to School) to extend the end of the sidewalk approximately 130’ northeasterly along Laurel Grove Avenue to an existing crosswalk. The formal plans and specifications have not been prepared and project has not been put out to bid
San Anselmo
Pedestrian Improvements at various school locations as part of the Safe Pathways Projects funding. Constructed projects include traffic calming, pedestrian and bicycle enhancements at Wade Thomas & Brookside elementary school.
Pedestrian refuge islands, curb extensions and ramps, signs and pavement markings along Bolinas Avenue near Branson, Ross, St. Anselm, and Wade Thomas elementary schools as part of the Safe Pathways Program.
Marin County, Draft CMP Update
Page 263. System Performance
Install crosswalks and pedestrian safety barrier, construct speed table, sidewalks and curb ramps; upgrade traffic signals and crosswalks at Wade Thomas, Brooks, and St. Anselm elementary schools in 2015.
Intersection traffic calming, high visibility crosswalks, curb ramps, pedestrian traffic signals partially completed at Red Hill Avenue and Sequoia Drive, Sir Francis Drake Boulevard and Ross Avenue.
Completed design for the Sir Francis Drake Boulevard Sidepath between Oak Knoll Avenue and Butterfield Road.
Partially completed Bolinas Avenue Class III bike route between Richmond Road and San Anselmo Avenue. Will be completed with OBAG funding.
Class III bike routes on Oak Knoll Avenue between Medway Road and Sir Francis Drake Boulevard, Park Avenue between Taylor Street and Tamal Avenue, Tamal Avenue between Park Avenue and Sir Francis Drake Boulevard, and Taylor Street between Saunders Avenue and Park Avenue.
Completed design for bicycle detection at Sir Francis Drake Boulevard and Center Boulevard. Installed bicycle parking at Memorial Park and the Bus Stop at Sir Francis Drake Boulevard (6
inverted “U” racks) and Butterfield Road (2 inverted “U” racks). Completed design for rectangular rapid flashing beacons at Sir Francis Drake Boulevard and
Madrone Avenue and Sir Francis Drake Blvd and Saunders Avenue.
San Rafael
NTPP Puerto Suello Hill Path to Transit Center Connector – In Construction, completed August 2015. Mahon Creek Path Transit Center Connector Project – Completed. Grand Avenue Bridge Designed, have partial funding for construction, seeking remaining funding
for the project. Francisco Boulevard East Project design complete, seeking construction funds. Northgate Mall Promenade bike path complete. Mixed-use bike path along Bellam Boulevard complete. Manuel T Freitas Parkway and Las Gallinas Avenue Intersection Improvement currently in design
will close bike lane gap along Manuel T Freitas Parkway and Las Gallinas Avenue. Multi-use pathway repair along Shoreline Boulevard and Bahia Vista Street pathways. Construction
expected to be completed August 2015. Class II Bike Improvements around town consisting of new markings. Installed over 40 curb ramps throughout San Rafael at San Rafael Avenue, Devon Drive, Golden
Hinde Boulevard, Butternut Drive, Court Street, Brett Avenue and Alto Street.
Sausalito
Improvement of pedestrian facilities throughout the City: sidewalk reconstruction and/or repairs, and accessibility.
Safe Pathways to School improvements on Bridgeway include new sidewalk at the intersection of Bridgeway and Coloma Street, and widened sidewalks and enhanced underpass lighting near Ebbtide Avenue and N. Bridge Road.
Marin County, Draft CMP Update
Page 273. System Performance
Sidewalk widening on Humboldt Avenue between Anchor Street and Bay Street is programmed for improvements within the next year.
Tiburon
Multipath improvements in progress include improvements to the Old Rail Trail, mid-block crossing near Lodge across Tiburon Boulevard, and pathway improvements to Dairy Knoll Recreation Facility.
Marin County
Marin Sonoma Narrows Frontage Road Class II Bicycle Lanes Gap Completion will widen shoulders on San Antonio Road/Frontage Road to install Class II bicycle lanes from just north of South San Antonio Road/US 101 to the County Limit at the southern end of the San Antonio Creek Bridge. Proposed Class II facility will connect to Class I bicycle facility to be constructed on the north side of San Antonio Creek. Funding is still needed.
Bel Marin Keys Boulevard Class II Bicycle Lanes funded by TFCA – completed. Miller Creek Road Class II Bicycle Lanes and Pedestrian Improvements funded by TFCA and Federal
Transportation Enhancement Funding – in design. Major maintenance on Mill Valley-Sausalito Pathway – in design.Marin-Sonoma Narrows Redwood
Landfill Bicycle Pedestrian Facility – completed. Bicycle Plan Update – completion scheduled early 2016. Completed carious bicycle signing and striping improvements. 2013 Alto Tunnel Study – see description above (Corte Madera). Countywide Intersection Improvements for Bicycles (NTPP; Bicycle Detection) installed devices at
Tamalpais Drive and Redwood Highway/San Clemente Drive and Tamal Vista Boulevard and Fifer Avenue in Corte Madera.
San Quentin Village sidewalk (SR2S) – in design. Central Marin Ferry Connection Phase 2 – under study. Tourist Navigation Program (signage, mapping updates) – in progress. Sir Francis Drake Boulevard Rehabilitation – in design. Phase 2 signal upgrades (bicycle detection) – completed. Mill Valley Path Roundabout – completed. Seminary Drive/101 Ramp improvements (adds bike lanes) – in design. Mill Valley-Sausalito Path bridge study – in progress. Richmond Bridge bikeway connections (joint with TAM, San Rafael, Larkspur). Uphill bike lane Sir Francis Drake Boulevard/White’s Hill – completed. Gate 6 Road/Bridgeway improvements (joint with Sausalito, Caltrans) – in design. SMART path – Ranchitos to Civic Center Drive (SMART CP4 project) – in design, construction
anticipated late 2015.
Marin County, Draft CMP Update
Page 283. System Performance
3.3 Performance Measures
Two additional performance measures described below allow TAM to further measure transportation system performance in Marin County. They are travel time reliability and vehicle occupancy (broken down into passenger vehicle rider distribution and transit rider distribution).
Travel Time Reliability
Travel time reliability is the consistency or dependability in travel times, as measured from day-to-day and/or across different times of the day. Travel time reliability is significant to many transportation users. Drivers value reliability as it allows them to make better use of their time. Many transportation planners and decision makers have started to consider travel time reliability as a performance measure throughout the United States.
Travel time reliability measures are relatively new, but a few have proven effective. Most measures compare high-delay days to those with an average delay. The most effective methods of measuring travel time reliability are 90th or 95th percentile travel times, buffer index, and planning time index. The planning time index method has been used to compare travel times along US 101 in Marin County.
The planning time index represents how much total time a traveler should allow to ensure on-time arrival. While the buffer index shows the additional travel time that is necessary, the planning time index shows the total travel time that is necessary.
For example, a planning time index of 1.60 means that for a trip that takes 15 minutes in light traffic a traveler should budget a total of 24 minutes (15 x 1.6) to ensure on-time arrival 95 percent of the time.
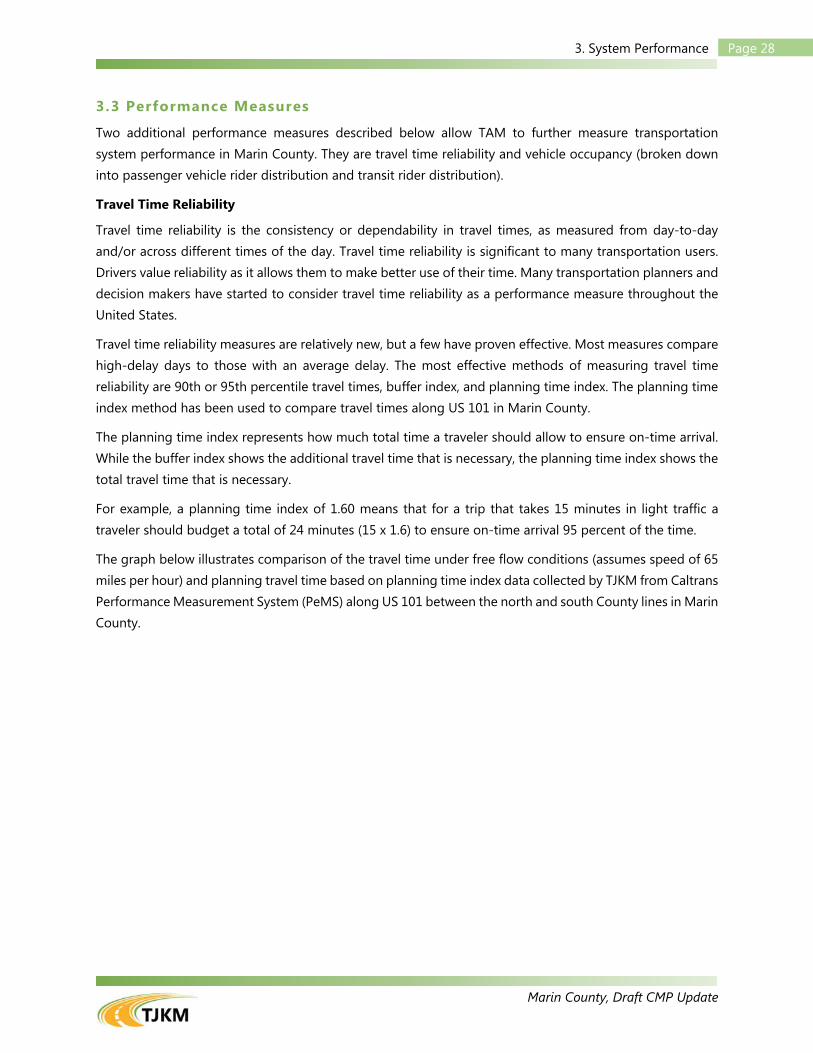
The graph below illustrates comparison of the travel time under free flow conditions (assumes speed of 65 miles per hour) and planning travel time based on planning time index data collected by TJKM from Caltrans Performance Measurement System (PeMS) along US 101 between the north and south County lines in Marin County.
Marin County, Draft CMP Update
Page 293. System Performance
As illustrated in the graph above, travel times along US 101 in the NB and SB directions between the County lines vary between approximately 19 - 32 minutes and 19 - 30 minutes respectively depending on the time of the day. In the NB direction, the travel time increases during the AM and PM peak periods of 6:00 - 11:00 AM and 2:00 - 8:00 PM respectively. The planning travel time in the NB direction during the PM peak hour can be as high as approximately 32 minutes (approximately 13 minutes more than the free flow travel time). The SB planning travel time during the AM peak hour can be as high as approximately 30 minutes (approximately 11 minutes more than the free flow travel time).
In addition to the above, TAM can also include factors such as seasonal variation, weather, and incidents to calculate the travel time along US 101 and I-580 within Marin County. Based on studies conducted within the United States, weather generally increases travel time by approximately 10 percent.
System Occupancy and Distribution
Bi-directional vehicle occupancy was collected at seven CMP network locations:
1. Segment #1A – SR 1 from US 101 to Tennessee Valley Road 2. Segment #1B – SR 1 from Northern Avenue to Almonte Boulevard 3. Segment #3A – US 101 from Golden Gate Bridge to Spencer Avenue 4. Segment #3B – US 101 from SR 131 (Tiburon Boulevard) to Tamalpais Drive 5. Segment #3F – US 101 from Freitas Parkway to Lucas Valley Road 6. Segment #3G – US 101 from Atherton Avenue to Sonoma County Line 7. Segment #5A – I-580 from Sir Francis Drake Boulevard to Marin County Line
US 101 – Marin County Travel Time Comparison
Marin County, Draft CMP Update
Page 303. System Performance
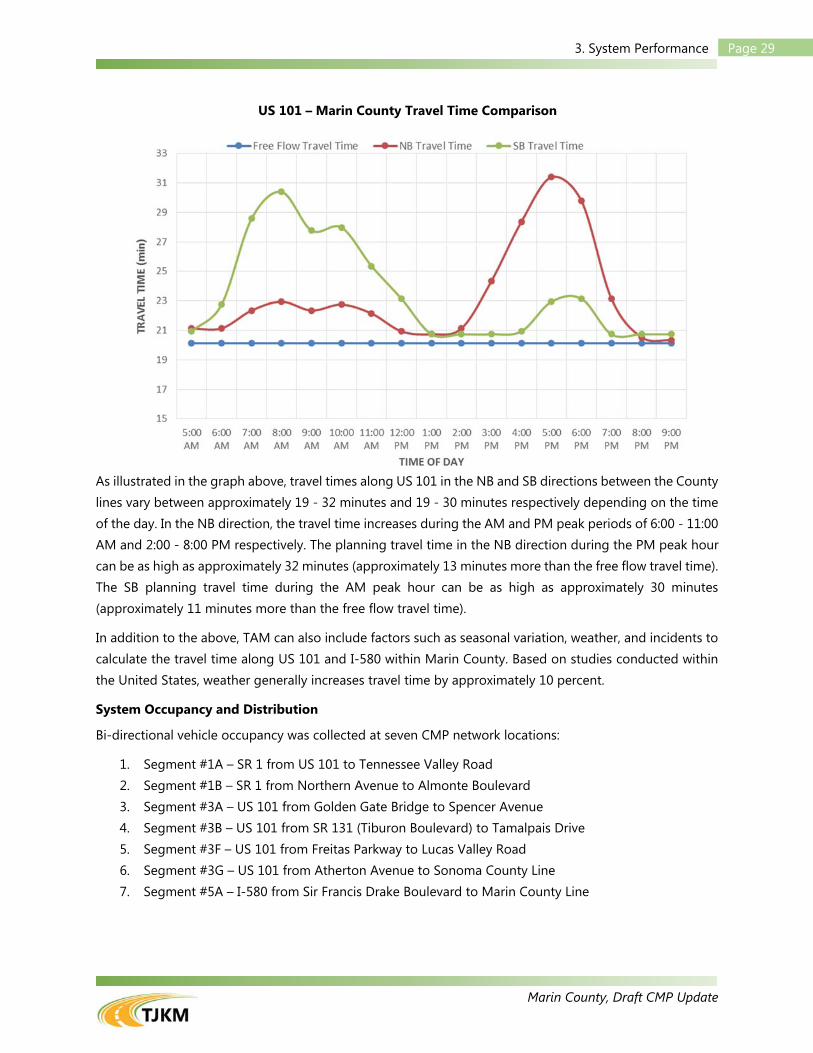
Passenger Vehicle Rider Distribution
From vehicle occupancy counts at the above locations, a percent distribution was generated to depict the percent of vehicles who have single; double; or three or more person ridership. The charts below display the percent of vehicles observed on all occupancy segments with these characteristics.
As seen above, there is an approximate 80:20 distribution between single and HOV ridership respectively across all seven monitored segments regardless of the presence of HOV/Express Lanes. In addition to a global view of the ridership distribution, HOV-specific occupancy counts were conducted on the two occupancy segments with HOV lanes available, Segment #3B and Segment #3F. From the collected data, a distribution of HOV (double; or three or more person) and single ridership was determined to show how many travelers use the HOV lane and have only one occupant. The following charts show this trend for the HOV operating direction during each peak period.
Marin County, Draft CMP Update
Page 313. System Performance
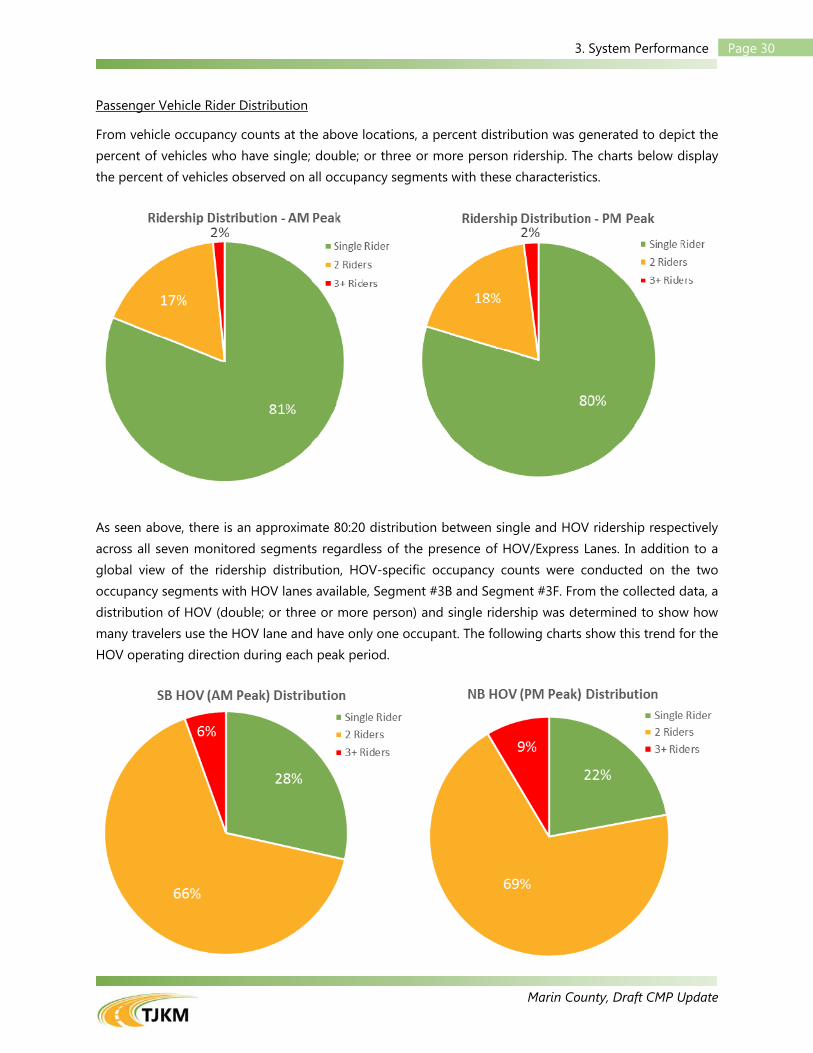
As the charts show, over 20% of HOV lane users are single occupancy vehicles during both peak periods. This trend is comprised of three types of users, motorcyclists, those who drive Clean Air Vehicles legally utilizing the lane without a passenger, and those who use the lane illegally.
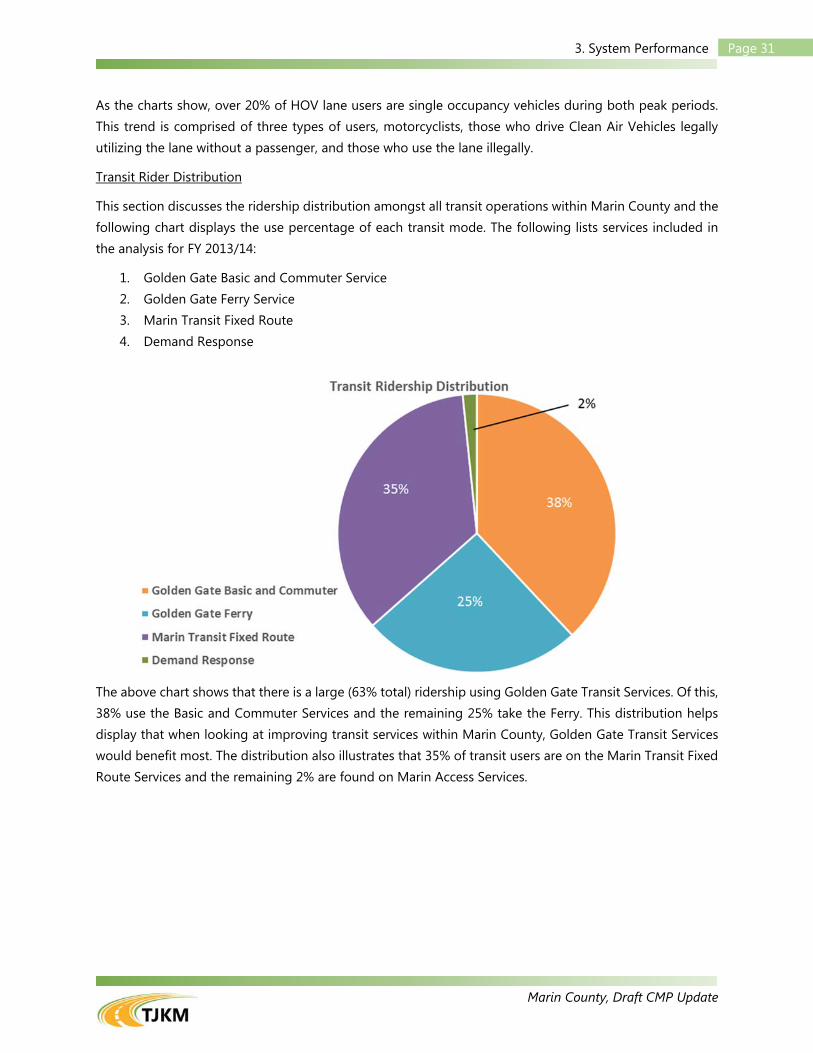
Transit Rider Distribution
This section discusses the ridership distribution amongst all transit operations within Marin County and the following chart displays the use percentage of each transit mode. The following lists services included in the analysis for FY 2013/14:
1. Golden Gate Basic and Commuter Service 2. Golden Gate Ferry Service 3. Marin Transit Fixed Route 4. Demand Response
The above chart shows that there is a large (63% total) ridership using Golden Gate Transit Services. Of this, 38% use the Basic and Commuter Services and the remaining 25% take the Ferry. This distribution helps display that when looking at improving transit services within Marin County, Golden Gate Transit Services would benefit most. The distribution also illustrates that 35% of transit users are on the Marin Transit Fixed Route Services and the remaining 2% are found on Marin Access Services.
Marin County, Draft CMP Update
Page 324. Travel Demand Management
4. TRAVEL DEMAND MANAGEMENT
4.1 Purpose and Intent of Legislation
The CMP is required to include all elements identified in the California Government Code Section 65089(b). Subsection (3) requires that all CMPs include a Travel Demand Management (TDM) element that outlines projects and strategies that promote alternate modes of transportation and thereby help reduce traffic congestion and improve air quality. Effective January 1997, with the passage of Assembly Bill (AB) 2419, the “Trip Reduction” component is no longer required in the CMP. This places higher emphasis on various travel demand strategies that will help cut down VMTs on the regional freeways and major arterials and the GHG emissions in the Bay Area.
As local governments review new development proposals and make key decisions on the planning and zoning matters, they have opportunities to ensure that TDM measures are adequately factored into this decision making process. As they develop and adopt their annual operating and capital budgets, they can allocate necessary funds so that the TDM strategies are adequately financed and implemented in a timely manner. Although not required, local governments may also choose to support (through resolution or other means) regional TDM measures, including carpool lanes and ridesharing facilities and programs, which could be implemented by other agencies, such as TAM or MTC.
4.2 Travel Demand Management in Marin County
The County recognizes that as a result of regional population growth and increased travel demand, the peak-period travel speeds will continue to deteriorate on freeways and arterials within the County. Due to limited availability of funds and opportunities for system expansion, it is critical that various TDM strategies are utilized to address the growing transportation needs of the County residents and businesses. Along with improving roadway operations and improving local transit service in response to this forecasted growth in traffic, it is also important to implement TDM measures to improve the operating efficiency of the existing county transportation system. The TDM element of the CMP encourages an on-going process that promotes local and regional planning to reduce traffic congestion.
A broad range of TDM options is available to the County and its eleven cities for further consideration and implementation. These measures and classified into four categories:
1. Traffic operational improvements: Typically, this category includes improvements at intersections or along corridors that result in improved traffic flow and reduced congestion. These improvements could also come through such diverse sources as increased ridesharing or minor modifications to the highway system.
2. Transit improvements: This category includes various strategies that encourage use of transit over auto. This includes better transit connections, real-time transit arrival information, bike-racks on transit, easier fare payment options, etc.
3. Traffic mitigation measures: These strategies involve addressing impacts of new developments, and mostly implemented by developers or employers.
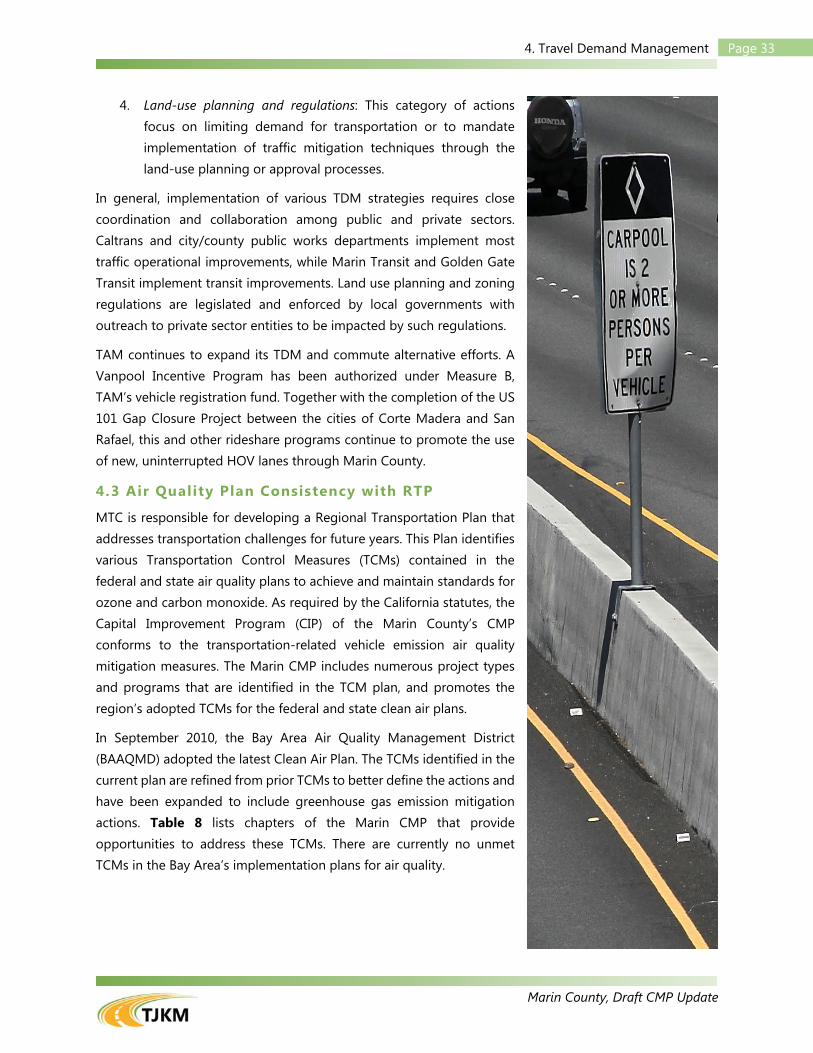
Marin County, Draft CMP Update
Page 334. Travel Demand Management
4. Land-use planning and regulations: This category of actions focus on limiting demand for transportation or to mandate implementation of traffic mitigation techniques through the land-use planning or approval processes.
In general, implementation of various TDM strategies requires close coordination and collaboration among public and private sectors. Caltrans and city/county public works departments implement most traffic operational improvements, while Marin Transit and Golden Gate Transit implement transit improvements. Land use planning and zoning regulations are legislated and enforced by local governments with outreach to private sector entities to be impacted by such regulations.
TAM continues to expand its TDM and commute alternative efforts. A Vanpool Incentive Program has been authorized under Measure B, TAM’s vehicle registration fund. Together with the completion of the US 101 Gap Closure Project between the cities of Corte Madera and San Rafael, this and other rideshare programs continue to promote the use of new, uninterrupted HOV lanes through Marin County.
4.3 Air Quality Plan Consistency with RTP
MTC is responsible for developing a Regional Transportation Plan that addresses transportation challenges for future years. This Plan identifies various Transportation Control Measures (TCMs) contained in the federal and state air quality plans to achieve and maintain standards for ozone and carbon monoxide. As required by the California statutes, the Capital Improvement Program (CIP) of the Marin County’s CMP conforms to the transportation-related vehicle emission air quality mitigation measures. The Marin CMP includes numerous project types and programs that are identified in the TCM plan, and promotes the region’s adopted TCMs for the federal and state clean air plans.
In September 2010, the Bay Area Air Quality Management District (BAAQMD) adopted the latest Clean Air Plan. The TCMs identified in the current plan are refined from prior TCMs to better define the actions and have been expanded to include greenhouse gas emission mitigation actions. Table 8 lists chapters of the Marin CMP that provide opportunities to address these TCMs. There are currently no unmet TCMs in the Bay Area’s implementation plans for air quality.
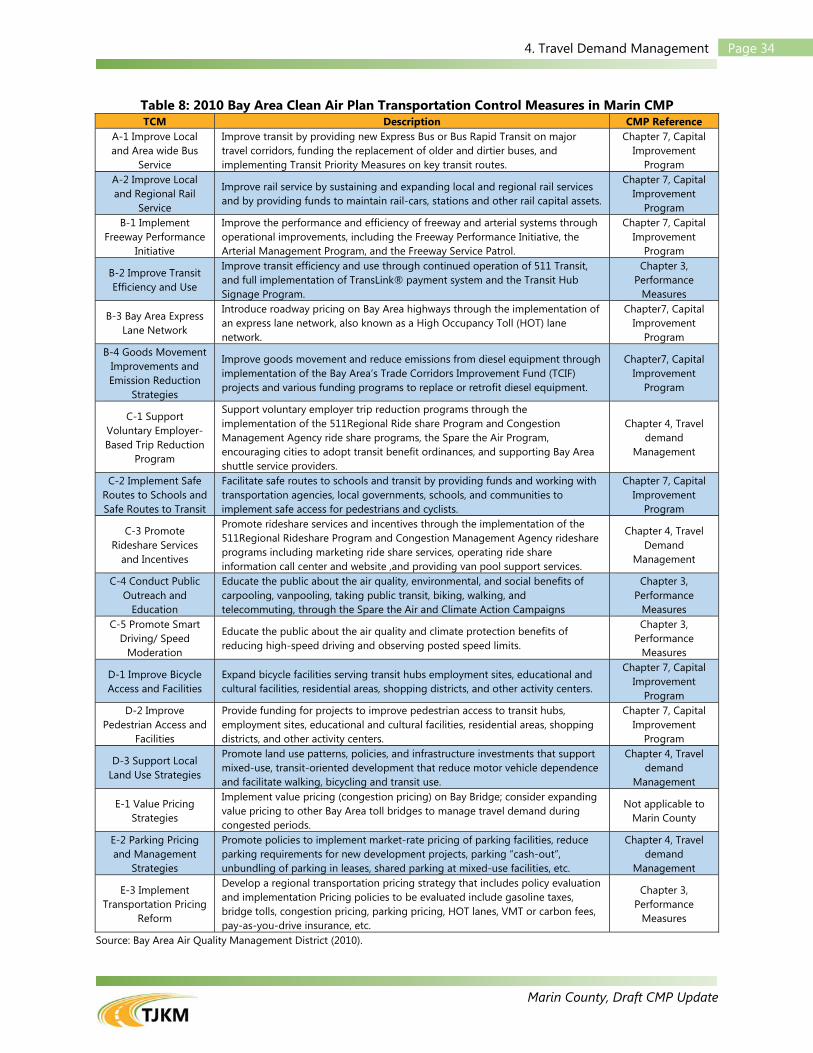
Marin County, Draft CMP Update
Page 344. Travel Demand Management
Table 8: 2010 Bay Area Clean Air Plan Transportation Control Measures in Marin CMP TCM Description CMP Reference
A-1 Improve Local and Area wide Bus
Service
Improve transit by providing new Express Bus or Bus Rapid Transit on major travel corridors, funding the replacement of older and dirtier buses, and implementing Transit Priority Measures on key transit routes.
Chapter 7, Capital Improvement
Program A-2 Improve Local and Regional Rail
Service
Improve rail service by sustaining and expanding local and regional rail services and by providing funds to maintain rail-cars, stations and other rail capital assets.
Chapter 7, Capital Improvement
Program B-1 Implement
Freeway Performance Initiative
Improve the performance and efficiency of freeway and arterial systems through operational improvements, including the Freeway Performance Initiative, the Arterial Management Program, and the Freeway Service Patrol.
Chapter 7, Capital Improvement
Program
B-2 Improve Transit Efficiency and Use
Improve transit efficiency and use through continued operation of 511 Transit, and full implementation of TransLink® payment system and the Transit Hub Signage Program.
Chapter 3, Performance
Measures
B-3 Bay Area Express Lane Network
Introduce roadway pricing on Bay Area highways through the implementation of an express lane network, also known as a High Occupancy Toll (HOT) lane network.
Chapter7, Capital Improvement
Program B-4 Goods Movement
Improvements and Emission Reduction
Strategies
Improve goods movement and reduce emissions from diesel equipment through implementation of the Bay Area’s Trade Corridors Improvement Fund (TCIF) projects and various funding programs to replace or retrofit diesel equipment.
Chapter7, Capital Improvement
Program
C-1 Support Voluntary Employer-Based Trip Reduction
Program
Support voluntary employer trip reduction programs through the implementation of the 511Regional Ride share Program and Congestion Management Agency ride share programs, the Spare the Air Program, encouraging cities to adopt transit benefit ordinances, and supporting Bay Area shuttle service providers.
Chapter 4, Travel demand
Management
C-2 Implement Safe Routes to Schools and Safe Routes to Transit
Facilitate safe routes to schools and transit by providing funds and working with transportation agencies, local governments, schools, and communities to implement safe access for pedestrians and cyclists.
Chapter 7, Capital Improvement
Program
C-3 Promote Rideshare Services
and Incentives
Promote rideshare services and incentives through the implementation of the 511Regional Rideshare Program and Congestion Management Agency rideshare programs including marketing ride share services, operating ride share information call center and website ,and providing van pool support services.
Chapter 4, Travel Demand
Management
C-4 Conduct Public Outreach and
Education
Educate the public about the air quality, environmental, and social benefits of carpooling, vanpooling, taking public transit, biking, walking, and telecommuting, through the Spare the Air and Climate Action Campaigns
Chapter 3, Performance
Measures C-5 Promote Smart
Driving/ Speed Moderation
Educate the public about the air quality and climate protection benefits of reducing high-speed driving and observing posted speed limits.
Chapter 3, Performance
Measures
D-1 Improve Bicycle Access and Facilities
Expand bicycle facilities serving transit hubs employment sites, educational and cultural facilities, residential areas, shopping districts, and other activity centers.
Chapter 7, Capital Improvement
Program D-2 Improve
Pedestrian Access and Facilities
Provide funding for projects to improve pedestrian access to transit hubs, employment sites, educational and cultural facilities, residential areas, shopping districts, and other activity centers.
Chapter 7, Capital Improvement
Program
D-3 Support Local Land Use Strategies
Promote land use patterns, policies, and infrastructure investments that support mixed-use, transit-oriented development that reduce motor vehicle dependence and facilitate walking, bicycling and transit use.
Chapter 4, Travel demand
Management
E-1 Value Pricing Strategies
Implement value pricing (congestion pricing) on Bay Bridge; consider expanding value pricing to other Bay Area toll bridges to manage travel demand during congested periods.
Not applicable to Marin County
E-2 Parking Pricing and Management
Strategies
Promote policies to implement market-rate pricing of parking facilities, reduce parking requirements for new development projects, parking “cash-out”, unbundling of parking in leases, shared parking at mixed-use facilities, etc.
Chapter 4, Travel demand
Management
E-3 Implement Transportation Pricing
Reform
Develop a regional transportation pricing strategy that includes policy evaluation and implementation Pricing policies to be evaluated include gasoline taxes, bridge tolls, congestion pricing, parking pricing, HOT lanes, VMT or carbon fees, pay-as-you-drive insurance, etc.
Chapter 3, Performance
Measures
Source: Bay Area Air Quality Management District (2010).
Marin County, Draft CMP Update
Page 354. Travel Demand Management
4.4 Transportation Demand Management – Completed and Current Actions
TAM continues to develop and implement projects and programs that improve traffic flow conditions, encourage use of transit, bicycling and walking; and promote alternatives to solo driving. Some of the recently completed and current projects include the following:
Green Commute Alternatives
These alternatives, offered to Marin residents and businesses, encourage carpool and vanpool options. In June 2013, TAM conducted a survey and completed a report titled “The Marin Commuter” that outlines various green commute alternatives available to Marin commuters. TAM continues to support 511 Rideshare Options, a Vanpool Incentives Program and an Emergency Ride Home Program. Its “Go Time Marin” Commuter Toolkit provides useful information on developing and managing a successful employee commute program at employment sites.
Station Area Plans
In anticipation of the SMART rail operations in 2016, TAM funded and completed two Station Area Planning studies – one each for the planned SMART stations in Downtown San Rafael and Civic Center. A third Station Area Plan for the Larkspur SMART Station and Ferry Terminal was cancelled in 2015.
Fairfax-San Rafael Transit Corridor Feasibility Study
This study, expected to be completed in late 2015, aims at addressing the current and anticipated demand in one of the most heavily traveled transit corridors in the County. The study limit extends from the Fairfax hub to downtown San Rafael with potential secondary extension to the Canal Neighborhood. The goals of this study include identifying the potential for new connections to serve SMART rail stations and regional transit services, and encourage mode shift from auto to transit to help alleviate congestion in the corridor.
Bicycle and Pedestrian Plan Updates
During 2014 and 2015, TAM is undertaking a collaborative approach to updating Bicycle and Pedestrian Master Plans for the County and eight cities. By 2016, plan updates will be completed for the County, Corte Madera, Fairfax, Larkspur, Mill Valley, Novato, San Anselmo, Sausalito, and Tiburon. Completion of these updates is anticipated to bring more local and regional funds to support bicycle and pedestrian infrastructure projects and thereby encourage more commuters to shift from auto to transit, bicycling and walking.
Ramp Metering
US 101 is one of the most congested freeways in the Bay Area. To address this situation, TAM has been working with Caltrans and MTC to installing ramp metering infrastructure in Marin County. In November 2014, TAM held an informational workshop that highlighted ongoing efforts to implement ramp metering in the County. The Ramp Metering Technical Advisor Committee that includes members from TAM, MTC, Caltrans, County of Marin and Marin cities, has recommended that first phase of ramp metering should include northbound ramps from Spencer Avenue to Sir Francis Drake Boulevard. This recommendation is based on the availability of limited funding for metering projects in Marin County.
Marin County, Draft CMP Update
Page 364. Travel Demand Management
US 101 / East Blithedale Avenue-Tiburon Boulevard Interchange Pedestrian and Bicycle Access Planning Study
This study will explore potential solutions that could enhance access and circulations to the interchange area’s 10 bus stops, walking paths and bicycle routes. The goal is to identify short-term, mid-term and long-term solutions that will help hundreds of pedestrians as well as recreational and commuter bicyclists with navigating this interchange with increased ease and safety. Caltrans, County of Marin, City of Mill Valley, Town of Tiburon, Golden Gate Transit and Marin Transit are project partners assisting TAM in this study. Numerous public workshops have been held to gather community input, most recently in May 2015.
Marin-Sonoma Narrows Project
This project will add carpool lanes on US 101 from SR 37 to just north of Corona Road overcrossing in Petaluma. The 17-mile long project is divided into five contracts for Phase 1. Contract I, completed in 2012, added a northbound HOV lane from SR 37 to Atherton Avenue and a southbound HOV lane from Rowland Boulevard to SR 37. Contract II involved upgrading Redwood Landfill Interchange to state standards and adding of frontage roads as well as Class I and Class II bike lanes. Contract III is currently underway, and involves realigning US 101 in certain sections. Contracts IV and V added a northbound HOV lane north of Atherton, and extended southbound HOV lane north of Rowland Boulevard to Franklin Overhead. Completion of these projects will add to the total miles of HOV lanes in Marin County, encouraging more solo drivers to carpool and thereby relieve congestion on US 101 in both directions. Phase 2 of this project would extend the HOV lanes to the county limits.
Central Marin Ferry Connection Multi-Use Pathway
This project will create a new multi-use pathway over Sir Francis Drake Boulevard near US 101, and provide a safe and convenient bridge link to the Larkspur Ferry Terminal and the future Larkspur SMART station. This project furthers TAM’s goal of creating non-motorized transportation options for both recreational and commuting use. The construction began last year and is expected to be complete in late 2015.
These are some of the projects and strategies being implemented by TAM and the Marin County cities. They exemplify the County’s commitment to use of alternate modes of transportation to solo driving and reducing reliance on auto travel, lessening burden on the over-extended freeways and highways, and improving air quality.
Marin County, Draft CMP Update
Page 375. Land Use Analysis
5. LAND USE ANALYSIS
5.1 Purpose and Intent of Legislation
Section 65089(b)(4) of the California Government Code requires that a CMP include a program to analyze the impacts of land use decisions made by local jurisdictions on the regional transportation system (both highways and transit).
The Land Use Analysis Program must include an estimate of the costs to mitigate impacts of development on the highway and transit systems. The legislation allows the cost of mitigating interregional travel (trips that do not begin in Marin County or trips that travel entirely through Marin County) to be excluded from the mitigation cost estimate. Public and private (developer) contributions to regional transportation improvements may be credited.
The legislation does not modify the role of local jurisdictions in making land use decisions and in determining the responsibilities of project proponents to mitigate those impacts. However, TAM has the authority to withhold gas tax subventions to local governments provided by Proposition 111 if a local jurisdiction fails to meet the requirements outlined in the Monitoring and Conformance chapter of the CMP (Chapter 8). Further guidance on the Land Use Analysis Program is found in the Congestion Management Resource Handbook (Caltrans, November 1990, pages 35-37).
The Land-Use Analysis Program is particularly important because it affects, or is affected by:
The CMP Designated Transportation System and Roadway Level of Service Standards (see Chapters 1 and 2);
Performance Measures (see Chapter 3); The Marin Travel Model (MTM), which can be used to analyze the impacts of land use changes on
both highways and transit (see Chapter 6); and The Capital Improvement Program (see Chapter 7).
The intent of the Land Use Analysis Program is to improve the linkage between local land use decisions and regional transportation facility decisions; to better assess the impacts of development in one community on another; and to promote information sharing between local governments when the decisions made by one jurisdiction have an impact on another.
The Land Use Analysis Program for the Marin County CMP is a process designed to improve upon decisions about land use and the spending of funds on highway and transit improvements in the county. The process is intended to work in a positive, cooperative fashion that supports the needs of local, county, regional and state governments.
TAM acts as a resource to local governments in performing transportation analyses of land use changes on the CMP designated transportation network. The MTM is used to analyze the transportation effects of local general plan updates and amendments and other major development decisions. The California Environmental Quality Act (CEQA) provides a framework for such assessment. To avoid duplication, the Land Use Analysis Program is intended to make maximum use of the CEQA process.
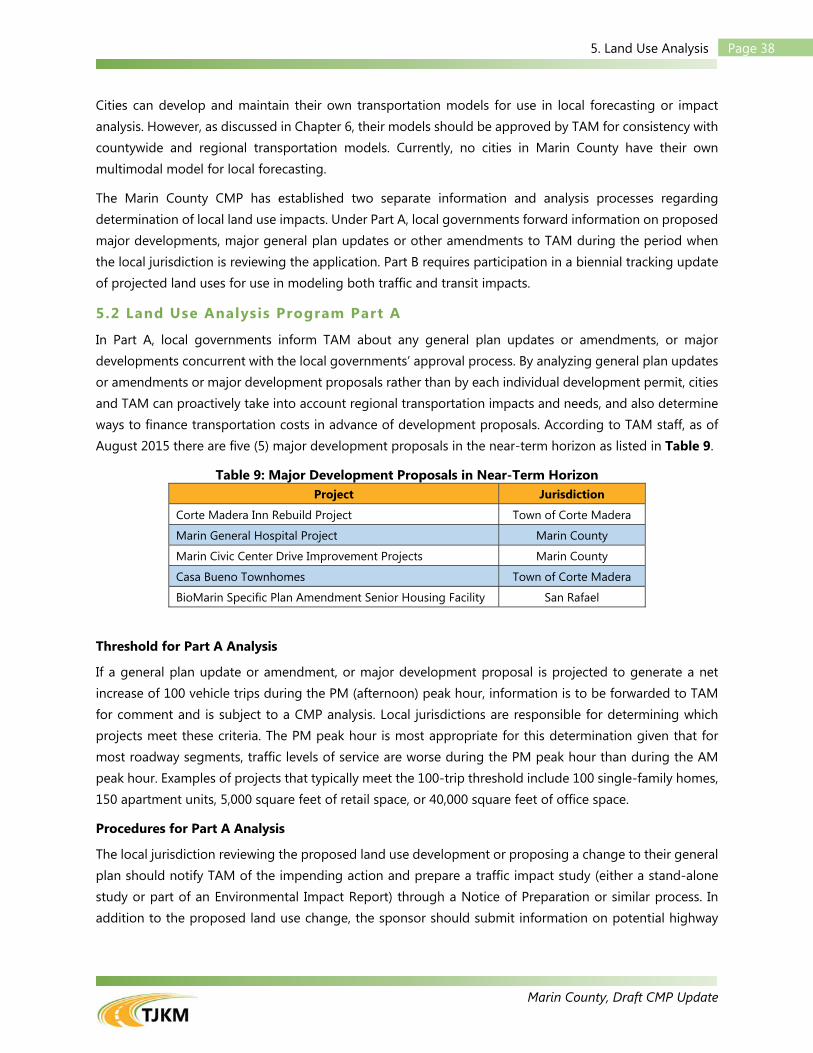
Marin County, Draft CMP Update
Page 385. Land Use Analysis
Cities can develop and maintain their own transportation models for use in local forecasting or impact analysis. However, as discussed in Chapter 6, their models should be approved by TAM for consistency with countywide and regional transportation models. Currently, no cities in Marin County have their own multimodal model for local forecasting.
The Marin County CMP has established two separate information and analysis processes regarding determination of local land use impacts. Under Part A, local governments forward information on proposed major developments, major general plan updates or other amendments to TAM during the period when the local jurisdiction is reviewing the application. Part B requires participation in a biennial tracking update of projected land uses for use in modeling both traffic and transit impacts.
5.2 Land Use Analysis Program Part A
In Part A, local governments inform TAM about any general plan updates or amendments, or major developments concurrent with the local governments’ approval process. By analyzing general plan updates or amendments or major development proposals rather than by each individual development permit, cities and TAM can proactively take into account regional transportation impacts and needs, and also determine ways to finance transportation costs in advance of development proposals. According to TAM staff, as of August 2015 there are five (5) major development proposals in the near-term horizon as listed in Table 9.
Table 9: Major Development Proposals in Near-Term Horizon Project Jurisdiction
Corte Madera Inn Rebuild Project Town of Corte Madera
Marin General Hospital Project Marin County
Marin Civic Center Drive Improvement Projects Marin County
Casa Bueno Townhomes Town of Corte Madera
BioMarin Specific Plan Amendment Senior Housing Facility San Rafael
Threshold for Part A Analysis
If a general plan update or amendment, or major development proposal is projected to generate a net increase of 100 vehicle trips during the PM (afternoon) peak hour, information is to be forwarded to TAM for comment and is subject to a CMP analysis. Local jurisdictions are responsible for determining which projects meet these criteria. The PM peak hour is most appropriate for this determination given that for most roadway segments, traffic levels of service are worse during the PM peak hour than during the AM peak hour. Examples of projects that typically meet the 100-trip threshold include 100 single-family homes, 150 apartment units, 5,000 square feet of retail space, or 40,000 square feet of office space.
Procedures for Part A Analysis
The local jurisdiction reviewing the proposed land use development or proposing a change to their general plan should notify TAM of the impending action and prepare a traffic impact study (either a stand-alone study or part of an Environmental Impact Report) through a Notice of Preparation or similar process. In addition to the proposed land use change, the sponsor should submit information on potential highway
Marin County, Draft CMP Update
Page 395. Land Use Analysis
network and transit system changes in their jurisdiction that could result from implementation through project or ordinance approvals, or changes to the circulation element policies or maps in their general plan.
Once TAM receives a project notice, TAM staff will prepare a response directing the applicant on what analysis is appropriate to fulfill CMP requirements. The TAM staff response should include a recommended approach to apply the travel model for use in the study. TAM usually recommends applying the county travel model under these specific situations:
1. General plan updates and amendments are normally processed well before any construction takes place. This provides more time for transportation impacts to be analyzed and mitigation measures developed than would occur if the analysis took place closer to actual project construction.
2. Existing general plans have already been incorporated into the Year 2035 land uses for the countywide model, as well as for the MTC regional travel model. The TAM model is currently being updated to Year 2040 land uses consistent with Plan Bay Area projections. Thus, any land development project that conforms to the general plan should not materially alter the forecast results generated by computer analysis already completed or being completed for the CMP. Only changes in (or amendments to) existing general plans could cause significant change in the Year 2035 / 2040 model forecasts.
3. A city or the county may consider general plan updates or amendments no more than four times during any year according to state law. This reduces the possible model runs that would be required.
4. Most (but not all) general plan updates or amendments are for developments of significant size.
Future levels of service are based on the land use assumptions and corresponding travel demand forecasts based on current general plans. The information on noticing that should be forwarded to TAM includes:
Precise location of the project(s) with map, including street access location; Proposed project land use(s) and number of dwelling units or square footage of development; Any available traffic studies, including trip generation rates assumed in determining whether the
general plan update or amendment met the 100-trip threshold; and Expected occupancy of each land use in Year 2040, with completion date and phasing.
The MTM is available to be used as part of the local development review process where appropriate. The local jurisdiction is responsible for determining future baseline traffic volumes, but may use the MTM for background or cumulative conditions analyses. The local jurisdiction remains responsible for identifying mitigations and funding any costs associated with a Negative Declaration or Environmental Impact Report for any project. It should be noted that the MTM is managed directly by TAM; therefore TAM must coordinate and manage any use of the model.
It may be appropriate for TAM to participate in a Part A land use analysis, especially if it involves using the MTM. If TAM participates in a Part A analysis, TAM would make modifications to its land use database contained in the model. A model run would include all highway and transit improvements (not just those on CMP designated facilities) for which funds seem reasonably secure, and also any improvements the applicant is willing to pay for as a condition of development approval. TAM would forward this information to the local agency, which would consider any level of service reduction in making their decision to approve
Marin County, Draft CMP Update
Page 405. Land Use Analysis
or not to approve the development project / general plan amendment. In developing conditions for project approval, the local jurisdiction would then have the option of:
Requiring additional mitigations from the developer, such as TDM measures (e.g., transit service, flex time, etc.), roadway improvements that would improve the LOS to the adopted standard, or other system improvements that would improve air quality as allowed by the CMP legislation;
Delaying the project until a certain highway or transit project is constructed; Working closely with the TAM staff on development of a Deficiency Plan if it appears that a CMP
system segment does not meet the adopted LOS standard; or Choosing not to implement any of the above measures and risk having the LOS not meet the
adopted standard on certain roadway segments in a future year. In this case, the local government would risk losing the increment of gasoline taxes provided by Proposition 111.
Once a study of the transportation impacts is completed, the local jurisdiction should send a draft copy to TAM for referral and comment. If the draft is prepared as part of an Environmental Impact Report, TAM concerns should be addressed in a final certification.
Once any remaining concerns expressed by TAM have been addressed and final documentation is completed, the local jurisdiction sends final project information and documentation to TAM as part of the Part A compliance.
5.3 Land Use Analysis Program Part B
Marin County maintains an inventory of proposed development projects, known as "PROPDEV." PROPDEV includes all projects with at least five residential units or at least 5,000 square feet of non-residential use. The PROPDEV database file covers 40 items of information including location, project sponsor, acreage, zoning, square feet of building area, and status of development application.
Many projects in Marin County are generally too small to effectively analyze using the county model on an individual basis. As mentioned earlier in Part A, large projects requiring a city or county general plan update or amendment should be analyzed using the model. Participation in development tracking is simple and useful for three principal reasons:
Local jurisdictions already are responsible for reporting information for all land use development; Compliance with Part B of the Land Use Analysis Program is easily attained by biennially submitting
a complete account of all residential and commercial projects approved in the preceding submittal and reviewing the PROPDEV inventory for that jurisdiction; and
Adjacent jurisdictions are able to account for nearby cumulative development more easily.
Once TAM has received updates on land use changes from the planning departments of each local government in Marin County, it should then biennially update the MTM with updated land use information.
In addition to land use changes, local governments are also responsible for advising TAM of planned changes to the roadway network and transit system based on their knowledge of developer mitigations, ordinance approvals, or changes to the circulation element of their general plan.
Marin County, Draft CMP Update
Page 415. Land Use Analysis
5.4 Additional Periodic Compliance
In addition to the Part A and Part B program elements that demonstrate biennial compliance, local governments should report when periodic changes occur in two other special instances:
Each jurisdiction should report changes to local traffic LOS standards, and confirm that they are consistent with or more restrictive than the LOS standards in the CMP.
Each jurisdiction should inform TAM when any other changes to the transportation network have occurred or changed, or are programmed to occur or change within their local capital improvements program or budget, or in any administrative directives.
5.5 Relationship of Land Use Analysis Program to CEQA
Local governments continue to have lead agency responsibility under CEQA for performing Environmental Impact Reports and Negative Declarations and conducting transportation analyses supporting these documents. Local government should continue to propose and analyze mitigation strategies. TAM may comment through the CEQA process, keeping local governments informed as to the adequacy of the analysis and approving any transportation models used as part of the analysis. TAM may also provide local governments with information on cumulative impacts.
5.6 Impacts of Non-Compliance
In the future, if any Marin County jurisdiction does not comply with each of these CMP requirements by December 2015 (when TAM makes any necessary non-conformance determination for each jurisdiction), that jurisdiction is found in non-conformance and may risk:
Losing an increment in its gasoline tax subvention funds; and/or Not having projects programmed in the Regional Transportation Improvement Program (RTIP)

Marin County, Draft CMP Update
Page 426. Travel Demand Model
6. TRAVEL DEMAND MODEL
6.1 Purpose and Intent of Legislation
California Government Code Section 65089(c) requires that every CMA, in consultation with the regional transportation planning agency (MTC in the Bay Area), cities, and the county, develop a uniform database on traffic impacts for use in a countywide travel demand model. The State statute also requires the countywide model to be the basis for transportation models used for county sub-areas and cities, and that all models are consistent with the modeling methodology and databases used by the regional transportation planning agency. The CMA also approves sub-county area transportation models and models used by local jurisdictions for land-use impact analysis, if local jurisdictions decide to develop them. In Marin County, the Marin Travel Model (MTM) is routinely updated as part of the consistency determination process with MTC.
The purpose of the travel demand model requirement is to guide the CMA decision-making process in identifying the most effective balance of transportation programs and projects that maintain LOS standards, which includes:
1. Consideration of the benefits of transit service and TDM programs, and 2. The need for projects that improve congestion on the CMP designated network.
The modeling requirement is also intended to assist local agencies in assessing the impact of new development on the transportation system. TAM needs to consider the nature of the analysis, functions of specific analytical tools, and its available resources when deciding how to fulfill this requirement of the statute.
6.2 Local Agency Requirements
At this time, there are no specific requirements of local agencies, other than supplying the base year land use information that is noted in Chapter 5. TAM expects to continue operating and refining its own countywide model, although cities may also create and use their own model subject to the above legislative requirements.
6.3 Travel Demand Forecast Overview
A distinct and measurable relationship between travel demand, land use patterns, and transportation systems is the basis for modern transportation planning practice. Transportation models have been developed as the best tools available to quantify this relationship; however, it is complex. Research on more effective transportation modeling continues to evolve.
CMP legislation requires consistency with the regional travel model. This chapter summarizes the MTM performance and its consistency with the MTC Travel Demand Model guidelines for CMPs. The last conformity evaluation of the MTM was completed in 2013 and remains current as of this CMP update. The MTM is currently being updated for the next conformity evaluation due to MTC in October 2015.
Marin County, Draft CMP Update
Page 436. Travel Demand Model
6.4 Existing and Past Programs
Bay Area travel demand modeling has been characterized by extensive travel behavior studies and model development by MTC, the recognized Metropolitan Planning Organization and regional transportation planning agency for the Bay Area, in cooperation with the Association of Bay Area Governments (ABAG). Since the early 1970’s, MTC has had the responsibility and also funding at the Federal level to develop models of travel behavior. Marin County, in developing its own travel demand model (MTM), has built on information and logic from the MTC model.
MTC is required to review any sub-regional model for consistency with the MTC model. TAM staff assists with any model revisions. The remainder of this chapter contains the MTC checklist and responses for model consistency.
Land use forecasts for Marin County jurisdictions are currently consistent with ABAG’s Projections 2013. The MTM currently includes the Plan Bay Area land use projections for Year 2040. Plan Bay Area is the combined Regional Transportation Plan and Sustainable Communities Strategy for the Bay Area. In measures including households, population, jobs, and employed residents, the changes in the model update will be within the MTC criteria for sub-regional model consistency. Thus, Marin County will continue to fall within the model consistency checklist.
6.5 MTC Modeling Consistency
MTC’s goal is to establish regionally consistent model “sets” for application by MTC and the CMAs. In the winter of 2010/2011, MTC replaced the modeling tool – named BAYCAST-90 – that had been in place, with relatively minor modifications, for the past two decades with a more sophisticated, so-called “activity-based” model – named Travel Model One. This change required a broad re-thinking of these guidelines as they now require a framework in which trip-based and activity-based models can be aligned. The approach remains the same: a checklist is used to adjudge consistency across model components.
Checklist
MTC requires local CMAs to submit a checklist for model consistency. This checklist guides CMAs through their model development and consistency review process by providing an inventory of specific products to be developed and submitted to MTC, and by describing standard practices and assumptions to be followed. The checklist items are highlighted in this section.
Because of the complexity of the topic, the checklist may need additional detailed information to explain differences in methodologies or data. Significant differences will be resolved between MTC and the CMA, taking advantage of the Regional Model Working Group. Standard formats for model comparisons will be developed by MTC for use in future guidelines. With regard to the MTM, no difference in data occurs that requires resolution.
Update Process
TAM model forecasts must be updated every two years to be consistent with MTC’s forecasts. Alternative approaches to fully re-running the entire model are available, including incremental approaches that apply factors to demographic inputs or to trip tables. Similarly, the horizon year must be the same as the TIP
Marin County, Draft CMP Update
Page 446. Travel Demand Model
horizon year. However, interpolation and extrapolation approaches are acceptable, with appropriate attention to network changes. These alternative approaches should be reviewed with MTC. The MTM is routinely updated to reflect new development and transportation projects within Marin County.
Marin Travel Model Conformity to MTC Model Data
The MTM conforms to MTC consistency guidelines. The conformity between the MTM and MTC forecasting was established in October 2013. The next model conformity check is due to MTC in October 2015. Below is a list of MTC checklist requirements and the products required for each.
A. General Approach
PRODUCT 1: The TAM Countywide Model was developed in 1989 with a standard, 4-step trips based model procedure and is a direct implementation of the MTC FCAST 1980/81 model. The auto ownership, trip generation, trip distribution, mode choice and trip assignment steps all use MTC procedures consistent with the FCAST model sets. The TAM Countywide Model is a focused version of the MTC FCAST model in that there is considerably more zonal and network detail within Marin County, similar detail in San Francisco and Sonoma County to MTC, and a more coarse skeletal system in the remaining counties. The model has a traditional trip purpose definition of home-based work, home-based shop/other, home-based social/recreation, non-home based, home-based college and home-based school similar to the MTC FCAST model. The model develops trip generation using a Fortran program with calibrated trip production and attraction equations and rates consistent with MTC FCAST. The model distributes trips based on travel time friction factors using a gravity model with 2-dimentional matrix balancing and utilizes k-factors for home-based work trips to improve the estimates compared to the MTC regional model. Transit routes are coded in the model for Muni, ferries and Golden Gate Transit from Marin to San Francisco. Mode choice is conducted using a standard multinomial logit formulation for home-based work to predict auto trips for drive-alone, shared ride two and shared ride three, and transit trips. A simple binomial model is used for the other purposes to predict auto and transit trips. At this stage the model does not forecast non-motorized trips (pedestrian and bicycle). Trip assignment is conducted for the a.m. and p.m. peak one-hour periods and for daily trips using a standard BPR style speed-flow relationship. The capacities and speeds on the road network incorporate the five area types (Core, Central Business District, Other Central Business District, Residential Areas and Rural Areas) and six facility types (Freeway, Expressway, Undivided Arterial, Collector Street, Centroid Connector and Divided Arterial) consistent with the MTC FCAST system.
B. Demographic/Economic/Land Use Forecasts
PRODUCT 2: The 2040 socio-demographic data in the TAM Countywide Model is based on the latest Plan Bay Area data and disaggregated (reallocated) within Marin and Sonoma counties, and aggregated outside. The resulting deviation is no greater than ±1% from the county level totals provided by ABAG for households, household population, jobs and employed residents for the subject counties, and match ABAG estimates exactly outside the subject counties.
Marin County, Draft CMP Update
Page 456. Travel Demand Model
PRODUCT 3: At this time, the TAM Countywide Model does not include a 2010 base year. It is anticipated the next update to the TAM model (October 2015) will update the base year to 2010.
PRODUCT 4: Land uses were allocated within Marin County directly consistent with the MTC RTAZ totals and disaggregated to the finer TAZs within Marin County. Data at the MTC TAZ level in Marin County was allocated to the smaller Marin model TAZs using local land use development patterns, but MTC zone level control totals were preserved in the allocation process.
C. Pricing Assumptions
PRODUCT 5: The TAM model was originally calibrated using pricing assumptions consistent with the 1980 calibration assumptions therefore all prices are expressed in $1980. These assumptions were updated with each subsequent model validation. However, since this round did not update the validation, the pricing was unchanged. TAM has provided MTC with a table showing comparisons between $1980, $1990, $2000 and $2010 levels that is relatively consistent with the latest MTC pricing assumptions for automobile costs.
D. Network Assumptions
PRODUCT 6: The TAM Countywide Model uses MTC regional highway and transit assumptions for the other bay area counties with a more detailed network definition within Marin and Sonoma County. The 2040 horizon year is consistent with the latest MTC RTP plan.
E. Automobile Ownership
PRODUCT 7: The TAM Countywide Model uses average auto ownership assumptions based on zonal average auto ownership values taken directly from the MTC FCAST regional model for Marin, Sonoma and San Francisco counties. Auto ownership assumptions are not utilized for the other bay area counties. As comparison for the latest Conformity, average values were computed for the MTC Model One auto ownership for each county and compared to similar values for the TAM Countywide Model. Because the auto ownership parameters are based on the documented calibration for year 1990 conditions using the MTC FCAST process, the auto ownership model has not been adjusted to better match the MTC results at this stage. When the
Marin County, Draft CMP Update
Page 466. Travel Demand Model
TAM Countywide Model is next updated, the auto ownership results will be directly compared to 2010 Census data as well as the corresponding results from MTC Travel Model One. Adjustments will be made to the calculation of auto and transit accessibility as well as calibration coefficients to ensure better consistency of auto ownership results.
F. Tour/Trip Generation
PRODUCT 8: The TAM Countywide Model implements the MTC FCAST trip generation process using a FORTRAN program. The Travel Model One does not calculate trips from each land use, but instead develops a set of tours based on activities which are then turned into trips.
The total daily trips in the TAM Countywide Model are 6% lower than the daily trips generated from tours in Travel Model One. This is likely because the tours can consider several types of short trips on the way to and from primary activities that may be consolidated in the FCAST trips based model system.
G. Activity/Trip Location
The TAM Countywide Model uses the MTC FCAST model trip distribution process and basic factors to estimate activity/trip locations. Additional adjustment factors (“K factors”) were applied to more closely match the MTC FCAST model estimates of county-to-county trip patterns for the 2000 calibration year. These calibrated adjustment factors are used for all forecast years.
PRODUCT 9: Average trip lengths in miles are compared for the 2040 horizon year. The MTC Travel Model One results are reported for tour types while the TAM Countywide Model results are reported for trip purposes. For home-based work trips, the average trip distance between the TAM Countywide Model and MTC Model One is -1.43 miles or -14%. For all purposes, the average trip distance between the TAM Countywide Model and MTC Model One is 0.17 miles or 3%.
PRODUCT 10: The county-to-county trip patterns were compared for 2040 journey-to-work patterns. The 2040 journey-to-work patterns for the TAM Countywide Model were estimated by dividing home-based work trips by a factor of 1.5. This factor was estimated based on prior comparisons of 2000 Census Journey to Work data and 2000 Home-Based Work trip estimates from various travel models. Overall, the TAM Countywide Model is within 1% of the MTC’s Travel Model One for the number of bay area travelers. The TAM Countywide Model is within 7% of the MTC’s Travel Model One for the number of travelers with both home and workplace within Marin County.
H. Travel Mode Choice
The mode choice in the TAM Countywide Model is based on the multinomial logit formulation of the MTC FCAST model. Comparisons between the TAM Countywide Model and the MTC’s Travel Model One focus on the more aggregate results (“higher level nests”) where direct comparisons are possible. The TAM Countywide Model does not currently predict non-motorized modes.
PRODUCT 11: Trips by mode for the 2040 horizon year are compared between the tour types in MTC’s Travel Model One and the closest corresponding trip purpose in the TAM Countywide Model.
Marin County, Draft CMP Update
Page 476. Travel Demand Model
Overall, the TAM Countywide Model is 13% higher than the MTC’s Travel Model One for automobile mode share and 0.6% higher for transit mode share. The TAM Countywide Model is 15% higher than the MTC’s Travel Model One for Home Based work automobile mode share and 6% lower for transit mode share.
I. Traffic Assignment
Traffic assignment results are compared to the MTC’s Travel Model One in terms of region-level, time-period-specific comparison of vehicle miles traveled (VMT) and vehicle hours traveled (VHT) by facility type, and region-level, time-period-specific comparison of estimated average speed on freeways and all other facilities. The TAM Countywide Model only predicts traffic for the a.m. and p.m. peak hour periods and for daily conditions.
PRODUCT 12: Vehicle miles and hours of travel are compared with the MTC’s Travel Model One for the 2040 horizon year. The only time periods that can be directly compared with the TAM Countywide Model are the a.m. and p.m. peak hour periods and the daily conditions. The TAM Countywide Model does not include traffic assignments for the early a.m., a.m. and p.m. peak four-hour, midday or evening periods.
The TAM Countywide Model estimates 2040 12% lower daily VMT and 29% lower daily VHT than the MTC’s Travel Model One.
PRODUCT 13: Estimated average speeds for freeways and non-freeways are compared with the MTC Model One for the 2040 horizon year. The only time periods that can be directly compared with the TAM Countywide Model are the a.m. and p.m. peak hour periods and daily. Overall, the TAM Countywide Model daily speeds are within -2% for freeways, -14% for other facilities and 25% for all facilities combined when compared to the MTC Travel Model One speeds.
6.6 Relationship to Marin County Capital Improvement Program
The current MTM includes all relevant projects listed in the State Transportation Improvement Program (STIP) for the 2040 horizon year.
The MTM is used for assessing the impacts of capital improvements. CMP statutes stipulate three criteria for projects selected for the Capital Improvement Program (CIP):
Projects must maintain or improve the traffic level-of-service and transit performance standards, Project land use impacts must be mitigated, and Projects must conform to vehicle emissions and air quality mitigation measures
Toward that end, MTM results are typically used in evaluating relevant projects in the CIP chapter (Chapter 7), in preparing a project list for RTIP consideration by MTC and also for developing and programming any supplementary revenue sources.
Marin County, Draft CMP Update
Page 487. Capital Improvement Program
7. CAPITAL IMPROVEMENT PROGRAM
7.1 Purpose and Intent of Legislation
CMPs are required by California Government Code Section 65089(b)(5) to include a seven-year Capital Improvement Program (CIP) to maintain or improve the performance of the multimodal system for the movement of people and goods and to mitigate regional transportation impacts identified through the Land Use Analysis Program. Capital improvement projects must conform to transportation-related vehicle emissions and air quality mitigation measures. In the Bay Area, such transportation control measures (TCMs) are contained in the Bay Area 2010 Clean Air Plan.
7.2 Relationship to Regional Transportation Plan
MTC adopted the current RTP, Plan Bay Area, in July 2013. The action elements and projects for the CMP’s CIP should be consistent with the assumptions, goals, policies, actions and projects identified in the RTP. The RTP is the basic statement of transportation policy expressed by MTC. Given the established interdependence of transportation planning and land use planning, MTC made a significant effort to adopt policies that complement and support programs of Federal, State, and regional agencies. The RTP is updated every four years, with Plan Bay Area 2040 the document to update in 2017.
7.3 Relationship to Regional Transportation Improvement Program
TAM’s CIP is the basis for determining which projects are included in the RTIP. Inclusion of a project in the RTIP is the first step in obtaining a funding commitment from the State. Projects that MTC includes in the RTIP are then recommended to the California Transportation Commission (CTC) for inclusion in the State Transportation Improvement Program (STIP). If the CTC includes a project in the STIP, it has approved the project for the necessary environmental studies and project design, which ultimately leads to a final decision on whether a project is implemented.
Projects that are to be included in the RTIP must be first included in TAM’s CIP. However, it should be noted that MTC is responsible for assembling the RTIP, and also, the RTIP is a funding-constrained document. This CIP is developed with information from the current RTIP, which MTC adopted in September 2014. The dynamic nature of funding requires minor amendments to the plan several times a year.
7.4 Relationship to Air Quality Attainment Plans
The TAM CIP project list must show consistency to air quality attainment plans. The Bay Area 2010 Clean Air Plan, prepared by the Bay Area Air Quality Management District, is the current adopted plan. Various TCMs have been adopted as a part of this plan. MTC gives priority to those proposed projects that support or help implement any of the TCMs (see Chapter 4 for a listing and discussion of TCMs). Examples of such projects include HOV lanes and ramp meter bypass lanes for HOVs.
Marin County, Draft CMP Update
Page 497. Capital Improvement Program
7.5 Project Funding Identified in TAM Measure A Strategic Plan
Marin County voters passed Measure A, the County’s 1/2-cent transportation sales tax, in 2004. A Strategic Plan for this measure was developed that outlines how collected funds will be spent. This plan is routinely updated to reflect current agency strategies. As many projects are also funded partially through Measure A revenues, the relationship of the CIP to this Strategic Plan is important.
The most recent update, the Measure A Strategic Plan Update 2014, discusses strategies in four areas. Each strategy and key capital improvements are described as follows:
Strategy 1: Develop a seamless local bus transit system that improves mobility and serves community needs including special transit for seniors and the disabled (paratransit services). This strategy includes transit capital investments.
Strategy 2: Fully fund and ensure the accelerated completion of the Highway 101 Carpool Lane Gap Closure Project through San Rafael. This strategy is a capital improvement project that is effectively completed.
Strategy 3: Maintain, improve and manage Marin County’s local transportation infrastructure, including roads, bikeways, sidewalks, and pathways. This category includes capital improvements for local and regional streets, roads and paths.
Strategy 4: Reduce school-related congestion and provide safer access to schools. This category includes capital projects related to safe routes and safe pathways to schools.
The Strategic Plan includes proposed allocations for each strategy through FY 2024/25. Within this plan of revenues and expenditures, key capital projects between 2014 and 2022 have been identified and are summarized in Table 10.
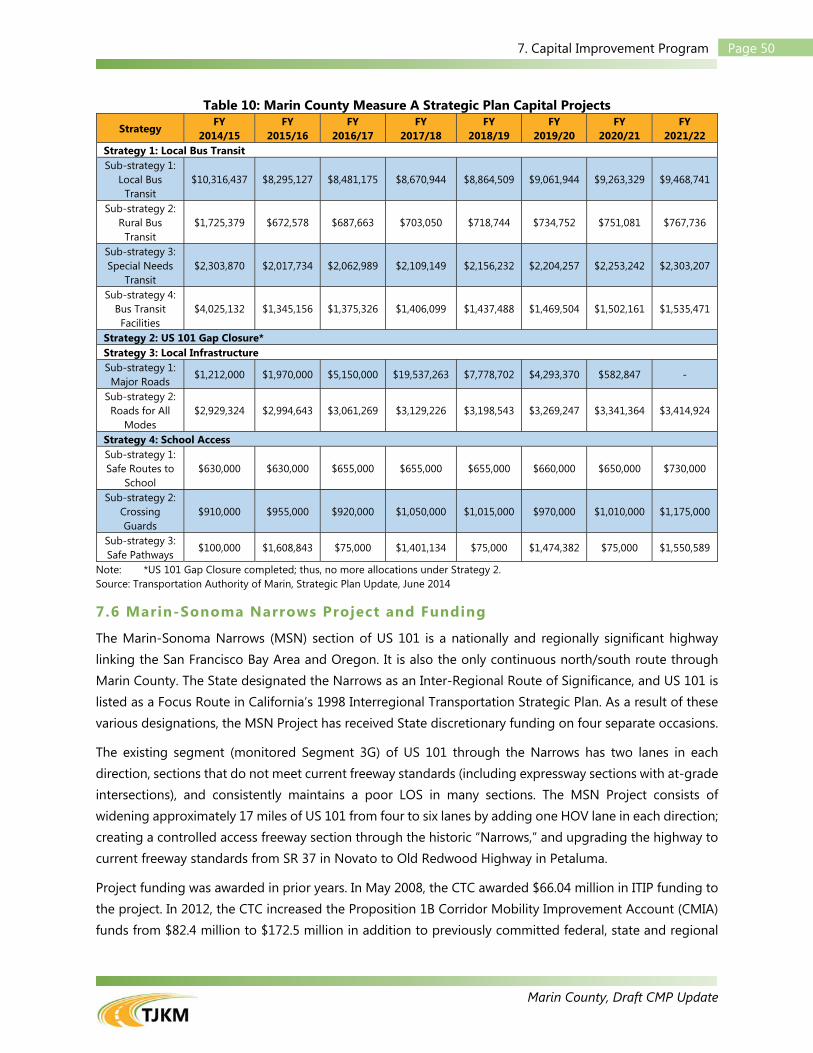
Marin County, Draft CMP Update
Page 507. Capital Improvement Program
Table 10: Marin County Measure A Strategic Plan Capital Projects
Strategy FY
2014/15 FY
2015/16 FY
2016/17 FY
2017/18 FY
2018/19 FY
2019/20 FY
2020/21 FY
2021/22 Strategy 1: Local Bus Transit Sub-strategy 1:
Local Bus Transit
$10,316,437 $8,295,127 $8,481,175 $8,670,944 $8,864,509 $9,061,944 $9,263,329 $9,468,741
Sub-strategy 2: Rural Bus
Transit $1,725,379 $672,578 $687,663 $703,050 $718,744 $734,752 $751,081 $767,736
Sub-strategy 3: Special Needs
Transit $2,303,870 $2,017,734 $2,062,989 $2,109,149 $2,156,232 $2,204,257 $2,253,242 $2,303,207
Sub-strategy 4: Bus Transit Facilities
$4,025,132 $1,345,156 $1,375,326 $1,406,099 $1,437,488 $1,469,504 $1,502,161 $1,535,471
Strategy 2: US 101 Gap Closure* Strategy 3: Local Infrastructure Sub-strategy 1:
Major Roads $1,212,000 $1,970,000 $5,150,000 $19,537,263 $7,778,702 $4,293,370 $582,847 -
Sub-strategy 2: Roads for All
Modes $2,929,324 $2,994,643 $3,061,269 $3,129,226 $3,198,543 $3,269,247 $3,341,364 $3,414,924
Strategy 4: School Access Sub-strategy 1: Safe Routes to
School $630,000 $630,000 $655,000 $655,000 $655,000 $660,000 $650,000 $730,000
Sub-strategy 2: Crossing Guards
$910,000 $955,000 $920,000 $1,050,000 $1,015,000 $970,000 $1,010,000 $1,175,000
Sub-strategy 3: Safe Pathways
$100,000 $1,608,843 $75,000 $1,401,134 $75,000 $1,474,382 $75,000 $1,550,589
Note: *US 101 Gap Closure completed; thus, no more allocations under Strategy 2. Source: Transportation Authority of Marin, Strategic Plan Update, June 2014
7.6 Marin-Sonoma Narrows Project and Funding
The Marin-Sonoma Narrows (MSN) section of US 101 is a nationally and regionally significant highway linking the San Francisco Bay Area and Oregon. It is also the only continuous north/south route through Marin County. The State designated the Narrows as an Inter-Regional Route of Significance, and US 101 is listed as a Focus Route in California’s 1998 Interregional Transportation Strategic Plan. As a result of these various designations, the MSN Project has received State discretionary funding on four separate occasions.
The existing segment (monitored Segment 3G) of US 101 through the Narrows has two lanes in each direction, sections that do not meet current freeway standards (including expressway sections with at-grade intersections), and consistently maintains a poor LOS in many sections. The MSN Project consists of widening approximately 17 miles of US 101 from four to six lanes by adding one HOV lane in each direction; creating a controlled access freeway section through the historic “Narrows,” and upgrading the highway to current freeway standards from SR 37 in Novato to Old Redwood Highway in Petaluma.
Project funding was awarded in prior years. In May 2008, the CTC awarded $66.04 million in ITIP funding to the project. In 2012, the CTC increased the Proposition 1B Corridor Mobility Improvement Account (CMIA) funds from $82.4 million to $172.5 million in addition to previously committed federal, state and regional
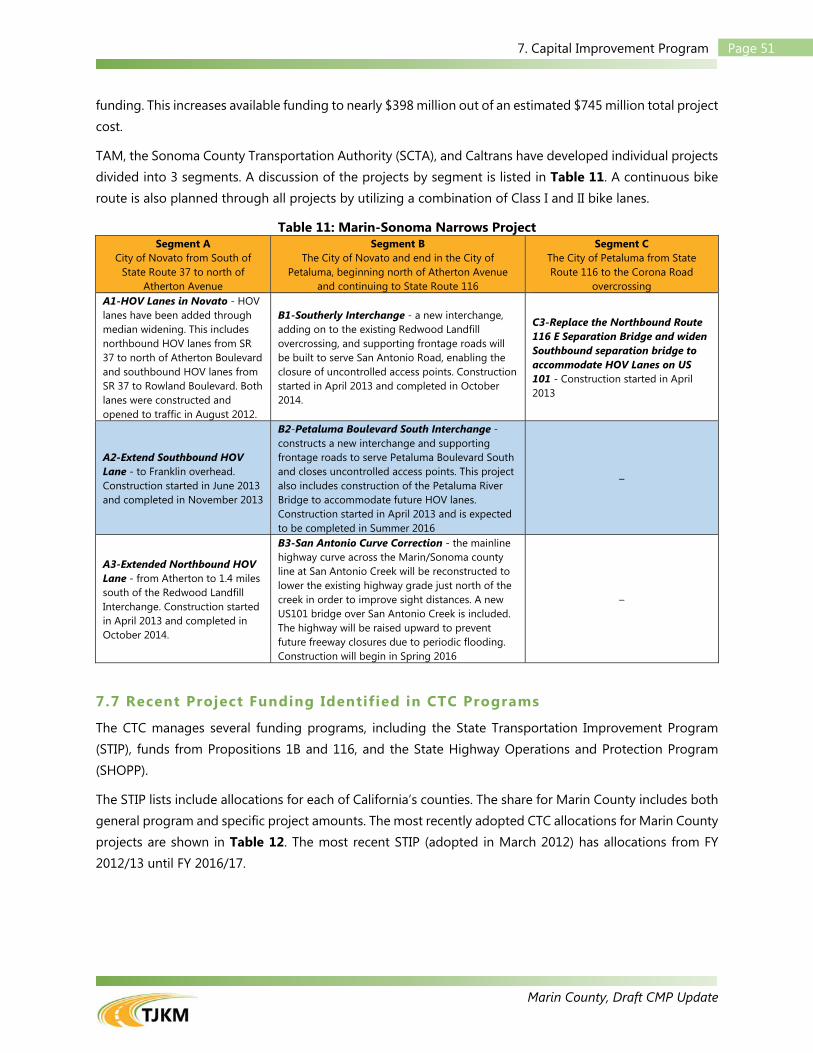
Marin County, Draft CMP Update
Page 517. Capital Improvement Program
funding. This increases available funding to nearly $398 million out of an estimated $745 million total project cost.
TAM, the Sonoma County Transportation Authority (SCTA), and Caltrans have developed individual projects divided into 3 segments. A discussion of the projects by segment is listed in Table 11. A continuous bike route is also planned through all projects by utilizing a combination of Class I and II bike lanes.
Table 11: Marin-Sonoma Narrows Project Segment A
City of Novato from South of State Route 37 to north of
Atherton Avenue
Segment B The City of Novato and end in the City of
Petaluma, beginning north of Atherton Avenue and continuing to State Route 116
Segment C The City of Petaluma from State Route 116 to the Corona Road
overcrossing A1-HOV Lanes in Novato - HOV lanes have been added through median widening. This includes northbound HOV lanes from SR 37 to north of Atherton Boulevard and southbound HOV lanes from SR 37 to Rowland Boulevard. Both lanes were constructed and opened to traffic in August 2012.
B1-Southerly Interchange - a new interchange, adding on to the existing Redwood Landfill overcrossing, and supporting frontage roads will be built to serve San Antonio Road, enabling the closure of uncontrolled access points. Construction started in April 2013 and completed in October 2014.
C3-Replace the Northbound Route 116 E Separation Bridge and widen Southbound separation bridge to accommodate HOV Lanes on US 101 - Construction started in April 2013
A2-Extend Southbound HOV Lane - to Franklin overhead. Construction started in June 2013 and completed in November 2013
B2-Petaluma Boulevard South Interchange - constructs a new interchange and supporting frontage roads to serve Petaluma Boulevard South and closes uncontrolled access points. This project also includes construction of the Petaluma River Bridge to accommodate future HOV lanes. Construction started in April 2013 and is expected to be completed in Summer 2016
–
A3-Extended Northbound HOV Lane - from Atherton to 1.4 miles south of the Redwood Landfill Interchange. Construction started in April 2013 and completed in October 2014.
B3-San Antonio Curve Correction - the mainline highway curve across the Marin/Sonoma county line at San Antonio Creek will be reconstructed to lower the existing highway grade just north of the creek in order to improve sight distances. A new US101 bridge over San Antonio Creek is included. The highway will be raised upward to prevent future freeway closures due to periodic flooding. Construction will begin in Spring 2016
–
7.7 Recent Project Funding Identified in CTC Programs
The CTC manages several funding programs, including the State Transportation Improvement Program (STIP), funds from Propositions 1B and 116, and the State Highway Operations and Protection Program (SHOPP).
The STIP lists include allocations for each of California’s counties. The share for Marin County includes both general program and specific project amounts. The most recently adopted CTC allocations for Marin County projects are shown in Table 12. The most recent STIP (adopted in March 2012) has allocations from FY 2012/13 until FY 2016/17.
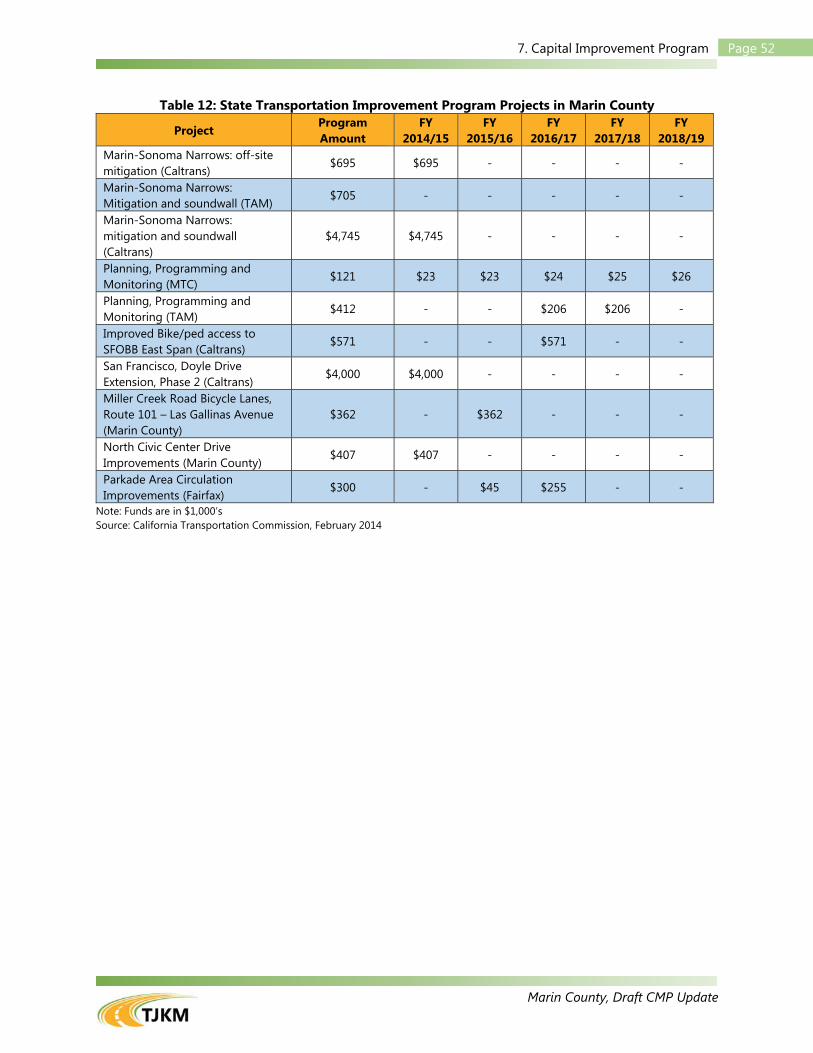
Marin County, Draft CMP Update
Page 527. Capital Improvement Program
Table 12: State Transportation Improvement Program Projects in Marin County
Project Program Amount
FY 2014/15
FY 2015/16
FY 2016/17
FY 2017/18
FY 2018/19
Marin-Sonoma Narrows: off-site mitigation (Caltrans)
$695 $695 - - - -
Marin-Sonoma Narrows: Mitigation and soundwall (TAM)
$705 - - - - -
Marin-Sonoma Narrows: mitigation and soundwall (Caltrans)
$4,745 $4,745 - - - -
Planning, Programming and Monitoring (MTC)
$121 $23 $23 $24 $25 $26
Planning, Programming and Monitoring (TAM)
$412 - - $206 $206 -
Improved Bike/ped access to SFOBB East Span (Caltrans)
$571 - - $571 - -
San Francisco, Doyle Drive Extension, Phase 2 (Caltrans)
$4,000 $4,000 - - - -
Miller Creek Road Bicycle Lanes, Route 101 – Las Gallinas Avenue (Marin County)
$362 - $362 - - -
North Civic Center Drive Improvements (Marin County)
$407 $407 - - - -
Parkade Area Circulation Improvements (Fairfax)
$300 - $45 $255 - -
Note: Funds are in $1,000’s Source: California Transportation Commission, February 2014
Marin County, Draft CMP Update
Page 537. Capital Improvement Program
Marin County originally received funds through the adoption of Proposition 1B in 2006. This proposition created the CMIA. In the original 2007 adopted program, CMIA funds were key funding sources to help complete three major projects in Marin County:
The widening of westbound I-580 westbound to northbound US 101 connector in San Rafael (completed in 2010). The completion eased congestion for traffic traveling to and from the East Bay via the Richmond-San Rafael Bridge.
The construction of HOV lanes within Novato (part of the MSN project).
The construction of interchanges and partial HOV lanes between Novato and Petaluma (part of the MSN project) was scheduled to receive CMIA funding in 2012
The SHOPP lists 18 projects in Marin County as part of the most recent project list developed in 2014. The project list is shown in Table 13. The projects primarily consist of roadway safety improvements and projects addressing storm damage, including culvert replacement, drainage system upgrades, embankment and slope reconstruction, retaining wall construction, and bridge railing replacement.
There are 18 SHOPP projects in Marin County as of March 2014.
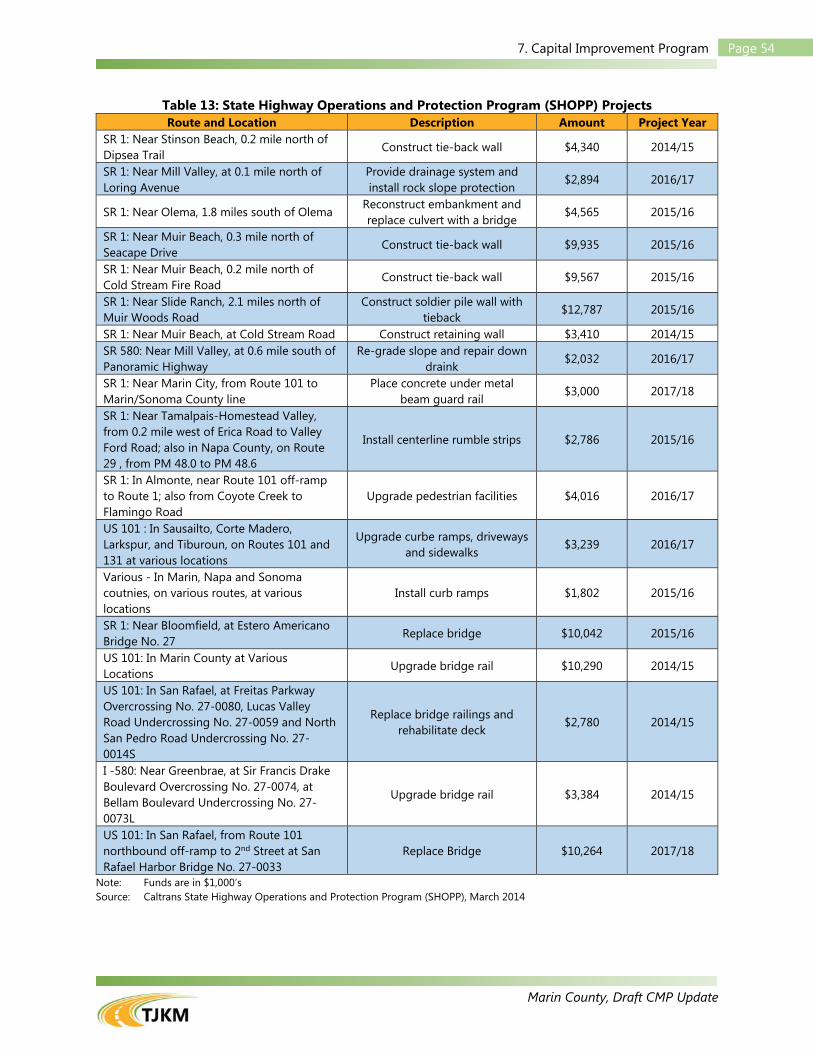
Marin County, Draft CMP Update
Page 547. Capital Improvement Program
Table 13: State Highway Operations and Protection Program (SHOPP) Projects Route and Location Description Amount Project Year
SR 1: Near Stinson Beach, 0.2 mile north of Dipsea Trail
Construct tie-back wall $4,340 2014/15
SR 1: Near Mill Valley, at 0.1 mile north of Loring Avenue
Provide drainage system and install rock slope protection
$2,894 2016/17
SR 1: Near Olema, 1.8 miles south of Olema Reconstruct embankment and replace culvert with a bridge
$4,565 2015/16
SR 1: Near Muir Beach, 0.3 mile north of Seacape Drive
Construct tie-back wall $9,935 2015/16
SR 1: Near Muir Beach, 0.2 mile north of Cold Stream Fire Road
Construct tie-back wall $9,567 2015/16
SR 1: Near Slide Ranch, 2.1 miles north of Muir Woods Road
Construct soldier pile wall with tieback
$12,787 2015/16
SR 1: Near Muir Beach, at Cold Stream Road Construct retaining wall $3,410 2014/15 SR 580: Near Mill Valley, at 0.6 mile south of Panoramic Highway
Re-grade slope and repair down draink
$2,032 2016/17
SR 1: Near Marin City, from Route 101 to Marin/Sonoma County line
Place concrete under metal beam guard rail
$3,000 2017/18
SR 1: Near Tamalpais-Homestead Valley, from 0.2 mile west of Erica Road to Valley Ford Road; also in Napa County, on Route 29 , from PM 48.0 to PM 48.6
Install centerline rumble strips $2,786 2015/16
SR 1: In Almonte, near Route 101 off-ramp to Route 1; also from Coyote Creek to Flamingo Road
Upgrade pedestrian facilities $4,016 2016/17
US 101 : In Sausailto, Corte Madero, Larkspur, and Tiburoun, on Routes 101 and 131 at various locations
Upgrade curbe ramps, driveways and sidewalks
$3,239 2016/17
Various - In Marin, Napa and Sonoma coutnies, on various routes, at various locations
Install curb ramps $1,802 2015/16
SR 1: Near Bloomfield, at Estero Americano Bridge No. 27
Replace bridge $10,042 2015/16
US 101: In Marin County at Various Locations
Upgrade bridge rail $10,290 2014/15
US 101: In San Rafael, at Freitas Parkway Overcrossing No. 27-0080, Lucas Valley Road Undercrossing No. 27-0059 and North San Pedro Road Undercrossing No. 27-0014S
Replace bridge railings and rehabilitate deck
$2,780 2014/15
I -580: Near Greenbrae, at Sir Francis Drake Boulevard Overcrossing No. 27-0074, at Bellam Boulevard Undercrossing No. 27-0073L
Upgrade bridge rail $3,384 2014/15
US 101: In San Rafael, from Route 101 northbound off-ramp to 2nd Street at San Rafael Harbor Bridge No. 27-0033
Replace Bridge $10,264 2017/18
Note: Funds are in $1,000’s Source: Caltrans State Highway Operations and Protection Program (SHOPP), March 2014
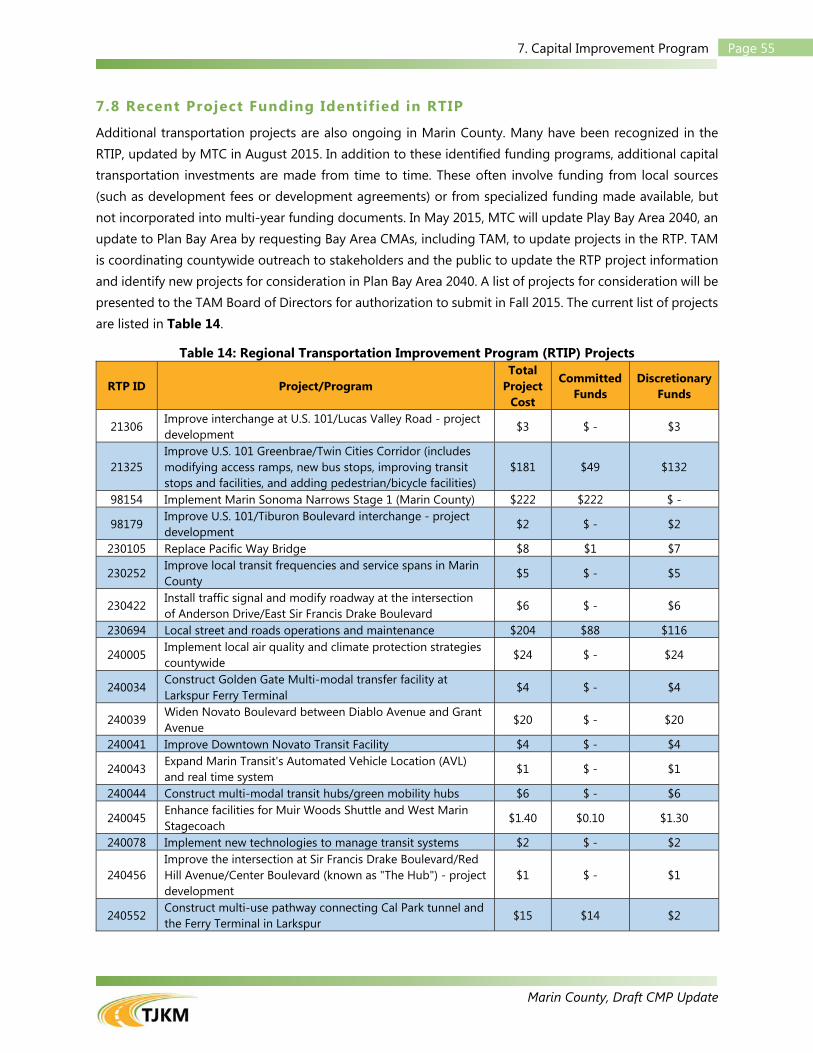
Marin County, Draft CMP Update
Page 557. Capital Improvement Program
7.8 Recent Project Funding Identified in RTIP
Additional transportation projects are also ongoing in Marin County. Many have been recognized in the RTIP, updated by MTC in August 2015. In addition to these identified funding programs, additional capital transportation investments are made from time to time. These often involve funding from local sources (such as development fees or development agreements) or from specialized funding made available, but not incorporated into multi-year funding documents. In May 2015, MTC will update Play Bay Area 2040, an update to Plan Bay Area by requesting Bay Area CMAs, including TAM, to update projects in the RTP. TAM is coordinating countywide outreach to stakeholders and the public to update the RTP project information and identify new projects for consideration in Plan Bay Area 2040. A list of projects for consideration will be presented to the TAM Board of Directors for authorization to submit in Fall 2015. The current list of projects are listed in Table 14.
Table 14: Regional Transportation Improvement Program (RTIP) Projects
RTP ID Project/Program Total
Project Cost
Committed Funds
Discretionary Funds
21306 Improve interchange at U.S. 101/Lucas Valley Road - project development
$3 $ - $3
21325 Improve U.S. 101 Greenbrae/Twin Cities Corridor (includes modifying access ramps, new bus stops, improving transit stops and facilities, and adding pedestrian/bicycle facilities)
$181 $49 $132
98154 Implement Marin Sonoma Narrows Stage 1 (Marin County) $222 $222 $ -
98179 Improve U.S. 101/Tiburon Boulevard interchange - project development
$2 $ - $2
230105 Replace Pacific Way Bridge $8 $1 $7
230252 Improve local transit frequencies and service spans in Marin County
$5 $ - $5
230422 Install traffic signal and modify roadway at the intersection of Anderson Drive/East Sir Francis Drake Boulevard
$6 $ - $6
230694 Local street and roads operations and maintenance $204 $88 $116
240005 Implement local air quality and climate protection strategies countywide
$24 $ - $24
240034 Construct Golden Gate Multi-modal transfer facility at Larkspur Ferry Terminal
$4 $ - $4
240039 Widen Novato Boulevard between Diablo Avenue and Grant Avenue
$20 $ - $20
240041 Improve Downtown Novato Transit Facility $4 $ - $4
240043 Expand Marin Transit's Automated Vehicle Location (AVL) and real time system
$1 $ - $1
240044 Construct multi-modal transit hubs/green mobility hubs $6 $ - $6
240045 Enhance facilities for Muir Woods Shuttle and West Marin Stagecoach
$1.40 $0.10 $1.30
240078 Implement new technologies to manage transit systems $2 $ - $2
240456 Improve the intersection at Sir Francis Drake Boulevard/Red Hill Avenue/Center Boulevard (known as "The Hub") - project development
$1 $ - $1
240552 Construct multi-use pathway connecting Cal Park tunnel and the Ferry Terminal in Larkspur
$15 $14 $2
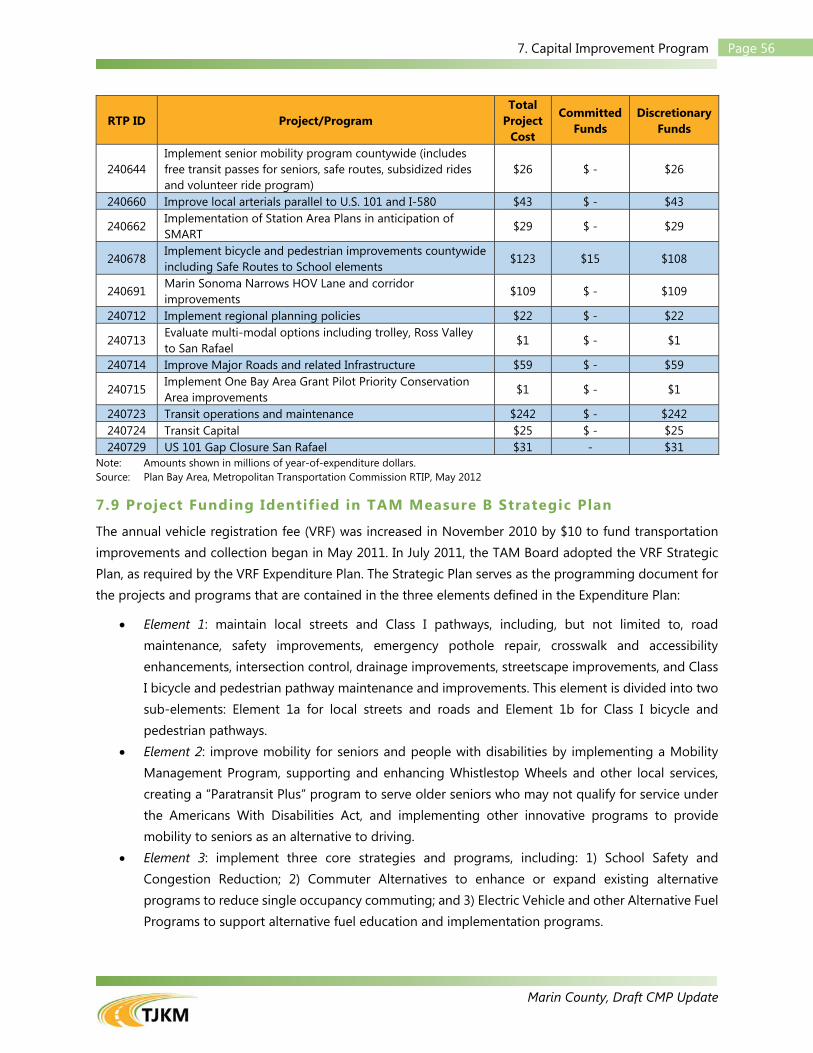
Marin County, Draft CMP Update
Page 567. Capital Improvement Program
RTP ID Project/Program Total
Project Cost
Committed Funds
Discretionary Funds
240644 Implement senior mobility program countywide (includes free transit passes for seniors, safe routes, subsidized rides and volunteer ride program)
$26 $ - $26
240660 Improve local arterials parallel to U.S. 101 and I-580 $43 $ - $43
240662 Implementation of Station Area Plans in anticipation of SMART
$29 $ - $29
240678 Implement bicycle and pedestrian improvements countywide including Safe Routes to School elements
$123 $15 $108
240691 Marin Sonoma Narrows HOV Lane and corridor improvements
$109 $ - $109
240712 Implement regional planning policies $22 $ - $22
240713 Evaluate multi-modal options including trolley, Ross Valley to San Rafael
$1 $ - $1
240714 Improve Major Roads and related Infrastructure $59 $ - $59
240715 Implement One Bay Area Grant Pilot Priority Conservation Area improvements
$1 $ - $1
240723 Transit operations and maintenance $242 $ - $242 240724 Transit Capital $25 $ - $25 240729 US 101 Gap Closure San Rafael $31 - $31
Note: Amounts shown in millions of year-of-expenditure dollars. Source: Plan Bay Area, Metropolitan Transportation Commission RTIP, May 2012
7.9 Project Funding Identified in TAM Measure B Strategic Plan
The annual vehicle registration fee (VRF) was increased in November 2010 by $10 to fund transportation improvements and collection began in May 2011. In July 2011, the TAM Board adopted the VRF Strategic Plan, as required by the VRF Expenditure Plan. The Strategic Plan serves as the programming document for the projects and programs that are contained in the three elements defined in the Expenditure Plan:
Element 1: maintain local streets and Class I pathways, including, but not limited to, road maintenance, safety improvements, emergency pothole repair, crosswalk and accessibility enhancements, intersection control, drainage improvements, streetscape improvements, and Class I bicycle and pedestrian pathway maintenance and improvements. This element is divided into two sub-elements: Element 1a for local streets and roads and Element 1b for Class I bicycle and pedestrian pathways.
Element 2: improve mobility for seniors and people with disabilities by implementing a Mobility Management Program, supporting and enhancing Whistlestop Wheels and other local services, creating a “Paratransit Plus” program to serve older seniors who may not qualify for service under the Americans With Disabilities Act, and implementing other innovative programs to provide mobility to seniors as an alternative to driving.
Element 3: implement three core strategies and programs, including: 1) School Safety and Congestion Reduction; 2) Commuter Alternatives to enhance or expand existing alternative programs to reduce single occupancy commuting; and 3) Electric Vehicle and other Alternative Fuel Programs to support alternative fuel education and implementation programs.
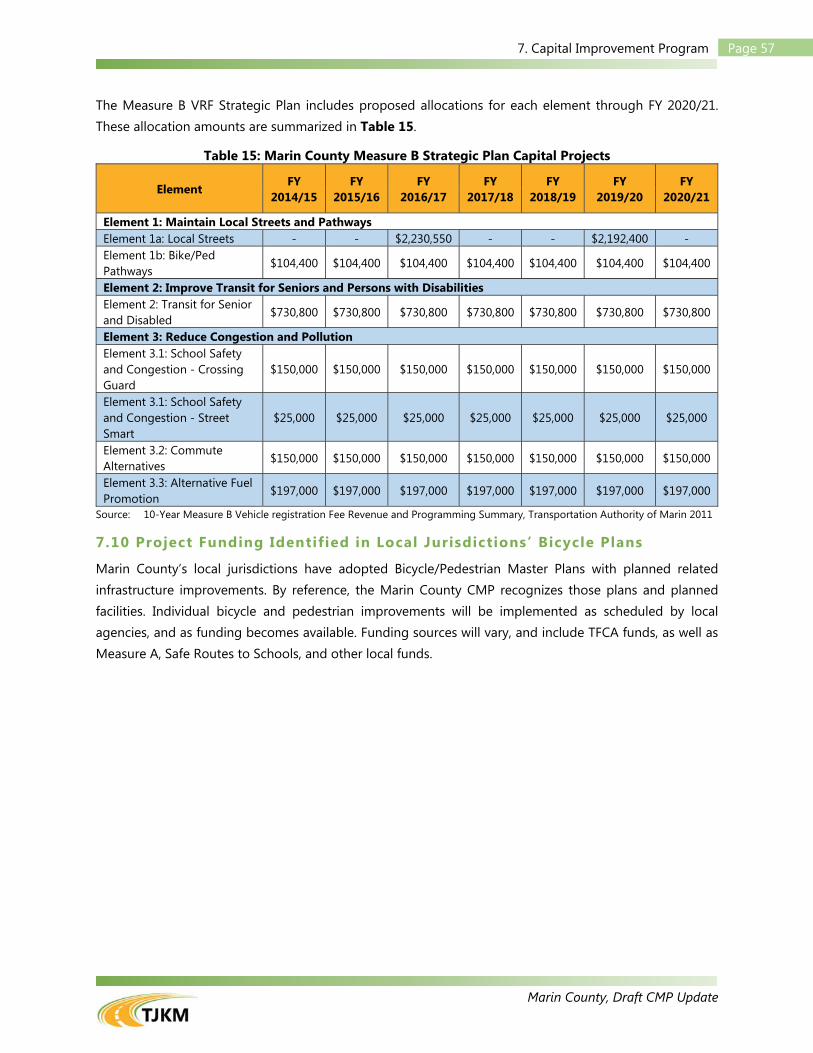
Marin County, Draft CMP Update
Page 577. Capital Improvement Program
The Measure B VRF Strategic Plan includes proposed allocations for each element through FY 2020/21. These allocation amounts are summarized in Table 15.
Table 15: Marin County Measure B Strategic Plan Capital Projects
Element FY
2014/15 FY
2015/16 FY
2016/17 FY
2017/18 FY
2018/19 FY
2019/20 FY
2020/21
Element 1: Maintain Local Streets and Pathways Element 1a: Local Streets - - $2,230,550 - - $2,192,400 - Element 1b: Bike/Ped Pathways
$104,400 $104,400 $104,400 $104,400 $104,400 $104,400 $104,400
Element 2: Improve Transit for Seniors and Persons with Disabilities Element 2: Transit for Senior and Disabled
$730,800 $730,800 $730,800 $730,800 $730,800 $730,800 $730,800
Element 3: Reduce Congestion and Pollution Element 3.1: School Safety and Congestion - Crossing Guard
$150,000 $150,000 $150,000 $150,000 $150,000 $150,000 $150,000
Element 3.1: School Safety and Congestion - Street Smart
$25,000 $25,000 $25,000 $25,000 $25,000 $25,000 $25,000
Element 3.2: Commute Alternatives
$150,000 $150,000 $150,000 $150,000 $150,000 $150,000 $150,000
Element 3.3: Alternative Fuel Promotion
$197,000 $197,000 $197,000 $197,000 $197,000 $197,000 $197,000
Source: 10-Year Measure B Vehicle registration Fee Revenue and Programming Summary, Transportation Authority of Marin 2011
7.10 Project Funding Identified in Local Jurisdictions’ Bicycle Plans
Marin County’s local jurisdictions have adopted Bicycle/Pedestrian Master Plans with planned related infrastructure improvements. By reference, the Marin County CMP recognizes those plans and planned facilities. Individual bicycle and pedestrian improvements will be implemented as scheduled by local agencies, and as funding becomes available. Funding sources will vary, and include TFCA funds, as well as Measure A, Safe Routes to Schools, and other local funds.
Marin County, Draft CMP Update
Page 588. Deficiency Plan Procedures
8. DEFICIENCY PLAN PROCEDURES
8.1 Purpose and Intent of Legislation
California Government Code Sections 65089.3, 65089.4, and 65089.5 govern the conformance process. These sections require that TAM determine every two years whether Marin County, including cities and towns within the county, conform to the requirements of the CMP based on information obtained through monitoring.
If TAM believes that a local government is not conforming to CMP requirements, it must then hold a noticed public hearing to determine areas of nonconformance. If after the public hearing TAM still believes that the local government is not conforming to CMP requirements, it must provide written notice to the local government citing the specific instances of nonconformance. The local government then has 90 days to remedy the instances of nonconformance. If after 90 days the local government has not remedied the nonconformance instances, TAM will make a finding of nonconformance and notify the State Controller to withhold certain gas tax subvention funds.
8.2 Local Government Conformance Requirements
CMP legislation has established the following requirements of a conformance determination for local jurisdictions:
Maintain the highway LOS standards outlined in the CMP (Chapter 2). Participate in adoption and implementation of a deficiency plan when highway and roadway LOS
standards are not maintained on portions of the designated system. Participate in a program to analyze the impact of land use decisions, including the estimate of the
costs associated with mitigating these impacts. Specific requirements and recommendations are outlined in the Land Use Analysis Program element of the CMP (Chapter 5).
If either Marin County, or cities and towns within the county, do not meet each of these CMP requirements when TAM is scheduled to make its conformance determination for each jurisdiction (“Jurisdiction” referring to the local government that has the greatest segment distance within its boundaries per CMP definition), the jurisdiction is found in nonconformance. In this case, the jurisdiction may risk losing an increment in its gasoline tax subvention funds and not having projects programmed in the RTIP.
8.3 Local Government Monitoring Requirements
TAM must take active steps to ensure that Marin County and each city and town in Marin County at least biennially conform to each requirement of the CMP legislation. Monitoring must be done for several reasons:
Congestion is projected to increase, which will waste valuable time and add to the transportation costs of goods and services.
Congestion causes energy to be wasted and contributes to worsening of air quality. Coordinated growth management and transportation planning is essential to minimizing both
travel time and costs.
Marin County, Draft CMP Update
Page 598. Deficiency Plan Procedures
The CMP legislation specifies that jurisdictions that do not demonstrate conformance to the requirements are to lose street and highway subvention money. Many jurisdictions use this money for maintenance of existing streets and roads so as not to neglect their transportation infrastructure.
Outlined below are the major actions that may be required by each jurisdiction to ensure CMP conformance. TAM currently performs all required LOS monitoring.
Maintaining Highway Level of Service Standards
TAM biennially monitors level of service on segments of CMP designated routes within Marin County and its jurisdictions. Where a segment falls within two or more jurisdictions, the jurisdiction responsible for the segment is the jurisdiction with the greatest segment mileage. The monitoring program occurs during the AM (7:00 AM to 9:00 AM) and PM (4:30 PM to 6:30 PM) peak periods. The traffic counts also should be taken in the spring (April or May), with counts at fall periods acceptable when needed (September or October). Consistent with this, the 2015 CMP update includes counts from October and November 2014. The LOS analysis based on these counts is consistent with the LOS methods outlined in the highway LOS standards (Chapter 2).
Transportation improvements or changed economic conditions may result in changes in LOS over consecutive monitoring cycles. If LOS is determined to be A, B, or C for any year that is monitored, the monitoring frequency could be reduced to every other CMP (four years), until such time as the segment is found to operate at LOS D or worse. Any segment determined to operate at LOS D should then be monitored for each CMP (two-year intervals). Grandfathered facilities that currently operate at LOS F do not have to be improved, but nevertheless their conditions should be monitored with each CMP.
Participation in Required Deficiency Plans
Where roadway facilities experience congestion worse than the roadway LOS standards established in Chapter 2, the congestion should be monitored annually until the congestion eases. If the LOS standard is exceeded for two CMP cycles, the roadway is then considered potentially deficient. A determination to see whether a Deficiency Plan is required once the exempted trips allowed in state legislation are assumed not to exist.
All CMP segments conform to County LOS standards, and no deficiency plans are required.
Marin County, Draft CMP Update
Page 608. Deficiency Plan Procedures
If TAM determines a segment that has not been grandfathered does not meet the adopted LOS standards (D for principal arterial roadways; E for freeways), then that jurisdiction must:
Immediately propose and designate funds for measures that improve the LOS to meet or be better than the adopted LOS standard which TAM would then incorporate into the CIP, or
Create a “deficiency plan” in accordance with CMP requirements. A deficiency plan requires the local government to:
1. Analyze the cause of the deficiency and define improvements to the facility that maintain the LOS standard, or
2. Define improvements that have a measurable improvement on the transportation system’s LOS or substantial air quality benefit and determine the cost of the improvements.
TAM has published guidelines governing specific issues related to Deficiency Plan preparation on its website. For all deficient facilities (including those that are grandfathered), TAM and its partnering agencies should develop an “operational plan” to minimize congestion on these facilities. Operational plans are envisioned as a description of capital projects, multi-modal programs, and/or roadway management techniques that a local jurisdiction intends to advocate for implementation by that jurisdiction or others (such as Caltrans for State facilities).
All incorporated cities and towns in Marin County, along with unincorporated County areas, are in conformance at this time. Therefore, no deficiency plans will be required by this CMP.
Maintaining Program to Analyze Impacts from Land Use Decisions
Land use impact analysis monitoring requirements are detailed in the Land Use Analysis Program (Chapter 5). There are two general requirements:
1. For any general plan update or amendment or major development proposal that would result in a net increase of 100 or more PM peak hour vehicle trips, local governments are to forward information on the application to TAM and run the county model to obtain transportation impact information related to the amendment/development. The jurisdiction is responsible for conducting the model run if requested by TAM, which could be performed: (1) by the jurisdiction, (2) by a consultant hired by the jurisdiction, or (3) by TAM (only if staff is available to do the work). The jurisdiction requesting the model run reimburses the County for the cost of the model run. Model results are useful to cities and the County as part of their current review and approval processes, especially for purposes of defining the necessary mitigation measures.
2. Each jurisdiction is to be responsible for preparing and transmitting land use data to TAM for use in the MTM, as well as tracking land use buildout through issuance of planning and building permits. This requirement ties in with the existing property development (“PROPDEV”) database that local governments are already using, as well as the County Community Development Agency’s Countywide Land Use Database. TAM biennially runs the MTM in order to update future year LOS information in the CMP. Local governments can find this information useful when updating the land use and circulation elements of their general plans.
Marin County, Draft CMP Update
Page 619. Study References
9. STUDY REFERENCES
2014 Transportation System Monitoring Report for Transportation Authority of Marin, TJKM (Final, June 2013).
Congestion Management Program 2013 Update for Transportation Authority of Marin, TJKM, 2013.


Corporate Office4305 Hacienda Drive, Suite 550, Pleasanton, CA 94588Phone: (925) 463-0611www.TJKM.com
Vision That Moves Your Community
Related Documents