FOOD SECURITY AND SRI: PRADAN’s Experience in Eastern India 3rd National Symposium on SRI, Coimbatore, Dec. 01-03, 2008

0879 Food Security and SRI: PRADAN’s Experience in Eastern India
Jul 12, 2015
Welcome message from author
This document is posted to help you gain knowledge. Please leave a comment to let me know what you think about it! Share it to your friends and learn new things together.
Transcript
FOOD SECURITY AND SRI:PRADAN’s Experience in Eastern India
3rd National Symposium on SRI, Coimbatore, Dec. 01-03, 2008

Food Security Scenario at the National Level
• Per capita land availability is going down
• Number of marginal holders is increasing
• Food availability has been going down since 1991
– Availability of pulses has gone down significantly
• Average productivity of rice remains less than 2.5 tons/ ha
on 75% of the land under rice
• A smallholder household with five members needs about 2 tons of
food grain (cereals and pulses) + some vegetables + cash to buy other
necessities/ services; but
– Most have only about 0.5 ha of land suitable for rice
– Given average productivity, most smallholders are food insecure
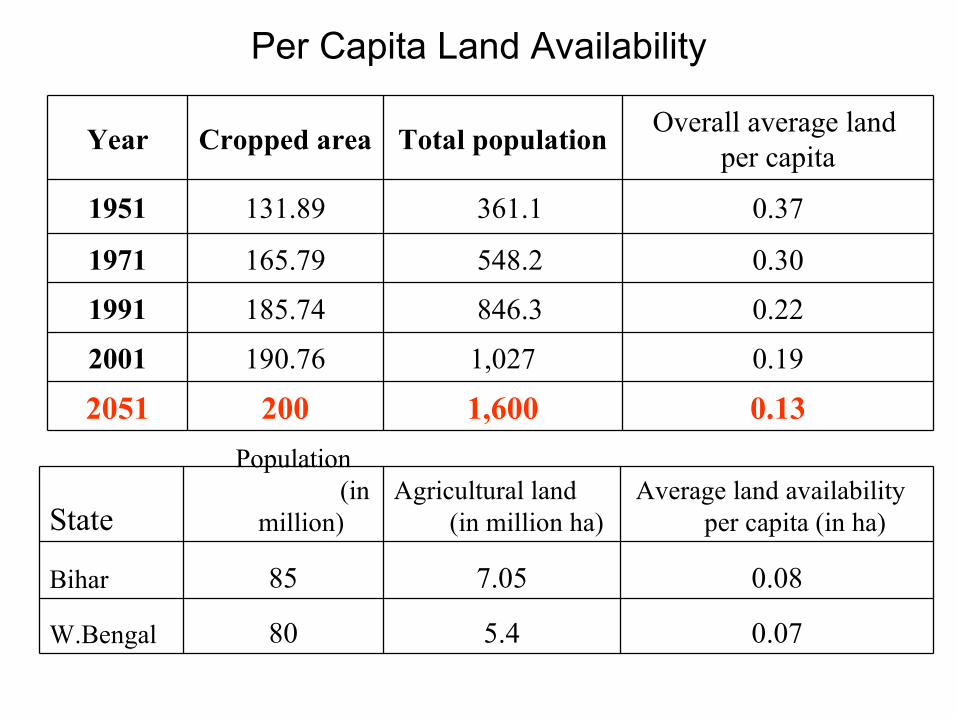
Per Capita Land Availability
State
Population (in
million)Agricultural land
(in million ha)Average land availability
per capita (in ha)
Bihar 85 7.05 0.08
W.Bengal 80 5.4 0.07
Year Cropped area Total populationOverall average land
per capita
1951 131.89 361.1 0.37
1971 165.79 548.2 0.30
1991 185.74 846.3 0.22
2001 190.76 1,027 0.19
2051 200 1,600 0.13

Land Holding Pattern (Number)
11.09%
7.29%
2.71%
0.31%
78.61%
Marginal(0-1Ha.)
Small (1-2 Ha.)
Semi-Medium (2-4 Ha.)
Medium (4-10 Ha.)
Large (10-above Ha.)
Smallholders distribution in Bihar

Year Rice WheatOther
Cereals Cereal Pulses
Pulse available as
% food grain Total Food
Grains
1951 158.9 65.7 109.6 334.2 60.7 15% 394.9
1991 221.7 166.8 80 468.5 41.6 8% 510.1
2000 206.4 160.1 60.1 426.8 31.9 7% 458.6
Per capita food grain availability
(per day, in grams):
Food grain availability is decreasing,
affecting food security of the poorer
(Source: http://agricoop.nic.in/statatglance2003.htm)
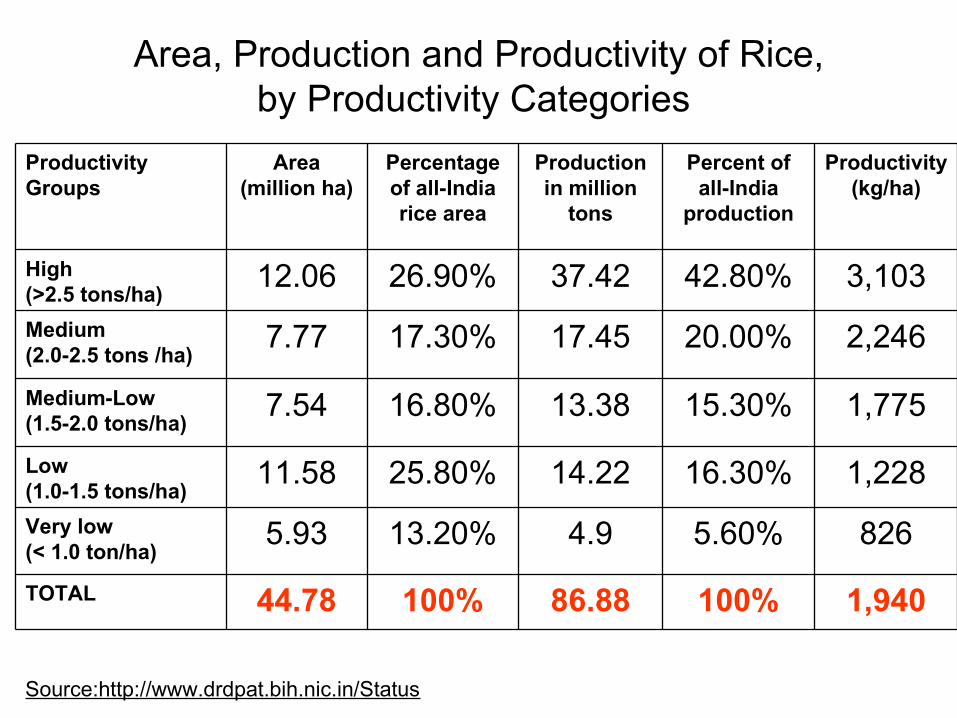
Area, Production and Productivity of Rice,by Productivity Categories
Productivity Groups
Area (million ha)
Percentage of all-India rice area
Production in million
tons
Percent of all-India
production
Productivity (kg/ha)
High (>2.5 tons/ha)
12.06 26.90% 37.42 42.80% 3,103
Medium (2.0-2.5 tons /ha)
7.77 17.30% 17.45 20.00% 2,246
Medium-Low (1.5-2.0 tons/ha)
7.54 16.80% 13.38 15.30% 1,775
Low (1.0-1.5 tons/ha)
11.58 25.80% 14.22 16.30% 1,228
Very low (< 1.0 ton/ha)
5.93 13.20% 4.9 5.60% 826
TOTAL 44.78 100% 86.88 100% 1,940
Source:http://www.drdpat.bih.nic.in/Status

Estimation of raw rice productivity per capita available land considering different yield potential
Note: Table derived by dividing available agricultural land by population
This shows how relevant SRI could be to address the issue of food security for the next generation in areas with both high & low population density
Areas Yield of
raw grain / ha
Yield of processed grain / ha
Per capita land
available
Food grain / per capita
land available
Per capita annual food
grain requirement @
500 gm / day
Lower population density
2,000 1,200 0.2 240
182.5
3,000 1,800 0.2 360
4,000 2,400 0.2 480
Higher population density
4,000 2,400 0.08 192
5,000 3,000 0.08 240
8,000 4,800 0.08 384
10,000 6,000 0.08 480
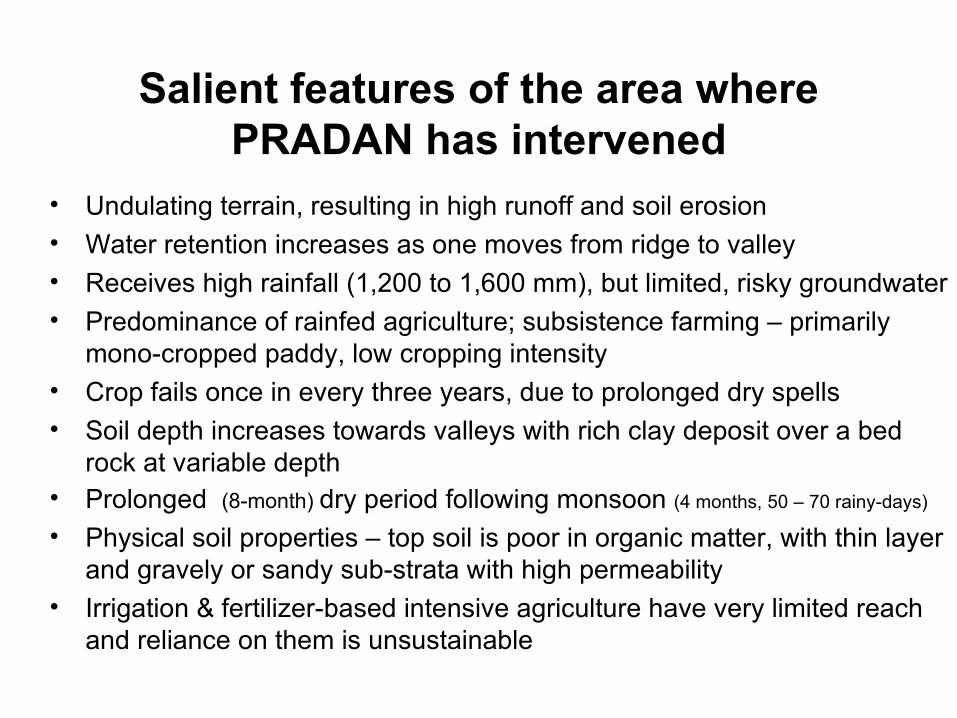
Salient features of the area where PRADAN has intervened
• Undulating terrain, resulting in high runoff and soil erosion• Water retention increases as one moves from ridge to valley• Receives high rainfall (1,200 to 1,600 mm), but limited, risky groundwater• Predominance of rainfed agriculture; subsistence farming – primarily
mono-cropped paddy, low cropping intensity • Crop fails once in every three years, due to prolonged dry spells • Soil depth increases towards valleys with rich clay deposit over a bed
rock at variable depth • Prolonged (8-month) dry period following monsoon (4 months, 50 – 70 rainy-days)
• Physical soil properties – top soil is poor in organic matter, with thin layer and gravely or sandy sub-strata with high permeability
• Irrigation & fertilizer-based intensive agriculture have very limited reach and reliance on them is unsustainable

Noteworthy feature of land owned by a smallholder :
All households have each type of land, although the poorer households may have most of their land in the upper reaches, with very little valley land
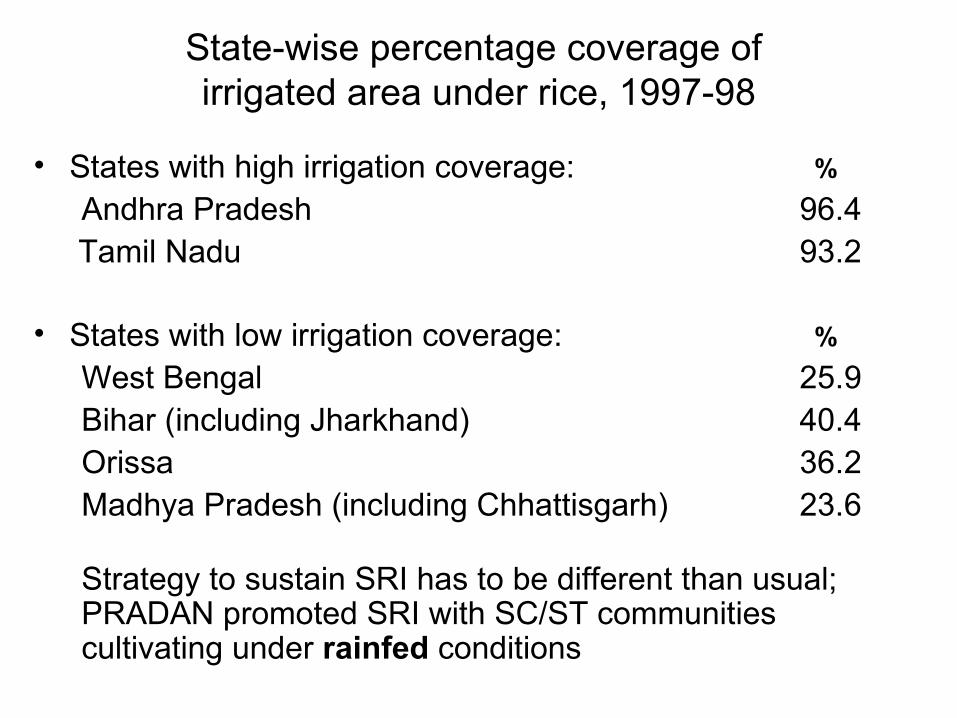
State-wise percentage coverage of irrigated area under rice, 1997-98
• States with high irrigation coverage: %
Andhra Pradesh 96.4 Tamil Nadu 93.2
• States with low irrigation coverage: %
West Bengal 25.9Bihar (including Jharkhand) 40.4Orissa 36.2Madhya Pradesh (including Chhattisgarh) 23.6
Strategy to sustain SRI has to be different than usual; PRADAN promoted SRI with SC/ST communities cultivating under rainfed conditions
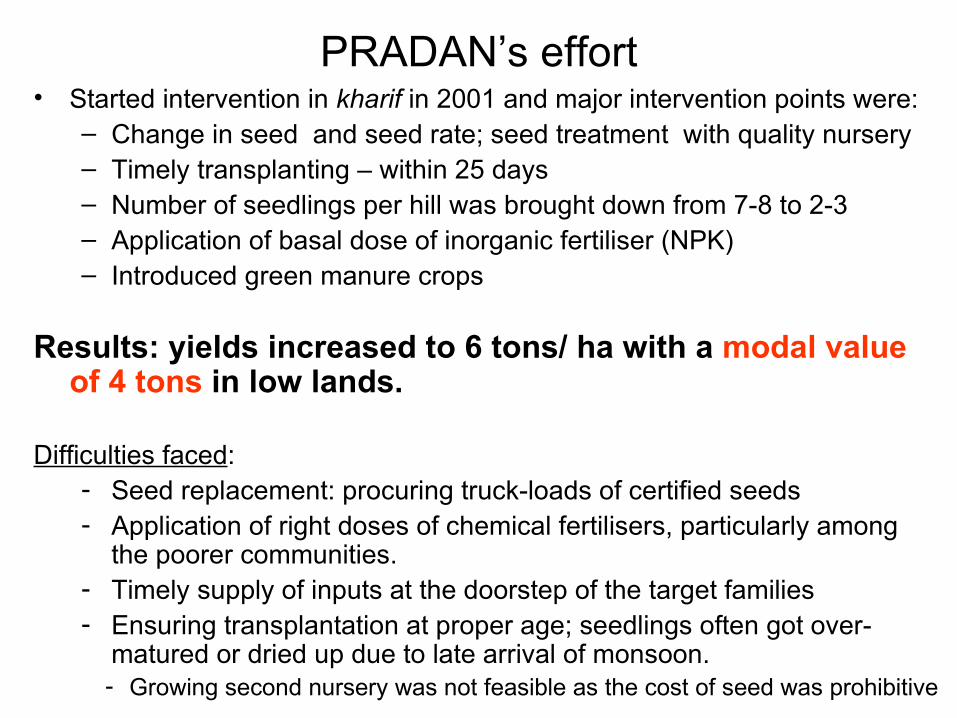
PRADAN’s effort• Started intervention in kharif in 2001 and major intervention points were:
– Change in seed and seed rate; seed treatment with quality nursery– Timely transplanting – within 25 days– Number of seedlings per hill was brought down from 7-8 to 2-3 – Application of basal dose of inorganic fertiliser (NPK) – Introduced green manure crops
Results: yields increased to 6 tons/ ha with a modal value of 4 tons in low lands.
Difficulties faced:- Seed replacement: procuring truck-loads of certified seeds - Application of right doses of chemical fertilisers, particularly among
the poorer communities. - Timely supply of inputs at the doorstep of the target families - Ensuring transplantation at proper age; seedlings often got over-
matured or dried up due to late arrival of monsoon. - Growing second nursery was not feasible as the cost of seed was prohibitive

PRADAN got interested in introducing SRIPrimary reasons were:
– Lower seed rate: Could to motivate farmers to go for additional
new nurseries in case of delayed monsoon – Reduced time in nursery: This might help farmers go for
nurseries as late as the middle of August if monsoon arrived late
– Extra root growth: Exploit soil moisture at low depth in dry spells
– Higher yield: Could help marginal farm-families (with average 0.4 ha of land available for rice) to attain food security
2005 average SRI yields/ha ranged from 3.75 tons/ha in Keonjhar (Orissa) to 7.5 tons/ha in Purulia (West Bengal)
PRADAN promoted SRI first with 4 families in 2003then: 6,200 families on 632 ha in 2006
10,400 families on 1,080 ha in 2007 20,000 families on 2,200 ha in 2008

Constraints experienced in scaling-up SRI• No irrigation facilities, so alternate wetting and drying could not
be practiced – rainfed SRI only
• Prolonged deep-standing water during monsoon season - Most of the roots got damaged by booting-leaf stage
• Some of the farmers who adopted wider spacing (12 inches) experienced low tillering due to poor land condition or dry spells
• Many farmers have gone for single-seedling transplantation with closer spacing, about 6 inches or less
• Many farmers failed to transplant when the nursery was ready (at 12 days old) due to unavailability of rain, and reverted back to traditional methods
• In some fields, because of the nutrient-deficient soil, the prolific vegetative growth got affected during the reproductive phase
• Most farmers do not have sufficient organic manure to replenish the soil adequately
• Some farmers reported reduction in yield after a couple of years

Concerns from the field
• This year’s SRI yield in Purulia will be low in most fields because farmers have modified SRI to an extent that it does not qualify as SRI, and thus may lose its relevance to excite smallholders
• There have been large drop-outs in Barabazar block (Purulia); only 87 farmers reported practicing SRI against 600 last year
• 4,352 families in Gaya practiced SRI this year – 25% lost their crop due to drought and the rest (75%) are struggling to save their crop. However, non-SRI farmers have suffered greater losses than SRI
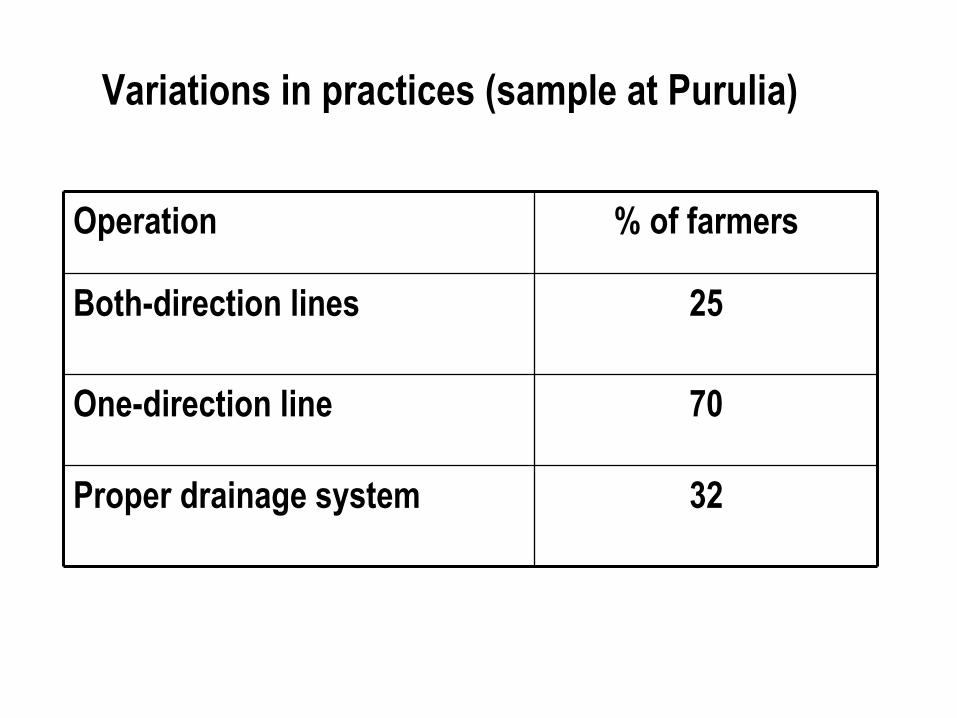
Operation % of farmers
Both-direction lines 25
One-direction line 70
Proper drainage system 32
Variations in practices (sample at Purulia)

Counting 72 tillers/hill, but the field is dry at time of flowering and had no irrigation support
photo removed
Dried SRI field in 2005 in Purulia
Photo removed

Dry weather for long time (Khizasarai, Gaya)
Photo removed

Green manure improves soil status – but difficult to introduce due to dry spells
Photo removed

A small water body to save the crop from dry spells
Photo removed
Excavated soil is used to prepare a well drained raised bed to grow vegetables
Photo removed

Excavated soil is used to prepare a well-drained raised bed to grow vegetables
Photo removed
Rearing fish also add to protein supply to the family
Photo removed

Thank You
Dinabandhu Karmakar, PRADAN
Related Documents