080917 Charla Up.17 Setiembre2008 3
Aug 05, 2015
Welcome message from author
This document is posted to help you gain knowledge. Please leave a comment to let me know what you think about it! Share it to your friends and learn new things together.
Transcript


MERCADOS FINANCIEROS GLOBALES
CRISIS SISTEMICA SU IMPACTO EN LA ECONOMIA
REAL ARGENTINA
• Junio 2007 - Inicio de la crisis.¿Que escenarios se planteaban?
• Setiembre 2008: ¿Qué esta pasando realmente?
¿Porqué es una crisis Sistémica.
¿En que sectores de la economía real Argentina impactará ?
• Conclusiones. Mirando hacia adelante

Junio 2007 - Inicio de la crisis Global
EXISTIAN TRES OPCIONES
1. Achique del negocio financiero y las rentabilidades, ponerse la faja (The Economist).
2. Que la economía global entre en un ciclo recesivo cíclico.
3. Cambio Geopolítico: Que se modifiquen las estrategias de los mercados y se construyan nuevas reglas de juego

¿?¿?¿Y COMO ESTAMOS HOY?¿Y COMO ESTAMOS HOY?
(MEJOR DICHO, ¿AYER?)(MEJOR DICHO, ¿AYER?)

6
Apr Jul Oct Jan Apr Jul1,150
1,200
1,250
1,300
1,350
1,400
1,450
1,500
1,550
U.S.
Year-End'06
US S&P 500 Index
Apr Jul Oct Jan Apr Jul5,000
5,200
5,400
5,600
5,800
6,000
6,200
6,400
6,600
6,800
7,000
U.K.
United Kingdom FTSE 100 Index
Global Equity Markets
Source: Bloomberg, Market Data, Last Observation Aug 27 2008

7
Current Account of Balance of Payments
2000 2001 2002 2003 2004 2005 2006 2007 2008
-800
-600
-400
-200
0
200
400
600
800($B)
Asia$650B
ME Oil Exp. plus Russia
$497B
Eurozone -$98B
U.S. - $615B
Asia & Oil Exporters Save
Europe Balances
US Spends
Source: IMF, av. annual growth rates, last update April 9 2008, WEO (2007 estimate, 2008 forecast)

9
% of income
56.2
35.1
30.0 28.6
21.9
10.0
0
10
20
30
40
50
60
CHINA INDIA KOREA, REP.OF
JAPAN EURO AREA(AGG.)
UNITEDSTATES
Source: EIU estimates, annual average rates, Last update 7/2008
National Savings Rate Comparison Gross Domestic Savings: 2007 (% of GDP)

10
Changes in U.S. Home Prices
1999 2000 2001 2002 2003 2004 2005 2006 2007 2008-10
-5
0
5
10
15
(% change from a year ago)
July 2008 -7.1%
Source: Nat'l Association of Realtors, quarterly averages, last observation 7/ 2008

1999 2000 2001 2002 2003 2004 2005 2006 2007 20086
8
10
12
14
16
18
20
4
5
6
7
8
9(% of subprime loans) (% of total loans)
Total Delinquencies as a % total Loanas (Right) Subprime Delinquencies as a % Subprime loans (Left)

U.S. Mortgage Market: 2006-2007
Source: Inside Mortgage Finance, Last update February 8, 2008
FHA/VA, 2.7%Alt-A, 13.4%
Subprime, 20.1%
Prime, 49.3% Prime,
62.1%
FHA/VA, 4.2%
Alt-A, 11.3%
Subprime, 7.9%
2006 2007
13
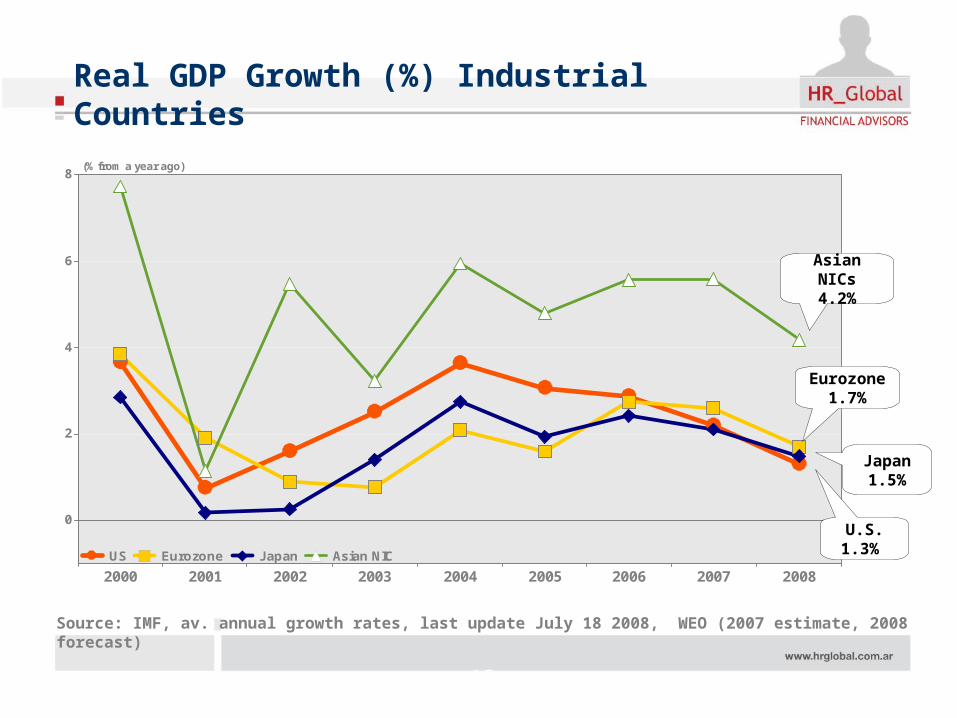
2000 2001 2002 2003 2004 2005 2006 2007 2008
0
2
4
6
8(% from a year ago)
US Eurozone Japan Asian NIC
Asian NICs4.2%
Eurozone 1.7%
U.S. 1.3%
Japan 1.5%
Real GDP Growth (%) Industrial Countries
Source: IMF, av. annual growth rates, last update July 18 2008, WEO (2007 estimate, 2008 forecast)
Cambio Geopolítico
G8 : Mejorar Transparencia y Conciencia de riesgo
Inestabilidad de los mercados?
Regulaciones?
Creciente desbalance de la economía de USA

Problema Central
Absoluta liberalización de la política de USA desde 1980,después de 30 años de Keynesianismo

Factores de peso
• Menor inversión en activos fijos productivos.
• Cambios en los hábitos de consumo: > déficit comercial y deuda interna.
• > Ingreso de capitales: la renta no queda en las empresas sino que se va hacia acreedores e inversores del exterior.
• Baja al ahorro y la reinversión.

¿Para que tanto ingresode capitales?
• Para mantener el consumo en US: comprador de todo el Mundo.
• Central: Más crédito es necesario en una economía abierta que en una basada en su propio crecimiento.

¿Para que tanto ingreso de capitales?
• Además: Siendo el dólar la moneda de comercio y reserva mundial impacta en todo el mundo.
• Exportadores e Inversores son los mismos.

El costo de mantener bajas las tasas de interés.
• Mayor financiación de hipotecas financia mayor consumo diario de las familias.
• Burbuja inmobiliaria.
• Créditos a quienes no podían pagarlo.
• Aumento de Mora e Incobrables.

Conclusiones. ¿Que esperar?
A corto plazo probable profundización de la crisis. Menor crecimiento Global.
Deflación.
Hay reservas monetarias enormes en Bancos Centrales.
Mayor intervención de los Bancos.
Centrales bombeando liquidéz.

Nuevas regulaciones del mercado en USA.
Poder de la Casa Blanca:
The Foreign Investments and National Security Act
Conclusiones. ¿Que esperar?

Como afecta a la Argentina?
• En las Finanzas
• En distintos sectores de la economía

En estos momentos
¿Que hacer con los negocios, los ahorros y las Inversiones?

GRACIAS


Related Documents