YEAR 10 STAGE 5.3 2008 MATHEMATICS Examiner : Sami El Hosri The examination is divided into five sections, namely: SPACE AND GEOMETRY NUMBER MEASUREMENT DATA PATTERNS AND ALGEBRA Time allowed – Two hours (Plus 5 minutes reading time) • Each of the five sections is worth 15 marks and consists of three parts A, B and C. • Part A. Choose one answer from the alternatives A, B, C or D. Use a pencil to shade the square corresponding to your choice in the single answering sheet provided for the part A questions in all five sections. • Part B and Part C. Write your solutions in the spaces provided. In some questions you may have to use a pencil to complete a table, a graph or to shade the appropriate section of a figure. • Rulers and protractors may be used. • Approved calculators may be used.

Welcome message from author
This document is posted to help you gain knowledge. Please leave a comment to let me know what you think about it! Share it to your friends and learn new things together.
Transcript
7/29/2019 08 yr 10 5.3
http://slidepdf.com/reader/full/08-yr-10-53 1/25
YEAR 10
STAGE 5.32008
MATHEMATICS
Examiner : Sami El Hosri
The examination is divided into five sections, namely:
SPACE AND GEOMETRY
NUMBER
MEASUREMENT
DATA
PATTERNS AND ALGEBRA
Time allowed – Two hours(Plus 5 minutes reading time)
• Each of the five sections is worth 15 marks and consists of three parts A, B and C.
• Part A.
Choose one answer from the alternatives A, B, C or D. Use a pencil to shade the squarecorresponding to your choice in the single answering sheet provided for the part Aquestions in all five sections.
• Part B and Part C.
Write your solutions in the spaces provided. In some questions you may have to usea pencil to complete a table, a graph or to shade the appropriate section of a figure.
• Rulers and protractors may be used.
• Approved calculators may be used.

7/29/2019 08 yr 10 5.3
http://slidepdf.com/reader/full/08-yr-10-53 2/25
© S & G Publishing and Coaching Academy
YEAR 10 - STAGE 5.3 – 2008
2

7/29/2019 08 yr 10 5.3
http://slidepdf.com/reader/full/08-yr-10-53 3/25
YEAR 10 - STAGE 5.3
SPACE AND GEOMETRY
PART A
1.
2.
3.
A) I only B) II only C) Both I and II D) Neither I nor II
YEAR 10 - STAGE 5.3 – 2008
3
In the diagram ABCD is a parallelogram
∠ACD = 46°, ∠ ADB = 44°and
∠ EBF = 42°.
What is the size of ∠ ACB?
A) 48° B) 46°
C) 44° D) 42°
In the diagram, ABCD is a
quadrilateral. ∠ BCE = 38°, ∠ ADC
= 130°and ∠ FAG = 42°.
What is the size of ∠ ABC?
A) 38° B) 42°
C) 46° D) 50°
In the diagram, ABCD is a parallelogram. CE = DF and
∠ CBE = ∠ DAF .Robert made the followingstatements:
I – ∠ BCE = ∠ ADF
II – ∆BCE ≡ ∆ADF
He was correct in:
NOT TO SCALE
NOT TO SCALE

7/29/2019 08 yr 10 5.3
http://slidepdf.com/reader/full/08-yr-10-53 4/25
4.
PART B – 7 marks for 5 questions. Questions 8 and 9 worth 2 marks each.
5.
6.
7. Each exterior angle of a regular polygon is 30° . How many sides does the polygon have?
YEAR 10 - STAGE 5.3 – 2008
4
ABC and CDE are similar triangles.
Find the value of x.
A) 8cm B) 9cm
C) 18cm D) 25cm
In the diagram ∆ABC is congruent to∆DEF.
Find the value of α. Give reasons.
Nancy wants to draw the triangleABC with AB = 5cm, AC = 6cm andBC = 4cm.
Use your geometrical instruments tofinish her work.
NOT TO SCALE
NOT TO SCALE
7/29/2019 08 yr 10 5.3
http://slidepdf.com/reader/full/08-yr-10-53 5/25
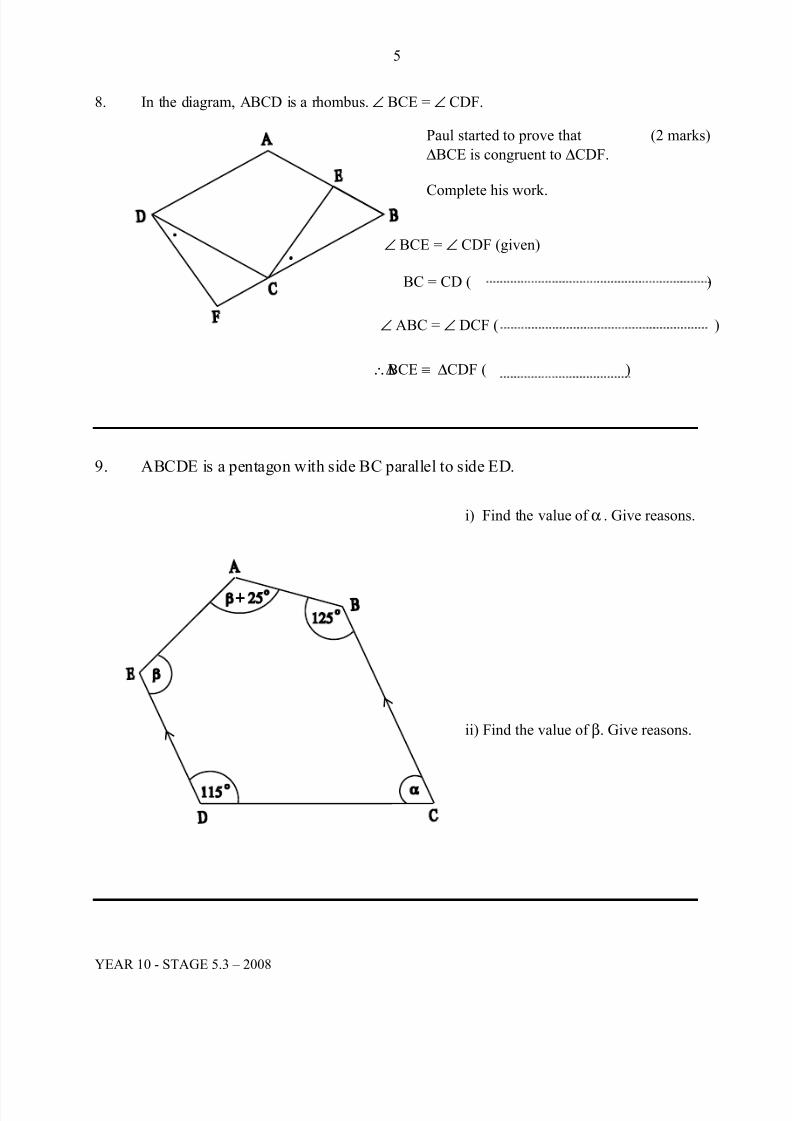
8. In the diagram, ABCD is a rhombus. ∠ BCE = ∠ CDF.
9. ABCDE is a pentagon with side BC parallel to side ED.
YEAR 10 - STAGE 5.3 – 2008
5
Paul started to prove that (2 marks)
∆BCE is congruent to ∆CDF.
Complete his work.
∠ BCE = ∠ CDF (given)
BC = CD ( )
∠ ABC = ∠ DCF ( )
∴∆BCE ≡ ∆CDF ( )
i) Find the value of α . Give reasons.
ii) Find the value of β. Give reasons.

7/29/2019 08 yr 10 5.3
http://slidepdf.com/reader/full/08-yr-10-53 6/25
PART C - 4 marks for 2 parts.
10. In the diagram ABCD is a parallelogram. E is the midpoint of AD and F is the point
of intersection of diagonal AC with BE.
i) Prove that ∆AFE is similar to ∆CFB. (3 marks)
ii) Find the value of x. Give reasons. (1 mark)
YEAR 10 - STAGE 5.3 – 2008
6

7/29/2019 08 yr 10 5.3
http://slidepdf.com/reader/full/08-yr-10-53 7/25
YEAR 10 - STAGE 5.3
NUMBER
PART A
1. Robert made the following statements:
I – 633 =+ II – 3218 =
He is correct in:
A) I only B) II only C) Both I and II D) Neither I nor II
2. Richard invests $48 000 for 3 years at 9.6 % p.a compounded monthly.The value of his investment can be expressed as:
A) $48 000 × 1.096 3 B) $48 000 × 1.008 36
C) $48 000 × 1.8 36 D) $48 000 × 1.0008 36
3. A bird cage contains 4 canaries, 2 of these are yellow and the other 2 are orange.If two canaries escaped, find the probability that both are yellow.
A)6
1B)
4
1C)
3
1D)
2
1
4. Two years ago, Natalie bought a computer. Its price depreciates at the rate of 60% p.a.If the value of the computer now is $384, how much did Natalie pay for the computer initially?
A) $983 B) $1067 C) $2000 D) $2400
YEAR 10 - STAGE 5.3 – 2008
7

7/29/2019 08 yr 10 5.3
http://slidepdf.com/reader/full/08-yr-10-53 8/25
PART B – 7 marks for 5 questions. Questions 8 and 9 are worth 2 marks each .
5. The price of a fridge including 10% GST is $2 365. What is the amount of GSTcharged of this fridge?
6. Craig is a business manager. His taxable income last year was $85 500.
Use the table below to calculate the tax that Craig should pay on his taxable income.
Taxable Income Scale Tax
$70 001 and over $12 250 plus 48c for each $ above $70 000
7. A home theatre system is advertised as follows:
Michelle bought the system on terms, how much interest did she pay for this system?
YEAR 10 - STAGE 5.3 – 2008
8
Cash price: $2 500
OR
Terms: $115 per month for 2 years
7/29/2019 08 yr 10 5.3
http://slidepdf.com/reader/full/08-yr-10-53 9/25
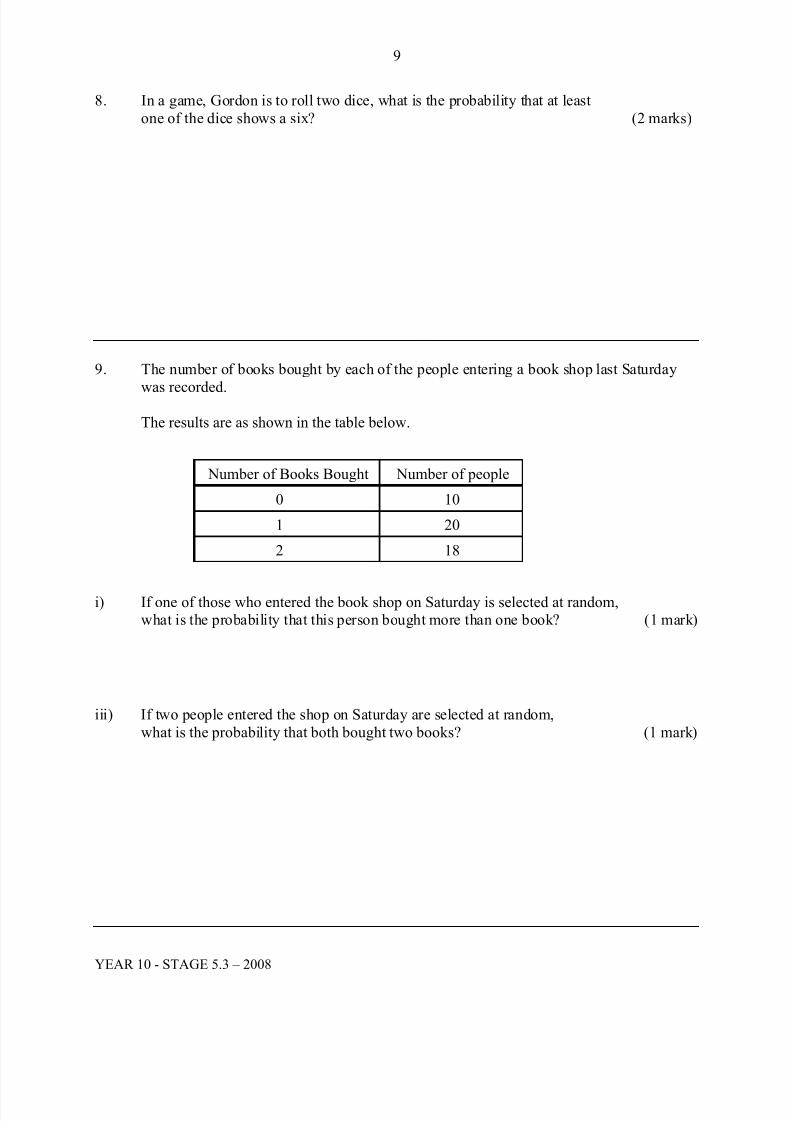
8. In a game, Gordon is to roll two dice, what is the probability that at leastone of the dice shows a six? (2 marks)
9. The number of books bought by each of the people entering a book shop last Saturday
was recorded.
The results are as shown in the table below.
Number of Books Bought Number of people
0 10
1 20
2 18
i) If one of those who entered the book shop on Saturday is selected at random,what is the probability that this person bought more than one book? (1 mark)
iii) If two people entered the shop on Saturday are selected at random,what is the probability that both bought two books? (1 mark)
YEAR 10 - STAGE 5.3 – 2008
9

7/29/2019 08 yr 10 5.3
http://slidepdf.com/reader/full/08-yr-10-53 10/25
PART C - 4 marks for 3 parts. Part (iii) is worth 2 marks.
10. Let P = 223 + , Q =12
6– 1
i) Find the value of P 2 + 1 . (1 mark)
ii) Find the value of 1Q
1
+(1 mark)
iii) Hence, evaluate1Q
1P2
+
+(2 marks)
YEAR 10 - STAGE 5.3 – 2008
10

7/29/2019 08 yr 10 5.3
http://slidepdf.com/reader/full/08-yr-10-53 11/25
YEAR 10 - STAGE 5.3
MEASUREMENT
PART A
1.
2.
A) I only B) II only C) Both I and II D) Neither I nor II
3. The diagram shows two similar monkey toys with volumes 3 600cm 3 and 12 150cm 3.
YEAR 10 - STAGE 5.3 – 2008
11
The diagram shows a square pyramid. Rebeccamade the following statement about the solid:
I) Its volume is 5184 cm 3.
II) Its surface area is 1296 cm 2.
She is correct in:
What is the height of the larger monkeytoy?
A) 81cm B) 44cm
C) 36cm D) 32cm
NOT TO SCALE
NOT TO SCALE
Ian made the following statements about thediagram shown.
I) sin α=25
7II) tan β =
13
5
He was correct in:
A) I only B) II only
C) Both I and II D) Neither I nor II

7/29/2019 08 yr 10 5.3
http://slidepdf.com/reader/full/08-yr-10-53 12/25
4.
PART B – 7 marks for 5 questions. Questions 8 and 9 are worth 2 marks each.
5.
6.
7.
8. The diagram shows a crane on a construction site.
YEAR 10 - STAGE 5.3 – 2008
12
Find the curved area of this cone shown in
the diagram correct to one decimal place.
The area of the parallelogram ABCD isclosest to:
A) 24.1cm 2 B) 34.4cm 2
C) 42cm 2 D) 68.8cm 2
From the diagram, find x the length of ABcorrect to one decimal place.
From the diagram, find the value of α
correct to the nearest minute.
NOT TO SCALE
NOT TO SCALE
NOT TO SCALE
NOT TO SCALE

7/29/2019 08 yr 10 5.3
http://slidepdf.com/reader/full/08-yr-10-53 13/25
ii) Find the angle of elevation of the top of the crane C from A, correct to the
nearest minute.(1 mark)
9. Two cars travel from a parking station P in two different directions. One travels in
a direction with a bearing of 038°T, while the other travels in a direction with
a bearing of 110°T.After traveling 15km the second car is due south of the first.
YEAR 10 - STAGE 5.3 – 2008
13
NOT TO SCALE
i) Find the size of angle C1PC 2. (1 mark)
ii) Find the distance C1C 2 between the (1 mark)two cars correct to one decimal place.
i) Find h, the height of the (1 mark)building AB correct to onedecimal place.

7/29/2019 08 yr 10 5.3
http://slidepdf.com/reader/full/08-yr-10-53 14/25
PART C - 4 marks for 3 parts. Part (iii) is worth 2 marks.
10. The cross section of the prism shown in the diagram consists of two triangles ABCand ADC.
i) Find the value of x the length of side BC correct to one decimal place. (1 mark)
ii) Find θ, the size of angle ACD correct to the nearest degree. (1 mark)
iii) Find the volume of the solid correct to one decimal place. (2 marks)
YEAR 10 - STAGE 5.3 – 2008
14

7/29/2019 08 yr 10 5.3
http://slidepdf.com/reader/full/08-yr-10-53 15/25
YEAR 10 - STAGE 5.3
DATA
PART A
1. This box and whisker plot represents a set of scores.
What is the interquartile range of this set of scores?
A) 30 B) 45 C) 60 D) 90
2. Students were surveyed about the number of hours they spent on homework yesterday.The results are shown in this cumulative frequency histogram.
3. A frequency distribution table is shown.
Score Frequency Relative frequency
2 20 0.5
3 8 0.2
4 0.3
What is the value of ?
A) 9 B) 10 C) 12 D) 14
YEAR 10 - STAGE 5.3 – 2008
15
How many students said they have spent 3hours on homework yesterday? A) 28 B) 12
C) 8 D) 3

7/29/2019 08 yr 10 5.3
http://slidepdf.com/reader/full/08-yr-10-53 16/25
4. The square represents a missing digit in the stem and leaf plot below.
1 3 3 4
2 2
3 5 5 5
PART B – 7 marks for 5 questions. Questions 8 and 9 are worth 2 marks each.
5. Find the standard deviation of the set of scores correct to 2 decimal places.
16 , 10 , 18 , 12 , 14 , 20.
6. The manager of a store recorded the number of mobile pre-paid cards sold in his storeeach week for a period of 50 weeks. The results are presented in the grouped frequencytable below.
Number of cards(Class)
Classcentre
Number of weeks
(frequency)
52 – 56 54 10
57 – 61 59 10
62 – 66 64 30
7. The average number of burgers sold in a take away shop is 72 from Monday to Saturdayinclusive and 75 over the entire week.
How many burgers did the shop sell of Sunday?
YEAR 10 - STAGE 5.3 – 2008
16
Given that the median is 10 less than
the mode, what does represents?
A) 8 B) 6
C) 4 D) 2
Find an estimate for the meannumber of cards sold during this period.

7/29/2019 08 yr 10 5.3
http://slidepdf.com/reader/full/08-yr-10-53 17/25
8. Draw a box and whisker plot to represent the data shown below. (2 marks)
26, 12, 22, 24, 16, 18, 27, 24, 23, 14, 14, 29, 17
9. David sat for three Geography tests during this term. The table below shows his resultsand the students’ average mark and standard deviation for the tests.
David’smark
Averagemark
Standard deviation
Test 1 82 73 6
Test 2 87 75 10
Test 3 x 72 8
i) In which test, Test 1 or Test 2 did David perform better compared
to the rest of the students? Justify your answer. (1 mark)
ii) When compared to the rest of the students, David’s performance inTest 3 is equivalent to his performance in Test 1.What is his mark for Test 3? (1 mark)
YEAR 10 - STAGE 5.3 – 2008
17

7/29/2019 08 yr 10 5.3
http://slidepdf.com/reader/full/08-yr-10-53 18/25
PART C - 4 marks for 4 parts.
10. Two football teams keep a record of the number of points they score eachgame. This information has been represented in the ordered, back to back stem and leaf plot below.
Team A Team B
6 2 1 0 2 3 7
7 4 3 1 2 4 5 9
6 5 0 3 2 2 4 8
2 2 1 1 4 1 4
i) Find the mean and standard deviation for the number of points scored (1 mark) by Team A.
ii) Find the mean and standard deviation for the number of points scored (1 mark) by Team B.
iii) Find the interquartile range for each team. (1 mark)
iv) Use the above results and the features of the back to back stem and (1 mark)leaf plot to compare the performance of the two teams stating which
team has the most consistent results.
YEAR 10 - STAGE 5.3 – 2008
18

7/29/2019 08 yr 10 5.3
http://slidepdf.com/reader/full/08-yr-10-53 19/25
YEAR 10 - STAGE 5.3
PATTERNS AND ALGEBRA
PART A
1. The equation of line is:
A) y = 4x + 2 B) y = 4x + 8
C) y = – 4x + 2 D) y = – 4x + 8
2. Which of the following could be theequation of the curve shown in thediagram?
A) y = x2 B) y =2
x2
1
C) y =x
2D) y = x 2 + 1
3. Jasmine drew the correct diagram that gave the solution with the simultaneous equationsy = – x + 5 and y = 2x – 1. Which of the following diagrams did she draw?
A) B)
C) D)
YEAR 10 - STAGE 5.3 – 2008
19
7/29/2019 08 yr 10 5.3
http://slidepdf.com/reader/full/08-yr-10-53 20/25
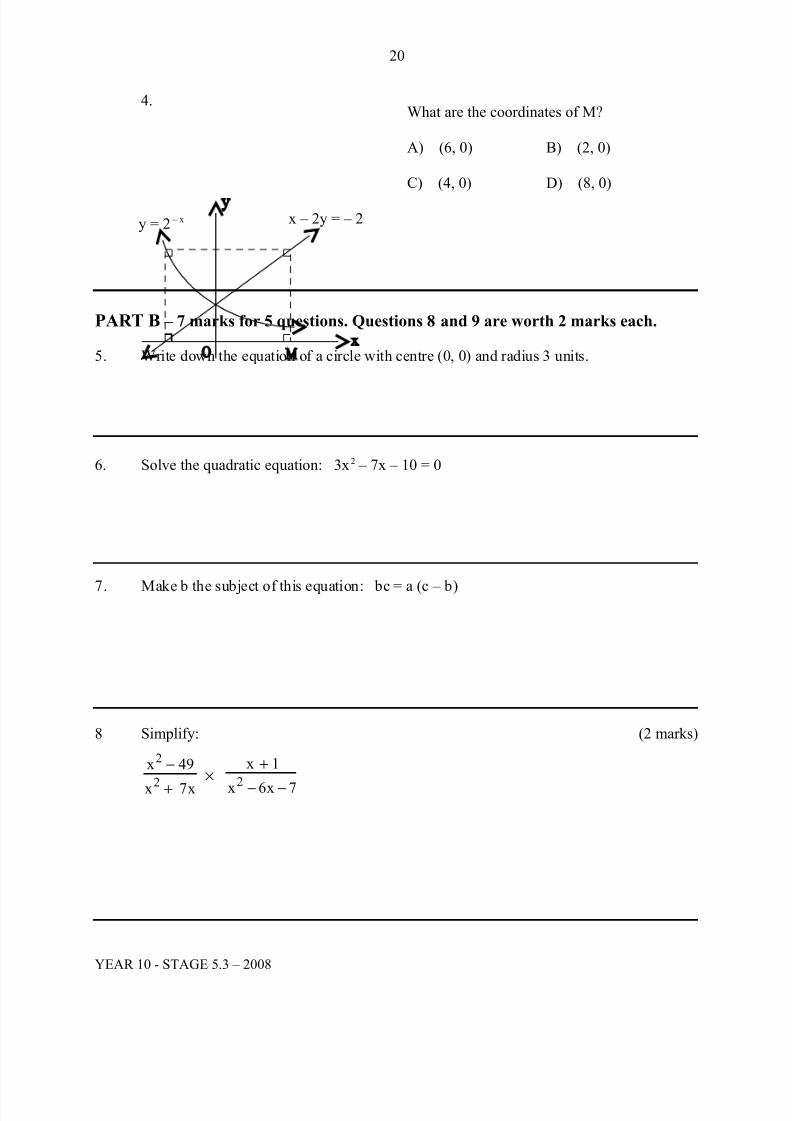
4.
PART B – 7 marks for 5 questions. Questions 8 and 9 are worth 2 marks each.
5. Write down the equation of a circle with centre (0, 0) and radius 3 units.
6. Solve the quadratic equation: 3x 2 – 7x – 10 = 0
7. Make b the subject of this equation: bc = a (c – b)
8 Simplify: (2 marks)
x7x
49x
2
2
+
− ×
7x6x
1x
2 −−
+
YEAR 10 - STAGE 5.3 – 2008
20
What are the coordinates of M?
A) (6, 0) B) (2, 0)
C) (4, 0) D) (8, 0)
x – 2y = – 2y = 2 – x

7/29/2019 08 yr 10 5.3
http://slidepdf.com/reader/full/08-yr-10-53 21/25
9.
PART C - 4 marks for 4 parts.
10.
i) Find the coordinates of A. (1 mark)
ii) Find the coordinates of B. (1 mark)
iii) Find the coordinates of C. (1 mark)
iv) Find the area of the kite OABC. (1 mark)
© S & G P. C. A.
YEAR 10 - STAGE 5.3 – 2008
21
y =x
6−
y = 6x – x 2
In the number plane shown, the parabola y = 6x – x 2 has a vertex atA and crosses the x axis at the originO and at the point B.
The point C is vertically below A
and lies on the curve y =x
6− .
Find the equation of the parabolashown in the diagram.
(2 marks)
(1, – 2)

7/29/2019 08 yr 10 5.3
http://slidepdf.com/reader/full/08-yr-10-53 22/25
Formulae
Simple interest = PRT where100
r R =
Amount (compound interest) = n)R 1(P + where100
r R =
Circumference of a circle = πd
Area of a circle = 2r π
Surface area of a cylinder = 2r 2π + hr 2π
Surface area of a sphere = 2r 4π
Curved surface area of cone = sr π where s = slant height
Volume of prism = Ah
Volume of a pyramid or a cone = Ah3
1
Volume of a sphere =3r
3
4π
Sine rule:Csin
c
Bsin
b
Asin
a==
Cosine rule: bc2
ac bAcos,Acos bc2c ba
222222 −+
=−+=
Area of triangle = Csinab2
1
Quadratic formula:a2
ac4 b bx
2 −±−=
Exact value triangles:
2
3
1 2
45° 60°1 1
YEAR 10 - STAGE 5.3 – 2008
22

7/29/2019 08 yr 10 5.3
http://slidepdf.com/reader/full/08-yr-10-53 23/25
YEAR 10 - STAGE 5.3 - ANSWER SHEET
2008
MATHEMATICS
FOR ALL PARTS A OF EACH OF THE FIVE SECTIONS
INSTRUCTIONS:
• Cross the box that indicates the correct answer
SPACE AND GEOMETRY NUMBER
1 A B C D 1 A B C D
2 A B C D 2 A B C D
3 A B C D 3 A B C D
4 A B C D 4 A B C D
MEASUREMENT DATA
1 A B C D 1 A B C D
2 A B C D 2 A B C D
3 A B C D 3 A B C D
4 A B C D 4 A B C D
PATTERNS AND ALGEBRA
1 A B C D
2 A B C D
3 A B C D
4 A B C D
YEAR 10 - STAGE 5.3 – 2008
23

7/29/2019 08 yr 10 5.3
http://slidepdf.com/reader/full/08-yr-10-53 24/25
School Certificate Grid for Mathematics Year 10 Stage 5.3 2008
Question Marks Topic ContentOutcomes
WorkingMathematically
Outcomes
TargetedPerformanceDescriptor
Grades
Section 1 SPACE AND GEOMETRY
1 1 Properties of Geometrical Figures SGS 4.3 WM 4.2 B8
2 1 Angles SGS 4.2 WM 4.4 B8
3 1 Properties of Geometrical Figures SGS 4.4 WM 4.4 A9
4 1 Properties of Geometrical Figures SGS 4.4 WM 4.4 C6
5 1 Properties of Geometrical Figures SGS 4.3 WM 4.2 C6
6 1 Properties of Geometrical Figures SGS 5.2.2 WM 5.2.4 C6
7 1 Properties of Geometrical Figures SGS 5.2.1 WM 5.2.4 B7
8 2 Properties of Geometrical Figures SGS 5.2.2 WM 5.2.4 B8
9 i) 1 Angles SGS 4.2 WM 4.4 C69 ii) 1 Properties of Geometrical Figures SGS 5.2.1 WM 5.2.4 C6
10 i) 3 Deductive Geometry SGS 5.3.3 WM 5.34 A9
10 ii) 1 Properties of Geometrical Figures SGS 5.2.2 WM 5.2.2 B8
Section 2 NUMBER
1 1 Real Numbers NS 5.3.1 WM 5.3.2 A9
2 1 Consumer Arithmetic NS 5.2.2 WM 5.2.2 B7
3 1 Probability NS 5.3.2 WM 5.2.2 A10
4 1 Fractions, Decimals & Percentages NS 4.3 WM 5.1.2 B7
5 1 Fractions, Decimals & Percentages NS 4.3 WM 5.1.2 B7
6 1 Consumer Arithmetic NS 5.1.2 WM 5.1.3 B87 1 Consumer Arithmetic NS 5.1.2 WM 5.1.3 B8
8 2 Probability NS 5.3.2 WM 5.2.2 A10
9 i) 1 Consumer Arithmetic NS 5.1.2 WM 5.1.3 B8
9 ii) 1 Consumer Arithmetic NS 5.3.2 WM 5.2.2 A10
10 i) 1 Real Numbers NS 5.3.1 WM 5.3.2 A10
10 ii) 1 Real Numbers NS 5.3.1 WM 5.3.2 A10
10 iii) 2 Real Numbers NS 5.3.1 WM 5.3.2 A10
Section 3 MEASUREMENT
1 1 Trigonometry MS 5.1.2 WM 5.2.2. D3
2 1 Surface Area & Volume MS 5.3.1 WM 5.3.2 A10
3 1 Surface Area & Volume MS 5.3.1 WM 5.3.2 A10
4 1 Trigonometry MS 5.1.2 WM 5.2.2. A9
5 1 Surface Area & Volume MS 5.3.1 WM 5.3.2 B8
6 1 Trigonometry MS 5.3.2 WM 5.2.2 A9
7 1 Trigonometry MS 5.3.2 WM 5.2.2 A9
YEAR 10 - STAGE 5.3 – 2008
24

7/29/2019 08 yr 10 5.3
http://slidepdf.com/reader/full/08-yr-10-53 25/25
8 i) 1 Trigonometry MS 5.1.2 WM 5.1.2 C5
8 ii) 1 Trigonometry MS 5.1.2 WM 5.1.2 C6
9 i) 1 Surface Area & Volume MS 5.2.3 WM 5.2.2 B7
9 ii) 1 Surface Area & Volume MS 5.3.2 WM 5.3.2 A9
10 i) 1 Trigonometry MS 5.3.2 WM 5.3.2 A9
10 ii) 1 Trigonometry MS 5.3.2 WM 5.2.2 A910 iii) 2 Trigonometry
Surface Area & VolumeMS 5.3.2MS 4.2
WM 5.3.2 A9
Section 4 DATA
1 1 Data Analysis and Evaluation DS 5.2.1 WM 5.2.2 C6
2 1 Data Representation and Analysis DS 5.1.1 WM 5.1.2 D4
3 1 Data Representation DS 4.1 WM 4.3. D4
4 1 Data Analysis and Evaluation DS 4.2 WM 5.1.2 C5
5 1 Data Analysis and Evaluation DS 5.2.1 WM 5.2.2 C6
6 1 Data Representation & Analysis DS 5.1.1 WM 5.1.2 C6
7 1 Data Analysis and Evaluation DS 4.2 WM 5.2.2 B88 2 Data Analysis and Evaluation DS 5.2.1 WM 5.2.2 B7
9 i) 1 Data Analysis and Evaluation DS 5.2.1 WM 5.2.2 B7
9 ii) 2 Data Analysis and Evaluation DS 5.2.1 WM 5.2.2 B7
10 i) 2 Data Analysis and Evaluation DS 5.2.1 WM 5.2.2 C6
10 ii) 1 Data Analysis and Evaluation DS 5.2.1 WM 5.2.2 C6
10 iii) 1 Data Analysis and Evaluation DS 5.2.1 WM 5.2.2 C6
10 iv) 1 Data Analysis and Evaluation DS 5.2.1 WM 5.2.4 B7
Section 5 PATTERNS AND ALGEBRA
1 1 Coordinate Geometry PAS 5.1.2 WM 5.1.2 C6
2 1 Coordinate Geometry PAS 5.2.4 WM 5.2.4 D4
3 1 Coordinate Geometry PAS 5.2.3 WM 5.2.4 B7
4 1 Coordinate Geometry PAS 5.3.4 WM 5.3.4 A9
5 1 Coordinate Geometry PAS 5.3.4 WM 5.3.4 B8
6 1 Algebraic Techniques PAS 5.3.2 WM 5.2.2 A9
7 1 Algebraic Techniques PAS 5.3.2 WM 5.2.2 A9
8 2 Algebraic Techniques PAS 5.3.1 WM 5.2.2 B8
9 2 Coordinate Geometry PAS 5.3.4 WM 5.3.4 A10
10 i) 1 Coordinate Geometry PAS 5.3.4 WM 5.3.4 B8
10 ii) 1 Coordinate Geometry PAS 5.3.4 WM 5.3.4 A10
10 iii) 1 Coordinate Geometry PAS 5.3.4 WM 5.3.4 A1010 iv) 1 Coordinate GeometryPerimeter and Area
PAS 5.3.4MS 5.1.1
WM 5.3.4 A9
25
Related Documents