Determinants of National R&D and Patenting: Application to a Small, Distant Country Ron Crawford, Richard Fabling, Arthur Grimes & Nick Bonner Ministry of Economic Development Occasional Paper 06/02 November 2004

Welcome message from author
This document is posted to help you gain knowledge. Please leave a comment to let me know what you think about it! Share it to your friends and learn new things together.
Transcript

Determinants of National R&D and Patenting:
Application to a Small, Distant Country
Ron Crawford, Richard Fabling,
Arthur Grimes & Nick Bonner
Ministry of Economic Development
Occasional Paper 06/02
November 2004

Ministry of Economic Development Occasional Paper 06/02
Determinants of National R&D and Patenting: Application to a Small, Distant Country
Date: November 2004
Author: Ron Crawford, Richard Fabling, Arthur Grimes & Nick Bonner
Notes
At the time of preparation of this paper, Crawford, Fabling and Bonner were each
with Medium Term Strategy Group (MTSG), Ministry of Economic Development.
Grimes was with Motu Economic & Public Policy Research and University of Waikato,
and working with MTSG.
Contact: [email protected]
Disclaimer
The views, opinions, findings, and conclusions or recommendations expressed in this
Occasional Paper are strictly those of the author(s). They do not necessarily reflect
the views of the Ministry of Economic Development. The Ministry takes no
responsibility for any errors or omissions in, or for the correctness of, the information
contained in these occasional papers. The paper is presented not as policy, but with
a view to inform and stimulate wider debate.
i

Abstract
We analyse the determinants of national R&D expenditure and patenting activity. In
contrast to most related studies, we account for factors that impact on small, distant
countries. These factors include country size, firm size, distance from major
economic centres, and industrial structure. We apply the results to New Zealand,
which has a low rate of privately funded R&D. We find that R&D expenditure and
patenting activity are negatively affected by having a preponderance of small firms,
having a heavy reliance on agriculture and also by distance of a country from major
world centres. Population size is found to have no impact on either R&D or patenting.
Greater R&D increases patenting, with an elasticity that indicates moderately
increasing returns to scale in the relationship between R&D inputs and patent
outcomes. Better intellectual property protection within a country also increases
patenting activity. Once we control for these factors, New Zealand is not an outlier
with respect to its R&D expenditures; it is a positive outlier with regard to patenting.
Keywords: R&D, patents, economic geography
JEL Nos.: O31, O34, R12
ii

Executive Summary
Research and development (R&D) is important both for the performance of individual
firms and for the performance of national economies. New Zealand has low rates of
expenditure on private sector R&D, and it is important to understand why. There are
a range of factors that policy makers have assumed explain these low rates.
Empirical estimates of the effect of these factors will improve the focus of policy.
Accordingly, we analyse determinants of national R&D and patenting, emphasising
factors that may impact on small, distant countries. We examine the impacts of
country size, firm size, distance from major economic centres and industrial structure
on each of R&D and patenting. The results are applied to New Zealand.
We review prior literature on the subject before estimating the determinants of R&D
and patenting. The review examines general determinants of national R&D as well as
specifics relating to market size, industrial structure, firm size, intellectual property,
distance from major world centres and the role of public R&D subsidies. Various
studies find that each of these specifics may affect a country’s overall amount of R&D
as well as the share conducted by the private sector. We also review the literature on
determinants of patenting. A key determinant is the amount of R&D that is conducted
within a country. Other factors, such as education levels, the number of scientists
and engineers, quality of universities and per capita incomes may also have an effect.
Much of the literature relates to countries that are larger than New Zealand and
which are located closer to major economic centres. We consider four variables that
may additionally be important for small, distant countries. The first is distance from
major world markets, with greater distance tending to reduce innovative activity. The
second is population size. The amount and efficiency of innovation activity may
depend on the population over which discoveries can be leveraged. The third
candidate is firm size. Large firms, on average, are more involved in R&D activity
than are small firms. Whether firm size is relevant to the transformation of R&D into
patents depends on whether there are internal economies of scale in R&D activity.
The fourth candidate is industrial structure. Countries that are heavily reliant on
agriculture may have relatively low patenting activity. Patenting may also be more
important for manufacturing than for services, or for certain types of manufacturing.
iii

We test the reduced form impacts of these four elements on both patenting activity
and total R&D activity. We also examine their reduced form impacts on the split
between privately and publicly funded R&D. We find that increasing distance reduces
each of patents, R&D expenditure and the share of that expenditure funded privately.
A high agriculture share has a negative effect on the same variables as does having
a high share of people who are self-employed (a proxy for prevalence of small firms).
Population size has no significant effects. Once these factors are accounted for, New
Zealand is found to be a statistically significant positive outlier for patent activity; the
NZ coefficient is also positive (but not statistically significant) with respect to total
R&D expenditures and the private R&D share. This evidence suggests that New
Zealand is not a poor performer for these three innovation-related variables once we
control for distance, industry structure and firm size.
We also estimate how R&D and other factors are transformed into patents at a
national level. We find moderate increasing returns to scale in converting R&D to
patents, with a returns to scale parameter of approximately 1¼. Privately funded
R&D is found to contribute more strongly to patents than publicly funded R&D.
Relatively concentrated R&D (per capita) is positive for patent outcomes while
patenting efficiency is enhanced by having a greater proportion of large firms. The
further a country is from major markets, the less efficient is the transformation of R&D
expenditures into patents.
Conditions within a country also affect patenting. A rigorous IP protection regime is
found to be conducive for turning R&D into patents. Having a large agricultural base
is a negative for R&D expenditures, but it may induce a higher rate of transformation
of R&D into patents; one reason may be the incentive to patent goods that can
escape agricultural trade restrictions. Finally, we find some evidence that general
attitudes towards efficiency in a country impact positively on the transformation of
R&D into patents.
iv

Contents
Abstract ..................................................................................................................... ii
Executive Summary ................................................................................................ iii
Contents.................................................................................................................... v
1. Motivation .......................................................................................................... 1
2. Previous Empirical Studies .............................................................................. 4
2.1. National R&D Determinants ......................................................................... 4 2.2. Market Size .................................................................................................. 4 2.3. Industrial Structure ....................................................................................... 5 2.4. Firm Size, Market Structure and Intellectual Property .................................. 6 2.5. Distance ....................................................................................................... 8 2.6. Public Subsidies ........................................................................................... 8 2.7. Other Effects on R&D................................................................................... 9 2.8. Determinants of Patenting.......................................................................... 11
3. R&D Expenditure & Patent Activity: Reduced Form Determinants............. 16
4. Determinants of Patent Activity ..................................................................... 22
4.1. Modelling Patents....................................................................................... 22 4.2. Levels Equation: OLS Results................................................................... 26 4.3. Levels Equation: IV Results ...................................................................... 28 4.4. Change-Form Equation .............................................................................. 29 4.5. Patent Determination Results: Summary .................................................. 31
5. Conclusions..................................................................................................... 33
Tables ...................................................................................................................... 35
Table 1: Reduced Form Equations* ...................................................................... 35 Table 2: Equations* for LPATENTSPCj,t ............................................................... 37 Table 3: Equations* for ΔLPATENTSPCj,t ............................................................. 39
References .............................................................................................................. 41
Appendix A – Sources of Data .............................................................................. 48
Variables and definitions ....................................................................................... 48
Appendix B.............................................................................................................. 52
Appendix C.............................................................................................................. 53
v

Determinants of National R&D and
Patenting: Application to a Small,
Distant Country
1. Motivation
Our aim in this study is to analyse the determinants of national R&D (research and
development) and patenting activity. In contrast to most other studies of these issues,
we are particularly concerned to account for factors that may impact on small, distant
countries. We take account of country size, firm size, distance from major economic
centres, and industrial structure on each of R&D and patenting. Krugman (1993) and
Poot (2004) demonstrate that such factors can have important effects on national
development. We apply the results to a particular small, distant country – New
Zealand – but the findings are general.
The study is motivated by the recognition that R&D is important both for the
performance of individual firms, and more broadly for productivity growth and
economic performance of national economies. New Zealand has very low rates of
expenditure on private sector R&D, and it is important to understand why. There are
a range of plausible factors that policy makers have assumed explain these low rates.
Empirical estimates of the effect of these factors will improve the focus of policy.
Investment in R&D has positive effects on firms' productivity and profitability (Fabling
and Grimes, 2004a, for New Zealand) and produces a relatively high private rate of
return – in the order of 10-15 percent (Hall, 1996). There are wider productivity
benefits to the R&D performed by individual firms. What one firm learns from its R&D
1

eventually spills over to other firms, raising productivity more widely. For a small
country that is not generally a technological leader, such as New Zealand, private
sector R&D produces wider productivity benefits, in particular through the adaptation
of imported technologies (Griffith et al., 2000; Coe and Helpman, 1995). The social
rate of return to R&D is thus higher than the private. Estimates depend on the level
of aggregation used to capture the effects, but at a national level they have been
estimated to range from 40 percent to 95 percent (Griffith et al., 2000). Jones and
Williams (1998) argue, using an endogenous growth framework, that the empirical
estimates of social rates of return represent a lower bound, because of dynamic
effects.
While a country's overall R&D effort has a positive effect on economic growth, the
proportion financed by the private sector may be particularly important (Bassanini et
al. 2001). The commercial pressures faced by private sector researchers mean that
they are likely to be comparatively better than the public sector at R&D that produces
direct and timely productivity benefits.
Rates of private sector R&D in New Zealand are very low, both overall and as a
proportion of total R&D effort. In 2001, New Zealand ranked 25th of 29 OECD
countries in private sector expenditure on R&D as a percentage of value added in
industry1. Whereas, in 2002 this expenditure was 0.42 % of GDP in New Zealand,
the OECD weighted average (in 2001) was 1.48 %.
The reasons for the low level of private sector R&D in New Zealand are not well
understood. The small size and industrial structure of the New Zealand economy
(e.g. the lack of R&D intensive sectors), and the small proportion of very large firms
that usually account for a large proportion of private sector R&D, may play a
role. Distance from large markets and technology leaders may also be important.
The relatively low levels of public support for private sector R&D (and related
differences in reporting R&D) are likely also to affect measured R&D intensity.
1 However, private sector R&D expenditure in New Zealand has increased. Between 1995 and 1999 it grew at an average annual rate of 6.9%, compared with an OECD average rate of 5.3%. Between 2000 and 2002 nominal private sector R&D expenditure jumped 30%. Part of this increase may be due to changes in the tax treatment of R&D that were introduced in 2001. These changes may have had both real and accounting impacts on measured R&D.
2

While R&D appears to be important for development outcomes, an understanding of
R&D determinants is not sufficient to understand the impact of innovation on
economic outcomes. R&D may or may not be carried out efficiently, either by the
public or private sector.
One way of gaining greater insight into the contribution of R&D to development is to
examine the relationship between R&D and a more tangible, but intermediate,
outcome variable that itself contributes to development. The number of international
patents registered by a country is one such measure. Naturally, patents is an
imperfect measure of innovation, but it has the advantage over R&D that it is an
output rather than an input measure; people patent an idea or invention if they see
private value in it and if the patent office accepts it as original.
The study proceeds as follows. Section 2 examines the range of existing literature
that analyses determinants of R&D (total and private) and of patenting. It draws
attention to issues that may be particularly relevant to small countries and which
have been treated only lightly, or not at all, in previous studies. Section 3 examines
reduced form determinants of R&D and patenting. It focuses, in particular, on issues
that may be relevant to small, distant countries. Section 4 examines the determinants
of patenting, and especially the link between R&D inputs and patenting outcomes,
more closely. It extends the work of previous studies (Furman et al, 2002; Gans and
Stern, 2003; Bosch et al, 2004) to account for factors that are particularly relevant to
small, distant countries. Section 5 summarises and comments on key findings.
3
2. Previous Empirical Studies
2.1. National R&D Determinants
There are very few studies of the determinants of R&D across countries and most do
not explicitly take account of factors that may materially affect R&D activity in small,
distant countries. Most studies also suffer from small samples and inability to deal
with country-specific effects and endogeneity of the explanatory variables (Lederman
and Maloney, 2003). The study by Lederman and Maloney (2003) is the most careful
in dealing with these issues2, focusing on the determinants of total public and private
R&D effort across countries. Their results are summarised in relevant sub-sections
below.
One cross country study deals with the determinants of private sector R&D. Guellec
and Ioannidis (1997) use a panel of 19 OECD countries covering the period 1960 to
1996. The dependent variable is R&D expenditure, rather than intensity, though
GDP appears as a control variable. New Zealand is not included in this study, which
focuses on explaining fluctuations. They find that a levelling off in private sector R&D
expenditures in OECD countries in the early 1990s was mostly accounted for by
macroeconomic and policy factors. In particular, the economic downturn in this
period, combined with reduction in government funding of research, played a major
role, along with high real interest rates and a shift in the industrial composition of
GDP towards services, and away from high tech industries. There is a suggestion
that R&D and physical investment share some determinants, but that R&D
expenditures are more strongly pro-cyclical.
Given the paucity of rigorous cross-country studies, we examine some less direct
evidence as a precursor to inform our own cross-country work.
2.2. Market Size
There appears to be little literature that directly addresses the relationship between
market size and R&D intensity. However, theoretical considerations and historical
analysis suggests that market size may matter. Paul Romer argues that “larger
2 They use GMM estimation, and instrument the variables in levels, with the differences; and the variables in differences with the second lag of the levels. They also address issues of serial correlation.
4

markets and larger stocks of resources create substantially bigger incentives for
discovering new ways to use the resources” (Romer, 1996). The size of the domestic
market will also interact with distance from major markets – market access is different
for a small country in Europe, compared to New Zealand.
2.3. Industrial Structure
Some industries (telecommunications equipment, pharmaceuticals, aeronautics) are
much more R&D intensive than others (wood and food processing, agriculture).
Amongst OECD countries, eight industries (at 2-digit or finer level of disaggregation)
account for almost 80 per cent of R&D expenditure. Across a wider set of countries,
Lederman and Maloney (2003) find that resource rich countries have lower levels of
overall (public and private sector) R&D intensity, other factors controlled. Cohen et al.
(1987) find, in a firm level study using U.S. data, that nearly half the variance in R&D
intensity can be accounted for by industry characteristics. Part of the explanation for
New Zealand’s low private sector R&D intensity almost certainly lies in its industrial
structure (though, over the very long run, the industrial structure is not fixed and may
be influenced by R&D effort).
Mazoyer (1999) is the only systematic comparative study of the effect of industrial
structure on R&D intensity in New Zealand. She looks at R&D intensity in twenty-two
manufacturing industries3 across 11 OECD countries including New Zealand. R&D
intensity is measured by R&D expenditures as a percentage of industry value added.
She decomposes overall cross-country differences in manufacturing R&D intensity
into differences due to industrial structure, and differences due to R&D intensity
within industries4. Of the 11 countries, New Zealand has the lowest intensity at 0.9
per cent, while Sweden has the highest at 11.2 per cent. New Zealand is 4.7
percentage points lower than the country average in R&D intensity. This can be
decomposed into 2.6 percentage points due to differences in structure, and 2.1
percentage points due to differences in intensity within industries. (Some of the
difference in intensity within more aggregated industries may be explained by
structure at a more disaggregated level.) Mazoyer’s results suggest that while 3 Some of these are defined at the two digit level, and some at more disaggregated levels (see Appendix A, Mazoyer, 1999). Unfortunately, these detailed data are not available for a long enough time span and for enough countries to enable their use in our own empirical work. 4 The differences are in terms of distance from the mean share of each industry in manufacturing across the sample of countries and the median value for R&D intensity in each industry.
5

industrial structure alone cannot explain New Zealand’s low private sector R&D
intensity, it can explain a sizeable proportion of the gap.
2.4. Firm Size, Market Structure and Intellectual Property
Large firms account for the major proportion of R&D effort. Over 80% of business
R&D in the OECD is accounted for by firms with over 250 employees - but in New
Zealand over 40% is performed by firms with fewer than 100 employees (OECD,
2003). Compared to other OECD countries, New Zealand lacks significant numbers
of very large firms (Mills and Timmins, 2004). One of the questions of interest is
whether R&D effort rises more than proportionately with firm size, and whether this
accounts for New Zealand’s relatively low effort.
This question is closely related to whether a degree of market power (that may be
associated with industrial concentration in large firms), or whether intense
competition provides stronger incentives for innovation. It is argued, on the one hand,
that market power allows firms to more fully appropriate the returns from their
innovations; but, on the other, that firms will compete for market share on the basis of
new products that differentiate them from competitors. The strength of intellectual
property rights (IP) protections also bears on this debate. The stronger is IP
protection, the less important market power will be in providing incentives for
innovation (Aghion et al. 2001).
Symeonidis (1996) reviews the empirical literature on the relationship between
innovation (including R&D intensity), firm size and market structure. In addition to the
market power hypothesis, R&D may increase more than proportionately with firm size,
because projects involve large fixed costs and scale and scope economies, large
firms can diversify their projects and spread the risks, and they have better access to
finance.
The empirical literature is fraught with many problems. Some of the most salient are
error in measurement of R&D possibly systematically related to firm size,
endogeneity of size to the success of R&D effort, problems in choosing the
appropriate level of aggregation at which to define concentration, and considerable
heterogeneity of effects across industries – which makes generalisation of results at
6

an aggregate level difficult.5 Symeonidis reviews evidence that market structure and
R&D intensity are jointly determined by technology, the characteristics of demand,
the institutional framework, strategic interaction and chance.
Overall, Symeonidis concludes that above a certain threshold, R&D spending seems
to rise more or less proportionally with firm size, and that there is little evidence of a
positive relationship between R&D intensity and industrial concentration in general.
However, when there are high sunk costs per individual project, and economies of
scale and scope in the production of innovation rents, such a relationship can occur.
One of the studies relied on in Symeonidis (1996) is Cohen et al. (1987). As part of
their investigation by industry, Cohen et al. (1987) exclude a small number of very
large and very R&D intensive firms, and find that R&D intensity does not increase
with size in the remainder of the sample. Only a very small proportion of the overall
variance in R&D intensity across firms is explained by size. Nevertheless, the
absence of very large R&D intensive firms may play a role in explaining low R&D
intensity in New Zealand.
The importance of competition and IP protection for innovation are documented
empirically in a range of studies. Aghion et al. (2003) cite Geroski (1995), Nickell
(1996) and Blundell et al. (1999) on competition; see also Lederman and Maloney,
(2003). Zietz and Fayissa (1992) find that import competition (proxied by the real
exchange rate) stimulates R&D investments in high-tech (but not low-tech) industries
in the US.6
5 Possible heterogeneity of effects across broad industry sectors is suggested by data in Statistics New Zealand (2003). The proportion of business R&D expenditures accounted by firms with less than 50 employees varies from 17 percent in manufacturing, through 38 per cent in the primary sector to 65 per cent in services. This pattern may partly reflect underlying differences in the distribution of employment by firm size. 6 Aghion et al. (2003) develop a model that predicts an inverted U relationship between product market competition and innovation. At first, increased competition increases innovation, as firms attempt to “break free” from competition. But eventually Schumpeterian effects dominate, and laggard firms reduce their innovation effort as the monopoly rents from successful innovation decline. The relationship will vary by industry – depending on how large the gap is between technology leaders and laggards. They find some evidence for this empirically. They reference a number of empirical studies that find a generally positive relationship between competition and innovation .
7
2.5. Distance
A well established literature shows that distance hampers the diffusion of new
technologies.7 Eighty-nine percent of the OECD’s overall R&D, and thus a large
proportion of the world total, is performed in the United States, the European Union
and Japan (OECD, 2003). New Zealand is thus very remote from the world centres
of R&D effort.
However, the effect of distance from technology leaders on local R&D intensity is not
straightforward. On the one hand, distance may raise the effective cost of
performing R&D locally (because it is harder to get access to the ever growing stock
of knowledge on which R&D builds). Moreover, it appears that R&D effort by
technologically leading countries eventually produces productivity benefits for less
advanced countries (Coe and Helpmann, 1995; Helpman, 1997, Cameron, 1998).
This may reduce the incentives to perform leading edge R&D locally.8 On the other
hand, evidence suggests that adoption of foreign technologies is facilitated by local
R&D effort, and has a high rate of return (Griffith et al. 2000). These
complementarities may encourage local R&D.
Thus, in gauging the effect of distance on R&D intensity in New Zealand, the
appropriate comparison is with other countries that are not technology leaders. There
appears to be no literature that empirically estimates the effects of distance from
technology leaders on R&D effort. If one were to test this effect, potential non-
linearities in the effects of distance, arising from the competing influences of distance
on innovation, may need to be tested.
2.6. Public Subsidies
A range of studies indicate that government subsidies for private sector R&D
(through tax incentives and grants) have a significant positive effect on effort (Hall
and Van Reenen, 2000). For instance Bloom et al. (2000), in a study of a nineteen
year panel of nine OECD countries, find a long-run elasticity of close to one for the 7 See Audretsch and Feldman (2004) for a survey. Cameron (1988) surveys the evidence that foreign economies gain less from domestic innovation than other domestic firms. 8 Scandizzo (2001) presents a model that predicts weak IP protection and fewer firms performing R&D in middle income countries competing with industrialised countries with strong IP protection. The model depends on a time inconsistency problem – while governments may ex ante promise strong IP protection, ex post they will weaken it, if successful innovation happens abroad first. Firms anticipate this, and acquiesce in a regime with lower IP protection and lower local rates of innovation.
8

impact of the user cost on private sector R&D expenditure. Overall, Hall and van
Reenen conclude that, while estimates vary considerably, in the long run a dollar in
public assistance for private sector R&D will result in a dollar of additional R&D. In
the short run, the effect is much smaller.
While these effects are well attested, rates of subsidy in OECD countries are typically
in the range of seven to ten percent. Thus, the historically modest subsidies in New
Zealand are likely to explain only a small proportion of the gap in private sector R&D
intensity between it and other OECD countries.
Another aspect of R&D policy may also have an effect. There is evidence to suggest
that increases in public sector research can "crowd-out" private sector R&D by
increasing the demand for and raising the wages of skilled people (Goolsbee,
1998). On the other hand, public sector R&D may stimulate private sector R&D
through complementarities that reduce the effective cost of the latter. Some studies
suggest that the risk of crowding out is particularly high where the proportion of R&D
in the private sector is low (David et al. 2000, David & Hall, 2000).
2.7. Other Effects on R&D
A range of other factors need to be taken into account in estimating the determinants
of private sector R&D intensity across OECD countries. While our proposed study
will use data aggregated at the national level (disaggregated data allowing consistent
comparison across countries is rarely available) it is useful to look at the results of
firm level and industry level studies. These provide clues on the mechanisms by
which aggregated variables might have their effects, what controls should be
included in estimating equations, and possible sources of endogeneity and omitted
variable bias.
Becker and Pain (2003) survey the firm level evidence. The evidence on the
importance of access to internal finance – sometimes proxied by profits, cash flow,
current sales or debt ratios - is mixed. Hall (1992) and Himmelberg and Petersen
(1994) find that cash flow has a significant effect on R&D expenditure.9 Bond et al.
(2003) find that for British firms the effect is on the decision to undertake R&D, but
9 Guellec and Ioannidis (1997) claim that evidence shows R&D expenditures are financed primarily by a firm’s cash flow.
9

not on the level. For German firms there is no effect.10 The possible importance of
internal finance suggests that at the aggregate level, private sector R&D
expenditures may be pro-cyclical – though Himmelberg and Petersen (1994) report
that firms respond more to permanent rather than transitory movements in cash flow.
Guellec and Ioannidis (1997) suggest that adjustment costs and sunk investments
may dampen the cyclicality of R&D effort and note that R&D is less volatile than
physical investment, but more volatile than GDP.
As noted above, empirical evidence suggests that increased competition, controlling
for other factors, has a positive effect on R&D. Bassanini and Scarpetta (2002)
summarise this evidence, and suggest that competition policy and product market
regulation will influence private sector R&D intensity. In similar vein, Scarpetta and
Tressel (2002) find that the effects of product market regulation on economic growth
appear to be mediated through R&D intensity. Becker and Pain note that this is
consistent with theoretical models that emphasise the extent to which R&D might be
used as a defensive strategy in response to greater competition.
Bassanini and Ernst (2002) provide some econometric evidence that R&D effort in
countries with co-ordinated industrial relations regimes will depend on the strength of
employment protection regulation. The underlying idea is that where industrial
relations are co-ordinated, stronger employment protection legislation will make firms
focus on cumulative technologies with a specific knowledge base where advances
will not entail large adjustments to the labour force. On the other hand, countries
with decentralised industrial relations regimes will favour specialisation in industries
with a knowledge base characterized by low specificity, low cumulativeness and
large scope and accessibility.11
Skilled human capital is a complement to firms’ R& D intensity (Griffiths, 2000;
Becker and Pain, 2003). Consistent with this finding, the location of a firm near
relevant research institutions, its human capital and business linkages with research
10 In a review of related evidence, Hall (2002) argues that small firms in R&D intensive industries face a higher cost of capital than their larger competitors, which explains the existence and focus of the venture capital industry. High returns in that industry despite considerable entry “suggest a high required rate of return in equilibrium.” She argues for more study of the effectiveness of alternative instruments, and how they are influenced by country specific institutional factors. 11 Becker and Pain (2003) report evidence that higher unionisation has a negative association with R&D intensity, but controls for other firm and industry characteristics render this insignificant.
10

intensive partners affects firm R&D intensity positively. These effects depend on the
nature of the industry in which a firm is located. Nelson (1986) documents a complex
relationship between firm R&D and universities and technical societies. Universities
provide both skilled human capital, and the outcomes of research – the relative
importance of these vary by industry and the type of technology involved. Acs et al.
(1994) suggest that innovation in small firms (as measured by new products) is
influenced by spillovers from universities and larger firms. On the other hand, Irwin
and Klenow (1996) find that participation in an R&D consortium reduced individual
firm R&D expenditure, presumably because duplication was reduced. 12
A limited amount of evidence (reviewed in Becker and Pain, 2003) suggests that the
presence of foreign-owned multinational firms reduces the R&D intensity of domestic
firms. This may possibly be because a reduction in scale of production in domestic
firms reduces profitability, and outweighs any positive spillover effects.
Lederman and Maloney (2003) use cross country panel data to investigate patterns
of R&D investment “across the development process”. In this study, R&D includes
both public and private; the panel covers both the developed and the developing
world.13 It takes path dependency into account, building on Blundell et al’s (1995)
finding (at the firm level) that past R&D effort influences current effort. They find that
returns to R&D are higher for developing countries, but they invest less. Differences
in financial depth, protection of intellectual property rights, ability to mobilize
government resources (proxied by government expenditure as a proportion of GDP),
and research institution quality appear to account for much of the shortfall.
2.8. Determinants of Patenting
Furman, Porter and Stern (FPS, 2002) examine determinants of patenting at a
national level. International patents are used as a measure of a nation’s innovative
capacity. Specifically, they examine the determinants of the number of USPTO14
12 See also Jaffe (1989); Acs et al. (1992); Jaffe et al. (1993); Adams, Chiang and Jensen (2000) and Adams, Chiang and Starkey (2000) for evidence of spillovers among firms and institutions. 13 The full panel is 127 countries, but analyses are for subsets of between 30 and 80 because of missing data. Lederman and Maloney note “There are few studies of the determinants of R&D across countries. Two such studies (Varsakelis 2001; Bebczuk 2002) suffer from small samples and, as [a] result, inconsistent estimates due to inability to deal with country-specific effects and endogeneity of the explanatory variables.” 14 United States Patent and Trademark Office.
11

patents granted to investors from a particular country. Their dataset covers 17 OECD
countries annually from 1973 to 1996. They posit that a number of complementary
factors are required within a country to produce high levels of innovation, reflected in
patent activity. Three categories of innovation determinants are important in their
framework.
First, they consider the resources available for innovation. Resources include the
initial level of technological sophistication of a country, the human capital and
financial resources available for R&D activity, and specific resource commitments
such as investment in education and training, and R&D tax policies. FPS also include
policies that support the commitment of resources to R&D, such as intellectual
property protection and openness to international trade in this category. These are all
principally macroeconomic and/or policy factors; their relationship with innovation is
closely linked to mechanisms posited in endogenous growth theories (Aghion and
Howitt, 1998).
Second, FPS consider the cluster-specific innovation environment, emphasising the
microeconomic decision-making of firms. Innovation within firms may depend on the
spillovers and competition arising from clusters of related firms within a country. Thus,
national innovation capacity may be higher in an economy with greater industrial
clustering of firms than in a more diverse economy, even where the macroeconomic
situations are similar.
Third, FPS emphasise the importance of high quality linkages between the broader
innovation infrastructure and the activities of industrial clusters. Institutions such as
universities or other effective (public or private) research establishments may be
important in this light.
FPS test their conceptual framework by estimating the impact of these three
categories of innovation determinants on national patenting outcomes. Their
preferred estimates indicate that each of the following factors impact positively on
patent activity: GDP per capita, number of scientists and engineers, aggregate R&D
expenditures, the share of GDP spent on higher education, strength of intellectual
property protection, and openness to international trade and investment (each
resource-related variables); the percentage of R&D funded by private industry and an
12

innovative output concentration index15 (cluster-specific innovation determinants);
and the percentage of R&D performed by universities (a linkages variable).
Gans and Stern (GS, 2003) extended the FPS dataset to apply to 29 countries over
1980-2000 with very similar variables.16 Most coefficient estimates remained similar;
however, the openness and output concentration variables were no longer significant.
Both FPS and GS used the log of patents (LPATENTS) as their dependent variable.
This variable is not scale-neutral since large countries tend to have a large value of
LPATENTS; the same occurs for a number of their other variables, resulting in a form
of multi-collinearity. An alternative approach (that we adopt later in this paper) is to
“deflate” all variables by some scale variable, such as population, to give per capita
variables. A separate population variable can be included to test whether scale
effects have an independent influence on patenting activity.
One issue that affects interpretation of the FPS (and GS) results is that their
approach is largely associative. If a country has firms that are particularly good at
discovering new patent opportunities, its level of R&D expenditure and proportion of
people employed in the R&D sector will tend to be high. This will yield a positive
correlation between R&D activity and patenting, but the direction of causality is
indeterminate. In order to gain a stronger insight into the causal direction, an
instrumental variables approach can be adopted in which R&D activity, and other
potentially endogenous variables, are first instrumented by variables considered to
be exogenous to patent outcomes.
This is the approach taken by Bosch et al (2004). Using a linear feedback model, and
log linear GMM estimation, they confirm at the country level the finding of a strong
relationship between expenditures in R&D and innovation output measured by US
patents granted. Their results give a unitary elasticity, or constant returns to scale, for
the OECD countries sampled. This contrasts with some firm level estimates of
decreasing returns to scale (Blundell, Griffith, & Windmeijer, 2002), implying that
there may be spillover effects of R&D beyond the firm.
15 Relative concentration of innovative output in chemical, electrical and mechanical USPTO patent classes. 16 Gans and Stern use, as their dependent variable, the number of patents by year of application; FPS use the number of patents by year of approval, lagged three years. The two variables are similar given the time normally taken for USPTO to approve patents.
13

Building on the work of Lederman and Maloney (2003), the authors initially regress
the number of US patents granted on national R&D spending, value of trade with the
US, endowment of natural resources, lagged patents, and GDP per capita. Later they
add years of education, quality of academic institutions, intellectual property rights,
and level of collaboration between research & private sector, to capture facets of
National Innovation Systems. The initial variables, plus education, are the only ones
that remain significant, and account for much of the difference between patenting
levels across income groups.
Each of the FPS, GS and Bosch et al studies incorporate variables that may typically
be important for many countries. However, their specifications may exclude some
factors that could be important for small distant countries. Their approaches may
therefore be supplemented by other variables related particularly to such countries.
Each of these variables may be considered within one or more of FPS’s three
categories of patent determinants. Four candidates stand out.
The first candidate is distance of the country from major world markets, a linkages
variable. Holding other factors constant, there is evidence to suggest that greater
distance from a country to major markets (especially USA, Europe and Japan) is a
factor in reducing innovative activity (Coe and Helpman, 1993).
The second candidate is population size (a cluster-related variable). As suggested by
Romer, the amount and efficiency of innovation activity may depend on the
population over which discoveries can be leveraged. This motivation may mean that
an interaction between population size and distance could be important; population
size in a small country that is distant from major world centres may have a different
impact on innovation than population size in a small country at the heart of Europe.
The third candidate is firm size. Large firms, on average, are more involved in R&D
activity than are small firms (Baumol, 2002). Whether firm size is relevant to the
transformation of R&D into patents depends on whether there are internal economies
of scale in R&D activity. Lanjouw and Schankerman (2004) produce evidence
indicating that small firms are handicapped in using patents to protect international
property as a result of costly litigation processes. If there are increasing returns
arising from such factors, a country with a predominance of small firms will tend to
14

have lower patenting activity than a country with a predominance of larger firms. A
proxy for average firm size within a country may therefore be significant in relation to
clustering activity.
The fourth candidate is information on the industrial structure of a country. Countries
that are heavily reliant on agriculture may have relatively low patenting activity.
Patenting may also be more important for manufacturing than for services, or for
certain types of manufacturing, even for a given R&D input (Schankerman, 1998;
Mazoyer, 1999; Nicoletti et al 2001). Thus the proportions of each of agriculture and
manufacturing in the economy may be a relevant component within the clustering
category.17
17 Levin et al (1987) find that patenting is a considerably more important form of IP protection in some industries (e.g. pharmaceuticals) than in others (e.g. aircraft manufacture). Brand name recognition and speed to market can be at least as important as patenting in protecting IP in certain cases. Using New Zealand unit record data, Fabling and Grimes (2004b) find that patenting activity is low amongst firms in the agriculture, fishing and forestry sector relative to firms in each of the manufacturing and services sectors.
15

3. R&D Expenditure & Patent Activity: Reduced Form Determinants
Using Krugman's (1993) terminology, our survey indicates that a number of "first
nature" and "second nature" elements may impact on national innovation activities.
First nature elements comprise those that are irretrievably given - such as distance of
a country from other centres. Second nature elements are long-lasting characteristics
that can be taken as given for the policy-relevant horizon. Krugman gives population
size as an example of the latter.
Given the unusual nature of the New Zealand economy with respect to a number of
first and second nature characteristics, we are particularly keen to ascertain whether
these characteristics influence R&D and patenting outcomes. Four measures in
particular stand out from our survey: distance of a country from major economic
centres; national population size; the firm size distribution; and sectoral structure
(especially preponderance of natural resource based activities such as agriculture,
forestry and fishing). Of these elements, distance is irretrievably given, population is
determined by very long run forces and so too (to a large extent) is sectoral structure,
while firm size distribution exhibits long-lasting persistence across countries (likely
being determined, inter alia, by social attitudes, legislative arrangements, natural
endowments and geography).
We treat each of these four elements as exogenous over relevant time-frames in the
remainder of this paper (i.e. not determined by R&D and patenting outcomes within
the estimation horizon).18 We test the reduced form impacts of these elements on
both patenting outcomes and on total R&D activity. We also examine the reduced
form determinants of the split between privately and publicly funded R&D, which may
be influenced by these elements. For instance, ceteris paribus, government may
increase its R&D funding to make up for a perceived shortfall in private funding that
arises due to distance, scale or other of the elements examined.
18 We maintain the exogeneity of distance and population throughout this study. We have tested the exogeneity of sectoral structure (defined as AFF below) and the firm size distribution (defined as SELF below) in each of the patent, total R&D and private sector R&D share equations using a Wu-Hausman test with two separate sets of instruments. The first set comprises country and year fixed effects, current population, and each of AFF and SELF lagged 5 years. The second set comprises country and year fixed effects, current population and population lagged each of 3 and 6 years. In each case we reject endogeneity of AFF and SELF at the 5% level.
16
We note, however, the definitional problems encountered when splitting research into
publicly-funded and privately-funded categories. For instance, privately-conducted
R&D that is explicitly subsidised (funded) by government may be conceptually in the
same category as privately-conducted and privately-funded R&D that qualifies for a
tax break, but they may be categorised differently. For this reason, our major
concentration with regard to R&D is on the determinants of total R&D expenditures
(and the relationship of those expenditures to patents) with secondary interest in the
public-private R&D funding split.
We examine the reduced form determinants of three variables (for each country, j,
and each year, t):
LPATENTSPCj,t (log of) international patents per capita;
LR&D$PCj,t (log of) total real R&D expenditure per capita;
PRIVR&DFj,t proportion of total R&D funded by private industry.
Each of these measures is scale neutral; they do not vary directly according to the
size of the country. We express each of the variables (other than the ratio variable,
PRIVR&DF) in logarithmic form to be consistent with the estimation format in the next
section where this form allows estimation of elasticities. Appendix A describes the
sources of all data used in the study; Appendix B presents a graph of the 2000
values of each of the three dependent variables for each of our 22 countries.19
On the basis of our earlier survey, the four reduced form determinants tested (in a
multivariate framework) are:
DISTMINj minimum distance of country to USA, Japan, Germany;20
LPOPj,t (log of) country population;
AFFj,t share of total employment in agriculture, fishing, forestry;
19 Countries included are: Australia (AA), Austria (AI), Belgium (BE), Canada (CA), Denmark (DE), Finland (FI), France (FR), Germany (GE), Greece (GR), Iceland (IC), Ireland (IR), Italy (IT), Japan (JA), Netherlands (NE), New Zealand (NZ), Norway (NO), Portugal (PO), Spain (SP), Sweden (SE), Switzerland (SI), United Kingdom (UK), and United States of America (US). Some (especially survey) data is extrapolated or interpolated as required; where this occurs, it is noted in Appendix A. 20 DISTMIN does not vary over time, hence the t subscript is omitted.
17

SELFj,t share of people who are self-employed.
DISTMIN measures the minimum distance of a country from one of the technological
leaders as cited by OECD (2003). We tested for non-linearities in the effects of
distance by adding quadratic and cubic terms for DISTMIN in each equation, but the
additional terms were not significantly different from zero when both were added to
the estimated equations.21 The population measure is entered in logarithmic form,
allowing scale elasticities to be estimated. AFF is our measure of sectoral
composition, reflecting the hypothesis that the share of employment in agriculture22 is
determined to a large degree by the natural characteristics of a country. SELF is our
measure of firm size distribution, which we consider to be determined in large part by
the cultural, legal and natural characteristics of a country. We consider that a country
with a high proportion of self-employed people will have a firm size distribution
skewed towards small firms, with relatively few large firms. AFF and SELF are each
expressed as ratio variables. The literature suggests that each of AFF (agricultural
predominance) and SELF (small firm size) may have a negative effect on measured
innovation. Appendix C presents a graph of the 2000 values of each of these
variables for each of our 22 countries.
Because our estimates in this section are of a reduced form nature, we cannot
interpret the resulting coefficients structurally. Nevertheless, the results help us to
understand whether certain innovation outcomes are associated with underlying
national characteristics. In turn, this helps us assess whether a country is an outlier
after accounting for these underlying characteristics.
In estimating each of the reduced form relationships, we obtain pooled ordinary least
squares estimates covering 22 developed countries for the period 1981-2001 (21
annual observations), giving a maximum 462 observations. In some cases, lack of
data availability across all countries reduces the number of observations slightly.
Autocorrelation is observed in the residuals, so all reported significance tests (in this
and the next section) are calculated using White period robust coefficient variance
estimates that are designed to accommodate arbitrary serial correlation and time-
varying variances in the disturbances.
21 Further tests for non-linear effects of distance are discussed below. 22 Henceforth "agriculture" is used to refer to "agriculture, forestry and fishing".
18

For each equation, we regress the variable of interest on the four terms listed above
plus a constant term with year fixed effects.23 The results are presented in Table 1,
column A for each variable.
Given that we are particularly interested in the effect of each variable in explaining
New Zealand's innovation performance, we perform a subsidiary equation in each
case that adds a country dummy for New Zealand (NZDum) to the reported equation.
We use this to test if New Zealand has a significantly different constant term. This
term (but not the whole equation) is reported in the line NZDum in each case.
New Zealand is an outlier for most of the explanatory variables included in each
equation. In 2001, New Zealand was the most distant country from world economic
centres, had the third highest share of people employed in agriculture (behind
Greece and Portugal), had approximately the second equal smallest population (with
Ireland, and after Iceland), and the fourth highest self-employment share (after
Greece, Portugal and Italy). Australia is also a major outlier on the distance
measure.24 It is possible that inclusion of these two countries distorts the results
given that they are such large outliers, especially with respect to distance. To test
robustness of the results to the inclusion or exclusion of these two countries, column
B for each variable presents estimates of the same relationship for the 20 countries
excluding Australia and New Zealand. We also estimate each equation including all
22 countries but with country dummies for Australia and New Zealand interacted with
the distance variable (which is the variable for which the two countries deviate most
sharply from developed country norms). The results are almost identical to the
column B results, indicating that the differences between the column A and B results
are driven by non-linear reactions to distance. The effects of these interaction terms
are reflected in our interpretation below.
There are strong similarities across the equations. Increasing distance reduces each
of patents, R&D expenditure and the share of that expenditure funded privately. The 23 Year fixed effects allow the constant term to differ each year according to worldwide factors that influence the dependent variable similarly across countries. We considered adding a full set of country fixed effects in addition to the year fixed effects. However, inclusion of country fixed effects makes it impossible to estimate the effect of variables that vary cross-sectionally but not over time (e.g. distance), and makes it difficult to estimate with any precision the effect of variables that vary principally cross-sectionally with relatively little time variation. 24 New Zealand's minimum distance to any of the 3 major centres is 5,781 kms while Australia's is 4,359 kms. No other country has a distance measure exceeding 1,600 kms.
19

effect is statistically significant with respect to R&D expenditure and the private R&D
share. Consistent negative effects are recorded for the agriculture share and for the
share of people who are self-employed. The AFF results are significant at the 1%
level for total R&D. The SELF results are significant at the 1% level for each of patent
and overall R&D activity. Population size has no significant relationship with any of
the variables (and other coefficients alter little if LPOP is dropped from each
equation).25
The New Zealand effects are particularly interesting. New Zealand is found to be a
statistically significant positive outlier for patent activity; the NZ coefficient is also
positive (but not statistically significant) with respect to total R&D expenditures and
the private R&D share. This evidence suggests that New Zealand is not a poor
performer for these three innovation-related variables once we control for distance,
industry structure and firm size.
The coefficients on DISTMIN each increase in absolute value (become more
negative) when New Zealand and Australia are dropped from the equation (column B
compared with column A). Other (significant) coefficients are much less affected. This
implies that the Australasian countries are not as negatively affected by distance as
the linear specification would imply. To test this explicitly, we re-estimated the column
A specification (i.e. 22 countries) with interactions of DISTMIN and each of New
Zealand and Australian country dummies (in the same equation). All estimated
coefficients are almost identical to those in the respective column B. The interaction
terms can be used to calculate the implied “economic distance” of each of the two
countries from the closest major innovation centre (based on the relationship
estimated for the other 20 countries).26 For the LR&D$PC equation, New Zealand
and Australia each have an implied economic distance from major centres of
approximately 1,500 kilometres, virtually identical to the actual distance of the third
most distant country. For PRIVR&DF, New Zealand’s implied economic distance is
25 If R&D and patenting contribute to GDP outcomes, we might expect that similar reduced form relationships would exist between GDP per capita and the four variables of interest. When we run the same reduced form regression for GDP per capita, we find all four coefficients are negative, although only SELF is significantly different from zero. A New Zealand dummy added to the GDP equation is not significantly different from zero. 26 When an interaction term is added for the third most distant country, it is not significantly different from zero (p=0.87 in the LR&DPC equation); the New Zealand and Australian dummies are each significant at the 20% level and are jointly significant at p=0.106.
20

1,900 kilometres while Australia’s is 1,400 kilometres; again similar to the third most
distant country.27 These results imply that distance from major centres has a
negative effect on R&D activity, but that once a country is 1,500-2,000 kilometres
away from a major centre, the negative distance effect reaches a plateau.
We also interacted distance with population size by entering the variable
DISTMIN/LPOP as an additional explanatory variable in the LR&D$PC equation, with
and without the New Zealand and Australian country dummies on DISTMIN. This
interaction was designed to test whether the negative effects of distance on R&D are
greater for small than for larger countries. No evidence of this increased negative
effect was detected in either specification; indeed the interaction term had a small
positive coefficient (significant at the 5% level in each case) contrary to this
hypothesis. Thus the negative effects of distance appear to be at least as strong for
larger countries as they are for smaller countries.
As a further robustness check, we interacted each of the four variables with a time
trend (TIME) to test whether any of the effects have become more or less important
over time. In the case of the private R&D share, the distance variable remains
negative but a significant positive coefficient is found on distance interacted with time.
This interaction implies that the negative distance effect on the private sector share
has become smaller over time. For total R&D, there is a significant interaction of time
with population. This interaction indicates a significant positive population effect at
the start of the sample that lessens over time (i.e. the coefficient on the interaction
term between population and time is significantly negative). No other significant time
interactions were found in either of the two R&D equations and no significant time
interactions were found in the patents equation. Overall, the lack of significant time
interactions indicates stability in the overall relationships.
27 We did not use the interaction terms in the LPATENTS equation since DISTMIN was not significantly different from zero at the 10% level in either specification in that case.
21

4. Determinants of Patent Activity
4.1. Modelling Patents
The reduced form estimates provide information on some of the underlying
determinants of R&D and patenting. However they do not provide information on the
relationship between the two, and hence on the transformation of R&D inputs into
innovation outputs (e.g. patents). Our aim here is to provide information on this
relationship building on earlier studies and taking into account factors that are
particularly relevant to small countries.
We model patent output as the outcome of a production function. The key resources
contributing to patents are labour personnel engaged in R&D and capital services
utilised in R&D. The efficiency with which these resources are converted into patents
may be affected by other variables, discussed further below. Our approach can be
interpreted as a formalisation of FPS's framework. Both approaches posit that
resources are crucial to patent outcomes. Our approach includes FPS's cluster and
linkages components as determinants of the efficiency with which R&D resources are
converted into patents.
Denote annual patents in a country as P, the country population as N and the
optimised bundle of real R&D capital services and R&D labour input as R. We adopt
the production function:
(P/N) = eφ(R/N)α (1)
We do not impose the constant returns to scale restriction (α=1) given the literature
indicating that R&D may be subject to increasing returns to scale. In specifying (1)
we assume that patent intensity (defined here as patents per capita) is related to
R&D intensity. If α=1, this form is identical to assuming that patents are related
proportionately to the amount of R&D expenditure.
However where α>1 (or if α<1), the decision of whether or not to specify (1) in per
capita terms is important. Consistent with the importance of clusters and linkages
emphasised by FPS, we hypothesise that the intensity of R&D is relevant to patent
intensity. For example, we hypothesise that $100million of R&D expenditure spread
over a population of 1 million people results in a greater number of patents than
22

$100million spread over a population of 2 million people. We can test an alternative
hypothesis that the "raw" amount of R&D expenditure determines patent numbers by
including a separate population term in our equations. If α>1, we would then find a
significant positive coefficient on population equal to α-1. If the population coefficient
is zero, the pure intensity specification, as in (1), holds; an intermediate value
indicates that some mixture of the two approaches is most appropriate.
The parameter, φ, is the efficiency parameter that may itself be a function of other
variables. One way of interpreting a significant non-zero coefficient on population
when added to (1) is that population size affects the efficiency with which R&D
intensity is transformed into patent intensity.
Since we are assuming that R is an optimised bundle of R&D inputs, other R&D
resources (e.g. R&D labour) should not be significant when added to (1). We can test
whether the ratio of total R&D expenditure to R&D labour input has a significant
effect when added to (1). If it does, our assumption that R&D expenditure
incorporates the optimal share of R&D labour inputs would be falsified. We test this
explicitly in our estimation. We can also test whether the allocation of R&D
expenditure between private and public sectors matters by including the term,
PRIVR&DF, used in section 3. A significant coefficient on this variable would indicate
that patent production depends on the share of R&D funding undertaken by the
private sector.
We express the patents equation in logarithmic form. In testing this functional form,
we include population, the private R&D funding share and the ratio of total R&D
expenditure to R&D labour input (testing the optimality of the R&D bundle) as in (2),
where L represents R&D labour input.
ln(P/N) = φ + αln(R/N) + βlnN + γPRIVR&DF + δ[ln(R/N)-ln(L/N)] (2)
In (2), we test the null hypotheses that β=0, γ=0 and δ=0. We also test whether α=1
(constant returns to scale). Finally, we test whether any other variables suggested
by the literature affect the efficiency parameter, φ.
The variables corresponding to the theoretical variables in (2) are as follows (where
prefix L denotes natural logarithm, and suffix PC denotes per capita):
23

LPATENTSPC No. of international patents
LR&D$PC Aggregate real R&D expenditures (PPP adjusted)
PRIVR&DF Percentage of R&D funded by private industry
LPOP Population
LR&DPPC Full-time equivalent employees involved in R&D
Variables that we consider as potential determinants of R&D efficiency (φ), based on
the surveyed literature, in addition to the last 3 terms of (2), are:
AFF Share of total employment in agriculture, fishing, forestry
AGEX Share of agricultural exports to total exports
AT Strength of anti-trust legislation (survey)
ATTITUDE Attitude to efficiency versus fairness (survey)28
DISTMIN Minimum distance of country to USA, Japan, Germany
IP Strength of intellectual property protection (survey)
MANU Share of total employment in manufacturing
MARKETCAP Ratio of country’s market capitalisation to GDP
OPENNESS Openness to international trade and investment
SCIENCE Attitude to scientific advancement (survey)29
SELF Share of people who are self-employed
AFF and MANU are included to test whether the aggregate transformation of R&D
into patents is affected by the economic structure of the country. AGEX, similar to
AFF, tests whether having a high share of exports that are agriculturally-based
provides an incentive or disincentive to convert R&D into patents; for instance, the
28 A low value is consistent with attitudes that favour economic efficiency and are less egalitarian. 29 A low value is consistent with positive attitudes towards scientific advancement.
24

presence of high agricultural trade barriers may affect patenting activity. The
incentive effect might arise if newly patented agricultural exports are not covered by
existing trade barriers; the disincentive effect might arise if the barriers apply to new
discoveries, making it uneconomic to patent new agricultural products. OPENNESS
is relevant to the decision of whether or not to create an international patent on a new
innovation no matter what the trade structure. AT and IP proxy legislative protections
relevant to patenting. ATTITUDE proxies for attitudes to economic efficiency (in
cases where efficiency may be in conflict with egalitarianism). These attitudes may
influence the dynamism with which innovation proceeds (e.g. through
commercialisation of discoveries); SCIENCE proxies for attitudes towards scientific
advancement that could be relevant to the climate for both patenting and R&D.
DISTMIN proxies for distance from major world economic centres that may affect the
transformation of R&D into patents. MARKETCAP is included to pick up effects of
firm size (economies with relatively large firm sizes tend to have a larger
MARKETCAP than countries with predominantly small firms) and it may also be
related to capital market development. 30 SELF provides a measure of firm size as in
section 3.
We test each of these variables in three different estimation formats, each with and
without country fixed effects. In all cases, as in section 3, we use White period
standard errors.
In our first format, we estimate (2) with all relevant variables initially included in φ. We
use ordinary least squares (OLS) in a panel framework with LPATENTSPC as the
dependent variable. We "test down" methodically, dropping insignificant variables
one at a time in order of least significance (highest p-value). Once we reach a stage
where all remaining variables are significant at 5%, we include each omitted variable
by itself in case the order of testing down has affected the decision to exclude any
variable. We include any variable that is significant at 5% and note separately any
variable that is significant at 10%.
The first variant of this approach includes period fixed effects but no country fixed
effects. The second variant adds country dummies (individual country fixed effects)
30 We tested two additional stock-market turnover variables to test for financial market development effects but neither was significant.
25

separately to the equation estimated in the first variant (plus the variables that are
significant at the 10% level when added to that equation). Once the sub-set of
individually significant country fixed effects is found, all of that sub-set is added and
the whole equation is "tested down" until only significant country fixed effects and
other variables remain. We again test for inclusion of other variables that may be
significant at the 10% level when added to the final equation.
Our second format follows the approach of the first format, but uses instrumental
variables (IV) estimation. As instruments we use the full set of period and country
fixed effects plus AFF, SELF and LPOP (as in section 3) plus ATTITUDE which we
consider to be a "second nature" element within a country. (We do not include
SCIENCE since attitudes to science could conceivably be determined by success in
patenting. DISTMIN is not included since the full set of country fixed effects is
included in the instrument set making other cross-section variables superfluous.)
Because we have a limited number of instruments, we start with the variables
estimated to be significant at the 10% level in the OLS equations and add other
potential variables one at a time to test for significance. We then include all such
variables and test down as before. In keeping with our OLS approach, we report two
variants of this format, firstly without any country fixed effects and secondly with
country fixed effects determined as before.
Our third format is based on a single stage cointegration framework. Our dependent
variable in these formats is ΔLPATENTSPC where Δ represents the annual change
in the variable. All variables tested previously are included in lagged form (lagged
once) together with the lagged value of LPATENTSPC. Additional lags of the
dependent variable are included where the dynamics indicate that this is appropriate.
Estimation is by OLS since no current variables appear in the equation; alternative
variants with and without country fixed effects are presented.
4.2. Levels Equation: OLS Results
Columns (1.1) and (1.2) of Table 2 present the estimates from the first and second
variants of the first format outlined above. Each are estimated by OLS, the first with
no country fixed effects and the second with country fixed effects. In each case,
moderately strong increasing returns to scale (of between 1.5 and 1.7) from R&D to
patenting are indicated. Further, we can reject the hypothesis that privately funded
26
and government funded R&D have identical patenting outcomes. The coefficient on
PRIVR&DF implies that one extra percentage point (p.p.) on the privately funded
R&D share increases per capita patents by approximately 1.5% - 1.7%.
Intellectual property protection is an important (positive) determinant of patenting in
each specification. This is a surveyed variable so the magnitude of the coefficient has
no direct interpretation. However we can give an indication of its importance, by
taking its value in each of the estimates (approximately 0.19) and applying this
coefficient to surveyed values of IP. The highest values for IP in 2001 are 9.09 (US)
and 8.76 (Switzerland); the lowest are 5.95 (Italy) and 5.96 (Portugal). If we set other
variables to their means, the effect of moving from a surveyed IP value of 6 to one of
9 is to increase patents (per 1,000 people) from 22 to 37 per annum (compared with
a mean of 29). Thus IP protection is estimated to have a material influence on the
transformation of R&D expenditure into patent activity.
The ATTITUDE variable is also estimated to affect the transformation of R&D into
patents. Given the variation in the data, the impact of this variable for the highest
relative to the lowest country observations is approximately half that of IP protection
(when estimated with country fixed effects). New Zealand and the United States have
attitudes that are most in line with economic efficiency, while Norway is an outlier in
terms of favouring egalitarian outcomes.
The finding that LPOP is not significant at 10% in (1.1) and has only a very small
positive coefficient in (1.2), implies that the intensity specification, as in (2), is
appropriate. The coefficient on the ratio of total R&D expenditure to R&D labour
inputs is not significantly different from zero; thus we do not reject the optimality of
the R&D bundle.
No variables are significant at 5% when added to the specification reported in
columns (1.1) and (1.2) of Table 2. AGEX is the only variable significant at the 10%
level when added to (1.1) while no variables are significant at 10% when added to
(1.2). The positive coefficient on AGEX in (1.1) provides some weak evidence that
patenting may be high relative to R&D in agricultural exporting countries, one
possible reason being to find a way around trade restrictions imposed on agricultural
commodity exports.
27

In the specification with country fixed effects, 8 country fixed effects are significant at
the 5% level. The effects are negative (lower patents than indicated by the other
variables) for Belgium, France and Portugal, and are positive for Canada, Finland,
Ireland, Italy and New Zealand. New Zealand has the second highest positive
country fixed effect; its significant positive coefficient is consistent with its significant
positive country dummy in the reduced form patents equation in section 3.
4.3. Levels Equation: IV Results
Using instrumental variables, we initially regress per capita patents against the five
variables found significant in (1.1) and/or (1.2) in Table 2 plus AGEX, which is
significant at 10% when added to (1.1). We add each other variable singly to test for
potential significance and then test down. No other variable is significant at 10%
when added to the initial set of variables, and testing down leads to the dropping of
LPOP and IP.
The resulting equation (without country fixed effects) is presented as (2.1) in Table 2.
Three of the variables estimated to be significant in the OLS version (without country
fixed effects) remain highly significant while AGEX is also significant at the 5% level.
Neither IP nor LPOP is significant at even 10% if included in place of (or as well as)
AGEX.
The equation with country fixed effects, (2.2) in Table 2, includes eleven country
dummies. It retains each of LR&D$PC, PRIVR&DF and ATTITUDE; IP is significant
once instrumented (and the coefficient increases materially relative to the OLS
estimates). The coefficient on ATTITUDE stays within the range estimated previously.
Neither AGEX nor LPOP is significant, even at the 10% level, when added; other
variables, including the ratio of total R&D expenditure to R&D employment inputs, are
similarly not significant at the 10% level.
Increasing returns to scale are again exhibited in these estimates, although the
magnitude is considerably smaller than with the OLS estimates. This reduced
magnitude indicates simultaneity (reflected in the OLS estimates) between patent
outcomes and R&D expenditure decisions.
28

Simultaneity also appears to have affected the estimates for the impact of
PRIVR&DF. The effect of the private funding share on patent outcomes is much
higher in the IV estimates, both with and without country fixed effects, than in the
OLS estimates. This may be due to government reactions to domestic innovation
outcomes. If a country has a low level of patenting, government may increase its own
R&D expenditure, lowering the value of PRIVR&DF. An OLS estimate of patents on
PRIVR&DF will then find a "low" coefficient since low patents will be associated with
low values of PRIVR&DF. Once the latter variable is instrumented, the simultaneity
effect disappears and the coefficient rises.
Six country fixed effects are negative in (2.2), (Austria, Belgium, France, Germany,
Portugal and Switzerland) while five are positive (Canada, Italy, Japan, New Zealand,
United Kingdom). The finding that New Zealand is a positive outlier for patenting,
conditional on other variables, is consistent with previous estimates.
4.4. Change-Form Equation
In Table 3, we present the estimates with ΔLPATENTSPC as the dependent variable
and with each explanatory variable lagged one period. The lag of LPATENTSPC is
included to allow for a long run relationship between the variables, and the first lag of
ΔLPATENTSPC is included to allow for dynamic adjustment to the long run.31
Column (3.1) presents the results without country fixed effects; column (3.2) presents
the results with country fixed effects. We present the estimated coefficients and the
implied long run coefficients (in bold).32
In each case, we started with the variables found significant in at least one of the
equations reported in Table 2, added variables (including country fixed effects in the
second variant) one at a time to these variables, found the set of variables that were
significant at 10% and tested down to a structure that retained variables significant at
the 5% level. We then repeated the process, if necessary, until it converged to a
stable set of variables. No variable is significant at even the 10% level when added to
either of the equations in Table 3.
31 Extra lags of ΔLPATENTSPC were tested but were not significantly different from zero at the 10% level. 32 The long run coefficients are obtained by setting changes to zero and equating levels of current and lagged variables. Thus the long run coefficient is found by dividing the coefficient on the lagged explanatory variable by the negative of the coefficient on LPATENTSPCt-1.
29

Without country fixed effects, the only significant explanatory variable (other than
lags of the dependent variable) is lagged total R&D (LR&D$PC). The implied long run
coefficient indicates considerable increasing returns to scale, with a value close to
two.33 The adjustment speed in this equation is very slow with only 9% of adjustment
occurring one year following a change in R&D expenditure.
Adding country fixed effects changes the speed of adjustment substantially, with
almost 40% of adjustment occurring after one year. The equation, (3.2), also
indicates a more complex set of variables influencing patent outcomes.
The long run returns to scale parameter is now estimated at 1.24 identical to its value
in the IV levels equation with country fixed effects. IP protection is estimated to be
important with a long run coefficient of around 0.2, similar to its value in the previous
OLS equations, but below that in the IV equation with country fixed effects.34 Two
variables that were included in our reduced form work are highly significant here.
Greater distance from major markets is estimated to reduce patenting as does a
higher share of self-employment (i.e. small firm size). These variables are estimated
to affect the transformation of R&D expenditure into patents, as well as having a
negative effect on R&D expenditure (from Table 1).
The equation includes country fixed effects for 12 countries. Four of the fixed effects
are negative (France, Netherlands, Norway, Portugal), the remainder being positive
(Australia, Canada, Finland, Ireland, Italy, Japan, New Zealand, USA). New Zealand
has the largest positive country fixed effect, again indicating out-performance for
patent outcomes given the factors determining patents internationally.
The finding that no other variable is significant in (3.2) when added to the equation is
consistent with our earlier findings that the bundling together of inputs within R&D
expenditures is optimal and that the intensity specification of our production function
33 We have re-estimated the equation with longer lags of the explanatory variables (up to three years) and the results are little changed. 34 We also tested whether IP2 is significant in this and previous equations. to examine whether “too high” a level of IP protection is negative for overall innovative activity by limiting potential spillovers (Levin et al, 1987). In 3 of the 4 equations in Tables 2 and 3 that include IP, the IP2 term is not significant (p varies from 0.76 to 0.95); in equation (2.2) the variable is significant (p=0.04) but is positive. Thus we do not detect evidence that existing levels of IP protection in any country has reached the stage where it is negative for patenting outcomes.
30

is appropriate. However the finding is at odds with our levels estimates that privately
funded R&D produces more patents than does government funded R&D.
Another way to specify the two variables LR&D$PC and PRIVR&DF is to interact
them to produce a variable for (the log of) privately funded R&D per capita and one
for (the log of) government-funded R&D per capita. When the lags of these two
variables are included in (3.1) and (3.2) in place of lagged LR&D$PC, we find that the
coefficient on private R&D is 60% higher and 26% higher respectively than that on
government R&D. A Wald test rejects the null hypothesis that the coefficients are
identical. This result is consistent with the findings reported in Table 2.
4.5. Patent Determination Results: Summary
We have presented six equations based on three different estimation techniques,
each with and without country fixed effects. The results with country fixed effects are
more comprehensive than those without fixed effects. The levels IV equation [(2.2) in
Table 2] and the change-form equation [(3.2) in Table 3] use more robust estimation
techniques than do the levels OLS equations. In our interpretation, we therefore
concentrate on the results in (2.2) and (3.2).
Each equation implies that there are increasing returns to scale in converting R&D to
patents; these increasing returns are moderate, with a returns to scale parameter of
approximately 1¼. Privately funded R&D, explicitly in (2.2) and implicitly in (3.2), is
found to contribute more strongly to patents than does publicly funded R&D. We
cannot reject optimality of the mix of R&D expenditure between R&D employees and
other forms of R&D expenditure.
Our results point strongly to R&D intensity being important for patent outcomes,
rather than R&D expenditure per se. Thus relatively concentrated R&D (per capita) is
relevant to patent outcomes; if the same amount of R&D is spread over a larger
population, it loses its effectiveness (in an increasing returns to scale world) in
producing patents. This concentration result may be related to the impact of firm size
in (3.2); having a higher number of self-employed people (consistent with small
average firm size) is related to poorer patent outcomes relative to R&D inputs. This
finding is consistent with the work of Baumol and others who find that R&D tends to
be most effective when performed by large oligopolistic firms. The negative effect of
31
distance on patenting relative to R&D input is also consistent with a concentration
interpretation. Firms in a country that is distant from major world markets may lack
the concentrated home (or near-home) markets that enable them to commercialise
R&D-driven discoveries to the same extent as firms in (or nearer to) larger markets.
A rigorous IP protection regime is found to be conducive to turning R&D into patents
according to almost all our estimates. While having an agricultural base may be
negative for R&D expenditures (see Table 1) it may induce a higher rate of
transformation of R&D into patents in nations with high proportions of agricultural
exports. One reason for this may be the incentive to patent goods that can escape
agricultural trade restrictions. Finally, the efficiency of the transformation of R&D
expenditure to patents may be related to general attitudes towards efficiency in a
country.35
35 However we only find this effect in the levels specifications and not in the change-form specification, making its robustness uncertain.
32

5. Conclusions
The purpose of this study was to analyse the determinants of national R&D and
patenting activity. We were motivated by the recognition that R&D is important both
for the performance of individual firms and for the performance of national economies.
Patenting is a manifestation of R&D activity that leads to tangible economic
outcomes. New Zealand has very low rates of expenditure on R&D (particularly
private sector R&D) and has low rates of international patent activity per capita
relative to other developed countries. It is a small, distant country, heavily reliant on
agriculture, with high rates of self-employment and very few large firms. Most of
these factors are hypothesised to impact on R&D and patent activity across countries,
but have hitherto received little attention in empirical work.
In contrast to most other studies, we have been particularly concerned to account for
the impact of country size, firm size, distance from major economic centres, and
industrial structure on R&D and patenting. Our reduced form estimates indicate that
R&D (especially private sector R&D) is negatively affected by distance of a country
from major world centres. A preponderance of small firms has a strong negative link
with both R&D expenditures and patent outcomes, while a heavy reliance on
agriculture is particularly negative for R&D expenditures. Population size is found to
have no impact on each of these outcomes.
Our estimation of a patent production function implies that there are increasing
returns to scale in converting R&D to patents. Privately funded R&D contributes more
strongly to patenting than does publicly funded R&D. Having a high ratio of self-
employed people (small average firm size) is related to low patent outcomes for a
given level of R&D inputs, and we also find a negative impact of distance on
patenting for given R&D inputs. The efficiency of transforming R&D expenditures into
patents is assisted by having a rigorous IP protection regime and may also be
related to general attitudes towards efficiency in a country. A high ratio of agricultural
exports may also induce a higher rate of transformation of R&D into patents, possibly
to escape agricultural trade restrictions.
Ultimately, the motivation for this study is to inform policy directed towards lifting
national R&D and patenting performance. Our results indicate that it is important for a
33

country to have a well-functioning IP protection regime to induce firms to turn R&D
into patents. Increasing returns to scale to R&D, particularly if these arise as a result
of spillovers between firms (as posited by FPS with cluster and linkage effects), may
provide a rationale for public policy to encourage private R&D. In particular, private
sector R&D appears to be more productive, on average, than does public sector R&D
in producing patents. Policy directed towards raising levels of private sector R&D (or
at least removing any penalties on it) may be considered. Our results indicate that
any such encouragement for private sector R&D may be most appropriate at a
generic level rather than through specific training of R&D personnel given that the
chosen input mix within R&D expenditures appears appropriate across countries.36
Overall, our research finds that a distant country with an agricultural base and small
average firm size is likely to have relatively low levels of R&D. The more distant it is
from major world markets, the more likely it is to have a low ratio of privately funded
to publicly funded R&D. Patenting outcomes are driven with increasing returns by
R&D inputs, and such countries are therefore also likely to "under-perform" in terms
of patents per capita.
Despite such handicaps, supportive policies for R&D can help mitigate some of these
effects on patenting outcomes. It is important to have an appropriate degree of IP
protection in place. Policies that favour small firms and/or firms in low R&D-intensive
sectors relative to larger firms and/or firms in high R&D-intensive sectors may act to
diminish a country's R&D and patent performance.
Finally, financial support for R&D (especially private sector R&D) may be appropriate
in the presence of economy-wide increasing returns to R&D stemming from spillovers
between firms. Our aggregate research cannot disentangle whether the increasing
returns of patents with respect to R&D expenditure arises from intra-firm or from
inter-firm effects. Further research into this aspect, using firm level data, would be of
major assistance in evaluating the merits of fiscal incentives for private sector R&D.
36 Idiosyncratic country features may, however, point to specific sub-optimal outcomes that require country-specific remedies.
34

Tables
Table 1: Reduced Form Equations*
Dependent Var: LPATENTSPC LR&D$PC PRIVR&DF
Equation Form: A B A B A B
DISTMIN -0.0149 [0.856]
-0.6490 [0.104]
-0.0551 [0.019]
-0.2450 [0.087]
-0.0379 [0.000]
-0.1380 [0.003]
LPOP 0.1099 [0.226]
0.0522 [0.592]
0.0114 [0.798]
-0.0094 [0.837]
0.0111 [0.516]
-0.0008 [0.958]
AFF -7.9379 [0.093]
-6.0660 [0.254]
-6.2156 [0.001]
-5.6751 [0.009]
-0.5748 [0.430]
-0.3385 [0.601]
SELF -13.1269 [0.003]
-13.2446 [0.005]
-4.7621 [0.002]
-4.7665 [0.004]
-0.5494 [0.341]
-0.5105 [0.307]
Adj. R2
N 0.732 457
0.756 415
0.841 441
0.846 402
0.466 441
0.468 402
NZDum (when added)
1.3072 [0.010]
0.2658 [0.170]
0.0910 [0.295]
* Form A includes all 22 countries (with no country dummies). The figures for NZDum show the coefficient, and its associated p-
value, on a New Zealand dummy when added to form A. Form B is for 20 countries (i.e. excluding Australia and New Zealand).
35

Coefficients on DISTMIN are multiplied by 1000. All equations are estimated over 1981-2001 using all available (annual)
observations. Each equation contains a constant and year fixed effects (not reported).
P-values of estimates are in brackets using White period standard errors. Variables are defined in section 3.
36
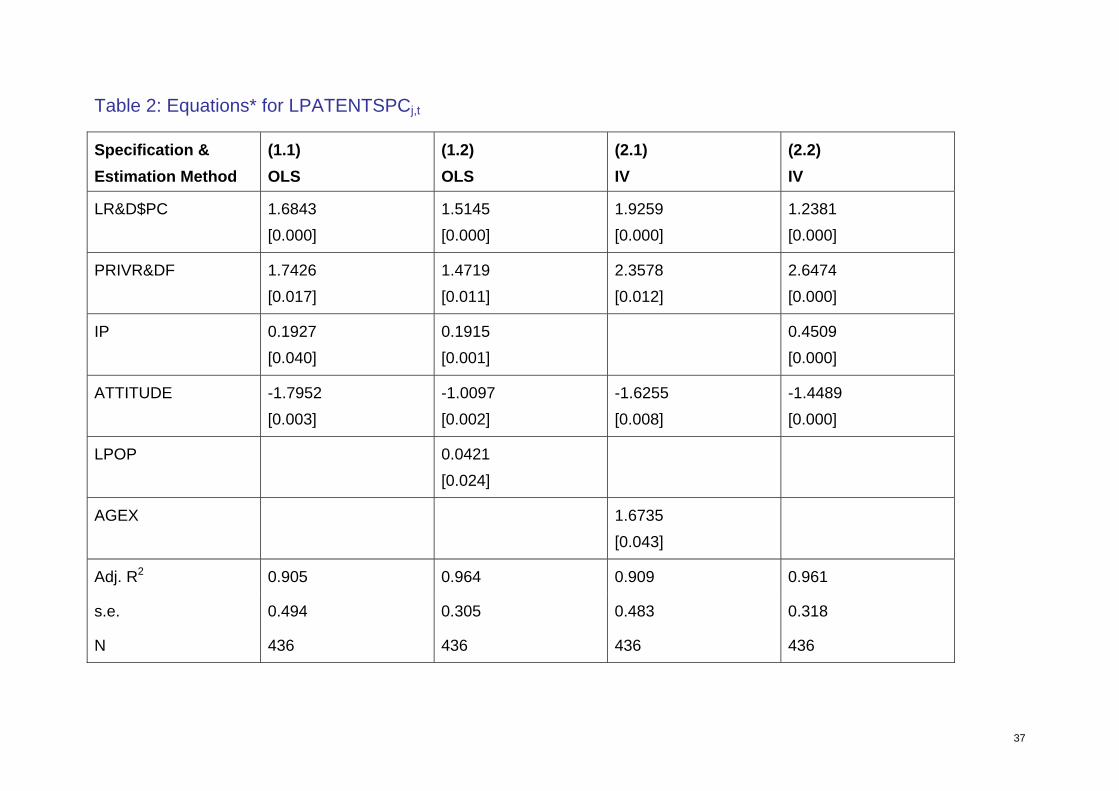
Table 2: Equations* for LPATENTSPCj,t
Specification & Estimation Method
(1.1) OLS
(1.2) OLS
(2.1) IV
(2.2) IV
LR&D$PC 1.6843 [0.000]
1.5145 [0.000]
1.9259 [0.000]
1.2381 [0.000]
PRIVR&DF 1.7426 [0.017]
1.4719 [0.011]
2.3578 [0.012]
2.6474 [0.000]
IP 0.1927 [0.040]
0.1915 [0.001]
0.4509 [0.000]
ATTITUDE -1.7952 [0.003]
-1.0097 [0.002]
-1.6255 [0.008]
-1.4489 [0.000]
LPOP 0.0421 [0.024]
AGEX 1.6735 [0.043]
Adj. R2 0.905 0.964 0.909 0.961
s.e. 0.494 0.305 0.483 0.318
N 436 436 436 436
37

All equations estimated for 22 countries over 1981-2001 using all available observations. White period standard errors are used to
calculate p-values (p-values in square brackets). Each equation contains a constant and year fixed effects (not reported).
Equations (1.1) and (2.1) include no country fixed effects; equations (1.2) and (2.2) contain a subset of country fixed effects
determined as outlined in section 4. OLS indicates pooled ordinary least squares estimation; IV indicates pooled instrumental
variables estimation (instruments: SELF, AFF, LPOP, ATTITUDE, and the full sets of country and year fixed effects).
38
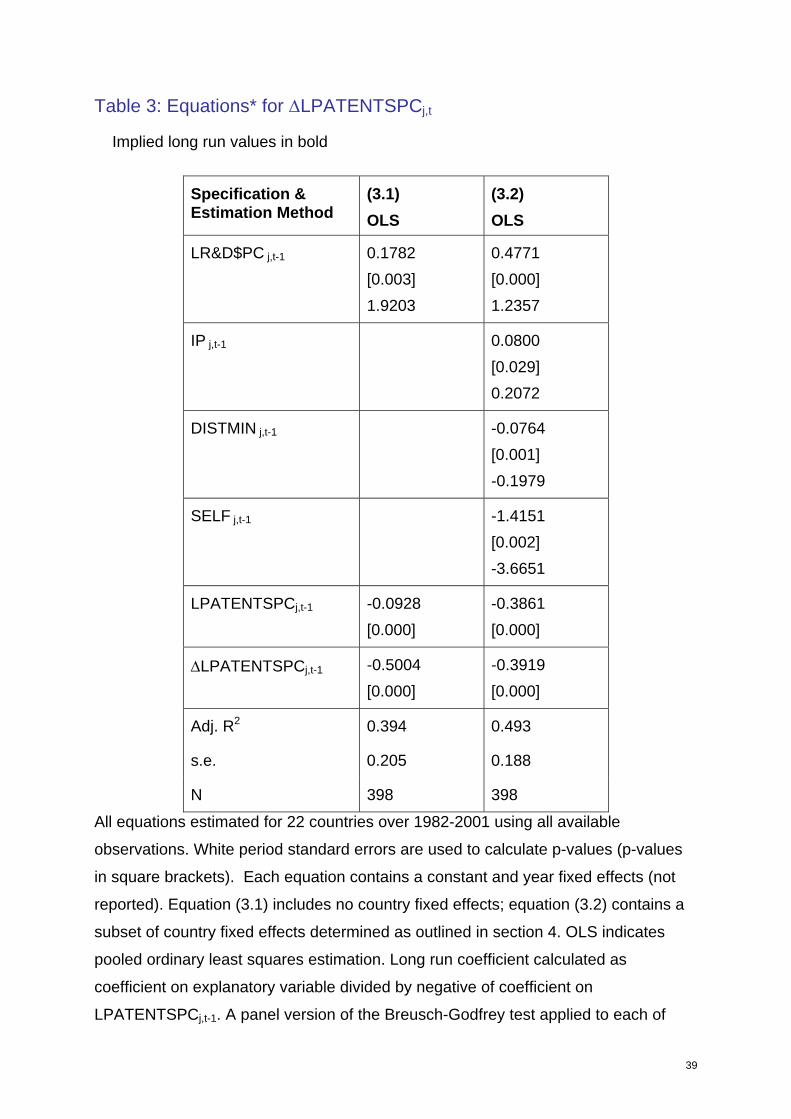
Table 3: Equations* for ΔLPATENTSPCj,t
Implied long run values in bold
Specification & Estimation Method
(3.1) OLS
(3.2) OLS
LR&D$PC j,t-1 0.1782 [0.003] 1.9203
0.4771 [0.000] 1.2357
IP j,t-1 0.0800 [0.029] 0.2072
DISTMIN j,t-1 -0.0764 [0.001] -0.1979
SELF j,t-1 -1.4151 [0.002] -3.6651
LPATENTSPCj,t-1 -0.0928 [0.000]
-0.3861 [0.000]
ΔLPATENTSPCj,t-1 -0.5004 [0.000]
-0.3919 [0.000]
Adj. R2 0.394 0.493
s.e. 0.205 0.188
N 398 398
All equations estimated for 22 countries over 1982-2001 using all available
observations. White period standard errors are used to calculate p-values (p-values
in square brackets). Each equation contains a constant and year fixed effects (not
reported). Equation (3.1) includes no country fixed effects; equation (3.2) contains a
subset of country fixed effects determined as outlined in section 4. OLS indicates
pooled ordinary least squares estimation. Long run coefficient calculated as
coefficient on explanatory variable divided by negative of coefficient on
LPATENTSPCj,t-1. A panel version of the Breusch-Godfrey test applied to each of
39

(3.1) and (3.2) indicates no significant first order autocorrelation at the 5% level in
either case.
40

References
Acs, Zoltan J., David B. Audretsch and Maryann P. Feldman (1992) "Real effects of
academic research: Comment." American Economic Review 82: 363-367.
Acs, Zoltan J., David B. Audretsch and Maryann P. Feldman (1994) "R&D spillovers
and recipient firm size." The Review of Economics and Statistics 100(21): 336-345.
Adams, James D., Eric P. Chiang and Katara Starkey (2000) "Industry-university
cooperative research centers." Cambridge MA, National Bureau of Economic
Research, NBER Working Paper No. 7843. <http://www.nber.org/papers/w7843>
Aghion P and P Howitt (1998) Endogenous Growth Theory, Cambridge Mass: MIT
Press
Aghion, Philippe, Christopher Harris, Peter Howitt and John Vickers (2001)
"Competition, imitation and growth with step-by-step innovation." Review of
Economic Studies 68(3): 467-492.
<http://www.kellogg.northwestern.edu/faculty/Yeltekin/htm/macro/Innovation.pdf>
Aghion, Philippe, Nicholas Bloom, Richard Blundell, Rachel Griffith and Peter Howitt
(2003) "Competition and innovation: An inverted U relationship." London, Institute for
Fiscal Studies, Mimeo. <http://www.ifs.org.uk/staff/abbgh0703.pdf>
Alesina, Alberto (2003) "The size of countries: Does it matter?", Journal of the
European Economic Association 1(2), 301-316.
Allen RC (1983) “Collective Invention”, Journal of Economic Behaviour and
Organisation 4, 1-24
Arrow KJ (1962) “The Economic Implications of Learning by Doing”, Review of
Economic Studies 29, 155-173
Audretsch, David B. and Maryann P. Feldman (2004) "Knowledge spillovers and the
geography of innovation" in J. Vernon Henderson & Jacques Thisse (eds.) Handbook
of Urban and Regional Economics, Volume 4, Amsterdam: North-Holland
41

Bassanini, Andrea, Scarpetta, Stefano, Hemmings, Philip (2001) "Economic Growth:
the role of policies and institutions. Panel data evidence from the OECD countries."
Paris, OECD, Economics Department Working Paper No 283.
<http://www.oecd.org/pdf/M00002000/M00002525.pdf>
Bassanini, Andrea and Ekkehard Ernst (2002) "Labour market regulation, industrial
relations and technological regimes: a tale of comparative advantage." Industrial and
Corporate Change 11(3): 391-426.
Bassanini, Andrea and Stefano Scarpetta (2002) "Growth, Technological Change,
and ICT Diffusion: Recent Evidence from OECD Countries." Oxford Review of
Economic Policy 18(3): 324-344.
Baumol W (2002) The Free-Market Innovation Machine: Analysing the Growth
Miracle of Capitalism, Princeton: Princeton University Press
Bebczuk, Ricardo N. (2002) "R&D expenditures and the role of government around
the world." Estudios de Economia 29(1): 109-121.
<http://www.econ.uchile.cl/ede/v29-1-f.pdf>
Becker, Bettina and Nigel Pain (2003) "What determines industrial R&D expenditure
in the UK?" London, National Institute of Economic and Social Research, Working
paper. <http://www.niesr.ac.uk/pubs/dps/dp211.pdf>
Bloom, Nick, Rachel Griffith and John van Reenen (2000) "Do R&D tax credits work?
Evidence from an international panel of countries 1979-1994." London, Institute for
Fiscal Studies, IFS Working Paper Series No. W99/8.
Blundell, Richard, Rachel Griffiths and John Van Reenen (1995) "Dynamic count
data models of technological innovation." Economic Journal 105: 333-344.
Blundell, Richard, Rachel Griffith and John Van Reenen (1999) "Market share,
market value and innovation in a panel of British manufacturing firms." Review of
Economic Studies 66: 529-554.
42

Bond, Stephen, Dietmar Harhoff and John Van Reenen (2003) "Investment, R&D and
financial constraints in Britain and Germany." London, Institute for Fiscal Studies, IFS
Working Paper Series No. W99/05 (updated October 2003)
Bosch, Mariano, Daniel Lederman & William Maloney (2004) "Patenting and R&D: A
Global View", Washington DC: World Bank, mimeo
Cameron, Gavin (1998) "Innovation and growth: A survey of the empirical evidence."
Oxford, Nuffield College, Working Paper.
<http://hicks.nuff.ox.ac.uk/users/cameron/papers/empiric.pdf>
Coe D and E Helpman (1993) “International R&D Spillovers”, NBER Working Paper
4444, Cambridge Mass: National Bureau of Economic Research
Coe, David T. and Elhanan Helpman (1995) "International R&D spillovers." European
Economic Review 39(5): 859-887.
Cohen, Wesley M. , Richard C. Levin and David C. Mowery (1987) "Firm Size and
R&D Intensity: A Re-Examination." Cambridge, MA, National Bureau of Economic
Research, NBER Working Paper No. 2205.
<http://papers.nber.org/papers/w2205.pdf>
David, Paul A. , Bronwyn H. Hall and Andrew A. Toole (2000) "Is Public R&D a
Complement or Substitute for Private R&D? A Review of the Econometric Evidence."
Research Policy 29: 497-529. <http://papers.nber.org/papers/w7373.pdf>
David, Paul A. and Bronwyn H. Hall (2000) "Heart of Darkness: Modeling Public-
Private Funding Interactions Insides." Cambridge MA, National Bureau of Economic
Research, NBER Working Paper 7538. <http://www.nber.org/papers/w7538>
Fabling, Richard and Arthur Grimes (2004a) "Three secrets of firm success:
Innovation, innovation, innovation." Wellington, Ministry of Economic Development,
Mimeo.
Fabling R and A Grimes (2004b) “Patently Obvious: Regulation and Firm Success”,
mimeo, Wellington: Ministry of Economic Development
43

Furman, Jeffrey, Michael Porter and Scott Stern (2002) "The determinants of national
innovative capacity", Research Policy 31, 899-933.
Gans, Joshua and Scott Stern (2003) "Assessing Australia's Innovative Capacity in
the 21st Century", Melbourne Business School, Working Paper 2003-16.
Geroski, Paul (1995) Market structure, corporate performance and innovative activity.
(Oxford: Oxford University Press).
Goolsbee, Austan (1998) "Does Government R&D Policy Mainly Benefit Scientists
and Engineers?" The American Economic Review 88(2): pp. 298-302.
Griffith, Rachel (2000) "How important is business R&D for economic growth and
should the Government subsidise it?" London, The Institute for Fiscal Studies,
Briefing Note No. 12.
Griffith, Rachel, Stephen Redding and John Van Reenen (2000) "Mapping the Two
Faces of R&D: Productivity Growth in a Panel of OECD Industries." Institute for
Fiscal Studies Working Paper: W00/02.
<http://www.ifs.org.uk/workingpapers/wp0002.pdf>
Guellec, Dominique and Evangelos Ioannidis (1997) "Causes of fluctuations in R&D
expenditures: A quantitative analysis." Paris, Organisation for Economic Co-
operation and Development, OECD Economic Studies No.29 1997/II.
<http://www.oecd.org/dataoecd/21/40/2733446.pdf>
Hall, Bronwyn H. (1992) "Investment and research and development at the firm level:
Does the source of financing matter?" Cambridge MA, National Bureau of Economic
Research, NBER Working Paper No. 4096.
Hall, Bronwyn H. (1996) "The private and social returns to research and
development." in Bruce L.R. Smith & Claude E. Barfield ed Technology, R&D, and
the Economy (Washington, D.C.: Brookings Institution Press): 140-183.
<http://emlab.berkeley.edu/users/bhhall/papers/BHH96%20R&Dreturns.pdf>
Hall, Bronwyn (1999) "Innovation and Market Value", NBER Working Paper W6984,
Cambridge Mass: National Bureau of Economic Research
44

Hall BH, A Jaffe and M Trajtenberg (2000) “Market Value and Patent Citations: A
First Look”, NBER Working Paper 7741, Cambridge Mass: National Bureau of
Economic Research
Hall, Bronwyn and John van Reenen (2000) "How effective are fiscal incentives for
R&D? A review of the evidence." Research Policy 29: 449-469.
Hall, Bronwyn (2002) "The financing of research and development." Oxford Review of
Economic Policy 18(1): 35-51.
<http://www.intech.unu.edu/events/conferences/7nov2002/hall.pdf>
Helpman, Elhanan (1997) "R&D and productivity: The international connection."
Cambridge, MA, National Bureau of Economic Research, NBER Working Paper No.
6101. <http://papers.nber.org/papers/w6101.pdf>
Himmelberg, Charles P. and Bruce C. Petersen (1994) "R&D and internal finance: A
panel study of small firms in high tech industries." Review of Economics and
Statistics 76(1): 38-51.
Irwin, Douglas A. and Peter J. Klenow (1996) "High-tech R&D subsidies: Estimating
the effects of Sematech." Journal of International Economics 40(3-4): 323-344.
Jaffe, Adam B. (1989) "Real effects of academic research." The American Economic
Review 79(5): 957-970.
Jaffe, Adam B, Trajtenberg, Manuel, Henderson, Rebecca (1993) "Geographic
Localization of Knowledge Spillovers as Evidenced by Patent Citations." The
Quarterly Journal of Economics 108(3): 577-598.
Jones, Charles I. and John C. Williams (1998) "Measuring the Social Return to R&D."
The Quarterly Journal of Economics 113(4): 1119 -1135.
Kanwar S and R Evenson (2003) “Does Intellectual Property Protection Spur
Technological Change?”, Oxford Economic Papers 55, 235-264
Krugman, Paul (1993) "First Nature, Second Nature, and Metropolitan Location",
Journal of Regional Science 33, 129-144.
45

Lanjouw JO and M Schankerman (2004) “Protecting Intellectual Property Rights: Are
Small Firms Handicapped”, Journal of Law and Economics, 47(1), 45-74
Lederman, Daniel and William F. Maloney (2003) "R&D and Development."
Washington DC, World Bank, Office of the Chief Economist - Latin American &
Caribbean. <http://wbln0018.worldbank.org/LAC/ f>
Levin, Richard, Alvin Klevorick, Richard Nelson & Sidney Winter (1987)
"Appropriating Returns from Industrial Research and Development", Brookings
Papers on Economic Activity 3, 783-820
Mazoyer, Pamela (1999) "Analysis of R&D structure and intensities." Wellington,
Ministry of Research, Science & Technology, Research paper.
Mills, Duncan and Jason Timmins (2004) "Firm Dynamics in New Zealand:
Comparative Analysis with OECD Countries", Paper presented to New Zealand
Association of Economists Conference, Wellington
Nelson, Richard R. (1986) "Institutions supporting technical advance in industry." The
American Economic Review 76(2): 186-189.
Nickell, Stephen J (1996) "Competition and Corporate Performance." Journal of
Political Economy. August 104(4): 724-746.
Nicoletti G, A Bassanini, E Ernst, S. Jean P Santiago and P. Swaim (2001) “Product
and Labour Markets Interactions in OECD Countries”, Paris: OECD Economics
Department Working Paper ECO/WKP(2001)38
OECD (2003) "OECD Science, Technology and Industry Scoreboard." Paris,
Organisation for Economic Co-operation and Development, Sixth in Biennial series.
<http://www1.oecd.org/publications/e-book/92-2003-04-1-7294/>
Poot, Jacques (2004) (ed.) On the Edge of the Global Economy, Cheltenham:
Edward Elgar
Romer, Paul M (1996) "Why, Indeed, in America? Theory, History, and the Origins of
Modern Economic Growth." American Economic Review 86(2): 202-206.
46

Scandizzo, Stefania (2001) "Intellectual property rights and international R&D
competition." Washington, D.C., International Monetary Fund, IMF Working paper No.
WP/01/81. <http://www.imf.org/external/pubs/ft/wp/2001/wp0181.pdf>
Scarpetta, Stefano and Thierry Tressel (2002) "Technology, productivity convergence
and regulations in a panel of OECD industries." Paris, OECD, OECD Economics
Department Working Paper No. 342. <http://www.olis.oecd.org/olis/2002doc.nsf/>
Schankerman M (1998) “How Valuable is Patent Protection? Estimates by
Technology Field”, RAND Journal of Economics, 29(1), 77-107
Statistics New Zealand (2003) "Research and Development in New Zealand 2002."
Wellington, Statistics New Zealand.
Symeonidis, George (1996) "Innovation, firm size and market structure:
Schumpeterian hypotheses and some new themes." Paris, Organisation for
Economic Co-operation and Development, OECD Economics Department Working
No. 161. <http://www.olis.oecd.org/olis/1996doc.nsf/LinkTo/OCDE-GD(96)58>
Varsakelis, Nikos (2001) "The impact of patent protection, economy openness and
national culture on R&D investment: A cross-country empirical investigation."
Research Policy 30: 1059-1068.
Zietz, Joachim and Bichaka Fayissa (1992) "R&D expenditures and import
competition: Some evidence for the U.S." Weltwirtschaftliches Archive/Review of
World Economics 128(1): 52-56
47

Appendix A – Sources of Data
Variables and definitions37
Variable Full variable name
Definition Source
AFFj,t Agriculture employment share
Share of total civilian employment by agriculture sector
OECD Labour Market Statistical Database
AGEXj,t Agriculture share of exports
Share of total merchandise exports by agricultural products
The Food and Agriculture Organization of the United Nations (FAOSTAT)
ATj,t Stringency of antitrust policies
Average survey response by executives on a 1-10 scale regarding relative strength of national antitrust policies
IMD World Competitiveness Yearbook
37 The natural logarithm of a variable, X, is denoted LX . A variable, Y, expressed in per capita terms is denoted YPC. Subscript j,t refers to country j in year t.
48

ATTITUDEj,t Attitudes towards efficiency vs. fairness
Average survey response to question: Imagine two secretaries, of the same age, doing practically the same job. One finds out that the other earns considerably more than she does. The better paid secretary, however, is quicker, more efficient and more reliable at her job. In your opinion, is it fair or not fair that one secretary is paid more than the other?
World Value Survey Association
DISTMIN Minimum Distance
Minimum distance of country to USA, Japan, Germany
Andrew Rose Dataset
IPj,t Strength of Protection for Intellectual Property
Average survey response by executives on a 1-10 scale regarding relative strength of IP (extended back to 1981 using earliest available observation)
IMD World Competitiveness Yearbook
MANUj,t Manufacturing employment share
Share of total civilian employment by manufacturing sector
OECD Labour Market Statistical Database
49

MARKETCAPj,t Stock market capitalization
Ratio of Stock market capitalization to GDP
The World Bank
OPENNESSj,t Openness to international trade and investment
Ratio of Exports plus Imports to GDP
OECD National Accounts
PATENTSj,t International patents granted by year of application
For non US countries, patents granted by the USPTO. For the US, patents granted by the USPTO to corporations or governments.
USPTO patent database
POPj,t Population Population (millions of persons)
OECD National Accounts
PRIVR&DFj,t Percentage of R&D funded by private industry
R&D expenditures funded by industry divided by total R&D expenditures
OECD Science and Technology Indicators
R&D$j,t Aggregate Expenditure on R&D
R&D expenditure in all sectors in millions of PPP-adjusted 1995 US$
OECD Science and Technology Indicators
R&DPj,t Aggregate Personnel Employed in R&D
Full-time equivalent R&D personnel in all sectors
OECD Science and Technology Indicators
50

SCIENCEj,t Attitudes to scientific advancement
Average survey response to question: In the long run, do you think that the scientific advances we are making will help or harm mankind?
World Value Survey Association
SELFj,t Self Employment Share of total civilian employment by self-employed
OECD Labour Market Statistical Database
51

Appendix B
PATENTS pc (2000)
0
50
100
150
200
250
300
AA AI BE CA DE FI FR GE GR IC IR IT JA NE NZ NO PO SP SE SI UK US
No.
Pat
ents
per
100
0 pe
ople
R&D$ pc (2000)
0
100
200
300
400
500
600
700
800
900
1000
AA AI BE CA DE FI FR GE GR IC IR IT JA NE NZ NO PO SP SE SI UK US
USD
(PPP
)
PRIVATELY FUNDED R&D SHARE (PRIVR&DF) (2000)
0.000
0.100
0.200
0.300
0.400
0.500
0.600
0.700
0.800
AA AI BE CA DE FI FR GE GR IC IR IT JA NE NZ NO PO SP SE SI UK US
Shar
e
52

Appendix C
DISTMIN
0
1000
2000
3000
4000
5000
6000
7000
AA AI BE CA DE FI FR GE GR IC IR IT JA NE NZ NO PO SP SE SI UK US
Kilo
met
res
AFF SHARE (2000)
0
0.02
0.04
0.06
0.08
0.1
0.12
0.14
0.16
0.18
AA AI BE CA DE FI FR GE GR IC IR IT JA NE NZ NO PO SP SE SI UK US
Shar
e
POPULATION (2000)
0
50000
100000
150000
200000
250000
300000
AA AI BE CA DE FI FR GE GR IC IR IT JA NE NZ NO PO SP SE SI UK US
No.
(000
)
SELF SHARE (2000)
0
0.05
0.1
0.15
0.2
0.25
0.3
0.35
AA AI BE CA DE FI FR GE GR IC IR IT JA NE NZ NO PO SP SE SI UK US
Shar
e
53
Related Documents


