1 This technical report is the fourth in a series intended to introduce the Wechsler Intelligence Scale for Children–Fourth Edition (WISC–IV; Wechsler, 2003). Technical Report #1 (Williams, Weiss, & Rolfhus, 2003a) presented the theoretical structure and test blueprint for the WISC–IV, as well as subtest changes from the Wechsler Intelligence Scale for Children— Third Edition (WISC–III; Wechsler, 1991). Technical Report #2 (Williams, Weiss, & Rolfhus, 2003b) presented the psychometric properties of the WISC–IV. Technical Report #3 (Williams, Weiss, & Rolfhus, 2003c) addressed the instrument’s clinical validity. This report provides information about the derivation and uses of the General Ability Index (GAI). The GAI is a composite score that is based on 3 Verbal Comprehension and 3 Perceptual Reasoning subtests, and does not include the Working Memory or Processing Speed subtests included in the Full Scale IQ (FSIQ). Detailed information about the GAI, beyond what is covered in this technical report, is available in a chapter by Saklofske, Prifitera, Weiss, Rolfhus, and Zhu in WISC–IV Clinical Use and Interpretation: Scientist-Practitioner Perspectives (Prifitera, Saklofske, & Weiss, 2005). The original Wechsler Intelligence Scale for Children (WISC; Wechsler, 1949), the Wechsler Intelligence Scale for Children— Revised (WISC–R; Wechsler, 1974), and the WISC–III included an FSIQ as well as a Verbal IQ (VIQ) and Performance IQ (PIQ). The WISC–III introduced four index scores to represent more narrow domains of cognitive function: the Verbal Comprehension Index (VCI), the Perceptual Organization Index (POI), the Freedom from Distractibility Index (FDI), and the Processing Speed Index (PSI). With the introduction of these index scores, a total of seven composite scores could be derived with the WISC–III: the FSIQ, VIQ, PIQ, VCI, POI, FDI, and PSI. The introduction of the index scores gave practitioners the ability to select the composite scores that best described verbal and perceptual ability, based on the outcome of the assessment. When necessary to aid in interpretation, the practitioner could describe verbal abilities using the VCI in place of the VIQ, and describe perceptual abilities using the POI in place of the PIQ. This flexibility was particularly useful when scores for certain subtests contributing to the VIQ or PIQ were discrepant at a significant and unusual level. In particular, the index scores were preferable for cases in which the VIQ was considered less descriptive of verbal ability than the VCI because Arithmetic—a subtest from the working memory domain—was discrepant from the verbal comprehension subtests at a level that was unusual in the standardization sample and for cases in which the PIQ was considered less descriptive of perceptual ability than the POI because Coding— a subtest drawn from the processing speed domain—was discrepant from the perceptual organization subtests at a level that was unusual in the standardization sample. The GAI was first developed for use with the WISC–III by Prifitera, Weiss, and Saklofske (1998) to offer additional flexibility in describing broad intellectual ability. The WISC–III GAI provided a measure of general cognitive ability that did not include the influence of Arithmetic or Coding on FSIQ. The WISC–III GAI was based on the sum of scaled scores for all subtests that contributed to the traditional ten-subtest FSIQ, with the exception of Arithmetic and Coding. The eight contributing subtests were all drawn from the verbal comprehension and perceptual organization domains, and included Picture Completion, Information, Similarities, Picture Arrangement, Block Design, Vocabulary, Object Assembly, and Comprehension. The WISC–III GAI was recommended as a useful composite to estimate overall ability if a great deal of variability existed within VIQ and/or PIQ due to low scores on Arithmetic and/or Coding (Prifitera et al., 1998). The GAI was subsequently applied for use with the WISC–III using Canadian norms (Weiss, Saklofske, Prifitera, Chen, & Hildebrand, 1999), the WAIS–III (Tulsky, Saklofske, Wilkins, & Weiss, 2001), and the WAIS–III using Canadian norms (Saklofske, Gorsuch, Weiss, Zhu, & Patterson, 2005). The WISC–IV provides an FSIQ and a four-index framework similar to that of the WISC–III. The framework is based on theory and supported by clinical research and factor-analytic results. As noted in the WISC–IV Technical and Interpretive Manual (Wechsler, 2003) and in Technical Report #1 (Williams et al., 2003a), the POI was renamed the Perceptual Reasoning Index (PRI) to reflect more accurately the increased emphasis on fluid reasoning abilities in this index, and the FDI was renamed the Working Memory Index (WMI), which more TECHNICAL REPORT #4 General Ability Index January 2005 Susan E. Raiford, Ph.D. Lawrence G. Weiss, Ph.D. Eric Rolfhus, Ph.D. Diane Coalson, Ph.D. OVERVIEW Background and History of the Wechsler Composites and the GAI Copyright © 2008 by Pearson Education, Inc. or its affiliate(s). All rights reserved.

Welcome message from author
This document is posted to help you gain knowledge. Please leave a comment to let me know what you think about it! Share it to your friends and learn new things together.
Transcript
1
This technical report is the fourth in a series intended tointroduce the Wechsler Intelligence Scale for Children–FourthEdition (WISC–IV; Wechsler, 2003). Technical Report #1(Williams, Weiss, & Rolfhus, 2003a) presented the theoreticalstructure and test blueprint for the WISC–IV, as well as subtestchanges from the Wechsler Intelligence Scale for Children—Third Edition (WISC–III; Wechsler, 1991). Technical Report #2(Williams, Weiss, & Rolfhus, 2003b) presented the psychometricproperties of the WISC–IV. Technical Report #3 (Williams, Weiss,& Rolfhus, 2003c) addressed the instrument’s clinical validity.
This report provides information about the derivation anduses of the General Ability Index (GAI). The GAI is a compositescore that is based on 3 Verbal Comprehension and 3Perceptual Reasoning subtests, and does not include theWorking Memory or Processing Speed subtests included in theFull Scale IQ (FSIQ). Detailed information about the GAI,beyond what is covered in this technical report, is available in achapter by Saklofske, Prifitera, Weiss, Rolfhus, and Zhu inWISC–IV Clinical Use and Interpretation: Scientist-PractitionerPerspectives (Prifitera, Saklofske, & Weiss, 2005).
The original Wechsler Intelligence Scale for Children (WISC;Wechsler, 1949), the Wechsler Intelligence Scale for Children—Revised (WISC–R; Wechsler, 1974), and the WISC–III included anFSIQ as well as a Verbal IQ (VIQ) and Performance IQ (PIQ). TheWISC–III introduced four index scores to represent more narrowdomains of cognitive function: the Verbal Comprehension Index(VCI), the Perceptual Organization Index (POI), the Freedomfrom Distractibility Index (FDI), and the Processing Speed Index(PSI). With the introduction of these index scores, a total ofseven composite scores could be derived with the WISC–III: theFSIQ, VIQ, PIQ, VCI, POI, FDI, and PSI.
The introduction of the index scores gave practitioners theability to select the composite scores that best described verbaland perceptual ability, based on the outcome of theassessment. When necessary to aid in interpretation, thepractitioner could describe verbal abilities using the VCI inplace of the VIQ, and describe perceptual abilities using the POIin place of the PIQ. This flexibility was particularly useful whenscores for certain subtests contributing to the VIQ or PIQ werediscrepant at a significant and unusual level. In particular, theindex scores were preferable for cases in which the VIQ wasconsidered less descriptive of verbal ability than the VCIbecause Arithmetic—a subtest from the working memorydomain—was discrepant from the verbal comprehensionsubtests at a level that was unusual in the standardizationsample and for cases in which the PIQ was considered lessdescriptive of perceptual ability than the POI because Coding—a subtest drawn from the processing speed domain—wasdiscrepant from the perceptual organization subtests at a levelthat was unusual in the standardization sample.
The GAI was first developed for use with the WISC–III byPrifitera, Weiss, and Saklofske (1998) to offer additionalflexibility in describing broad intellectual ability. The WISC–IIIGAI provided a measure of general cognitive ability that did notinclude the influence of Arithmetic or Coding on FSIQ. The WISC–III GAI was based on the sum of scaled scores for allsubtests that contributed to the traditional ten-subtest FSIQ,with the exception of Arithmetic and Coding. The eightcontributing subtests were all drawn from the verbalcomprehension and perceptual organization domains, andincluded Picture Completion, Information, Similarities, PictureArrangement, Block Design, Vocabulary, Object Assembly, andComprehension. The WISC–III GAI was recommended as auseful composite to estimate overall ability if a great deal ofvariability existed within VIQ and/or PIQ due to low scores onArithmetic and/or Coding (Prifitera et al., 1998). The GAI wassubsequently applied for use with the WISC–III using Canadiannorms (Weiss, Saklofske, Prifitera, Chen, & Hildebrand, 1999),the WAIS–III (Tulsky, Saklofske, Wilkins, & Weiss, 2001), and theWAIS–III using Canadian norms (Saklofske, Gorsuch, Weiss,Zhu, & Patterson, 2005).
The WISC–IV provides an FSIQ and a four-index frameworksimilar to that of the WISC–III. The framework is based ontheory and supported by clinical research and factor-analyticresults. As noted in the WISC–IV Technical and InterpretiveManual (Wechsler, 2003) and in Technical Report #1 (Williamset al., 2003a), the POI was renamed the Perceptual ReasoningIndex (PRI) to reflect more accurately the increased emphasison fluid reasoning abilities in this index, and the FDI wasrenamed the Working Memory Index (WMI), which more
TECHNICAL REPORT #4
General Ability IndexJanuary 2005
Susan E. Raiford, Ph.D. Lawrence G. Weiss, Ph.D. Eric Rolfhus, Ph.D. Diane Coalson, Ph.D.
OVERVIEW
Background and History of the Wechsler Composites and the GAI
05WISC4 Tech Rept 4-R2.qxd 3/7/05 9:36 AM Page 1
Copyright © 2008 by Pearson Education, Inc. or its affiliate(s). All rights reserved.

2
As with the WISC–III GAI and WAIS-III GAI, the WISC–IV GAIprovides the practitioner a summary score that is less sensitiveto the influence of working memory and processing speed. Forchildren with neuropsychological issues such as learningdisorders, Attention-Deficit/Hyperactivity Disorder, and othersimilar issues, difficulties with working memory and processingspeed may result in lower FSIQ scores (Wechsler, 2003). Inchildren with intact neuropsychological functioning, the GAImay provide a comparable approximation of overall intellectualability as represented by the FSIQ (Prifitera et al., 2005; Weiss et al., 1999).
The GAI can be used as a substitute for the FSIQ todetermine eligibility for special education services andplacement classification. The GAI increases flexibility in thisrespect, because it is sensitive to cases in which workingmemory performance is discrepant from verbalcomprehension performance and/or processing speedperformance is discrepant from perceptual reasoningperformance at an unusual level. It can also be compared to theFSIQ to assess the effects of working memory and processingspeed on the expression of cognitive ability.
Various sources for GAI tables are available; however, thosesources differ according to the method by which they werecreated. Four such sources are (a) this technical report, (b)Prifitera et al. (2005); (c) Flanagan and Kaufman (2004); and (d)Dumont and Willis (2004). The GAI tables provided in thistechnical report and in Prifitera et al. (2005) are the only GAI
tables supported by Pearson Education , Inc. (formerly knownas The Psychological Corporation). These tables were createdusing the actual WISC–IV standardization sample (n = 2200),whereas the GAI tables provided in other sources were createdusing statistical approximation. The calculations in Flanaganand Kaufman (2004), and Dumont and Willis (2004) were basedon a statistical technique for linear equating that wasdeveloped by Tellegen and Briggs (1967, Formula 4), whichallowed the GAI to be calculated based on intercorrelationsamong the VCI and the PRI. In contrast, tables in this technicalreport provide values for the GAI based on the standardizationsample, and the sum of subtest scaled scores that contribute tothe index. The Tellegen and Briggs formula underestimatesscores in the upper portion of the distribution andoverestimates scores in the lower portion of the distribution.On average, this difference is approximately 2–3 points, but canbe as much as 6 points for some children with mentalretardation or some gifted children. The Tellegen and Briggsformula is appropriate for use if the actual standardization dataare not available: The tables provided by Flanagan andKaufman (2004) and by Dumont and Willis (2004) weregenerated while practitioners were waiting for the tables basedon the standardization sample to be created. As the tablesbased on the standardization sample are now available, thoseGAI tables should be considered out of date. Thus, practitionersare advised to use the GAI tables in this technical report, whichare the same (within rounding variance) as the tables inPrifitera et al. (2005).
accurately describes the abilities measured. In addition, thedual IQ and Index score structure was no longer utilized. Theelimination of the dual structure reduced concerns about theinfluence of working memory and processing speed whensummarizing verbal comprehension and perceptual reasoningabilities, respectively. The WISC–IV FSIQ, however, includes (to a greater extent than the WISC–III FSIQ) the influence ofworking memory and processing speed, to reflect research thatsuggests both working memory and processing speed areimportant factors that contribute to overall intellectualfunctioning (Engle, Laughlin, Tuholski, & Conway, 1999; Fry &Hale, 1996, 2000; Heinz-Martin, Oberauer, Wittmann, Wilhelm,& Schulze, 2002; Miller & Vernon, 1996; Vigil-Colet & Codorniu-Raga, 2002). Recent research continues to confirm theimportance of working memory and processing speed tocognitive ability and to refine knowledge about the nature ofthese relations (Colom, Rebollo, Palacios, Juan-Espinosa, &Kyllonen, 2004; Mackintosh & Bennett, 2003; Schweizer &Moosbrugger, 2004).
The FSIQ is used most frequently to describe an underlying,global aspect of general intelligence, or g. The FSIQ is utilizedfor a number of purposes in clinical practice. The FSIQ canserve as a summary of performance across a number of specificcognitive ability domains (i.e., verbal comprehension,perceptual reasoning, working memory, and processing speed).It is used most often in conjunction with other information aspart of a diagnostic evaluation in clinics and hospital settings,to determine eligibility to receive special education services inpublic school settings, or to make decisions about level of careand placement in residential settings.
The FSIQ is an aggregate score that summarizesperformance across multiple cognitive abilities in a singlenumber. When unusual variability is observed within the set ofsubtests that comprise the FSIQ, clinical interpretation shouldcharacterize this diversity of abilities in order to be most usefulfor parents, teachers, and other professionals.
Introduction to the WISC–IV GAI
The Role of Ability in Determining Eligibility forSpecial Education Services as Learning Disabled
The WISC–IV Integrated Technical and Interpretive Manual(Wechsler et al., 2004) outlines a number of concerns with theisolated use of the ability–achievement discrepancy model foridentifying learning disabilities. An ability–achievementdiscrepancy (AAD) indicates that some problem exists, asachievement is not at a level commensurate with cognitiveability. Established practice currently includes the use of
ability–achievement discrepancies as general screeners fornonspecific learning problems. The general finding of such adiscrepancy should be followed with additional assessmentbefore a formal diagnosis is rendered. A determination that alearning disability is present requires evidence of impairmentin the core cognitive processes underlying the specificacademic skill of concern, but an AAD alone is often sufficient
05WISC4 Tech Rept 4-R2.qxd 3/7/05 9:36 AM Page 2
Copyright © 2008 by Pearson Education, Inc. or its affiliate(s). All rights reserved.

3
evidence to obtain special education services in most publicschool settings. Although several new models for evaluatinglearning disorders and learning disabilities have beenproposed recently (Berninger, Dunn, & Alper, 2005; Berninger& O’Donnell, 2005), diagnostic markers generally have yet tobe established clearly in the literature. Some progress has beenmade in this area, however. For example, pseudoworddecoding and rapid automatized naming appear to predictearly reading disorders.
The progression toward utilizing a number of approaches toassess learning disabilities is evident in federal legislation. Thenew Individuals with Disabilities Education Improvement Actof 2004 indicates that local education agencies should ensurethat a variety of assessment tools and strategies are used togather relevant functional, developmental, and academicinformation that may assist in determining whether or not thechild has a learning disability. The Individuals with DisabilitiesEducation Improvement Act of 2004 further states that, in
general, a local educational agency is not required to take intoconsideration whether a child has a severe AAD in determiningwhether a child has a specific learning disability. Localeducation agencies may continue to use the AAD method ifdesired, or they may incorporate or transition to a process thatdetermines if the child responds to intervention as a part of theevaluation (Individuals with Disabilities EducationImprovement Act of 2004; Public Law 108–446). Proponents ofthe response-to-intervention model advocate that eligibility forspecial education services be determined solely on the basis ofthe student’s low achievement and failure to respond toempirically supported educational instruction, regardless of theresults of cognitive evaluations (Fletcher & Reschly, 2004).Others have defended the role of cognitive assessment in theevaluation of individuals with brain-based learning disorders,while not necessarily advocating strict adherence to AAD as theonly method for classification (Hale, Naglieri, Kaufman, &Kavale, 2004; Scruggs & Mastropieri, 2002).
When to Use the GAI
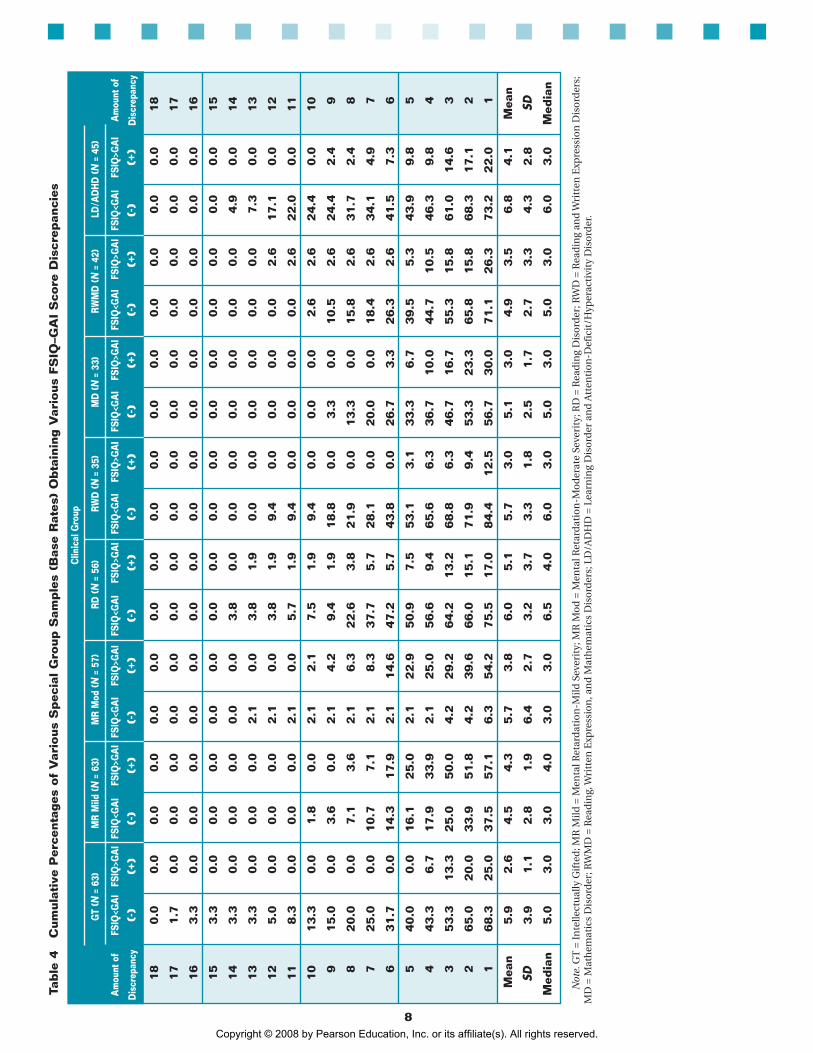
Presently, most school district policies continue to requireevidence of an AAD in order to obtain special educationservices, and it was largely for this reason that the GAI was firstdeveloped. For some children with learning disabilities,attentional problems, or other neuropsychological issues,concomitant working memory and processing speeddeficiencies lower the FSIQ. This is evident in Table 4 (seepages 9–10), which shows that FSIQ < GAI profiles wereobtained by more than 70% of children in the followingWISC–IV special group samples: Reading Disorder (N = 56),Reading and Written Expression Disorders (N = 35), Reading,Written Expression, and Mathematics Disorders (N = 42), andLearning Disorder and Attention-Deficit/HyperactivityDisorder (N = 45). While potentially clinically meaningful, thisreduction in the FSIQ may decrease the magnitude of the AADfor some children with learning disabilities and make themless likely to be found eligible for special education services ineducational systems that do not allow consideration of othermethods of eligibility determination.
It also may be clinically informative in a number ofadditional situations to compare the FSIQ and the GAI, toassess the impact of reducing the emphasis on workingmemory and processing speed on the estimate of generalcognitive ability for children with difficulty in those areas dueto traumatic brain injury or other neuropsychologicaldifficulties. This comparison may inform rehabilitationprograms and/or educational intervention planning.
It is important for practitioners to recognize that the GAI isnot necessarily a more valid estimate of overall cognitive abilitythan the FSIQ. Working memory and processing speed are vitalto the comprehensive evaluation of cognitive ability, andexcluding these abilities from the evaluation can be misleading.The classroom performance of two children with the same GAIscore but very different WMI/PSI scores will likely be quitedifferent. In educational situations where evidence of asignificant AAD is required to obtain services, the GAI may beused as the ability score; however, the WMI and PSI should stillbe reported and interpreted. Refer to chapters 2 and 3 ofWISC–IV Clinical Use and Interpretation: Scientist-PractitionerPerspectives (Prifitera et al., 2005) for additional discussion.
The practitioner may wish to consider using the GAI in anumber of clinical situations, not limited to, but including thefollowing:
• a significant and unusual discrepancy exists between VCI and WMI;
• a significant and unusual discrepancy exists between PRI and PSI;
• a significant and unusual discrepancy exists between WMI and PSI; or
• significant and unusual intersubtest scatter exists within WMI and/or PSI.
To review index discrepancies, consult the discrepancycomparison critical value and base rate tables B.1–B.6 of theWISC–IV Administration and Scoring Manual (Wechsler, 2003)using the procedures outlined in chapter 2 of the manual. TheAnalysis Page of the WISC–IV Record Form provides space forthese pairwise discrepancy comparisons in the DiscrepancyComparisons table. A statistically significant differencebetween index scores, however, may not indicate that there is aclinically significant difference: The frequency of occurrence inthe standardization sample (base rate), not just the criticalvalue, should be considered. Consult Table B.2 in the WISC–IVAdministration and Scoring Manual (Wechsler, 2003) to obtainthe base rate for a given discrepancy. Sattler (2001) suggeststhat differences between scores that occur in less than 10% to15% of the standardization sample should be judged asunusual. Subtest scatter can be examined within the FSIQ, andwithin the VCI and PRI, using Table B.6 of the WISC–IVAdministration and Scoring Manual (Wechsler, 2003).
The following steps are provided as a guide for calculatingthe GAI and comparing it to the FSIQ to obtain moreinformation about a child’s cognitive ability.
Calculate the General Ability Sum of Scaled Scores
If you have determined that the GAI is important to considerin interpretation, calculate the General Ability Sum of ScaledScores. The General Ability Sum of Scaled Scores is the sum of scaled scores for three Verbal Comprehension subtests
05WISC4 Tech Rept 4-R2.qxd 3/7/05 9:36 AM Page 3
Copyright © 2008 by Pearson Education, Inc. or its affiliate(s). All rights reserved.

4
(i.e., Vocabulary, Comprehension, and Similarities) and threePerceptual Reasoning subtests (i.e., Block Design, MatrixReasoning, and Picture Concepts). Record the General AbilitySum of Scaled Scores.
In some situations, you may choose to substitute asupplemental subtest for a core subtest that contributes to theGAI. Follow the same subtest substitution rules that areoutlined in the WISC–IV Administration and Scoring Manual(Wechsler, 2003) for the FSIQ if you choose to substitute asupplemental subtest for a core subtest that contributes to theGAI. Follow the standard administration order of subtests listed
in chapter 2 of the WISC–IV Administration and ScoringManual (Wechsler, 2003) even when you expect to substitute asupplemental subtest for a core subtest.
Determine the GAI Composite Score
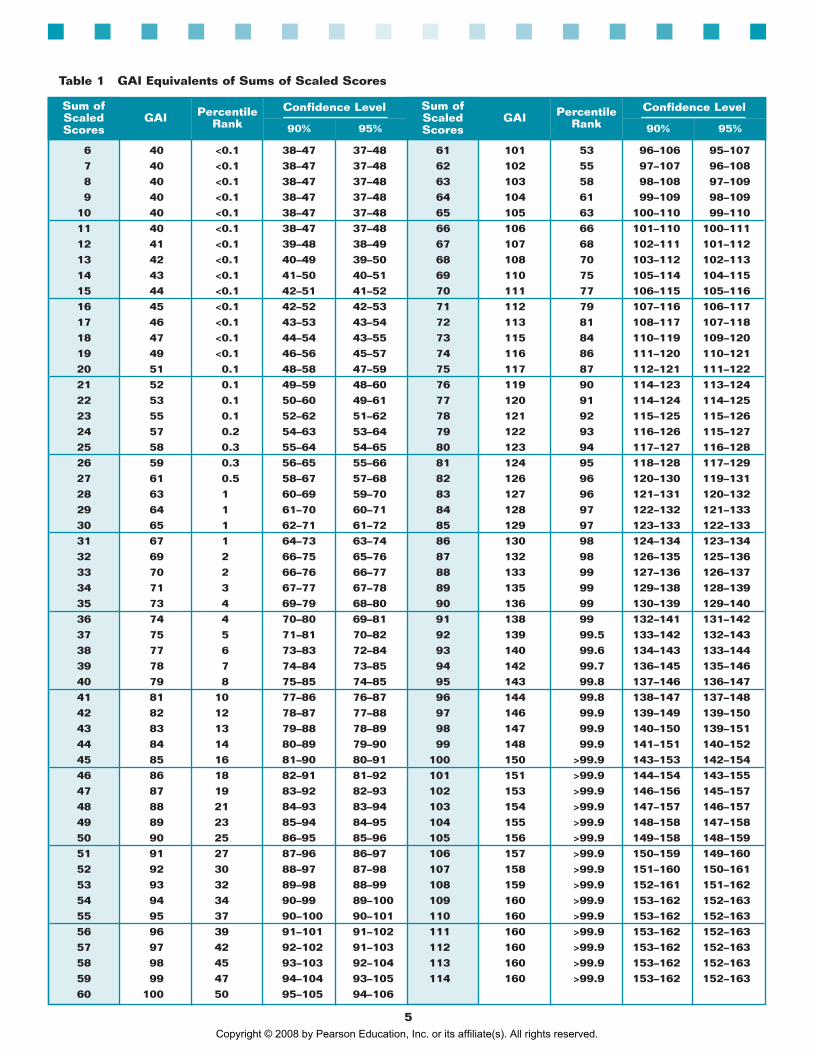
Locate the General Ability Sum of Scaled Scores in theextreme left column of Table 1. Read across the row todetermine the GAI composite score. Continue to read acrossthe row to find the corresponding percentile rank andconfidence intervals. Record the composite score, thepercentile rank, and the confidence interval (90% or 95%).
05WISC4 Tech Rept 4-R2.qxd 3/7/05 9:36 AM Page 4
Copyright © 2008 by Pearson Education, Inc. or its affiliate(s). All rights reserved.
5
Sum ofScaledScores
GAI PercentileRank
Confidence Level
90% 95%
Sum ofScaledScores
GAI PercentileRank
Confidence Level
90% 95%
Table 1 GAI Equivalents of Sums of Scaled Scores
6 40 <0.1 38–47 37–48 61 101 53 96–106 95–1077 40 <0.1 38–47 37–48 62 102 55 97–107 96–1088 40 <0.1 38–47 37–48 63 103 58 98–108 97–1099 40 <0.1 38–47 37–48 64 104 61 99–109 98–109
10 40 <0.1 38–47 37–48 65 105 63 100–110 99–11011 40 <0.1 38–47 37–48 66 106 66 101–110 100–11112 41 <0.1 39–48 38–49 67 107 68 102–111 101–11213 42 <0.1 40–49 39–50 68 108 70 103–112 102–11314 43 <0.1 41–50 40–51 69 110 75 105–114 104–11515 44 <0.1 42–51 41–52 70 111 77 106–115 105–11616 45 <0.1 42–52 42–53 71 112 79 107–116 106–11717 46 <0.1 43–53 43–54 72 113 81 108–117 107–11818 47 <0.1 44–54 43–55 73 115 84 110–119 109–12019 49 <0.1 46–56 45–57 74 116 86 111–120 110–12120 51 0.1 48–58 47–59 75 117 87 112–121 111–12221 52 0.1 49–59 48–60 76 119 90 114–123 113–12422 53 0.1 50–60 49–61 77 120 91 114–124 114–12523 55 0.1 52–62 51–62 78 121 92 115–125 115–12624 57 0.2 54–63 53–64 79 122 93 116–126 115–12725 58 0.3 55–64 54–65 80 123 94 117–127 116–12826 59 0.3 56–65 55–66 81 124 95 118–128 117–12927 61 0.5 58–67 57–68 82 126 96 120–130 119–13128 63 1 60–69 59–70 83 127 96 121–131 120–13229 64 1 61–70 60–71 84 128 97 122–132 121–13330 65 1 62–71 61–72 85 129 97 123–133 122–13331 67 1 64–73 63–74 86 130 98 124–134 123–13432 69 2 66–75 65–76 87 132 98 126–135 125–13633 70 2 66–76 66–77 88 133 99 127–136 126–13734 71 3 67–77 67–78 89 135 99 129–138 128–13935 73 4 69–79 68–80 90 136 99 130–139 129–14036 74 4 70–80 69–81 91 138 99 132–141 131–14237 75 5 71–81 70–82 92 139 99.5 133–142 132–14338 77 6 73–83 72–84 93 140 99.6 134–143 133–14439 78 7 74–84 73–85 94 142 99.7 136–145 135–14640 79 8 75–85 74–85 95 143 99.8 137–146 136–14741 81 10 77–86 76–87 96 144 99.8 138–147 137–14842 82 12 78–87 77–88 97 146 99.9 139–149 139–15043 83 13 79–88 78–89 98 147 99.9 140–150 139–15144 84 14 80–89 79–90 99 148 99.9 141–151 140–15245 85 16 81–90 80–91 100 150 >99.9 143–153 142–15446 86 18 82–91 81–92 101 151 >99.9 144–154 143–15547 87 19 83–92 82–93 102 153 >99.9 146–156 145–15748 88 21 84–93 83–94 103 154 >99.9 147–157 146–15749 89 23 85–94 84–95 104 155 >99.9 148–158 147–15850 90 25 86–95 85–96 105 156 >99.9 149–158 148–15951 91 27 87–96 86–97 106 157 >99.9 150–159 149–16052 92 30 88–97 87–98 107 158 >99.9 151–160 150–16153 93 32 89–98 88–99 108 159 >99.9 152–161 151–16254 94 34 90–99 89–100 109 160 >99.9 153–162 152–16355 95 37 90–100 90–101 110 160 >99.9 153–162 152–16356 96 39 91–101 91–102 111 160 >99.9 153–162 152–16357 97 42 92–102 91–103 112 160 >99.9 153–162 152–16358 98 45 93–103 92–104 113 160 >99.9 153–162 152–16359 99 47 94–104 93–105 114 160 >99.9 153–162 152–16360 100 50 95–105 94–106
05WISC4 Tech Rept 4-R2.qxd 3/7/05 9:36 AM Page 5
Copyright © 2008 by Pearson Education, Inc. or its affiliate(s). All rights reserved.
6
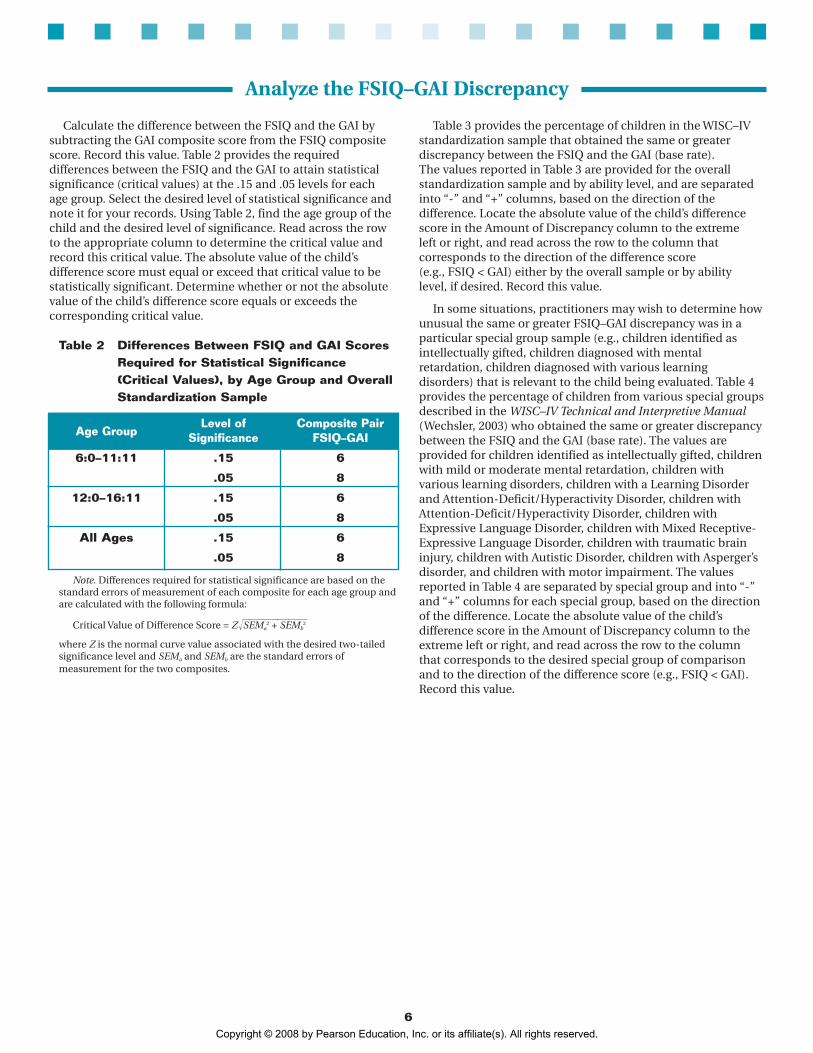
Calculate the difference between the FSIQ and the GAI bysubtracting the GAI composite score from the FSIQ compositescore. Record this value. Table 2 provides the requireddifferences between the FSIQ and the GAI to attain statisticalsignificance (critical values) at the .15 and .05 levels for eachage group. Select the desired level of statistical significance andnote it for your records. Using Table 2, find the age group of thechild and the desired level of significance. Read across the rowto the appropriate column to determine the critical value andrecord this critical value. The absolute value of the child’sdifference score must equal or exceed that critical value to bestatistically significant. Determine whether or not the absolutevalue of the child’s difference score equals or exceeds thecorresponding critical value.
Table 3 provides the percentage of children in the WISC–IVstandardization sample that obtained the same or greaterdiscrepancy between the FSIQ and the GAI (base rate). The values reported in Table 3 are provided for the overallstandardization sample and by ability level, and are separatedinto “-” and “+” columns, based on the direction of thedifference. Locate the absolute value of the child’s differencescore in the Amount of Discrepancy column to the extreme left or right, and read across the row to the column thatcorresponds to the direction of the difference score (e.g., FSIQ < GAI) either by the overall sample or by ability level, if desired. Record this value.
In some situations, practitioners may wish to determine howunusual the same or greater FSIQ–GAI discrepancy was in aparticular special group sample (e.g., children identified asintellectually gifted, children diagnosed with mentalretardation, children diagnosed with various learningdisorders) that is relevant to the child being evaluated. Table 4provides the percentage of children from various special groupsdescribed in the WISC–IV Technical and Interpretive Manual(Wechsler, 2003) who obtained the same or greater discrepancybetween the FSIQ and the GAI (base rate). The values areprovided for children identified as intellectually gifted, childrenwith mild or moderate mental retardation, children withvarious learning disorders, children with a Learning Disorderand Attention-Deficit/Hyperactivity Disorder, children withAttention-Deficit/Hyperactivity Disorder, children withExpressive Language Disorder, children with Mixed Receptive-Expressive Language Disorder, children with traumatic braininjury, children with Autistic Disorder, children with Asperger’sdisorder, and children with motor impairment. The valuesreported in Table 4 are separated by special group and into “-”and “+” columns for each special group, based on the directionof the difference. Locate the absolute value of the child’sdifference score in the Amount of Discrepancy column to theextreme left or right, and read across the row to the columnthat corresponds to the desired special group of comparisonand to the direction of the difference score (e.g., FSIQ < GAI).Record this value.
Table 2 Differences Between FSIQ and GAI ScoresRequired for Statistical Significance(Critical Values), by Age Group and OverallStandardization Sample
Note. Differences required for statistical significance are based on thestandard errors of measurement of each composite for each age group andare calculated with the following formula:
Critical Value of Difference Score = Z��SEMa2 +�SEMb
2
where Z is the normal curve value associated with the desired two-tailedsignificance level and SEMa and SEMb are the standard errors ofmeasurement for the two composites.
Age GroupLevel of Composite Pair
Significance FSIQ–GAI
6:0–11:11 .15 6
.05 8
12:0–16:11 .15 6
.05 8
All Ages .15 6
.05 8
Analyze the FSIQ–GAI Discrepancy
05WISC4 Tech Rept 4-R2.qxd 3/7/05 9:36 AM Page 6
Copyright © 2008 by Pearson Education, Inc. or its affiliate(s). All rights reserved.

7
Tab
le 3
C
um
ula
tive
Per
centa
ges
of
Sta
nd
ard
izat
ion S
amp
le (
Bas
e R
ates
) O
bta
inin
g V
ario
us
FS
IQ–G
AI
Sco
re D
iscr
epan
cies
, b
y O
vera
ll S
amp
le a
nd
Ab
ilit
y Lev
el
18
0.0
0.0
0.0
0.0
0.0
0.0
0.0
0.0
0.3
0.0
0.0
0.0
18
17
0.0
0.0
0.0
0.0
0.0
0.0
0.0
0.0
0.3
0.0
0.0
0.0
17
16
0.1
0.0
0.0
0.0
0.0
0.0
0.0
0.0
0.3
0.0
0.4
0.0
16
15
0.2
0.0
0.0
0.0
0.0
0.0
0.2
0.0
0.3
0.3
0.9
0.0
15
14
0.5
0.3
0.0
1.2
0.7
0.3
0.4
0.2
0.3
0.5
2.2
0.0
14
13
0.9
0.5
0.0
1.2
1.4
0.3
0.4
0.4
0.3
0.5
4.5
0.4
13
12
1.4
0.8
0.0
2.9
2.1
0.3
0.8
0.7
0.5
0.5
6.3
0.4
12
11
2.3
1.2
0.0
4.1
2.8
0.3
1.6
1.4
1.8
0.5
7.6
0.4
11
10
3.4
2.2
0.6
5.8
4.5
1.4
2.6
2.2
2.9
2.4
9.4
0.4
10
95
.43
.70
.68
.26
.62
.14
.73
.95
.03
.91
2.1
0.9
9
87
.95
.42
.39
.48
.73
.16
.86
.38
.14
.71
6.1
1.8
8
71
1.0
8.2
5.3
16
.41
2.2
4.9
9.2
9.3
13
.66
.81
8.8
3.1
7
61
4.5
11
.68
.82
4.0
16
.08
.71
2.1
13
.01
7.0
8.1
25
.14
.96
51
9.8
16
.91
3.5
31
.02
1.2
13
.21
7.3
19
.52
3.6
11
.82
9.6
6.7
5
42
5.6
22
.71
6.4
36
.32
6.0
18
.12
3.0
26
.13
0.6
18
.13
6.8
9.0
4
33
2.6
28
.32
0.5
45
.63
0.6
23
.62
9.5
31
.13
9.3
25
.14
9.3
12
.13
23
9.9
35
.52
8.1
50
.93
9.2
30
.93
6.1
38
.74
7.1
32
.75
7.0
18
.42
14
8.7
43
.33
3.3
58
.55
1.0
38
.24
4.7
46
.95
4.2
41
.16
8.2
23
.81
Mea
n4
.44
.23
.95
.14
.43
.84
.24
.34
.53
.85
.13
.5M
ean
SD3
.02
.82
.33
.13
.32
.52
.92
.72
.82
.83
.72
.6SD
Med
ian
4.0
4.0
3.0
5.0
4.0
3.0
4.0
4.0
4.0
3.0
4.0
3.0
Med
ian
Am
ount
of
FSIQ
<GA
IFS
IQ>G
AI
FSIQ
<GA
IFS
IQ>G
AI
FSIQ
<GA
IFS
IQ>G
AI
FSIQ
<GA
IFS
IQ>G
AI
FSIQ
<GA
IFS
IQ>G
AI
FSIQ
<GA
IFS
IQ>G
AI
Am
ount
of
Dis
crep
ancy
(-)
(+)
(-)
(+)
(-)
(+)
(-)
(+)
(-)
(+)
(-)
(+)
Dis
crep
ancy
Ove
rall
Sam
ple
GA
I ≤
7980
≤G
AI
≤89
90 ≤
GA
I ≤
109
110
≤G
AI
≤11
9G
AI
≥12
0
05WISC4 Tech Rept 4-R2.qxd 3/7/05 9:36 AM Page 7
Copyright © 2008 by Pearson Education, Inc. or its affiliate(s). All rights reserved.
8
GT
(N=
63)
MR
Mild
(N=
63)
MR
Mod
(N=
57)
RD (N
= 56
)RW
D (N
= 35
)M
D (N
= 33
)RW
MD
(N=
42)
LD/A
DHD
(N=
45)
Clin
ical
Gro
up
Am
ount
of
FSIQ
<GA
IFS
IQ>G
AI
FSIQ
<GA
IFS
IQ>G
AI
FSIQ
<GA
IFS
IQ>G
AI
FSIQ
<GA
IFS
IQ>G
AI
FSIQ
<GA
IFS
IQ>G
AI
FSIQ
<GA
IFS
IQ>G
AI
FSIQ
<GA
IFS
IQ>G
AI
FSIQ
<GA
IFS
IQ>G
AI
Am
ount
of
Dis
crep
ancy
(-)
(+)
(-)
(+)
(-)
(+)
(-)
(+)
(-)
(+)
(-)
(+)
(-)
(+)
(-)
(+)
Dis
crep
ancy
Tab
le 4
C
um
ula
tive
Per
centa
ges
of
Var
ious
Sp
ecia
l G
roup
Sam
ple
s (B
ase
Rat
es)
Ob
tain
ing V
ario
us
FS
IQ–G
AI
Sco
re D
iscr
epan
cies
18
0.0
0.0
0.0
0.0
0.0
0.0
0.0
0.0
0.0
0.0
0.0
0.0
0.0
0.0
0.0
0.0
18
17
1.7
0.0
0.0
0.0
0.0
0.0
0.0
0.0
0.0
0.0
0.0
0.0
0.0
0.0
0.0
0.0
17
16
3.3
0.0
0.0
0.0
0.0
0.0
0.0
0.0
0.0
0.0
0.0
0.0
0.0
0.0
0.0
0.0
16
15
3.3
0.0
0.0
0.0
0.0
0.0
0.0
0.0
0.0
0.0
0.0
0.0
0.0
0.0
0.0
0.0
15
14
3.3
0.0
0.0
0.0
0.0
0.0
3.8
0.0
0.0
0.0
0.0
0.0
0.0
0.0
4.9
0.0
14
13
3.3
0.0
0.0
0.0
2.1
0.0
3.8
1.9
0.0
0.0
0.0
0.0
0.0
0.0
7.3
0.0
13
12
5.0
0.0
0.0
0.0
2.1
0.0
3.8
1.9
9.4
0.0
0.0
0.0
0.0
2.6
17
.10
.01
2
11
8.3
0.0
0.0
0.0
2.1
0.0
5.7
1.9
9.4
0.0
0.0
0.0
0.0
2.6
22
.00
.01
1
10
13
.30
.01
.80
.02
.12
.17
.51
.99
.40
.00
.00
.02
.62
.62
4.4
0.0
10
91
5.0
0.0
3.6
0.0
2.1
4.2
9.4
1.9
18
.80
.03
.30
.01
0.5
2.6
24
.42
.49
82
0.0
0.0
7.1
3.6
2.1
6.3
22
.63
.82
1.9
0.0
13
.30
.01
5.8
2.6
31
.72
.48
72
5.0
0.0
10
.77
.12
.18
.33
7.7
5.7
28
.10
.02
0.0
0.0
18
.42
.63
4.1
4.9
7
63
1.7
0.0
14
.31
7.9
2.1
14
.64
7.2
5.7
43
.80
.02
6.7
3.3
26
.32
.64
1.5
7.3
6
54
0.0
0.0
16
.12
5.0
2.1
22
.95
0.9
7.5
53
.13
.13
3.3
6.7
39
.55
.34
3.9
9.8
5
44
3.3
6.7
17
.93
3.9
2.1
25
.05
6.6
9.4
65
.66
.33
6.7
10
.04
4.7
10
.54
6.3
9.8
4
35
3.3
13
.32
5.0
50
.04
.22
9.2
64
.21
3.2
68
.86
.34
6.7
16
.75
5.3
15
.86
1.0
14
.63
26
5.0
20
.03
3.9
51
.84
.23
9.6
66
.01
5.1
71
.99
.45
3.3
23
.36
5.8
15
.86
8.3
17
.12
16
8.3
25
.03
7.5
57
.16
.35
4.2
75
.51
7.0
84
.41
2.5
56
.73
0.0
71
.12
6.3
73
.22
2.0
1
Mea
n5
.92
.64
.54
.35
.73
.86
.05
.15
.73
.05
.13
.04
.93
.56
.84
.1M
ean
SD3
.91
.12
.81
.96
.42
.73
.23
.73
.31
.82
.51
.72
.73
.34
.32
.8SD
Med
ian
5.0
3.0
3.0
4.0
3.0
3.0
6.5
4.0
6.0
3.0
5.0
3.0
5.0
3.0
6.0
3.0
Med
ian
Not
e.G
T =
In
telle
ctu
ally
Gif
ted
; MR
Mild
= M
enta
l Ret
ard
atio
n-M
ild S
ever
ity;
MR
Mo
d =
Men
tal R
etar
dat
ion
-Mo
der
ate
Seve
rity
; RD
= R
ead
ing
Dis
ord
er; R
WD
= R
ead
ing
and
Wri
tten
Exp
ress
ion
Dis
ord
ers;
MD
= M
ath
emat
ics
Dis
ord
er; R
WM
D =
Rea
din
g, W
ritt
en E
xpre
ssio
n, a
nd
Mat
hem
atic
s D
iso
rder
s; L
D/A
DH
D =
Lea
rnin
g D
iso
rder
an
d A
tten
tio
n-D
efic
it/H
yper
acti
vity
Dis
ord
er.
05WISC4 Tech Rept 4-R2.qxd 3/7/05 9:36 AM Page 8
Copyright © 2008 by Pearson Education, Inc. or its affiliate(s). All rights reserved.

9
AD
HD (N
= 89
)EL
D (N
= 27
)RE
LD (N
= 41
)O
HI (N
= 16
)CH
I (N
= 27
)A
UT (N
= 19
)A
SP (N
= 27
)M
I (N
= 21
)
Clin
ical
Gro
up
Am
ount
of
FSIQ
<GA
IFS
IQ>G
AI
FSIQ
<GA
IFS
IQ>G
AI
FSIQ
<GA
IFS
IQ>G
AI
FSIQ
<GA
IFS
IQ>G
AI
FSIQ
<GA
IFS
IQ>G
AI
FSIQ
<GA
IFS
IQ>G
AI
FSIQ
<GA
IFS
IQ>G
AI
FSIQ
<GA
IFS
IQ>G
AI
Am
ount
of
Dis
crep
ancy
(-)
(+)
(-)
(+)
(-)
(+)
(-)
(+)
(-)
(+)
(-)
(+)
(-)
(+)
(-)
(+)
Dis
crep
ancy
Tab
le 4
Cum
ula
tive
Per
centa
ges
of
Var
ious
Sp
ecia
l G
roup
Sam
ple
s (B
ase
Rat
es)
Ob
tain
ing V
ario
us
FS
IQ–G
AI
Sco
re D
iscr
epan
cies
(co
nti
nued
)
18
0.0
0.0
0.0
0.0
0.0
0.0
0.0
0.0
0.0
0.0
0.0
0.0
8.3
0.0
0.0
0.0
18
17
0.0
0.0
0.0
0.0
0.0
0.0
0.0
0.0
0.0
0.0
0.0
0.0
8.3
0.0
0.0
0.0
17
16
0.0
0.0
0.0
0.0
0.0
0.0
0.0
0.0
0.0
0.0
0.0
0.0
8.3
0.0
0.0
0.0
16
15
0.0
0.0
0.0
0.0
0.0
0.0
0.0
0.0
0.0
0.0
5.9
0.0
12
.50
.00
.00
.01
5
14
1.2
0.0
0.0
0.0
0.0
0.0
0.0
0.0
0.0
0.0
17
.60
.01
2.5
0.0
0.0
0.0
14
13
1.2
1.2
0.0
0.0
2.6
0.0
7.1
0.0
0.0
0.0
17
.60
.01
6.7
0.0
0.0
0.0
13
12
1.2
1.2
0.0
0.0
7.9
0.0
7.1
0.0
0.0
0.0
17
.60
.02
9.2
0.0
5.6
0.0
12
11
2.4
1.2
0.0
0.0
7.9
0.0
7.1
0.0
0.0
0.0
29
.40
.02
9.2
4.2
5.6
0.0
11
10
6.1
1.2
0.0
0.0
7.9
0.0
14
.30
.04
.00
.02
9.4
0.0
37
.54
.25
.60
.01
0
99
.81
.24
.50
.01
8.4
0.0
14
.30
.04
.00
.04
7.1
0.0
41
.74
.21
1.1
0.0
9
81
7.1
1.2
9.1
0.0
23
.70
.02
1.4
0.0
8.0
0.0
52
.90
.04
5.8
4.2
22
.20
.08
71
9.5
1.2
9.1
0.0
28
.92
.62
8.6
0.0
8.0
0.0
58
.80
.05
8.3
4.2
27
.80
.07
63
0.5
4.9
18
.20
.03
4.2
5.3
42
.90
.03
2.0
0.0
58
.80
.05
8.3
8.3
33
.30
.06
53
5.4
4.9
31
.80
.04
4.7
10
.54
2.9
0.0
40
.00
.06
4.7
0.0
62
.51
2.5
55
.60
.05
43
9.0
7.3
50
.09
.15
0.0
10
.55
0.0
0.0
48
.04
.07
0.6
0.0
70
.81
2.5
55
.60
.04
34
5.1
9.8
54
.59
.16
0.5
15
.85
0.0
0.0
52
.04
.07
6.5
0.0
79
.21
2.5
72
.25
.63
25
4.9
17
.16
8.2
13
.66
5.8
21
.15
7.1
0.0
64
.08
.07
6.5
0.0
79
.21
2.5
88
.95
.62
16
5.9
20
.77
7.3
13
.67
1.1
23
.77
1.4
0.0
72
.01
2.0
76
.55
.98
7.5
12
.58
8.9
11
.11
Mea
n5
.03
.54
.23
.36
.03
.85
.84
.62
.39
.21
.08
.57
.35
.32
.0M
ean
SD3
.23
.02
.31
.23
.42
.03
.92
.51
.53
.85
.13
.22
.91
.4SD
Med
ian
5.0
2.0
4.0
4.0
5.0
3.0
6.0
5.0
2.0
9.0
1.0
8.0
6.0
5.0
2.0
Med
ian
Not
e. A
DH
D =
Att
enti
on
-Def
icit
/Hyp
erac
tivi
ty D
iso
rder
; ELD
= E
xpre
ssiv
e La
ngu
age
Dis
ord
er; R
ELD
= M
ixed
Rec
epti
ve-E
xpre
ssiv
e La
ngu
age
Dis
ord
er; O
HI
= O
pen
Hea
d I
nju
ry; C
HI
= C
lose
d H
ead
In
jury
;A
UT
= A
uti
stic
Dis
ord
er; A
SP =
Asp
erge
r's
Dis
ord
er; M
I =
Mo
tor
Imp
airm
ent.
05WISC4 Tech Rept 4-R2.qxd 3/7/05 9:36 AM Page 9
Copyright © 2008 by Pearson Education, Inc. or its affiliate(s). All rights reserved.

10
The GAI is an age-corrected standard score. It can beinterpreted similarly to other composite scores, as outlined in
chapter 6 of the WISC–IV Technical and Interpretive Manual(Wechsler, 2003).
Age-based percentile ranks are provided for the GAI thatindicate a child’s standing relative to other children the sameage. Percentile ranks reflect points on a scale at or below whicha given percentage of scores lie, based on the standardization
sample. The percentile ranks for the GAI are interpreted as areother percentile ranks, as described in chapter 6 of the WISC–IVTechnical and Interpretive Manual (Wechsler, 2003).
Reporting and Describing the GAI
Suggested Procedure for Basic Interpretationof the GAI
Standard Score
Percentile Rank
Standard Error of Measurementand Confidence Interval
Descriptive Classification
Evaluate the Overall Composite Scores
The FSIQ and the GAI are composite scores that shouldalways be evaluated in the context of the subtests thatcontribute to that composite score. Extreme variability withinthe subtests that comprise the FSIQ or the GAI indicates thatthe score represents a summary of diverse abilities.
Practitioners should examine closely the relative performanceon subtests that contribute to the composite score wheninterpreting that score. Part of the decision to use the GAI alsotypically involves reviewing the discrepancies among the fourindex scores.
The first step in performing a pairwise comparison is aimedat determining whether the absolute value of the scoredifference is significant. Table 2 provides the minimumdifferences between the FSIQ and the GAI required forstatistical significance (critical values) at the .15 and .05 levelsof confidence by age group. When the absolute value of theobtained difference between the FSIQ and the GAI is equal to
or larger than the critical value, the difference is considered atrue difference rather than a difference due to measurementerror or random fluctuation. If the two scores are notsignificantly different, this implies that reducing the influenceof working memory and processing speed on the estimate ofoverall ability resulted in little difference.
Evaluate the FSIQ–GAI Discrepancy
Note that this procedure is supplemental and does notreplace any portion of the 10-step procedure outlined in
chapter 6 of the WISC–IV Technical and Interpretive Manual(Wechsler, 2003).
Scores on measures of cognitive ability are based onobservational data and represent estimates of a child’s truescores. They reflect a child’s true abilities combined with somedegree of measurement error. Confidence intervals provideanother means of expressing score precision and serve as a
reminder that measurement error is inherent in all scores. Referto chapter 6 of the WISC–IV Technical and Interpretive Manual(Wechsler, 2003) for additional information about confidenceintervals and their use in interpretation.
Composite scores, including the GAI, can be described inqualitative terms according to the child’s level of performance.Refer to chapter 6 of the WISC–IV Technical and Interpretive
Manual (Wechsler, 2003) for qualitative descriptions of theWISC–IV composite scores, which also may be used to describethe GAI.
05WISC4 Tech Rept 4-R2.qxd 3/7/05 9:36 AM Page 10
Copyright © 2008 by Pearson Education, Inc. or its affiliate(s). All rights reserved.

11
Predicted-Difference Method
If comparison of the FSIQ and the GAI indicates a significantdifference, the practitioner should then judge how rare thedifference is in the general population. Table 3 provides thecumulative frequency of discrepancies between the FSIQ andthe GAI in the WISC–IV standardization sample (base rates).The base rate provides a basis for estimating how rare or
common a child’s obtained score difference is compared to thegeneral population. Table 4 provides the cumulative frequencyof discrepancies between the FSIQ and the GAI in variousWISC–IV special group samples. Refer to chapter 6 of theWISC–IV Technical and Interpretive Manual (Wechsler, 2003)for additional information.
When ability–achievement discrepancy assessment ispresent as part of the learning disability determinationprocess, there are two methods for comparing intellectualability and academic achievement: the predicted-differencemethod and the simple-difference method. Although bothmethods are used, the predicted-difference method isgenerally preferred because the formula accounts for thereliabilities and the correlations between the two measures.Use of the predicted-difference method requires that the
ability and achievement measure were co-normed on the samenational sample. The predicted-difference method uses theability score to predict an achievement score, and thencompares the predicted and observed achievement scores. The simple-difference method merely compares the observedability and achievement scores. The WIAT–II Examiner’sManual (Pearson Education , Inc., 2002) provides additionaldetails related to the rationale for choosing these methods andthe statistical procedures involved.
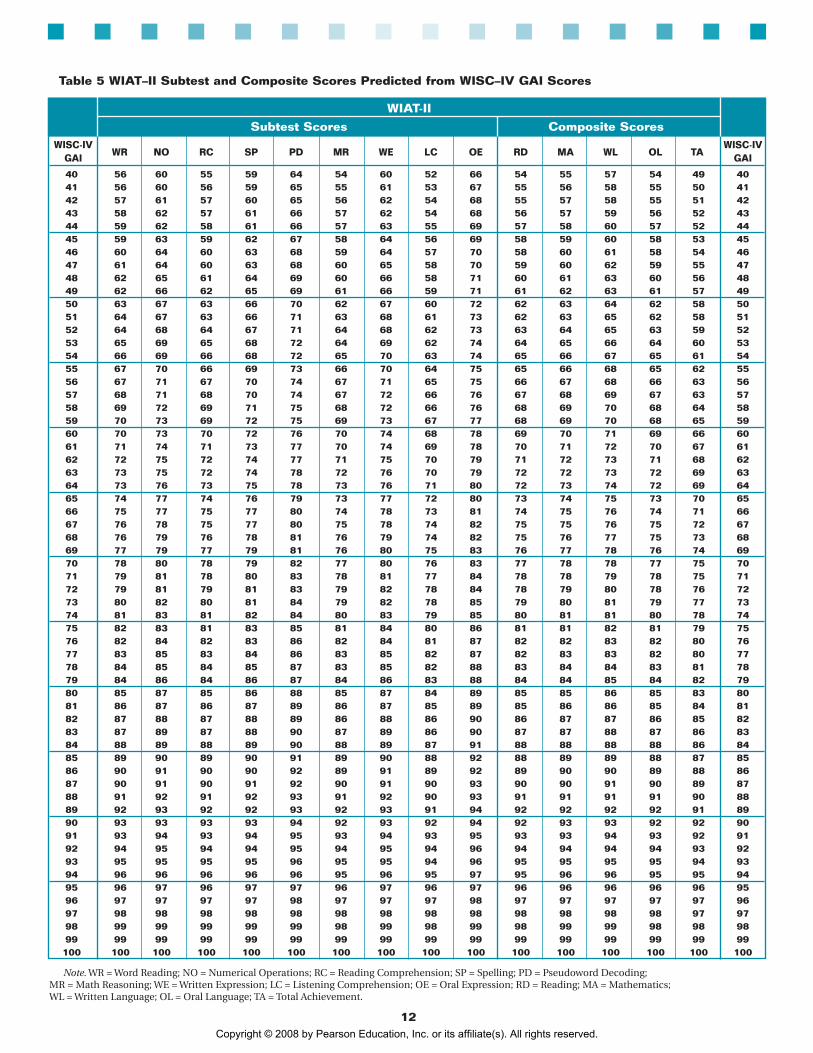
Table 5 provides WIAT–II subtest and composite scorespredicted from WISC–IV GAI scores. Locate the GAI score in theextreme left or right column, and read across the row to obtainthe child’s predicted WIAT–II subtest and composite scores.
Record the predicted scores. For each subtest or composite,subtract the child’s predicted score from the obtained score toobtain the difference score. Record these difference scores.
Ability–Achievement Discrepancy
05WISC4 Tech Rept 4-R2.qxd 3/7/05 9:36 AM Page 11
Copyright © 2008 by Pearson Education, Inc. or its affiliate(s). All rights reserved.
12
WISC-IVWR NO RC SP PD MR WE LC OE RD MA WL OL TA
WISC-IVGAI GAI
40 56 60 55 59 64 54 60 52 66 54 55 57 54 49 4041 56 60 56 59 65 55 61 53 67 55 56 58 55 50 4142 57 61 57 60 65 56 62 54 68 55 57 58 55 51 4243 58 62 57 61 66 57 62 54 68 56 57 59 56 52 4344 59 62 58 61 66 57 63 55 69 57 58 60 57 52 4445 59 63 59 62 67 58 64 56 69 58 59 60 58 53 4546 60 64 60 63 68 59 64 57 70 58 60 61 58 54 4647 61 64 60 63 68 60 65 58 70 59 60 62 59 55 4748 62 65 61 64 69 60 66 58 71 60 61 63 60 56 4849 62 66 62 65 69 61 66 59 71 61 62 63 61 57 4950 63 67 63 66 70 62 67 60 72 62 63 64 62 58 5051 64 67 63 66 71 63 68 61 73 62 63 65 62 58 5152 64 68 64 67 71 64 68 62 73 63 64 65 63 59 5253 65 69 65 68 72 64 69 62 74 64 65 66 64 60 5354 66 69 66 68 72 65 70 63 74 65 66 67 65 61 5455 67 70 66 69 73 66 70 64 75 65 66 68 65 62 5556 67 71 67 70 74 67 71 65 75 66 67 68 66 63 5657 68 71 68 70 74 67 72 66 76 67 68 69 67 63 5758 69 72 69 71 75 68 72 66 76 68 69 70 68 64 5859 70 73 69 72 75 69 73 67 77 68 69 70 68 65 5960 70 73 70 72 76 70 74 68 78 69 70 71 69 66 6061 71 74 71 73 77 70 74 69 78 70 71 72 70 67 6162 72 75 72 74 77 71 75 70 79 71 72 73 71 68 6263 73 75 72 74 78 72 76 70 79 72 72 73 72 69 6364 73 76 73 75 78 73 76 71 80 72 73 74 72 69 6465 74 77 74 76 79 73 77 72 80 73 74 75 73 70 6566 75 77 75 77 80 74 78 73 81 74 75 76 74 71 6667 76 78 75 77 80 75 78 74 82 75 75 76 75 72 6768 76 79 76 78 81 76 79 74 82 75 76 77 75 73 6869 77 79 77 79 81 76 80 75 83 76 77 78 76 74 6970 78 80 78 79 82 77 80 76 83 77 78 78 77 75 7071 79 81 78 80 83 78 81 77 84 78 78 79 78 75 7172 79 81 79 81 83 79 82 78 84 78 79 80 78 76 7273 80 82 80 81 84 79 82 78 85 79 80 81 79 77 7374 81 83 81 82 84 80 83 79 85 80 81 81 80 78 7475 82 83 81 83 85 81 84 80 86 81 81 82 81 79 7576 82 84 82 83 86 82 84 81 87 82 82 83 82 80 7677 83 85 83 84 86 83 85 82 87 82 83 83 82 80 7778 84 85 84 85 87 83 85 82 88 83 84 84 83 81 7879 84 86 84 86 87 84 86 83 88 84 84 85 84 82 7980 85 87 85 86 88 85 87 84 89 85 85 86 85 83 8081 86 87 86 87 89 86 87 85 89 85 86 86 85 84 8182 87 88 87 88 89 86 88 86 90 86 87 87 86 85 8283 87 89 87 88 90 87 89 86 90 87 87 88 87 86 8384 88 89 88 89 90 88 89 87 91 88 88 88 88 86 8485 89 90 89 90 91 89 90 88 92 88 89 89 88 87 8586 90 91 90 90 92 89 91 89 92 89 90 90 89 88 8687 90 91 90 91 92 90 91 90 93 90 90 91 90 89 8788 91 92 91 92 93 91 92 90 93 91 91 91 91 90 8889 92 93 92 92 93 92 93 91 94 92 92 92 92 91 8990 93 93 93 93 94 92 93 92 94 92 93 93 92 92 9091 93 94 93 94 95 93 94 93 95 93 93 94 93 92 9192 94 95 94 94 95 94 95 94 96 94 94 94 94 93 9293 95 95 95 95 96 95 95 94 96 95 95 95 95 94 9394 96 96 96 96 96 95 96 95 97 95 96 96 95 95 9495 96 97 96 97 97 96 97 96 97 96 96 96 96 96 9596 97 97 97 97 98 97 97 97 98 97 97 97 97 97 9697 98 98 98 98 98 98 98 98 98 98 98 98 98 97 9798 99 99 99 99 99 98 99 98 99 98 99 99 98 98 9899 99 99 99 99 99 99 99 99 99 99 99 99 99 99 99
100 100 100 100 100 100 100 100 100 100 100 100 100 100 100 100
WIAT-II
Subtest Scores Composite Scores
Table 5 WIAT–II Subtest and Composite Scores Predicted from WISC–IV GAI Scores
Note. WR = Word Reading; NO = Numerical Operations; RC = Reading Comprehension; SP = Spelling; PD = Pseudoword Decoding; MR = Math Reasoning; WE = Written Expression; LC = Listening Comprehension; OE = Oral Expression; RD = Reading; MA = Mathematics; WL = Written Language; OL = Oral Language; TA = Total Achievement.
05WISC4 Tech Rept 4-R2.qxd 3/7/05 9:36 AM Page 12
Copyright © 2008 by Pearson Education, Inc. or its affiliate(s). All rights reserved.

13
WISC-IVWR NO RC SP PD MR WE LC OE RD MA WL OL TA
WISC-IVGAI GAI
101 101 101 101 101 101 101 101 101 101 101 101 101 101 101 101102 101 101 102 101 101 102 101 102 101 102 102 101 102 102 102103 102 102 102 102 102 102 102 102 102 102 102 102 102 103 103104 103 103 103 103 102 103 103 103 102 103 103 103 103 103 104105 104 103 104 103 103 104 103 104 103 104 104 104 104 104 105106 104 104 105 104 104 105 104 105 103 105 105 104 105 105 106107 105 105 105 105 104 105 105 106 104 105 105 105 105 106 107108 106 105 106 106 105 106 105 106 104 106 106 106 106 107 108109 107 106 107 106 105 107 106 107 105 107 107 106 107 108 109110 107 107 108 107 106 108 107 108 106 108 108 107 108 109 110111 108 107 108 108 107 108 107 109 106 108 108 108 108 109 111112 109 108 109 108 107 109 108 110 107 109 109 109 109 110 112113 110 109 110 109 108 110 109 110 107 110 110 109 110 111 113114 110 109 111 110 108 111 109 111 108 111 111 110 111 112 114115 111 110 111 110 109 111 110 112 108 112 111 111 112 113 115116 112 111 112 111 110 112 111 113 109 112 112 112 112 114 116117 113 111 113 112 110 113 111 114 110 113 113 112 113 114 117118 113 112 114 112 111 114 112 114 110 114 114 113 114 115 118119 114 113 114 113 111 114 113 115 111 115 114 114 115 116 119120 115 113 115 114 112 115 113 116 111 115 115 114 115 117 120121 116 114 116 114 113 116 114 117 112 116 116 115 116 118 121122 116 115 117 115 113 117 115 118 112 117 117 116 117 119 122123 117 115 117 116 114 117 115 118 113 118 117 117 118 120 123124 118 116 118 117 114 118 116 119 113 118 118 117 118 120 124125 119 117 119 117 115 119 117 120 114 119 119 118 119 121 125126 119 117 120 118 116 120 117 121 115 120 120 119 120 122 126127 120 118 120 119 116 121 118 122 115 121 120 119 121 123 127128 121 119 121 119 117 121 118 122 116 122 121 120 122 124 128129 121 119 122 120 117 122 119 123 116 122 122 121 122 125 129130 122 120 123 121 118 123 120 124 117 123 123 122 123 126 130131 123 121 123 121 119 124 120 125 117 124 123 122 124 126 131132 124 121 124 122 119 124 121 126 118 125 124 123 125 127 132133 124 122 125 123 120 125 122 126 118 125 125 124 125 128 133134 125 123 126 123 120 126 122 127 119 126 126 124 126 129 134135 126 123 126 124 121 127 123 128 120 127 126 125 127 130 135136 127 124 127 125 122 127 124 129 120 128 127 126 128 131 136137 127 125 128 126 122 128 124 130 121 128 128 127 128 131 137138 128 125 129 126 123 129 125 130 121 129 129 127 129 132 138139 129 126 129 127 123 130 126 131 122 130 129 128 130 133 139140 130 127 130 128 124 130 126 132 122 131 130 129 131 134 140141 130 127 131 128 125 131 127 133 123 132 131 130 132 135 141142 131 128 132 129 125 132 128 134 124 132 132 130 132 136 142143 132 129 132 130 126 133 128 134 124 133 132 131 133 137 143144 133 129 133 130 126 133 129 135 125 134 133 132 134 137 144145 133 130 134 131 127 134 130 136 125 135 134 132 135 138 145146 134 131 135 132 128 135 130 137 126 135 135 133 135 139 146147 135 131 135 132 128 136 131 138 126 136 135 134 136 140 147148 136 132 136 133 129 136 132 138 127 137 136 135 137 141 148149 136 133 137 134 129 137 132 139 127 138 137 135 138 142 149150 137 134 138 135 130 138 133 140 128 139 138 136 139 143 150151 138 134 138 135 131 139 134 141 129 139 138 137 139 143 151152 138 135 139 136 131 140 134 142 129 140 139 137 140 144 152153 139 136 140 137 132 140 135 142 130 141 140 138 141 145 153154 140 136 141 137 132 141 136 143 130 142 141 139 142 146 154155 141 137 141 138 133 142 136 144 131 142 141 140 142 147 155156 141 138 142 139 134 143 137 145 131 143 142 140 143 148 156157 142 138 143 139 134 143 138 146 132 144 143 141 144 148 157158 143 139 144 140 135 144 138 146 132 145 144 142 145 149 158159 144 140 144 141 135 145 139 147 133 145 144 142 145 150 159160 144 140 145 141 136 146 140 148 134 146 145 143 146 151 160
Table 5 WIAT–II Subtest and Composite Scores Predicted from WISC–IV GAI Scores (continued)
Note. WR = Word Reading; NO = Numerical Operations; RC = Reading Comprehension; SP = Spelling; PD = Pseudoword Decoding; MR = Math Reasoning; WE = Written Expression; LC = Listening Comprehension; OE = Oral Expression; RD = Reading; MA = Mathematics; WL = Written Language; OL = Oral Language; TA = Total Achievement.
WIAT-II
Subtest Scores Composite Scores
05WISC4 Tech Rept 4-R2.qxd 3/7/05 9:36 AM Page 13
Copyright © 2008 by Pearson Education, Inc. or its affiliate(s). All rights reserved.

14
The practitioner must take into account the statisticalsignificance and the base rate of the difference scores. Table 6provides the required differences between the predicted andobtained WIAT–II subtest and composite scores to attainstatistical significance (critical values) at the .05 and .01 levelsfor two age groups (ages 6:0–11:11 and ages 12:0–16:11). Selectthe desired level of statistical significance and note it for yourrecords. Using Table 6, find the age group of the child and the
desired level of significance. For each subtest or composite,read across the row to the appropriate column to determine thecritical value, and record it. The absolute value of the child’sdifference score must equal or exceed that critical value to bestatistically significant. Determine whether or not the absolutevalue of the child’s difference score equals or exceeds thecorresponding critical value.
Table 6 Differences Between Predicted and Obtained WIAT–II Subtest and Composite Scores Required forStatistical Significance (Critical Values): Predicted-Difference Method Using WISC–IV GAI
Subtest/Composite Significance Level Ages 6–11 Ages 12–16
Word Reading .05 5 7
.01 6 9
Numerical Operations .05 12 9
.01 16 11
Reading Comprehension .05 7 8
.01 9 10
Spelling .05 8 8
.01 11 11
Pseudoword Decoding .05 5 6
.01 7 8
Math Reasoning .05 9 9
.01 12 12
Written Expression .05 11 12
.01 15 15
Listening Comprehension .05 13 13
.01 17 18
Oral Expression .05 10 12
.01 13 15
Reading .05 5 6
.01 7 7
Mathematics .05 9 7
.01 12 9
Written Language .05 8 11
.01 11 14
Oral Language .05 10 9
.01 13 11
Total .05 6 6
.01 8 8
05WISC4 Tech Rept 4-R2.qxd 3/7/05 9:36 AM Page 14
Copyright © 2008 by Pearson Education, Inc. or its affiliate(s). All rights reserved.

15
If comparison of the predicted and obtained WIAT–IIsubtest and composite scores indicates a significantdifference, the practitioner should then judge how rare thedifference is in the general population. Table 7 provides thecumulative frequency of discrepancies between the predictedand obtained WIAT–II subtest and composite scores in theWISC–IV standardization sample (base rate). Locate the
subtest or composite of interest in the extreme left column,and read across the row to locate the child’s difference score.The column header above the child’s difference scoreindicates the percentage of the theoretical normal distribution(base rates) that represents the percentage of the sample thatobtained WIAT–II scores lower than their WISC–IV GAI scoresby the specified amount or more.
Table 7 Differences Between Predicted and Obtained WIAT–II Subtest and Composite Scores for VariousPercentages of the Theoretical Normal Distribution (Base Rates): Predicted-Difference Method UsingWISC–IV GAI
Subtest/Composite 25 20 15 10 5 4 3 2 1
Word Reading 7 9 11 13 17 18 19 21 24
Numerical Operations 8 10 12 15 19 20 21 23 26
Reading Comprehension 7 9 11 13 17 18 19 21 24
Spelling 8 10 12 14 18 20 21 23 26
Pseudoword Decoding 9 11 13 16 20 22 23 25 28
Math Reasoning 7 9 11 13 17 18 19 21 23
Written Expression 8 10 12 15 19 20 22 24 27
Listening Comprehension 7 8 10 12 15 16 17 19 21
Oral Expression 9 11 13 16 21 22 24 26 29
Reading 7 9 10 13 16 17 19 20 23
Mathematics 7 9 11 13 17 18 19 21 24
Written Language 8 9 11 14 18 19 20 22 25
Oral Language 7 9 10 13 16 17 19 20 23
Total 6 7 9 11 13 14 15 17 19
Note. Percentages in Table 7 represent the theoretical proportion of WIAT–II scores lower than WISC–IV GAI scores by the specified amount or more.
Percentages of the Theoretical Normal Distribution (Base Rates)
05WISC4 Tech Rept 4-R2.qxd 3/7/05 9:36 AM Page 15
Copyright © 2008 by Pearson Education, Inc. or its affiliate(s). All rights reserved.

16
Table 8 provides the required differences between WISC–IVGAI scores and WIAT–II subtest and composite scores to attainstatistical significance (critical values) at the .05 and .01 levelsfor two age groups (ages 6:0–11:11 and ages 12:0–16:11). Selectthe desired level of statistical significance and note it for yourrecords. Using Table 8, find the age group of the child and thedesired level of significance. For each subtest or composite,
read across the row to the appropriate column to determine thecritical value, and record it. The absolute value of the child’sdifference score must equal or exceed that critical value to bestatistically significant. Determine whether or not the absolutevalue of the child’s difference score equals or exceeds thecorresponding critical value.
Simple-Difference Method
Table 8 Differences Between WISC–IV GAI Scores and WIAT–II Subtest and Composite Scores Required forStatistical Significance (Critical Values): Simple-Difference Method, by Age Group
Ages 6–11 Ages 12–16Subtest/Composite Significance Level
GAI GAI
Word Reading .05 7 8
.01 9 11
Numerical Operations .05 13 10
.01 17 13
Reading Comprehension .05 8 9
.01 11 12
Spelling .05 10 10
.01 13 13
Pseudoword Decoding .05 8 8
.01 10 10
Math Reasoning .05 10 10
.01 13 13
Written Expression .05 12 12
.01 16 16
Listening Comprehension .05 14 14
.01 18 19
Oral Expression .05 12 13
.01 15 17
Reading .05 7 7
.01 9 9
Mathematics .05 10 8
.01 13 11
Written Language .05 10 12
.01 13 15
Oral Language .05 11 10
.01 14 13
Total .05 8 7
.01 10 9
05WISC4 Tech Rept 4-R2.qxd 3/7/05 9:36 AM Page 16
Copyright © 2008 by Pearson Education, Inc. or its affiliate(s). All rights reserved.

17
If comparison of the WISC–IV GAI score and the WIAT–IIsubtest and composite scores indicates a significant difference,the practitioner should then judge how rare the difference is inthe general population. Table 9 provides the cumulativefrequency of discrepancies between the WISC–IV GAI andWIAT–II subtest and composite scores in the WISC–IVstandardization sample (base rates). Locate the subtest or
composite of interest in the extreme left column, and readacross the row to locate the child’s difference score. The columnheader above the child’s difference score indicates thepercentage of the theoretical normal distribution (base rate)that represents the percentage of the sample that obtainedWIAT–II scores lower than their WISC–IV GAI scores by thespecified amount or more.
Table 9 Differences Between WISC–IV GAI Scores and WIAT–II Subtest and Composite Scores for VariousPercentages of the Theoretical Normal Distribution (Base Rates): Simple-Difference Method
Subtest/Composite 25 20 15 10 5 4 3 2 1
Word Reading 8 10 12 14 18 19 21 23 26
Numerical Operations 9 11 13 16 21 22 23 26 29
Reading Comprehension 8 9 11 14 18 19 20 22 25
Spelling 8 10 13 16 20 21 23 25 28
Pseudoword Decoding 10 12 14 18 23 24 26 28 32
Math Reasoning 8 9 11 14 18 19 20 22 25
Written Expression 9 11 13 16 21 22 24 26 29
Listening Comprehension 7 8 10 13 16 17 18 20 23
Oral Expression 10 12 15 19 24 25 27 29 33
Reading 7 9 11 14 17 18 20 21 24
Mathematics 8 9 11 14 18 19 20 22 25
Written Language 8 10 12 15 19 20 22 24 27
Oral Language 7 9 11 14 17 18 20 21 24
Total 6 7 9 11 14 15 16 17 20
Note. Percentages in Table 9 represent the theoretical proportion of WIAT–II scores lower than WISC–IV GAI scores by the specified amount or more.
Percentage of Theoretical Normal Distribution (Base Rates)
This technical report has provided an overview of the GAI,historical context for the development of the GAI, andrecommended procedures for determining and interpreting theGAI. This report also has provided recommended proceduresfor the use of the GAI in ability–achievement comparisons. TheGAI provides important information regarding a child’scognitive functioning, but it should never be interpreted inisolation. It is best interpreted in conjunction with a thoroughhistory and careful clinical observations of the child. Many
additional sources of information are typically available to thepractitioner: medical, educational, and psychosocial historygathered from both the child and collateral informants, whenappropriate; direct behavioral observations; previous testscores; qualitative aspects of test performance; and results fromother relevant instruments given in a battery. In addition, thepractitioner should evaluate results within the context of thereferral question or purpose of the evaluation.
Conclusion
05WISC4 Tech Rept 4-R2.qxd 3/7/05 9:36 AM Page 17
Copyright © 2008 by Pearson Education, Inc. or its affiliate(s). All rights reserved.

18
Berninger, V. W., Dunn, A., & Alper, T. (2005). Integratedmultilevel model for branching assessment, instructionalassessment, and profile assessment. In A. Prifitera, D. H.Saklofske, & L. G. Weiss (Eds.), WISC–IV clinical use and interpretation: Scientist-practitioner perspectives(pp. 151–185). New York: Academic Press.
Berninger, V. W., & O’Donnell, L. (2005). Research-supporteddifferential diagnosis of specific learning disabilities. InA. Prifitera, D. H. Saklofske, & L. G. Weiss (Eds.), WISC–IVclinical use and interpretation: Scientist-practitionerperspectives (pp. 189–233). New York: Academic Press.
Colom, R., Rebollo, I., Palacios, A., Juan-Espinosa, M., &Kyllonen, P. C. (2004). Working memory is (almost)perfectly predicted by g. Intelligence, 32, 277–296.
Dumont, R., & Willis, J. (2004). Use of the Tellegen and Briggsformula to determine the Dumont-Willis Indexes for theWISC–IV. Retrieved December 1, 2004 fromhttp://alpha.fdu.edu/psychology/WISCIV_DWI.htm
Engle, R. W., Laughlin, J. E., Tuholski, S. W., & Conway, A. R. A.(1999). Working memory, short-term memory, andgeneral fluid intelligence: A latent-variable approach.Journal of Experimental Psychology: General, 128,309–331.
Flanagan, D. P., & Kaufman, A. S. (2004). Essentials of WISC–IVassessment. Hoboken, NJ: Wiley.
Fletcher, J. M., & Reschly, D. J. (2004). Changing procedures foridentifying learning disabilities: The danger ofperpetuating old ideas. Manuscript submitted forpublication.
Fry, A. F., & Hale, S. (1996). Processing speed, working memory,and fluid intelligence: Evidence for a developmentalcascade. Psychological Science, 7, 237–241.
Fry, A. F., & Hale, S. (2000). Relationships among processingspeed, working memory, and fluid intelligence inchildren. Biological Psychology, 54, 1–34.
Hale, J. B., Naglieri, J. A., Kaufman, A. S., & Kavale, K. A. (2004).Specific learning disability classification in the newIndividuals with Disabilities Education Act: The danger ofgood ideas. The School Psychologist, 58, 6–13, 29.
Pearson Education, Inc. (2002). Wechsler IndividualAchievement Test–Second Edition. San Antonio, TX:Author.
Heinz-Martin, S., Oberauer, K., Wittmann, W. W., Wilhelm, O., &Schulze, R. (2002). Working-memory capacity explainsreasoning ability—and a little bit more. Intelligence, 30,261–288.
Individuals with Disabilities Education Improvement Act of2004, Pub. L. No. 108–446, 118 Stat. 328 (2004).
Mackintosh, N. J., & Bennett, E. S. (2003). The fractionation ofworking memory maps onto different components ofintelligence. Intelligence, 31, 519–531.
Miller, L. T., & Vernon, P. A. (1996). Intelligence, reaction time,and working memory in 4- to 6-year-old children.Intelligence, 22, 155–190.
Prifitera, A., Saklofske, D. H., & Weiss, L. G. (Eds.). (2005).WISC–IV clinical use and interpretation: Scientist-practitioner perspectives. New York: Academic Press.
Prifitera, A., Weiss, L. G., & Saklofske, D. H. (1998). The WISC–III in context. In A. Prifitera & D. H. Saklofske(Eds.), WISC–III clinical use and interpretation:Scientist-practitioner perspectives (pp. 1–38). New York:Academic Press.
Saklofske, D. H., Gorsuch, R. L., Weiss, L. G., Zhu, J. J., &Patterson, C. A. (2005). General ability index for theWAIS–III: Canadian norms. Canadian Journal ofBehavioural Science, 37, 44–48.
Saklofske, D. H., Prifitera, A., Weiss, L. G., Rolfhus, E., & Zhu, J.(2005). Clinical interpretation of the WISC–IV FSIQ andGAI. In A. Prifitera, D. H. Saklofske, & L. G. Weiss (Eds.),WISC–IV clinical use and interpretation: Scientist-practitioner perspectives (pp. 33–65). New York: Academic Press.
Sattler J. M. (2001). Assessment of children: Cognitiveapplications (4th ed.). San Diego, CA: Author.
Schweizer, K., & Moosbrugger, H. (2004). Attention and workingmemory as predictors of intelligence. Intelligence, 32,329–347.
Scruggs, T. E., & Mastropieri, M. A. (2002). On babies andbathwater: Addressing the problems of identification oflearning disabilities. Learning Disability Quarterly, 25,155–168.
Tellegen, A., & Briggs, P. (1967). Old wine in new skins:Grouping Wechsler subtests into new scales. Journal ofConsulting Psychology, 31, 499-506.
Tulsky, D. S., Saklofske, D. H., Wilkins, C., & Weiss, L. G. (2001).Development of a general ability index for the WechslerAdult Intelligence Scale—Third Edition. PsychologicalAssessment, 13, 566–571.
Vigil-Colet, A., & Codorniu-Raga, M. J. (2002). How inspectiontime and paper and pencil measures of processing speedare related to intelligence. Personality and IndividualDifferences, 33, 1149–1161.
Wechsler, D. (1949). Wechsler Intelligence Scale for Children.New York: The Psychological Corporation.
Wechsler, D. (1974). Wechsler Intelligence Scale for Children—Revised. San Antonio, TX: The Psychological Corporation.
Wechsler, D. (1991). Wechsler Intelligence Scale for Children—Third Edition. San Antonio, TX: The PsychologicalCorporation.
Wechsler, D. (2003). Wechsler Intelligence Scale forChildren–Fourth Edition. San Antonio, TX: Pearson Education, Inc.
References
05WISC4 Tech Rept 4-R2.qxd 3/7/05 9:36 AM Page 18
Copyright © 2008 by Pearson Education, Inc. or its affiliate(s). All rights reserved.

19
Wechsler, D., Kaplan, E., Fein, D., Kramer, J., Morris, R., Delis,D., & Maerlender, A. (2004). Wechsler Intelligence Scale forChildren–Fourth Edition–Integrated. San Antonio, TX:Pearson Education, Inc.
Weiss, L. G., Saklofske, D. H., Prifitera, A., Chen, H. Y., &Hildebrand, D. K. (1999). The calculation of the WISC–IIIgeneral ability index using Canadian norms. TheCanadian Journal of School Psychology, 14, 1–9.
Williams, P. E., Weiss, L. G., & Rolfhus, E. (2003a). Theoreticalmodel and test blueprint (WISC–IV Technical Report No.1). Retrieved December 8, 2004, fromhttp://pearsonassess.com/hai/Images/pdf/wisciv/WISCIVTechReport1.pdf
Williams, P. E., Weiss, L. G., & Rolfhus, E. (2003b). Psychometricproperties (WISC–IV Technical Report No. 2). RetrievedDecember 8, 2004, from http://pearsonassess.com/hai/Images/pdf/wisciv/WISCIVTechReport2.pdf
Williams, P. E., Weiss, L. G., & Rolfhus, E. (2003c). Clinicalvalidity (WISC–IV Technical Report No. 3). RetrievedDecember 8, 2004, from http://pearsonassess.com/hai/Images/pdf/wisciv/WISCIVTechReport3.pdf
05WISC4 Tech Rept 4-R2.qxd 3/7/05 9:36 AM Page 19
Copyright © 2008 by Pearson Education, Inc. or its affiliate(s). All rights reserved.

20
05WISC4 Tech Rept 4-R2.qxd 3/7/05 9:36 AM Page 20
Copyright © 2008 by Pearson Education, Inc. or its affiliate(s). All rights reserved.
Related Documents


